")
Back to Journals » Journal of Inflammation Research » Volume 13
Protective Effects of Leukadherin1 in a Rat Model of Targeted Experimental Autoimmune Encephalomyelitis (EAE): Possible Role of P47phox and MDA Downregulation
Authors Hemmati S , Sadeghi MA , Yousefi-Manesh H, Eslamiyeh M, Vafaei A , Foroutani L, Donyadideh G, Dehpour A , Rezaei N
Received 22 April 2020
Accepted for publication 22 July 2020
Published 31 July 2020 Volume 2020:13 Pages 411—420
DOI https://doi.org/10.2147/JIR.S258991
Checked for plagiarism Yes
Review by Single anonymous peer review
Peer reviewer comments 2
Editor who approved publication: Professor Ning Quan
Sara Hemmati,1– 3,* Mohammad Amin Sadeghi,1– 3,* Hasan Yousefi-Manesh,2,3 Mostafa Eslamiyeh,4 Ali Vafaei,2,3 Laleh Foroutani,2 Ghazaleh Donyadideh,4 AhmadReza Dehpour,3 Nima Rezaei5– 7
1Molecular Medicine Interest Group (MMIG), Universal Scientific Education and Research Network (USERN), Tehran, Iran; 2School of Medicine, Tehran University of Medical Sciences, Tehran, Iran; 3Experimental Medicine Research Center, Tehran University of Medical Sciences, Tehran, Iran; 4Mashhad University of Medical Sciences, Mashhad, Iran; 5Research Center for Immunodeficiencies, Children’s Medical Center, Tehran University of Medical Sciences, Tehran, Iran; 6Department of Immunology, School of Medicine, Tehran University of Medical Sciences, Tehran, Iran; 7Network of Immunity in Infection, Malignancy and Autoimmunity (NIIMA), Universal Scientific Education and Research Network (USERN), Tehran, Iran
*These authors contributed equally to this work
Correspondence: Nima Rezaei Dr Qarib St, Keshavarz Blvd, Tehran 14194, Iran
Email [email protected]
AhmadReza Dehpour
Department of Pharmacology, School of Medicine, Tehran University of Medical Sciences, Tehran, Iran
Email [email protected]
Background: Reactive oxygen and nitrogen species (ROS and RNS) are involved in pathologic mechanisms underlying demyelination and exacerbation in multiple sclerosis (MS) lesions. P47phox is the most important subunit of an ROS-producing enzyme (NADPH oxidase) which is reportedly upregulated in MS plaques due to the intense activity of infiltrated immune cells and resident microglia. Leukadherin1 is a specific CD11b/CD18 agonist that inhibits signaling and transmigration of inflammatory cells to sites of injury. Based on this mechanism, we evaluated therapeutic effects of leukadherin1 in an animal model of targeted experimental autoimmune encephalomyelitis (EAE) through focal injection of inflammatory cytokines to the spinal cord.
Methods: For model induction, Lewis rats were first immunized with 15μg MOG 1– 125 emulsion. Twenty days later, animals were subjected to stereotaxic injection of IFNγ and TNFα to the specific spinal area (T8). One day after injection, all animals presented EAE clinical signs, and their behaviors were monitored for eight days through open-field locomotion and grid-walking tests. Leukadherin1-treated animals received daily intraperitoneal injections of 1mg/kg of the drug. The specific spinal tissues were extracted on day 5 in order to measure nitric oxide (NO), malon di-aldehyde (MDA), and TNFα concentrations alongside P47phox real-time PCR analysis. In addition, spinal sections were prepared for immunohistochemical (IHC) observation of infiltrated leukocytes and activated microglia.
Results: Leukadherin1 exhibited promising improvements in EAE clinical scores and behavioral tests. Demyelination, CD45+ leukocyte infiltration, and Iba1+ microglia activation were reduced in spinal tissues of leukadherin1-treated animals. Furthermore, P47phox expression levels, MDA, and NO amounts were decreased in treated animals. However, TNFα concentrations did not differ following treatment.
Conclusion: Based on our results, we suggest that leukadherin1 may be used as a novel therapeutic agent in tackling the clinical challenge of multiple sclerosis, especially during the acute phase of the disease. This effect was possibly mediated through decreased leukocyte infiltration and oxidative stress.
Keywords: multiple sclerosis, experimental autoimmune encephalitis, leukadherin1, P47phox, targeted EAE, nitric oxide
Introduction
The progressive loss of neural structure and function observed in multiple sclerosis (MS) is initially mediated through focal infiltration of myelin-autoreactive CD4+ T cells into the central nervous system. Resident microglial cells are also involved in the initial phases of MS lesion formation by presenting antigens and producing inflammatory cytokines such as TNFα.1 The lesions formed in the initial phase are further exacerbated by infiltration of the cellular components of innate immunity, i.e., neutrophils and monocytes.2,3 This exacerbation is mediated by increased inflammatory cytokines and reactive oxygen and nitrogen species (ROS and RNS) that are produced by the infiltrating cells and resident microglia.4,5 As a result, microglial cells function during both the initiation and exacerbation phases of MS lesion. Phagocyte NADPH Oxidase (NOX) is a multi-subunit ROS-generating enzyme complex activated under pathological conditions in activated microglia, neutrophils, and monocytes. Neutrophil Cytosolic Factor 1, also known as P47phox, is the main regulator of the NOX enzyme and is responsible for organizing other NOX subunits for eventual superoxide production.6 Several studies have previously introduced novel therapies based on inhibiting ROS generation through downregulating P47phox expression.7 Inducible nitric oxide synthase (iNOS) is also documented as an important producer of nitric oxide (NO) in the inflammatory milieu of MS. Increased levels of NO (assessed in the forms of nitrite/nitrate) is reported to be correlated with more severe clinical signs in MS patients and animal models.8
Experimental autoimmune encephalomyelitis (EAE) is a common animal model used to study MS. In regular EAE induction, myelin oligodendrocyte peptide (MOG) is emulsified with adjuvant and then injected subcutaneously to initiate the autoimmune reaction. Freund’s adjuvant is injected alongside MOG to enhance the immune response and demyelination. In a modified EAE induction method (targeted EAE induction), the role of microglia for antigen presentation and cytokines secretion is bypassed through direct injection of these factors to the desired area of the spinal cord. Therefore, it becomes possible to observe both the acute initial onset of the disease and the following lesion exacerbation through accurate behavioral tests which have been shown to correlate with lesion severity in previous studies. Moreover, as local structural damages are reflected in the clinical deficits, therapeutic approaches show more specific curative effects in targeted EAE induction models.9
Leukadherin1 is a CD11b/CD18 agonist that is reported to decrease transmigration and leukocyte recruitment in sites of injury.10 This intervention in leukocyte migration is mediated by increasing adhesion of neutrophils and monocytes to the endothelial cells.11 In traumatic patients, leukadherin1 administration could alleviate the endothelial damage through blocking neutrophil transmigration and motility.12 In addition, leukadherin1 has been shown to suppress inflammatory signaling in monocytes.13 According to the previous reports, we hypothesize that leukadherin1 may exhibit therapeutic effects in localized EAE model through reduction of leukocyte infiltration and ROS production. In this study, lesion severity was assessed through behavioral tests alongside histological examination of demyelination. Moreover, immunostaining was performed to assess immune cell infiltration and microglial activation. Relevant molecular alterations were assessed by measuring TNFα, NO, and MDA concentrations in damaged areas. Finally, real-time PCR was conducted to measure P47phox expression as a major player responsible for ROS production.
Materials and Methods
Animals
Female adult Lewis rats weighing 150–200g were provided by the Department of Pharmacology (n=20 for behavioral and n=18 for molecular and histologic studies) in Tehran University of Medical Sciences. Animals were kept in standardized temperature, humidity (60–67%) and 12 h light/dark cycle. They had free access to food and water. All the experiments were in accordance with the guidelines of Tehran University of Medical Sciences and approved by the Animal Ethics Committee.
EAE Induction and Experimental Groups
EAE induction was performed as described by Kerschensteiner et al.9 Briefly, 100μL of recombinant rat MOG 1–125 (Anaspec, USA) emulsion in IFA (Sigma, Germany; in a 1:1 volume ratio containing 15µg MOG 1–125) was injected subcutaneously to the base of the rats’ tails. Control animals received 100μL IFA through the same route. Based on previous reports, 18–20 days are needed until MOG antibodies reach their highest level in the subject’s circulation. On day 20 after immunization, rats were anesthetized using ketamine 100mg/kg and xylazine 10mg/kg and were subjected to stereotaxic injection of a 2μL solution containing 150 U rat IFNγ and 250 ng rat TNFα (Peprotech, USA) to the predetermined area of the spinal cord. T8 vertebra was removed with laminectomy in order to expose the specific segment of spinal cord. Injection was performed in a 5-minute period 400μm lateral to the midline at a depth of 700μm. Starting from the following day, animals were randomly assigned into two groups: a) the leukadherin1-treated animals (EAE + LAD1, n=5) which received daily intraperitoneal injections of 1mg/kg leukadherin1 (Sigma, Germany) solved in 2% DMSO (the effective dose of the drug was selected based on the previous experimental studies);14 and b) the untreated group (EAE, n=5) which received daily doses of equal volumes of intraperitoneal 2% DMSO solution in normal saline. For the control group (Control, n=5), an identical surgical procedure as before was performed to inject saline. As the saline-injected control group showed similar motor behaviors to naïve rats, we did not include the naïve animals in our analyses. In order to rule out any possible effects of leukadherin1 on locomotion behaviors, we also studied a group of naïve animals treated daily with the drug (n=5) which showed no difference with the control group (data not shown). To minimize animal suffering, the paralyzed animals were fed manually.
Clinical EAE scores were evaluated daily by a blind person according to the following scale: 0, without any deficit; 0.5, slight tail and muscle weakness; 1, distinct tail weakness; 1.5, abnormal gait; 2, hind limb paresis; 2.5, hind limb dragging; and 3, complete hind limb paralysis. The targeted EAE induction model does not require scoring of forelimb functions. The follow-up period was chosen to correspond to the critically important active phases of the disease. Based on our pilot studies and previous investigations,9 all animals start to recover from motor deficits starting at day 9–10 regardless of treatment. Since we believed leukadherin1’s therapeutic effects would be more pronounced in the lesion’s exacerbation phase based on its previously reported mechanisms of action, the behavioral functions of animals were monitored for 8 days. Similar to previous reports on local EAE, we observed that the peak clinical signs occur between days 3–5 after stereotaxic surgery which indicates the highest activity of detrimental factors.9 In order to study the protective effects of leukadherin1 against these factors and histological features, two series of the same experimental animal groups were also generated through the above-mentioned methods (two series of EAE + LAD1 (n=3), EAE (n=3), Control (n=3)). All these animals were monitored daily to ensure the similar trend of EAE scores. Further, these animals were anesthetized on day 5 and the site of injection in the spinal cord (T8 spinal segment) was dissected of each series of animals; one for histological and the other for the molecular analyses.
Behavioral Analyses
Open-field locomotion and grid-walking tests were used to assess the motor function deficits. The Basso, Beattie, and Bresnahan (BBB) locomotor scale method was used to measure hind limb recovery in a 5-minute trial on day 5 in the open field. This scoring scale has a minimum of 0, i.e., no movement of hind limbs, and a maximum of 21 which is seen in normal naïve animals.15 In the grid-walking test, the scoring system was designed to quantify the animals’ foot faults on a grid floor (45 cm x 45 cm) 2.5 cm above the floor. In a 5-minute daily trial, animals were allowed to move freely on the grid. The percentage of complete foot faults in which the animal’s paw touched the floor were counted and given a “Grid score” from 1 (0% to 10% of total steps) to 10 (90% to all steps).9 The analyses were performed by an experimenter blinded to the identity of the treatment groups.
Histopathology and Immunostaining Studies
The spinal cord tissues at the site of cytokine injection (T8) were fixed with 10% formalin for three days at 4°C. Samples were then embedded in paraffin and 5μm sections were made using a microtome. In order to observe the focal inflammatory milieu in the site of the injection, Hematoxylin and Eosin (H&E) staining was used. Luxol fast blue (LFB) staining was also applied to ensure that the focal-demyelinated area was compatible with the inflammatory milieu. For quantifying the extent of demyelination, LFB/Cresyl violet staining was applied. The demyelinated area in the T8 spinal cord segment was measured using ImageJ software. For immunohistochemistry analyses, paraffin-embedded spinal segments (4 μm thickness) were mounted onto saline-coated slides. Following dewaxing and rehydration in a graded series of alcohol, the slides were rinsed in distilled water. 0.05 M Tris-buffered saline (TBS) pH 7.4, 3% bovine serum albumin, 10% fetal calf serum, and 1% Triton were used to block spine sections for 1 h at room temperature. Afterward, the slides were incubated with anti-Iba-1 (1:5000, Abcam; ab15690) and mouse anti-CD45 (1:2000, Abcam; ab10558) at 4°C overnight. Then, secondary antibodies were applied for 2h at room temperature. For each animal, 5–6 sections were observed with a fluorescence microscope and the average percent of staining-positive area was calculated. The semiquantitative calculation of Iba-1 and CD45 expression were performed using ImageJ software.16
Real-Time PCR
For molecular analyses, the spinal cord tissues at the site of cytokine injection (T8) were homogenized and total cellular RNA was extracted in Trizol reagent. Then, 1μg of total mRNA was reverse transcribed using cDNA kits. Specific mRNAs were amplified using the following primers: P47phox (Forward: AGCACTAGGAAGGTTGAGAAG; Reverse: TGGGATGCTGGGAATGGAAG) and rat β-actin as the housekeeping gene (Forward: ATTTGGCACCACACTTTC; Reverse: AGCCAGGTCCAGACGCA). Quantitative real-time PCR was performed using Rotorgene 3000 thermocycler. Cycling conditions were consistent with previous studies.17 Samples were run in triplicate and mRNA fold-change was calculated according to 2−ΔΔCt method.18
Enzyme-Linked Immunoassay, Nitric Oxide Assay, and Lipid Peroxidation Assay
Spinal cord homogenates were centrifuged at 12000g for 5 minutes to determine the levels of TNFα using R&D systems ELISA kit. The amount of tissue homogenized and protein levels were used to normalize the cytokine levels. Using a Nitric oxide assay kit (Abcam, USA), levels of nitrite concentration were measured using the Griess reaction in microtiter plates. Homogenates were mixed with the kit reagents. After ten minutes of incubation in room temperature, absorbance of the sample was measured at 550 nm. Lipid peroxidation assay was performed with MDA assay kit (Sigma, Germany) according to the manufacturer’s instruction. Concentrations of MDA in samples were measured through spectrophotometry at a wavelength of 532 nm.
Statistical Analysis
All data analyses were performed using R version 3.5.2. Results of the clinical scores and grid-walking tests were evaluated by a Linear Mixed Model analysis using the lmer4,19 lmerTest,20 and emmeans21 and plotted using the ggplot222 and ggpubr23 packages in R. Our model is described in Eq. 1. This strategy enables analysis of the effects and interactions of treatment (Group) and time elapsed after procedure (Time), i.e., the fixed effects, while controlling for any possible differences between individual rats in responding to these fixed effects (ratID), i.e., random effects. The model also contains a general error term (error (residual)) which shows the effect of all other factors not included in our study.
Satterthwaite approximation for degrees of freedom was used to evaluate significance of the main effects and interactions.24 Tukey’s HSD post hoc test was used for further exploration of the findings. Cumulative clinical scores, BBB scores, and results of molecular and histological assays were compared using one-way analysis of variance (ANOVA) followed by Tukey’s HSD post hoc statistical test. The results for post hoc tests are expressed as mean ± SEM, and the significance level of α was set at 0.05.
Results
Leukadherin1 Improved Motor Function and Clinical Signs of EAE in Treated Animals
One day after the procedure, the animals began to show overt EAE clinical signs ranging from grade 2.5 to 3 in the EAE and EAE + LAD1 groups. The effects of Group and Time on clinical score had a significant interaction (F (14, 84) = 15.44, p < 0.001) with both Group (F (2, 12) = 822.17, p < 0.001) and Time (F (7, 84) = 37.59, p < 0.001) exerting significant main effects (Figure 1A).
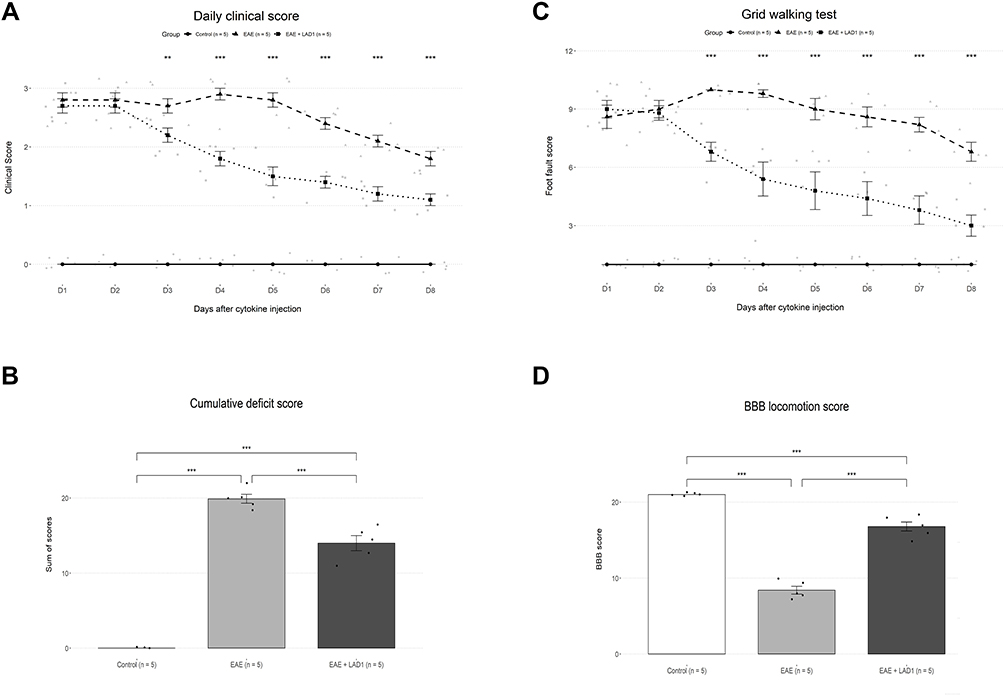 |
Figure 1 Effects of leukadherin1 on EAE clinical scores and behavioral tests. (A) The progression of clinical scores in the 8-day follow-up period are shown. For each group, mean ± SEM of clinical score is depicted in each day. Statistical significance is shown by (*) in comparison of the leukadherin1-treated (EAE + LAD1, n=5) and untreated (EAE, n=5) groups. The EAE + LAD1 animals showed a significant decrease in clinical scores compared to the EAE group between days 2 and 3 (Day 2: −.1 ± 0.14, p = 0.746; Day 3: −.5 ± 0.14, **p = 0.001); individual datapoints shown in gray. (B) Cumulative EAE disability scores were significantly different between the three groups (F (2, 12) = 230.4, ***p < 0.001), with leukadhering1 treatment significantly reducing the score compared to the EAE group (EAE + LAD1 (n=5)/EAE (n=5): −5.9 ± 2.54, ***p < 0.001). (C) The progression of foot fault scores in the 8-day follow-up period are shown. For each group, mean ± SEM of clinical score is depicted in each day. Statistical significance is shown by (*) in comparison of the leukadherin1-treated (EAE + LAD1, n=5) and untreated (EAE, n=5). The foot fault scores in the EAE + LAD1 group become significantly lower than the EAE group on day 3 (Day 2: −.2 ± 0.67, p = 0.952; Day3: −3.2 ± 0.67, ***p < 0.001)); individual datapoints shown in gray. (D) BBB scores in the open-field locomotion test on day 5 were significantly different between the three group (F (2,12) = 205.8, p < 0.001). leukadherin1 treatment significantly increased the BBB score (EAE + LAD1 (n=5)/EAE (n=5): 8.4 ± 1.69, ***p < 0.001). Significance of the results are depicted in all graphs as **p< 0.01, and ***p< 0.001. |
The difference in EAE clinical score between the EAE + LAD1 and EAE groups became significant from the 3rd day onwards (Day 2: −.1 ± 0.14, p = 0.746; Day 3: −.5 ± 0.14, p = 0.001). However, clinical scores in both the EAE and EAE + LAD1 groups remained significantly higher than the Control group throughout the 8-day period (p < 0.001). Day-by-day clinical scores in the EAE group showed a close to significant decrease only between days 5 and 6 (−.4 ± 0.13, p = 0.051). On the other hand, clinical scores in the EAE + LAD1 group first significantly decreased between days 2 and 3 (−.5 ± 0.13, p = 0.005) and the decreasing trend continued between days 3 and 4 (−.4 ± 0.13, p = 0.051) (Figure 1A). Therefore, leukadherin1 accelerated the decline of clinical scores.
The cumulative clinical scores of the 8-day test period were significantly different between the three groups as determined by one-way ANOVA (F (2, 12) = 230.4, p < 0.001). Pairwise comparisons using Tukey’s HSD post hoc test were significant for all pairs (EAE/Control: 19.9 ± 2.54, p < 0.001; EAE + LAD1/Control: 14 ± 2.54, p < 0.001; EAE + LAD1/EAE: −5.9 ± 2.54, p < 0.001) (Figure 1B). Manifestation of EAE clinical scores in experimental groups is also presented (Figure 1B).
A similar pattern was observed in the grid-walking test where Group and Time had a significant interaction (F (14, 84) = 16.274, p < 0.001) and significant main effects (Group: F (2, 12) = 111.059, p < 0.001; Time: F (7, 84) = 27.057, p < 0.001). Leukadherin1 treatment (EAE + LAD1) significantly decreased foot fault scores compared to the EAE group from day 3 onwards (Day 2: −.2 ± 0.67, p = 0.952; Day3: −3.2 ± 0.67, p < 0.001). Moreover, while scores in both groups showed a significant decrease during the 8 days (Day 8/Day 1 EAE: −1.8 ± 0.45, p = 0.003; Day 8/Day 1 EAE + LAD1: 6 ± 0.45, p < 0.001), they remained significantly higher than the Control group throughout. As was the case in the open-field test, foot fault scores in the EAE + LAD1 group showed a significant decreasing trend between days 2 and 3 (Day 2: −.2 ± 0.45, p = 0.999; Day 3: −2 ± 0.45, p < 0.001) and days 3 and 4 (Day 4: −.1.4 ± 0.45, p = 0.049) (Figure 1C).
The BBB scores in the open-field locomotion test were significantly different between the groups (F(2,12) = 205.8, p < 0.001) showing a partial reversal of the decrease in hind limb mobility by leukadherin1 treatment (EAE/Control: −12.6 ± 1.69, p < 0.001; EAE + LAD1/Control: −4.2 ± 1.69, p < 0.001; EAE + LAD1/EAE: 8.4 ± 1.69, p < 0.001) (Figure 1D).
Histological Observations Showed Remission of Lesions and Reduced Demyelination
Inflammatory milieu and demyelinated area were observed in the site of cytokine injection in EAE+ group (Figure 2A and B). Extent of demyelination was quantified using LFB/Cresyl violet staining. As shown in Figure 2C, gross demyelination was not noticeable in leukadherin1-treated rats compared to the untreated group. The extent of myelination was compared between the three groups using one-way ANOVA, showing a statistically significant difference (F (2, 6) = 48, p < 0.001, Figure 2D). Tukey post hoc analysis demonstrated significant demyelination in the EAE group (−29.70 ± 9.45, p < 0.001) which was partially reversed by leukadherin1 treatment (EAE + LAD1/EAE: 19.46 ± 9.45, p = 0.002; EAE + LAD1/Control: −10.25 ± 9.45, p = 0.036).
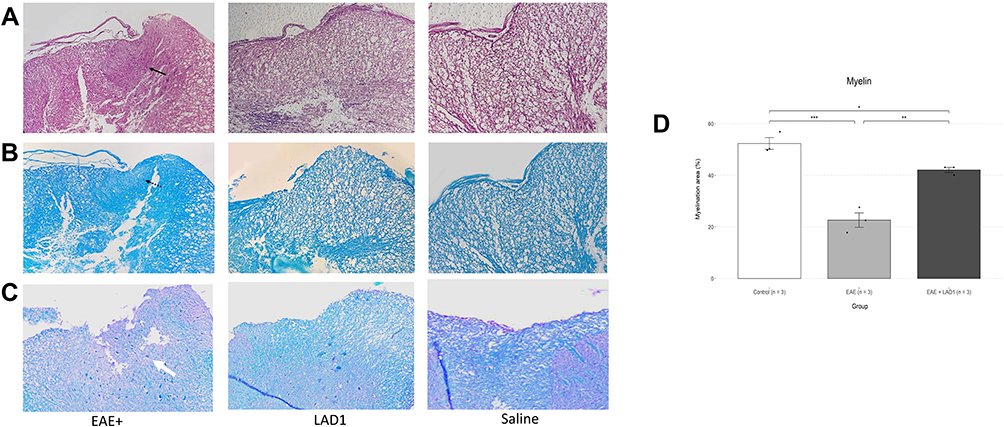 |
Figure 2 Effects of leukadherin1 on inflammatory area and lesion demyelination. The micrographs show H&E (A), LFB (B) and LFB/Cresyl violet (C) staining of T8 spinal cord sections as the principal lesion area (x100). The white and black-dotted arrows show demyelinated areas in the EAE group spinal cord tissue. The black arrow shows focal infiltration of inflammatory cells to the site of injection. Upon gross inspection, no demyelinated area may be seen in the EAE + LAD1 group. (D) Quantification of tissue myelinated area showed a significant difference between the three groups (F (2, 6) = 48, ***p < 0.001) where leukadherin1 treatment decreased demyelination (EAE + LAD1 (n=3)/EAE (n=3): 19.46 ± 9.45, **p = 0.002). Significance of the results are depicted in all graphs as *p< 0.05, **p< 0.01, and ***p< 0.001. |
Decreased Infiltration of CD45+ Leukocytes and Iba-1+ Activated Microglia is Observed in Spinal Tissues of Leukadherin1-Treated Animals
To assess leukocyte infiltration and microglial activation, we used immunohistochemistry to observe CD45+ and Iba-1+ cells, respectively. The number of cells expressing CD45 and Iba-1 differed significantly between the three groups (F (2, 6) = 106.6, p < 0.001 and F (2, 6) = 272.3, p < 0.001, respectively). Cells expressing both markers were significantly increased upon EAE induction compared to the control group (CD45: 37.00 ± 7.79, p < 0.001; Iba-1: 28.06 ± 3.70, p < 0.001). Leukadherin1 treatment significantly decreased CD45+ leukocyte infiltration (−16.67 ± 7.79, p = 0.001) and Iba1+ microglial activation (−11.84 ± 3.70, p < 0.001) compared to the untreated group (Figure 3A and B). However, there remained significant numbers of both cells despite treatment compared to the control group (CD45: 20.33 ± 7.79, p < 0.001; Iba-1: 16.22 ± 3.70, p < 0.001).
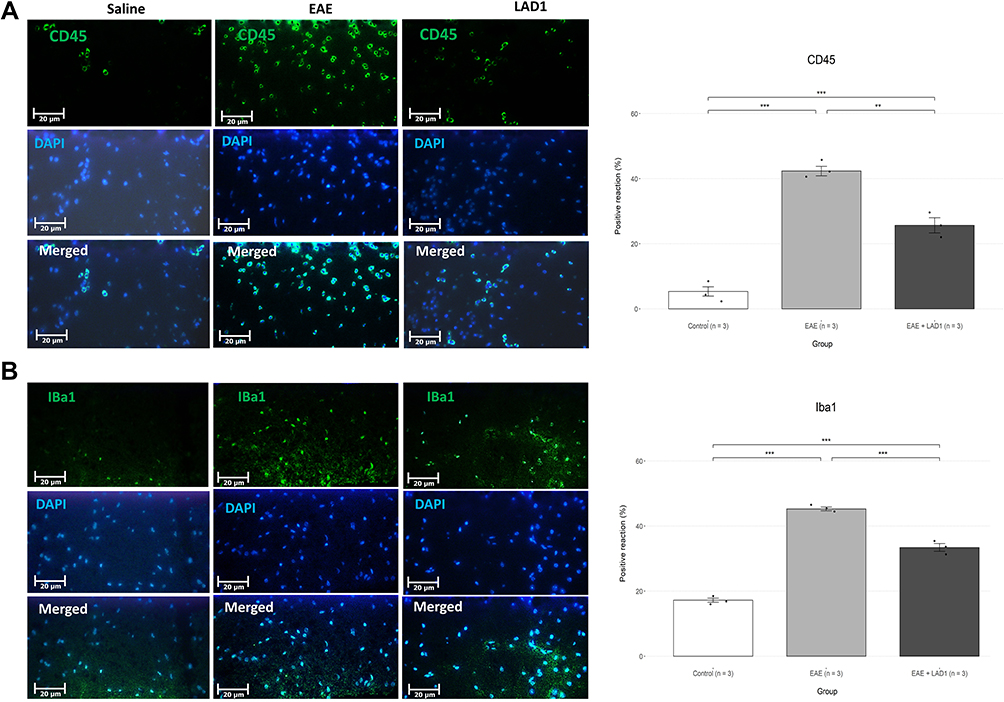 |
Figure 3 Effects of leukadherin1 on infiltration of CD45+ leukocytes and activation of Iba-1+ microglia. (A) T8 spinal cord sections were double-stained by DAPI and fluorescently labeled anti-CD45 for infiltrating leukocytes. The bar plot shows the percent of double-stained relative to DAPI+ cells. Leukadherin1 treatment significantly decreased CD45+ infiltration (n=3 in each group; −16.67 ± 7.79, **p = 0.001). (B) T8 spinal cord sections were double-stained by DAPI and fluorescently labeled anti- Iba1 for active microglia and macrophages. The bar plot shows the percent of double-stained relative to DAPI+ cells. Leukadherin1 treatment significantly decreased Iba1+ microglial activation (n=3 in each group; −11.84 ± 3.70, ***p < 0.001) compared to the untreated group (n=3). Significance of the results are depicted in all graphs as **p< 0.01, and ***p< 0.001. |
Effects of Leukaadherin1 on Expression of P47phox and Levels of NO, MDA and TNFα Concentration in Spine Tissues
Inflammation within the spinal cord tissue was studied using P47phox and TNFα as molecular markers (Figure 4A and B). P47phox mRNA levels were measured using RT-PCR. One-way ANOVA revealed significant alteration of P47phox between the study groups (F (2, 6) = 82.15, p < 0.001). Pairwise comparisons using the Tukey post hoc test showed a significant increase in P47phox expression in the EAE group compared to the control group (11.14 ± 2.76, p < 0.001). Leukadherin1 treatment significantly decreased P47phox expression (−2.94 ± 2.76, p = 0.039) compared to the EAE group even though P47phox mRNA levels remained significantly higher compared to the control group (8.20 ± 2.76, p < 0.001). In contrast, TNFα levels did not differ significantly between the EAE + LAD1 and EAE groups (4.44 ± 8.69, p = 0.328) in pairwise comparisons following a significant one-way ANOVA (F (2, 6) = 109.6, p < 0.001).
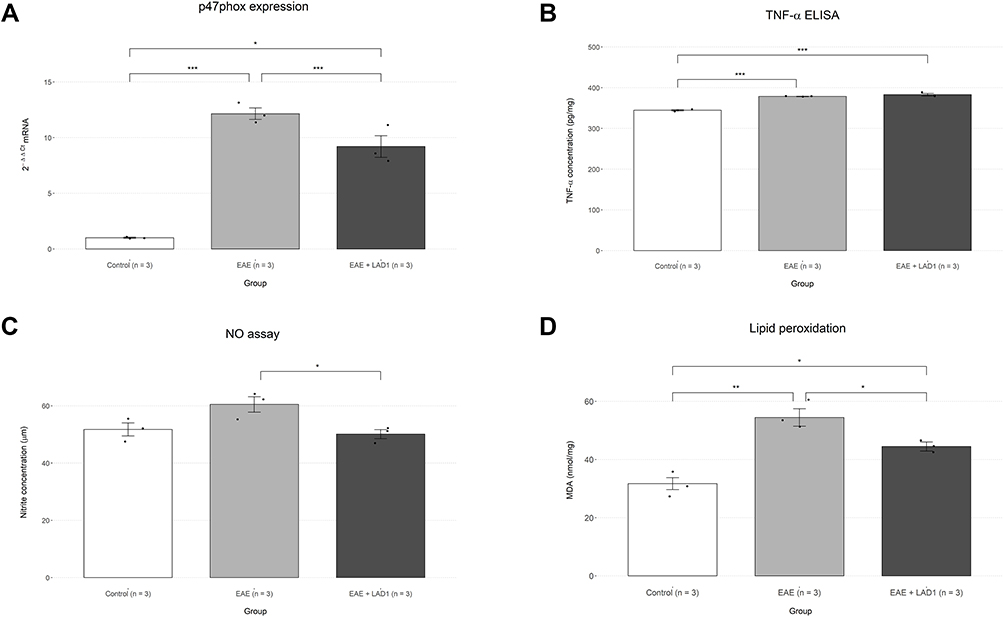 |
Figure 4 Effects of leukadherin1 on indicators of oxidative stress, inflammation, and P47phox mRNA. (A) Comparison of P47phox expression levels as measured by RT-PCR and presented as fold-change compared to control animals (n=3). Expression was significantly decreased in treated animals (n=3; −2.94 ± 2.76, *p = 0.039) compared to the EAE group (n=3). (B) Comparison of tissue TNFα concentrations as measured by ELISA. Consistent with previous reports, control animals (n=3) had significantly lower TNFɑ levels in comparison with the EAE group (n=3; 33.89 ± 8.69, ***p < 0.001). However, TNFɑ levels did not differ significantly compared to the EAE group following leukadherin1 treatment (n=3; 4.44 ± 8.69, p = 0.328). (C) Nitric oxide levels as measured by nitrite concentration in spinal cord tissue using the Griess reaction. Leukadherin1 significantly inhibited the EAE-induced increase in NO (−10.37 ± 9.71, *p = 0.039). (D) Lipid peroxidation levels as measured by MDA concentrations in spinal cord tissue. There was a significant reduction in peroxidation as a result of leuakdherin1 administration (−10.00 ± 9.92, *p = 0.048). Significance of the results are depicted in all graphs as *p< 0.05, **p< 0.01, and ***p< 0.001. |
Another indicator of tissue inflammation, oxidative stress, was also studied through assessment of NO production and lipid peroxidation (Figure 4C and D). Both NO and MDA concentrations significantly differed between the study groups (F (2, 6) = 6.22, p = 0.034 and F (2, 6) = 24.86, p = 0.001, respectively). However, pairwise comparison of NO concentration between groups showed a significant difference only between the EAE and EAE + LAD1 groups (−10.37 ± 9.71, p = 0.039). On the other hand, lipid peroxidation was significantly increased in the EAE group compared to controls (22.74 ± 9.92, p = 0.001). While still significantly higher than the control group (12.74 ± 9.92, p = 0.018), lipid peroxidation was significantly decreased by leukadherin1 treatment (−10.00 ± 9.92, p = 0.048).
Discussion
This study is in line with several previous attempts within the scientific community to capitalize on the therapeutic potential of blood-brain barrier breakdown inhibition and immune cell transmigration during the pathological cascade of multiple sclerosis.25,26 Previous studies have mostly used the conventional EAE clinical scoring system to observe the effects of potential therapeutics. However, this system is imprecise in evaluating motor abilities of animals in correlation with specific EAE lesions. Specific therapeutic effects of several drugs (i.e., Siponimod, lipoic acid, valproic acid, etc.) have been studied in focal lesion models through various induction methods. However, most of the mentioned drugs have been administered as a pretreatment and they have only shown preventive effects whereas leukadherin1 could alleviate clinical symptoms during the active phase of the disease.27–30 In our study, leukadherin1 improved these motor abilities as evidenced not only by the clinical scoring system but also by foot fault and BBB scores in the grid walking and open-field locomotion tests, respectively. The results of the grid-walking test have been shown to be precisely correlated with lesion severity in the dorsal columns through measuring proper stepping, fine movement control, etc.9,31 Furthermore, the BBB scoring system evaluates hind limb function, assessing the function of dorsal spinal tracts in sensory-motor coordination. Therefore, it could be stated that the observed beneficial effects of leukadherin1 were directly associated with actual tissue defects.
Leukadherin1 has previously been shown to have therapeutic effects in a number of animal models of peripheral and central inflammation. For example, beneficial effects of leukadherin1 through inhibition of immune cell transmigration have been reported in alleviating hyperoxia-induced influx of macrophages into the lungs, acute peritonitis, vascular injury, experimental models of chronic kidney allograft survival and bile duct fibrosis.14,32-34 In addition to inhibiting immune cell migration, leukadherin1 has been shown to suppress macrophage activation and inflammation in an animal model of sepsis.35 Leukadherin1 has been reported to exert similar effects on LPS-treated macrophages through suppression of TLR4 and the AKT/FOXO3/IRF3/7 axis downstream to CD11b activation.36 These protective effects have also been shown in experimental models of neurologic diseases. For instance, leukadherin1 was able to enhance β-amyloid (Aβ) degradation in an animal model of Alzheimer’s disease, possibly by stimulating the complement receptor 3 (CR3) on microglia.37
As reported in previous studies, infiltration by CD45+ inflammatory cells leads to progression of EAE lesions and substantial disabilities. Among these migratory immune cells, monocytes differentiate into new macrophages which are phenotypically similar to the active resident Iba-1+ microglia.38 Migratory neutrophils and monocyte-derived macrophages are mainly responsible for the oxidative stress within active lesions.4 Importantly, these reactive oxygen species are strongly involved in damaging the BBB endothelium and extending the demyelinated area through DNA damage and cell death induction.39,40 P47phox expression plays an important role in ROS production. Reactive nitrogen species are also upregulated as a consequence of elevated inflammatory cytokines during the course of MS.41
In our study, leukadherin1 decreased immune cell infiltration and microglial activation as expected. As mentioned before, the peak period for such infiltration occurs between 3 and 5 days after model induction.9 The fact that LAD1’s therapeutic effects became significant during the third and fourth days supports the notion that this treatment prevented lesion exacerbation through prevention of immune cell infiltration. The observed concurrent reduction in oxidative stress, as indicated by lipid peroxidation and NO concentration, and P47phox expression may have been mediated through this decrease in infiltration of pro-inflammatory cells. However, leukadherin1 did not significantly alter TNFɑ levels in demyelinated areas. Most previous studies have reported TNFα as a chief proinflammatory cytokine in MS. However, some studies have considered it as an important factor promoting remyelination and lesion remission. These contradictory data on TNFα may be attributed to its pleiotropic features and the various downstream signaling pathways activated by its receptor.42
Conclusion
In conclusion, this study showed the beneficial effects of leukadherin1 on clinical outcomes and pathological features of a multiple sclerosis model in rats (EAE). These effects may have been mediated through reduction of immune cell infiltration and oxidative stress within the demyelinated lesions. Based on our results, we suggest that leukadherin1 may be used as a novel therapeutic agent in tackling the clinical challenge of multiple sclerosis, especially during the acute phase of the disease.
Abbreviations
MS, multiple sclerosis; MDA, malon di-aldehyde; ROS, reactive oxygen species; RNS, reactive nitrogen species; EAE, experimental autoimmune encephalitis; NOX, phagocyte NADPH oxidase; iNOS, inducible nitric oxide synthase; NO, nitric oxide.
Data Sharing Statement
All the necessary data are included in the article. Further data will be shared by request.
Ethics Approval
All experiments were in accordance with the guidelines of Tehran University of Medical Sciences and approved by the Animal Ethics Committee.
Disclosure
The authors have no conflicts of interest to declare.
References
1. Deng X, Sriram S. Role of microglia in multiple sclerosis. Curr Neurol Neurosci Rep. 2005;5(3):239–244. doi:10.1007/s11910-005-0052-x
2. Kouwenhoven M, Teleshova N, Özenci V, Press R, Link H. Monocytes in multiple sclerosis: phenotype and cytokine profile. J Neuroimmunol. 2001;112(1–2):197–205. doi:10.1016/S0165-5728(00)00396-9
3. Mishra MK, Wang J, Silva C, Mack M, Yong VW. Kinetics of proinflammatory monocytes in a model of multiple sclerosis and its perturbation by laquinimod. Am J Pathol. 2012;181(2):642–651. doi:10.1016/j.ajpath.2012.05.011
4. Ohl K, Tenbrock K, Kipp M. Oxidative stress in multiple sclerosis: central and peripheral mode of action. Exp Neurol. 2016;277:58–67. doi:10.1016/j.expneurol.2015.11.010
5. Correale J, Marrodan M, Ysrraelit MC. Mechanisms of neurodegeneration and axonal dysfunction in progressive multiple sclerosis. Biomedicines. 2019;7(1):14. doi:10.3390/biomedicines7010014
6. Fischer MT, Sharma R, Lim JL, et al. NADPH oxidase expression in active multiple sclerosis lesions in relation to oxidative tissue damage and mitochondrial injury. Brain. 2012;135(3):886–899. doi:10.1093/brain/aws012
7. Choi BY, Kim JH, Kho AR, et al. Inhibition of NADPH oxidase activation reduces EAE-induced white matter damage in mice. J Neuroinflammation. 2015;12(1):104. doi:10.1186/s12974-015-0325-5
8. Smith KJ, Lassmann H. The role of nitric oxide in multiple sclerosis. Lancet Neurol. 2002;1(4):232–241. doi:10.1016/S1474-4422(02)00102-3
9. Kerschensteiner M, Stadelmann C, Buddeberg BS, et al. Targeting experimental autoimmune encephalomyelitis lesions to a predetermined axonal tract system allows for refined behavioral testing in an animal model of multiple sclerosis. Am J Pathol. 2004;164(4):1455–1469. doi:10.1016/S0002-9440(10)63232-4
10. Faridi MH, Altintas MM, Gomez C, Duque JC, Vazquez-Padron RI, Gupta V. Small molecule agonists of integrin CD11b/CD18 do not induce global conformational changes and are significantly better than activating antibodies in reducing vascular injury. Biochim Biophys Acta. 2013;1830(6):3696–3710. doi:10.1016/j.bbagen.2013.02.018
11. Celik E, Faridi H, Kumar V, Deep S, Moy V, Gupta V. Agonist leukadherin-1 increases CD11b/CD18-dependent adhesion via membrane tethers. Biophys J. 2013;105:2517–2527. doi:10.1016/j.bpj.2013.10.020
12. Dickinson CM, LeBlanc BW, Edhi MM, et al. Leukadherin-1 ameliorates endothelial barrier damage mediated by neutrophils from critically ill patients. J Intensive Care. 2018;6(1):19. doi:10.1186/s40560-018-0289-5
13. Roberts A, Fuernrohr B, Vyse T, Rhodes B. The complement receptor 3 (CD11b/CD18) agonist leukadherin-1 suppresses human innate inflammatory signalling. Clin Exp Immunol. 2016;185:361–371. doi:10.1111/cei.12803
14. Jagarapu J, Kelchtermans J, Rong M, et al. Efficacy of Leukadherin-1 in the Prevention of Hyperoxia-Induced Lung Injury in Neonatal Rats. Am J Respir Cell Mol Biol. 2015;53(6):793–801. doi:10.1165/rcmb.2014-0422OC
15. Wong J, Sharp K, Steward O. A straight alley version of the BBB locomotor scale. Exp Neurol. 2009;217(2):417–420. doi:10.1016/j.expneurol.2009.03.037
16. Schindelin J, Rueden CT, Hiner MC, Eliceiri KW. The ImageJ ecosystem: an open platform for biomedical image analysis. Mol Reprod Dev. 2015;82(7–8):518–529. doi:10.1002/mrd.22489
17. Jenabian M-A, Patel M, Kema I, et al. Correction: distinct tryptophan catabolism and Th17/Treg balance in HIV progressors and elite controllers. PLoS One. 2014;9(1). doi:10.1371/annotation/11698dd2-0bc1-4fe0-ad92-b161b5594e81
18. Yuan JS, Reed A, Chen F, Stewart CN
19. Bates D, Mächler M, Bolker B, Walker S. Fitting linear mixed-effects models using lme4. arXiv Preprint arXiv. 2015;67(1):48.
20. Kuznetsova A, Brockhoff PB, Christensen RHB. lmerTest package: tests in linear mixed effects models. J Stat Softw. 2017;82(13):26.
21. rvlenth/emmeans [computer program]. 2019.
22. Wickham H. Ggplot2: Elegant Graphics for Data Analysis. Springer Publishing Company, Incorporated; 2009.
23. ggpubr: ‘ggplot2ʹ Based Publication Ready Plots [computer program]. Version R package version 0.2. 2018.
24. Luke SG. Evaluating significance in linear mixed-effects models in R. Behav Res Methods. 2017;49(4):1494–1502. doi:10.3758/s13428-016-0809-y
25. Wimmer I, Tietz S, Nishihara H, et al. PECAM-1 stabilizes blood-brain barrier integrity and favors paracellular T-cell diapedesis across the blood-brain barrier during neuroinflammation. Front Immunol. 2019;10:711. doi:10.3389/fimmu.2019.00711
26. Wouters E, de Wit NM, Vanmol J, et al. Liver X receptor alpha is important in maintaining blood-brain barrier function. Front Immunol. 2019;10:1811. doi:10.3389/fimmu.2019.01811
27. Pazhoohan S, Satarian L, Asghari AA, et al. Valproic acid attenuates disease symptoms and increases endogenous myelin repair by recruiting neural stem cells and oligodendrocyte progenitors in experimental autoimmune encephalomyelitis. Neurodegener Dis. 2014;13(1):45–52. doi:10.1159/000352021
28. Walczak P, All AH, Rumpal N, et al. Human glial-restricted progenitors survive, proliferate, and preserve electrophysiological function in rats with focal inflammatory spinal cord demyelination. Glia. 2011;59(3):499–510. doi:10.1002/glia.21119
29. Chaudhary P, Marracci G, Galipeau D, Pocius E, Morris B, Bourdette D. Lipoic acid reduces inflammation in a mouse focal cortical experimental autoimmune encephalomyelitis model. J Neuroimmunol. 2015;289:68–74. doi:10.1016/j.jneuroim.2015.10.011
30. Hundehege P, Cerina M, Eichler S, et al. The next-generation sphingosine-1 receptor modulator BAF312 (siponimod) improves cortical network functionality in focal autoimmune encephalomyelitis. Neural Regen Res. 2019;14(11):1950–1960. doi:10.4103/1673-5374.259622
31. Buddeberg BS, Kerschensteiner M, Merkler D, Stadelmann C, Schwab ME. Behavioral testing strategies in a localized animal model of multiple sclerosis. J Neuroimmunol. 2004;153(1–2):158–170. doi:10.1016/j.jneuroim.2004.05.006
32. Maiguel D, Faridi MH, Wei C, et al. Small molecule-mediated activation of the integrin CD11b/CD18 reduces inflammatory disease. Sci Signal. 2011;4(189):ra57–ra57. doi:10.1126/scisignal.2001811
33. Khan SQ, Guo L, Cimbaluk DJ, et al. A small molecule beta2 integrin agonist improves chronic kidney allograft survival by reducing leukocyte recruitment and accompanying vasculopathy. Front Med. 2014;1:45. doi:10.3389/fmed.2014.00045
34. Joshi N, Kopec AK, Ray JL, et al. Fibrin deposition following bile duct injury limits fibrosis through an alphaMbeta2-dependent mechanism. Blood. 2016;127(22):2751–2762. doi:10.1182/blood-2015-09-670703
35. Yao X, Dong G, Zhu Y, et al. Leukadherin-1-mediated activation of CD11b inhibits LPS-induced pro-inflammatory response in macrophages and protects mice against endotoxic shock by blocking LPS-TLR4 interaction. Front Immunol. 2019;10:215. doi:10.3389/fimmu.2019.00215
36. Faridi MH, Khan SQ, Zhao W, et al. CD11b activation suppresses TLR-dependent inflammation and autoimmunity in systemic lupus erythematosus. J Clin Invest. 2017;127(4):1271–1283. doi:10.1172/JCI88442
37. Czirr E, Castello NA, Mosher KI, et al. Microglial complement receptor 3 regulates brain Aβ levels through secreted proteolytic activity. J Exp Med. 2017;214(4):1081–1092. doi:10.1084/jem.20162011
38. Ajami B, Bennett JL, Krieger C, McNagny KM, Rossi FM. Infiltrating monocytes trigger EAE progression, but do not contribute to the resident microglia pool. Nat Neurosci. 2011;14(9):1142–1149. doi:10.1038/nn.2887
39. Konat GW, Wiggins RC. Effect of reactive oxygen species on myelin membrane proteins. J Neurochem. 1985;45(4):1113–1118. doi:10.1111/j.1471-4159.1985.tb05530.x
40. Rubanyi GM, Vanhoutte PM. Oxygen-derived free radicals, endothelium, and responsiveness of vascular smooth muscle. Am J Physiol. 1986;250(5 Pt 2):H815–H821. doi:10.1152/ajpheart.1986.250.5.H815
41. Lassmann H, van Horssen J. The molecular basis of neurodegeneration in multiple sclerosis. FEBS Lett. 2011;585(23):3715–3723. doi:10.1016/j.febslet.2011.08.004
42. Lim S-Y. TNF-α: a paradigm of paradox and complexity in multiple sclerosis and its animal models. Open Autoimmun J. 2010;2(1). doi:10.2174/1876894601002040160
 © 2020 The Author(s). This work is published and licensed by Dove Medical Press Limited. The full terms of this license are available at https://www.dovepress.com/terms.php and incorporate the Creative Commons Attribution - Non Commercial (unported, v3.0) License.
By accessing the work you hereby accept the Terms. Non-commercial uses of the work are permitted without any further permission from Dove Medical Press Limited, provided the work is properly attributed. For permission for commercial use of this work, please see paragraphs 4.2 and 5 of our Terms.
© 2020 The Author(s). This work is published and licensed by Dove Medical Press Limited. The full terms of this license are available at https://www.dovepress.com/terms.php and incorporate the Creative Commons Attribution - Non Commercial (unported, v3.0) License.
By accessing the work you hereby accept the Terms. Non-commercial uses of the work are permitted without any further permission from Dove Medical Press Limited, provided the work is properly attributed. For permission for commercial use of this work, please see paragraphs 4.2 and 5 of our Terms.