")
Back to Journals » Therapeutics and Clinical Risk Management » Volume 12
Protective effect of tartary buckwheat on renal function in type 2 diabetics: a randomized controlled trial
Authors Qiu J, Li ZG, Qin YC, Yue YF, Liu YP
Received 22 September 2016
Accepted for publication 31 October 2016
Published 18 November 2016 Volume 2016:12 Pages 1721—1727
DOI https://doi.org/10.2147/TCRM.S123008
Checked for plagiarism Yes
Review by Single anonymous peer review
Peer reviewer comments 2
Editor who approved publication: Dr Deyun Wang
Ju Qiu,1 Zaigui Li,2 Yuchang Qin,1 Yanfen Yue,3 Yanping Liu4
1Institute of Food and Nutrition Development, Ministry of Agriculture, 2College of Food Science and Nutritional Engineering, China Agricultural University, 3Department of Nutrition, Pinggu Hospital of Traditional Chinese Medicine, Pinggu, 4Department of Nutrition, Peking Union Medical College Hospital, Chinese Academy of Medical Sciences, Beijing, China
Abstract: Tartary buckwheat (TB) has been reported to be associated with a decreased risk of type 2 diabetes mellitus (T2DM), and T2DM has had a major impact on the development of diabetic kidney disease (DKD). Thus, the hypothesis that a daily intake of TB will improve DKD risk factors, including urinary albumin to creatinine ratio (UACR), urea nitrogen (UN), serum creatinine, and uric acid was tested. In a parallel, randomized, open-label controlled trial, 104 T2DM patients were randomly assigned to a diet control group (systematic diet plans and intensive nutritional education) or a TB intervention group (daily replacement of a portion of staple foods with TB foods). Blood samples and dietary information were collected at baseline and the end of the 4-week study. The primary outcomes were that TB significantly decreased the relative changes in UACR (2.43–2.35, logarithmic transformed mg/g creatinine) and UN (5.12–4.91 mmol/L) in the TB intervention group vs the diet control group at 4 weeks (P<0.05), without obvious effect on blood glucose during the 4-week study. In addition, subgroup analyses based on different DKD stages also showed a significant reduction in UACR and UN for the T2DM patients with normoalbuminuria and microalbuminuria (P<0.05). These results support the hypothesis that TB as a replacement of staple food probably alleviates renal dysfunction in T2DM patients.
Keywords: tartary buckwheat, dietary intervention, type 2 diabetes mellitus, renal function
Introduction
Diabetic kidney disease (DKD), as one of the most frequent complications of diabetes, is a major leading cause of end-stage renal disease, accounting for ~50% of cases in the developed world.1 Medical nutrition therapy can improve diabetic outcomes; therefore, it is highly recommended for the management of type 2 diabetes mellitus (T2DM) and its complications.2,3 Nutritional therapy with healthful eating is supported by clinical evidence relevant to DKD. Recent approaches to managing DKD apply an enhanced intake of whole grain (complex, unrefined) that is especially important for DKD prevention at an early stage.4
Tartary buckwheat (Fagopyrum tataricum Gaertn.; TB) is a traditional herbal and functional food in China, which has been reported to be associated with decreased risk of T2DM.5,6 It is rich in nutrients and phytochemicals. Phytochemicals from TB, such as flavonoids and D-chiro-inositol enriched, alleviate increase of postprandial glucose7 and lower fasting glucose.8 Protein9,10 and flavonoids11,12 from TB suppress hypercholesterolemia and improve the lipid profile. Management of hyperglycemia and dyslipidemia is critical to prevent DKD for T2DM patients.1 A recent study demonstrated the significant protective effect of flavonoids from buckwheat on renal function in T2DM rats.13 However, few studies have focused on the effect of TB on renal function in humans.
Therefore, the hypothesis that a daily intake of TB will improve DKD risk factors was tested. To support this hypothesis, main outcomes were measured in T2DM patients before and after a 4-week intervention with TB, including urinary albumin to creatinine ratio (UACR), urea nitrogen (UN), serum creatinine (SCr), uric acid (UA), and estimated glomerular filtration rate (eGFR).
Materials and methods
Subjects
A parallel, randomized, open-label controlled, 4-week dietary intervention trial was performed in Pinggu Hospital of Traditional Chinese Medicine, Beijing, China (Trial registration: chiCTR-IIR-15007600 at http://www.chictr.org.cn/showproj.aspx?proj=12237). T2DM patients were recruited according to annual physical examination data. Eligibility was determined through the following inclusion criteria: 1) previously diagnosed as diabetic; 2) duration of T2DM is 5–20 years; 3) eGFR ≥90 mL/min/1.73 m2; 4) no history of severe kidney disease, cardiovascular disease, stroke, cancer, or psychological disorders; and 5) not pregnant or lactating women. The sample size was calculated based on a previous study of buckwheat effect on renal protection in T2DM rats.13 The formula was as follows: N =2[(tα + tβ)S/δ]2, where tα =1.96, tβ =1.28, and S and δ were calculated according to the difference in kidney index in the previous study (11.73±1.58 mg/g vs 10.55±1.29 mg/g).13 A minimum sample size of 38 participants in each group was calculated with a confidence level of 95% and power of 90%. Considering 20% dropout, there was an aim to recruit 96 participants in total. After the exclusions, patients were divided into random groups using a random number table method with SPSS for WINDOWS 19.0 (SPSS Inc., Chicago, IL, USA). Finally, 104 patients (aged 30–80 years) were screened and completed the study (Figure S1). All subjects provided written informed consent.
Study design
The study protocol was approved by the Chinese Ethics Committee of Registering Clinical Trials (chiECRCT-20160001) and was in accordance with the Declaration of Helsinki of 1975 as revised in 1983. Subjects were randomly assigned to a diet control group (DC group) or a TB intervention group (TB group). All subjects were arranged to receive intensive nutritional education at baseline and every week during follow-up, but the DC group was assigned to consume white rice or wheat flour as daily cereals, while the TB group was assigned to replace a part of rice and wheat with TB foods of equivalent energy (100 g/d). TB foods were made of 100% TB from Guiyang Winner Hi-Tech Development Co. Ltd. (Guizhou, China), which were supplied to patients for free. Patients cooked TB foods for meal according to the standard protocols (Table S1). Dietary intake was assessed by 3-day food records, which included one weekend day. After face-to-face instructions by trained nurses from the clinical nutrition department of the hospital, daily food intakes of each participant were self-recorded using a formulary diet diary every day and summarized by trained investigators each week. Information was analyzed using the nutrition clinic consultation management system (Zhending Health Technology Co. Ltd., Shanghai, China). Compliance was monitored by researchers by weighing uneaten cereal packets returned from patients each week. Together with the daily records of food intake from formulary diet diary, including quantity and frequency of test cereals and other food eaten during the study, compliance with the intervention was determined.
Measurements
Body weight, height, body mass index (BMI), blood pressure, glycated hemoglobin (HbA1c), and glycated albumin (GA) were determined by the method of Zhang et al.14 Plasma glucose, SCr, blood UA, and blood UN were measured by an automatic analyzer (Olympus AU5400, Tokyo, Japan). UACR was calculated by dividing the urinary albumin concentrations measured with a Hitachi 7600 analyzer (Tokyo, Japan) by the urinary creatinine measured with chemiluminescence immunoassay (Siemens Immulite 2000; Siemens Healthcare GmbH, Erlangen, Germany).
Statistical analyses
Data were expressed as the mean ± standard deviation (SD) for continuous variables and the number (percentage) for categorical variables. Equality and normality of variance were checked before any further analysis. The nonnormally distributed variables were normalized by the logarithmic transformations. Baseline characteristics of the two groups were compared using Student’s t-test or Pearson’s χ2 test as appropriate. Differences in variables between the groups at baseline and 4-week intervention were analyzed using the Student’s t-test, and differences between baseline and final 4-week intervention were compared using the paired Student’s t-test. Change from baseline in renal profiles was adjusted for sex, age, BMI at baseline, and baseline values of relevant outcome variables, and the differences were analyzed by an analysis of covariance (ANCOVA, generalized linear model) test. All data were analyzed on an intention-to-treat basis without imputation with SPSS for WINDOWS 19.0, and a two-sided P<0.05 was considered significant.
Results
There was no significant difference in baseline characteristics between the DC and TB groups (Table 1). The TB intake resulted in a higher protein intake after the 4-week intervention (protein, % of energy, 13.73±2.83 vs 15.74±2.84), but the DC group did not (protein, % of energy, 14.22±2.26 vs 13.92±2.13). The diet energy and other nutrients were not changed.
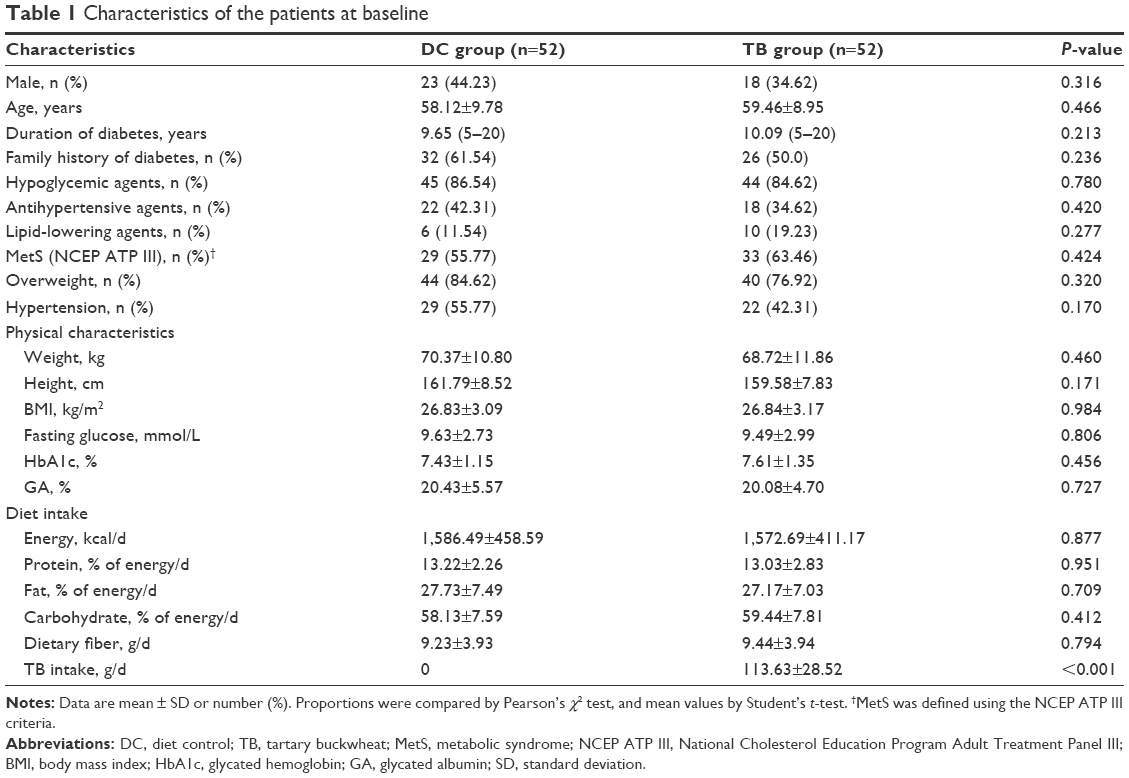 | Table 1 Characteristics of the patients at baseline |
The renal profile showed that a significant difference in the change of UACR from baseline between the DC and TB groups was observed (P=0.032). The UACR of the DC group was not affected (P=0.485) but that of the TB group was decreased significantly (P=0.016). In addition, after the 4-week intervention, the TB group showed lower UN level than the DC group (P=0.025), and change from baseline of UN between the two groups was also significant (P=0.028). TB treatment resulted in a decrease in UN level (P=0.049), but the DC group did not (P=0.241) (Table 2). The renal profile in T2DM patients with different DKD stages showed that, compared with the DC group, the TB group inhibited the increase in UACR and decreased UN when UACR <10 mg/g (P<0.05); UACR of the TB group was also decreased when UACR ≥30 mg/g (P<0.05) (Table 3).
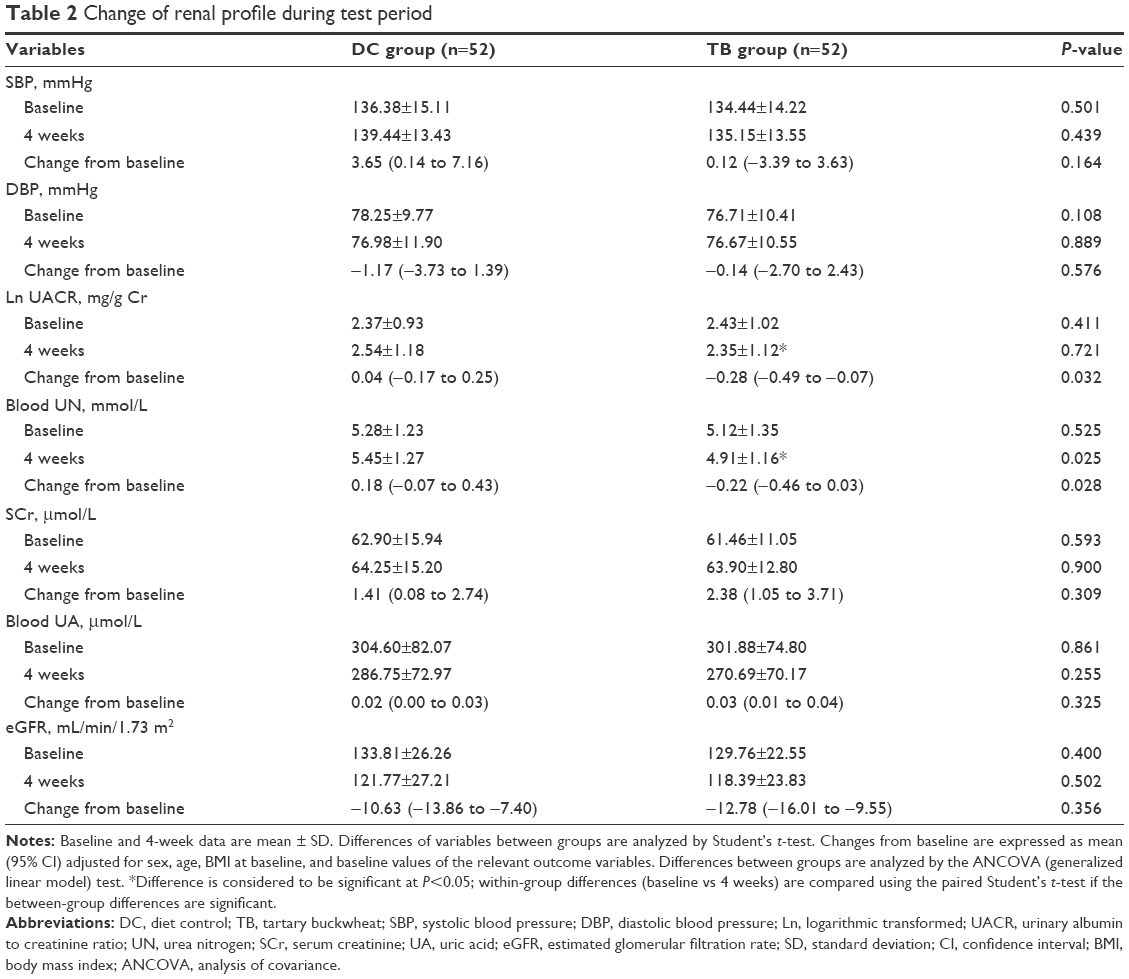 | Table 2 Change of renal profile during test period |
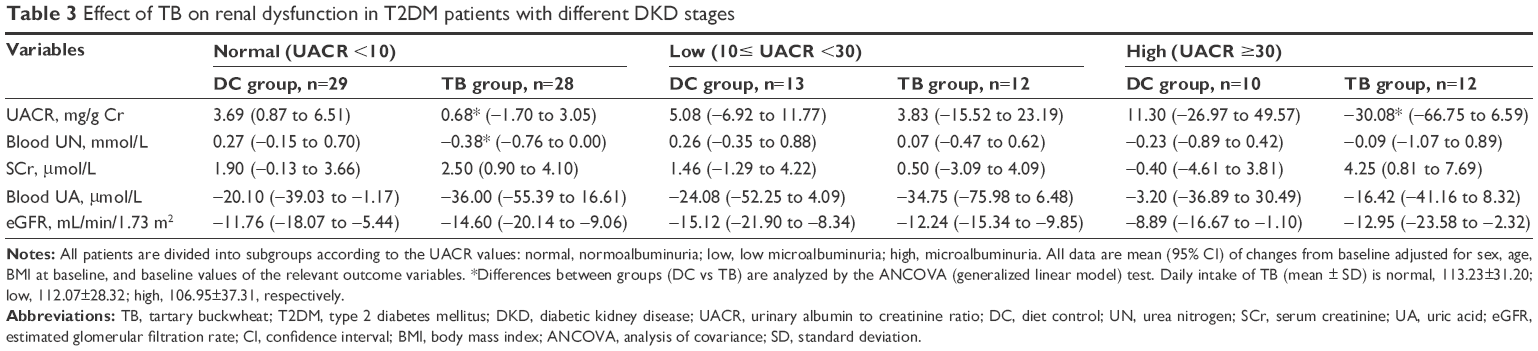 | Table 3 Effect of TB on renal dysfunction in T2DM patients with different DKD stages |
Discussion
DKD is defined according to the classification: macroalbuminuria or microalbuminuria plus diabetic retinopathy.15 Renal dysfunction at stage I (microalbuminuria) of DKD is probably reversible, so that the management of nutrition therapy or dietary interventions is much more important. The presence of early DKD (stage I) in this study was based on Kidney Diseases Outcome Quality Initiative (KDOQI) criteria16 (eGFR ≥90 mL/min/1.73 m2 and UACR ≥30 mg/g). Normoalbuminuric patients are further classified as having normal (UACR <10 mg/g) or low albuminuria (UACR 10–29 mg/g), according to the recent definition of the National Kidney Foundation (NKF).17 Increased UACR represents higher urinary albumin excretion as a risk factor for future kidney disease.1 In this study, TB intervention resulted in the decrease of UACR, but the DC group did not. Subsequent analysis based on different DKD stages showed that the reduction in UACR of TB treatment was especially effective for the T2DM patients with microalbuminuria (30≤ UACR <300 mg/g). This finding indicated that TB may improve the renal dysfunction at the stage I of DKD by decreasing urinary albumin excretion.
The improvement of urinary albumin excretion is associated with the protein metabolism. Both quantity and quality of protein and amino acids have been identified to be important for the maintenance of adequate nutritional status in DKD.1 The TB intake resulted in a higher protein intake after the 4-week intervention and a decrease in UN level. This result was consistent with the significantly decreased UN level in the TB group when UACR <10 mg/g. Compared with the DC group, TB decreased UN and maintained UACR for the T2DM patients with normal renal function. The decreased UN level and increased protein intake induced by TB intake supported that nitrogen was synthetized to amino acid in the body, and thus, nitrogen metabolism was improved. It indicated that TB might alleviate the renal dysfunction in T2DM patients with normoalbuminuria.
In normo- and microalbuminuric patients with T2DM, extra careful attention should be paid to patients with eGFR ≥120 mL/min/1.73 m2 to detect cases with rapidly decreased GFR under the normal range.18 In this study, eGFR was calculated by the Modification of Diet in Renal Disease (MDRD) equation based on the Chinese patients.19 As a result, mean values of eGFR in the DC and TB groups were ~130 mL/min/1.73 m2, together with that the eGFR of 25% patients were 100–120 mL/min/1.73 m2 (15 patients per group) and 65% (34 patients per group) were 120–190 mL/min/1.73 m2; it was indicated that T2DM patients showed glomerular hyperfiltration. Glomerular hyperfiltration leads to an increase in urinary albumin excretion and thus causes progression of early DKD in T2DM.20 In this study, eGFR was decreased significantly in both the DC and TB groups, indicating that diet control for T2DM patients effectively ameliorated glomerular hyperfiltration but TB did not show obviously better effect than rice or wheat during the 4-week intervention.
It has been reported that a protective effect of flavonoids from buckwheat on renal dysfunction induced by T2DM may be due to an inhibition of protein tyrosine phosphatase 1B expression in kidney.13 Another study showed that buckwheat flavonoids showed improvement in renal function by decreasing SCr in rats.21 In this study, SCr or UA was not affected by TB intervention. Blood pressure was also not changed significantly in T2DM patients, neither systolic blood pressure (SBP) nor diastolic blood pressure (DBP), although a diet supplemented with TB showed beneficial effects on hypertension by a prevention of renal damage in rats.22 The prevalence of hypertension was also analyzed after the 4-week intervention, and there was no significant difference between the two groups (57.69% vs 42.31%, P=0.117). No significant difference in fasting glucose, HbA1c, and GA between the two groups was observed after the 4-week intervention. These findings indicated that a long-term intervention with larger sample size is still needed in the future to illustrate the mechanism of TB effect on renal function and its correlation with blood glucose or blood pressure in T2DM patients.
There were several limitations of this study. First, the duration of 4-week intervention might be not long enough to detect a difference in blood glucose and blood pressure. Second, the patients at early stage I of DKD were screened to evaluate the TB effect on renal dysfunction, which might be insufficient to detect the considerable changes in GFR or albuminuria of T2DM patients.
Conclusion
The hypothesis that substituting TB for white rice or wheat flour showed an effect on lowering UACR and UN in T2DM patients was accepted. Dietary TB intake probably shows a potential way to prevent renal dysfunction for the T2DM patients with normoalbuminuria and ameliorate the renal function at the early stage of DKD (stage I).
Acknowledgments
This work was funded by the Agricultural Science and Technology Innovation Program, Chinese Academy of Agricultural Sciences, and China Agriculture Research System (CARS-080D-3).
Disclosure
The authors report no conflicts of interest in this work.
References
Tuttle KR, Bakris GL, Bilous RW, et al. Diabetic kidney disease: a report from an ADA consensus conference. Diabetes Care. 2014;37(10):2864–2883. | ||
Boucher JL, Evert A, Daly A, et al. American Dietetic Association revised standards of practice and standards of professional performance for registered dietitians (generalist, specialty, and advanced) in diabetes care. J Am Diet Assoc. 2011;111(1):156–166. | ||
Franz MJ, Powers MA, Leontos C, et al. The evidence for medical nutrition therapy for type 1 and type 2 diabetes in adults. J Am Diet Assoc. 2010;110(12):1852–1889. | ||
Estruch R, Ros E, Salas-Salvado J, et al; PREDIMED Study Investigators. Primary prevention of cardiovascular disease with a Mediterranean diet. N Engl J Med. 2013;368(7):1279–1290. | ||
Zhang ZL, Zhou ML, Tang Y, et al. Bioactive compounds in functional buckwheat food. Food Res Int. 2012;49(1):389–395. | ||
Lee CC, Hsu WH, Shen SR, Cheng YH, Wu SC. Fagopyrum tataricum (buckwheat) improved high-glucose-induced insulin resistance in mouse hepatocytes and diabetes in fructose-rich diet-induced mice. Exp Diabetes Res. 2012;1(5):83–88. | ||
Li YQ, Zhou FC, Gao F, Bian JS, Shan F. Comparative evaluation of quercetin, isoquercetin and rutin as inhibitors of alpha-glucosidase. J Agric Food Chem. 2009;57(24):11463–11468. | ||
Yao Y, Shan F, Bian JS, et al. D-chiro-inositolenriched tartary buckwheat bran extract lowers the blood glucose level in KK-Ay mice. J Agric Food Chem. 2008;56(21):10027–10031. | ||
Tomotake H, Yamamoto N, Yanaka N, et al. High protein buckwheat flour suppresses hypercholesterolemia in rats and gallstone formation in mice by hypercholesterolemic diet and body fat in rats because of its low protein digestibility. Nutrition. 2006;22(2):166–173. | ||
Tomotake H, Yamanoto N, Kitabayashi H, et al. Preparation of tartary buckwheat protein product and its improving effect on cholesterol metabolism in rats and mice fed cholesterol-enriched diet. J Food Sci. 2007;72(7):S528–S533. | ||
Zhang R, Yao Y, Wang Y, Ren G. Antidiabetic activity of isoquercetin in diabetic KK-Ay mice. Nutr Metab. 2011;8(2):85–90. | ||
Wang M, Liu JR, Gao JM, Parry JW, Wei YM. Antioxidant activity of tartary buckwheat bran extract and its effect on the lipid profile of hyperlipidemic rats. J Agric Food Chem. 2009;57(11):5106–5112. | ||
Chu JX, Wang ZL, Han SY. The effects of total flavonoids from buckwheat flowers and leaves on renal damage and PTP1B expression in type 2 diabetic rats. Iran J Pharm Res. 2011;10(3):511–517. | ||
Zhang G, Pan A, Zong G, et al. Substituting white rice with brown rice for 16 weeks does not substantially affect metabolic risk factors in middle-aged Chinese men and women with diabetes or a high risk for diabetes. J Nutr. 2011;141(9):1685–1690. | ||
Guo K, Zhang L, Zhao F, et al. Prevalence of chronic kidney disease and associated factors in Chinese individuals with type 2 diabetes: cross-sectional study. J Diabetes Complications. 2016;30(5):803–810. | ||
Levey AS, Coresh J, Bolton K, et al. K/DOQI clinical practice guidelines for chronic kidney disease: evaluation, classification, and stratification. Am J Kidney Dis. 2002;39(2):S1–S266. | ||
Levey AS, Cattran D, Friedman A, et al. Proteinuria as a surrogate outcome in CKD: report of a scientific workshop sponsored by the National Kidney Foundation and the US Food and Drug Administration. Am J Kidney Dis. 2009;54(2):205–226. | ||
Moriya T, Tanaka S, Sone H, et al. Patients with type 2 diabetes having higher glomerular filtration rate showed rapid renal function decline followed by impaired glomerular filtration rate: Japan diabetes complications Study. J Diabetes Complications. Epub 2016 Jun 29:020. | ||
Ma YC, Zuo L, Chen JH, et al. Modified glomerular filtration rate estimating equation for Chinese patients with chronic kidney disease. J Am Soc Nephrol. 2006;17(10):2937–2944. | ||
Aksun SA, Ozmen B, Ozmen D, et al. Serum and urinary nitric oxide in type 2 diabetes with or without microalbuminuria relation to glomerular hyperfiltration. J Diabetes Complications. 2003;17(6):343–348. | ||
Yokozawa T, Kim HY, Nonaka G, Kosuna K. Buckwheat extract inhibits progression of renal failure. J Agric Food Chem. 2002;50(11):3341–3345. | ||
Cheng D, Zhang X, Meng M, et al. Protective effect of buckwheat-enriched diet on renal injury in high salt-induced hypertension in rat. Food Funct. 2016;7(8):3548–3554. |
Supplementary materials
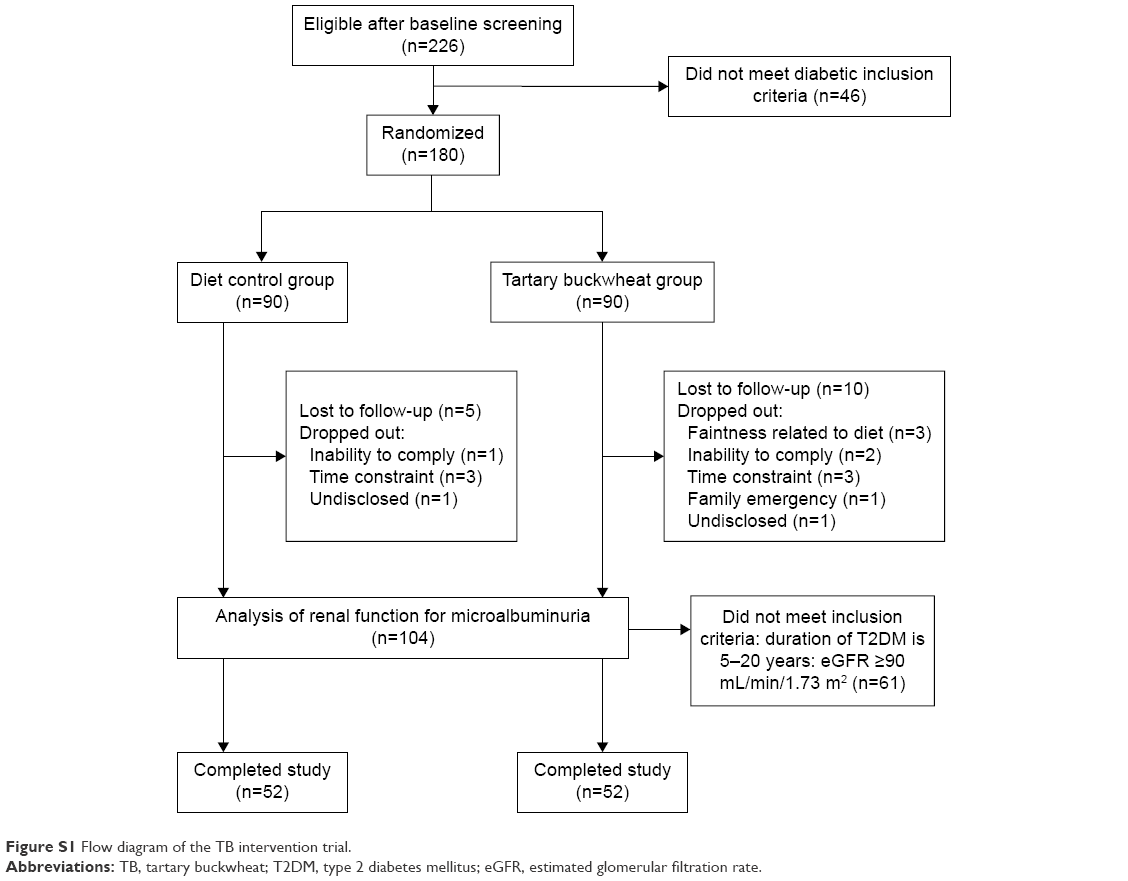 | Figure S1 Flow diagram of the TB intervention trial. |
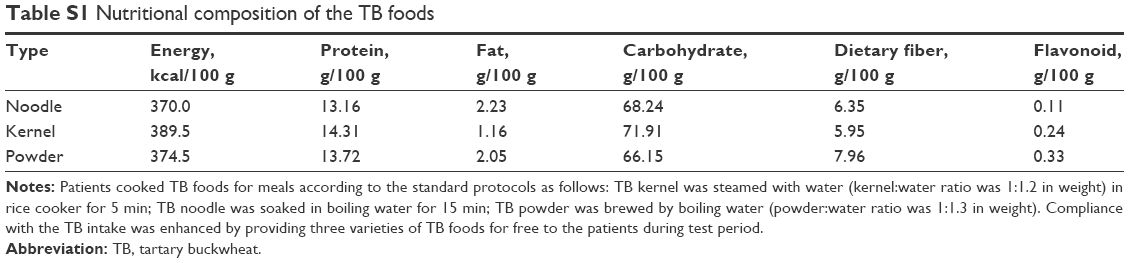 | Table S1 Nutritional composition of the TB foods |
 © 2016 The Author(s). This work is published and licensed by Dove Medical Press Limited. The full terms of this license are available at https://www.dovepress.com/terms.php and incorporate the Creative Commons Attribution - Non Commercial (unported, v3.0) License.
By accessing the work you hereby accept the Terms. Non-commercial uses of the work are permitted without any further permission from Dove Medical Press Limited, provided the work is properly attributed. For permission for commercial use of this work, please see paragraphs 4.2 and 5 of our Terms.
© 2016 The Author(s). This work is published and licensed by Dove Medical Press Limited. The full terms of this license are available at https://www.dovepress.com/terms.php and incorporate the Creative Commons Attribution - Non Commercial (unported, v3.0) License.
By accessing the work you hereby accept the Terms. Non-commercial uses of the work are permitted without any further permission from Dove Medical Press Limited, provided the work is properly attributed. For permission for commercial use of this work, please see paragraphs 4.2 and 5 of our Terms.