")
Back to Journals » Research and Reports in Urology » Volume 9
Prostate MRI prior to radical prostatectomy: effects on nerve sparing and pathological margin status
Authors Druskin SC , Liu JJ, Young A, Feng Z, Dianat SS, Ludwig WW, Trock BJ, Macura KJ, Pavlovich CP
Received 23 November 2016
Accepted for publication 10 March 2017
Published 18 April 2017 Volume 2017:9 Pages 55—63
DOI https://doi.org/10.2147/RRU.S128499
Checked for plagiarism Yes
Review by Single anonymous peer review
Peer reviewer comments 3
Editor who approved publication: Dr Jan Colli
Sasha C Druskin,1 Jen-Jane Liu,2 Allen Young,1 Zhaoyong Feng,1 Seyed S Dianat,3 Wesley W Ludwig,1 Bruce J Trock,1 Katarzyna J Macura,4 Christian P Pavlovich1
1The James Buchanan Brady Urological Institute and Department of Urology, The Johns Hopkins University School of Medicine, Baltimore, MD, 2Department of Urology, Oregon Health and Science University, Portland, OR, 3Department of Radiology, University of Minnesota Twin Cities, Minneapolis, MN, 4Department of Radiology and Radiological Sciences, The Johns Hopkins University School of Medicine, Baltimore, MD, USA
Objectives: The aim of this study was to assess the positive surgical margin (PSM) and nerve sparing (NS) rates in patients who underwent prostate MRI (pMRI) prior to radical prostatectomy (RP) and compare them with matched, nonimaged control RP patients.
Methods: We identified 204 men who underwent preoperative pelvic MRI (pelMRI), of whom 176 (86.3%) underwent pMRIs, within 60 days of RP, and compared them (1:1) with a nonimaged control group matched by surgeon, age, race, body mass index (BMI), prostate-specific antigen (PSA), pathological Gleason score, prostate specimen weight, and RP year.
Results: The rates of nonfocal extracapsular extension (nfECE) on RP pathology in the MRI and control groups were similar. PSM rates were lower in the MRI group (13.7% vs 19.3%; P=0.14), but the difference did not meet statistical significance; this was also the case in patients with nfECE on RP pathology (27.7% vs 39.5%; P=0.3). NS rates were similar between groups. In the MRI group, 54 (26.5%) patients had an MRI suspicious for nfECE; their PSM rate (20.4%) was higher than that of patients with an MRI not suspicious for nfECE (11.3%; P=0.11), but the difference lacked statistical significance; the former group had significantly lower rates of NS. Limitations of the study include sample power and nonuniform heeding of MRI results by each surgeon.
Conclusion: MRI did not significantly decrease the rates of PSM, including in the subset of patients with nfECE on final pathology. Even wider resection may be necessary in patients with MRIs suggesting locally-advanced disease. Studies with greater power are needed.
Keywords: MRI, positive surgical margins, nerve sparing, extracapsular extension, radical prostatectomy
Introduction
Positive surgical margins (PSMs) after radical prostatectomy (RP) may increase the risk of biochemical recurrence (BCR)1 and cancer-specific mortality,2 which has led to guidelines3,4 recommending adjuvant radiation therapy for individuals with PSMs. Minimizing PSMs is thus of importance, though sometimes at odds with other surgical goals, such as preserving continence and potency. These convalescence issues are likely dependent on the preservation of the periprostatic tissues, including the neurovascular bundle (NVB) and investing fascias of the prostate.5–8 PSMs are frequently located at regions of extracapsular extension (ECE),9,10 where preserving pericapsular tissues may leave behind prostate cancer. Preoperative knowledge of the presence and location of ECE may benefit surgical planning, and perhaps minimize PSM, since that information could guide NVB resection on the involved side.
Prostate MRI (pMRI) has shown promise with regard to detecting ECE. pMRI refers to a type of pelvic MRI (pelMRI) in which there is a specific focus on the prostate. It typically includes T1- and T2-weighted images and is referred to as multiparametric MRI (mpMRI) if diffusion-weighted imaging (DWI) and/or dynamic contrast-enhanced (DCE) imaging are/is included. These additional imaging sequences are frequently included since they have a role in defining and characterizing prostate nodules and yield improved assessment of ECE (Figure 1).11 Currently, sensitivities and specificities as high as 75% and 100%, respectively, have been reported for ECE detection by pMRI,12 and in general, it is nonfocal ECE (nfECE) that is detected.13 In 2013, Somford et al14 reported the performance of preoperative pMRI with endorectal coil and a 3.0 T magnet for determining the presence of ECE. The sensitivity/specificity/PPV/NPV for low-, intermediate-, and high -risk groups was 33.3/86.7/33.3/86.7%, 50.0/92.3/90.0/57.1%, and 64.9/72.7/88.9/38.1%, respectively. The sensitivity of pMRI for ECE improved with higher risk disease, and specificity was robust across all risk levels. We hypothesized that preoperative pMRI, by identifying nfECE, would help surgeons plan the periprostatic dissection and potentially decrease the rates of PSM. This is a retrospective study comparing PSM outcomes in a cohort with preoperative pMRI with a matched cohort without preoperative pMRI.
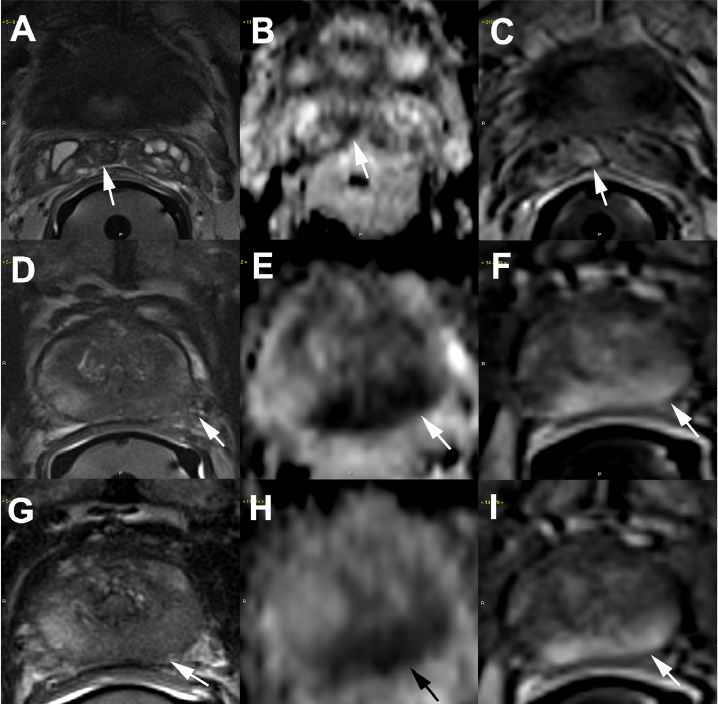 | Figure 1 Example of extracapsular extension detected on multiparametric prostate MRI. Notes: On mpMRI, T2W imaging provides a high-resolution anatomical image of the prostate capsule. ECE is suggested where there is hypointense tumor22 transgressing the prostatic capsule and there is an associated loss of capsular definition.23 DWI and DCE imaging complement the T2W images, and when there are concordant suspicious signal abnormalities on T2W, DWI, and DCE images at the same region, the confidence in cancer localization increases.24 In the peripheral zone, DWI provides further indication of tumor aggressiveness through a quantitative measure of ADC, with decreasing ADC value suggesting a higher likelihood of high-grade cancer and, therefore, a higher risk for ECE.23 The images shown are from an mpMRI performed at 3.0 T with an endorectal coil in a single patient. (A–C) Right seminal vesicle invasion with a dark signal on T2W imaging (arrow; A), a low signal on the DWI–ADC map (arrow; B), and DCE enhancement (arrow; C). (D–F, mid gland; G–I, apex) Left-sided ECE and left neurovascular bundle invasion. On T2W imaging, the tumor is observed to have >2 cm abutment of the capsule along the left lateral posterior mid-apex with capsular blurring and loss of capsular and neurovascular bundle definition (arrows; D and G). The DWI–ADC map shows restricted diffusion (ADC value <900 s/mm2) that involves a large portion of the left peripheral zone mid-apex (arrows; E and H), correlating with the T2 signal abnormality. Corresponding DCE images show matching tumor enhancement (arrows; F and I). Abbreviations: ADC, apparent diffusion coefficient; DCE, dynamic contrast-enhanced; DWI, diffusion-weighted imaging; ECE, extracapsular extension; mpMRI, multiparametric MRI; T2W, T2-weighted. |
Methods
This study was approved by the Institutional Review Board (IRB) of the Johns Hopkins Medical Institutions; the IRB deemed that individual patient consent is not required for retrospective chart review. Compliance with the Health Insurance Portability and Accountability Act was maintained at all times. Data of all patients included were obtained from a prospectively maintained database of all men undergoing RP between 2006 and 2015 at two hospitals serviced by the department. A database search revealed that 204 of these men had undergone preoperative pelMRI, of whom 176 (86.3%) underwent pMRIs, within 60 days before surgery. While 68.1% of the MRIs were conducted at our institution, all outside studies were reviewed by our expert radiologists. A comparison cohort of 204 men who had not undergone pelMRI was constructed from the main RP database and matched with the index cohort by surgeon, age, race, body mass index (BMI), prostate-specific antigen (PSA), pathological Gleason score, prostate specimen weight, and RP year. Simple 1:1 random matching was used to select this control group. After matching, patients from 13 surgeons were included. MRI results were utilized by each surgeon as they saw fit. The studied outcomes included rates of PSM and nerve sparing (NS). Comparisons between groups were made using Wilcoxon–Mann–Whitney and Fisher’s exact tests computed using Stata Version 14.0 (StataCorp, College Station, TX, USA).
Results
Baseline demographic, oncologic, and imaging variables are summarized in Table 1. There were no statistically significant differences between MRI and control groups.
 | Table 1 Baseline characteristics Notes: aExcludes three patients in the control group and three patients in the MRI group with unknown PSA. bExcludes 42 patients in the control group and 31 patients in the MRI group with unknown BMI. cExcludes two patients in the control group and two patients in the MRI group with unknown family history. Abbreviations: BMI, body mass index; DCE, dynamic contrast-enhanced; DWI, diffusion-weighted imaging; LRP, laparoscopic radical prostatectomy; mpMRI, multiparametric MRI; pMRI, prostate MRI; PSA, prostate-specific antigen; RARP, robotic-assisted laparoscopic radical prostatectomy; RRP, (open) retropubic radical prostatectomy . |
Table 2 summarizes the oncologic and surgical outcomes between groups, none of which were significantly different. This holds for both the total pelMRI group and the pMRI subgroup. Rates of any ECE were similar between the groups (pelMRI group 39.2% and control group 34.8%; P=0.4), as were the rates of nfECE (pelMRI group 23.0% and control group 22.1%; P=0.9), indicating adequate matching. Despite these similar rates of ECE, PSM rates in the pelMRI and control groups were statistically similar (13.7% vs 19.3%; P=0.14). This was also the case for the pMRI (12.5%) and control groups (P=0.092). This relationship was also observed when we looked separately at patients with clinical stage T1c disease (11.0% pelMRI group and 18.1% control group; P=0.13) and palpable disease (21.4% pelMRI group and 25.0% control group; P=0.8). In the 90 patients who had nfECE on final pathology, whom we would expect to benefit most from preoperative MRI, those with and without pelMRI had statistically similar rates of PSM (27.7% vs 39.5%; P=0.3). Interestingly, we did not observe significantly lower rates of NS in the pelMRI group when compared with the control group (any NS in 89.7% and optimal NS on at least one side in 84.7% of the pelMRI group vs 91.5% and 88.1% of the control group, respectively; P-values both >0.05) despite MRI readings suggesting nfECE in some of the pelMRI group patients. All of these calculations were repeated for the pMRI group and had similar results.
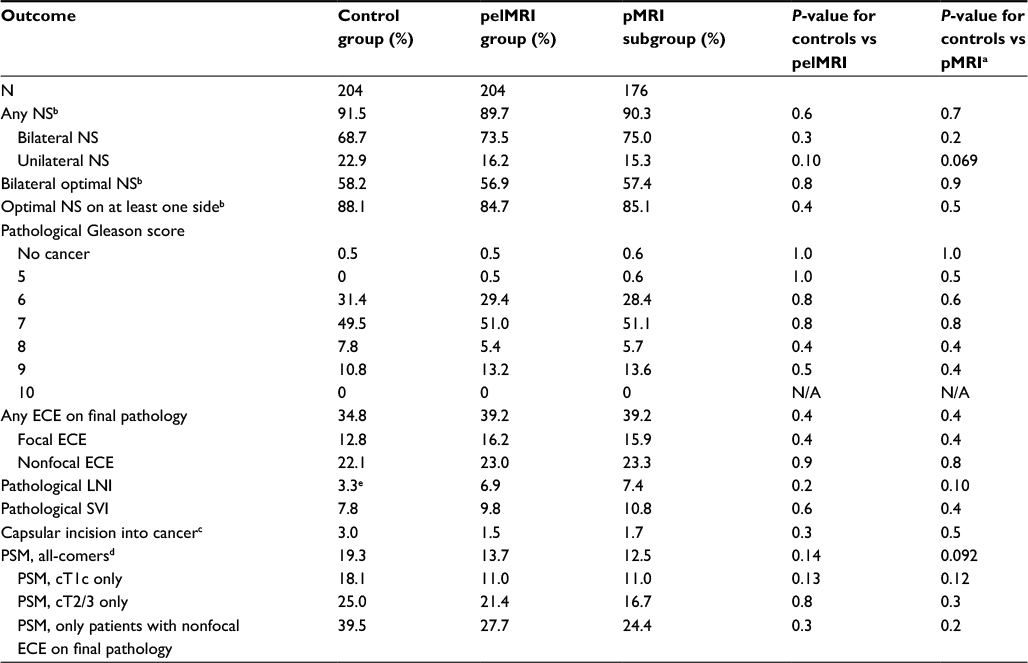 | Table 2 Oncologic and nerve sparing outcomes in the MRI group versus controls Notes: aThe 176 patients with pMRI are here compared with the entire control group (of 204 patients); no rematching was undertaken for this subset analysis. bThe three patients with unknown nerve sparing status were excluded from these analyses. Where applicable, one patient with unilateral nerve sparing but unknown levels of nerve sparing was excluded from analysis as well. cExcludes 10, 5, and 3 patients with unknown capsular incision into cancer status in the control, pelMRI, and pMRI groups, respectively. dOne patient with equivocal margins and one patient with an unknown margin, both in the control group, were excluded from these analyses. eExcludes 23 patients with unknown lymph node invasion. Abbreviations: ECE, extracapsular extension; LNI, lymph node invasion; N/A, not applicable; NS, nerve sparing; pelMRI, pelvic MRI; pMRI, prostate MRI; PSM, positive surgical margin; SVI, seminal vesicle invasion. |
Table 3 summarizes the outcomes of patients with concern for ECE on MRI vs patients without. As expected, those with an MRI concerning for ECE (54 patients) had a higher rate of ECE on final pathology (57.4% vs 32.7%; P=0.002). Focal ECE was similar between the two groups, but nfECE was much higher in the group with MRIs showing concern for ECE (40.7% vs 16.7%; P=0.001), supporting that MRI is useful in identifying only nfECE rather than focal ECE. Those with concern for ECE on MRI had lower rates of NS, including any bilateral NS, bilateral optimal NS, and optimal NS on at least one side. In those with and without concern on MRI for ECE, the rates of PSM were similar (20.4% vs 11.3%; P=0.11). It must be noted, however, that more than one-third of PSMs in the subgroup of men with concern for ECE on MRI occurred at a location different than the ECE suggested on the MRI. We also assessed how unilateral ECE suggested by MRI (which was the case 88.9% of the time) affected NS decisions by the surgeons. The only statistically significant outcome in this regard was optimal NS on the right side, which was present in a greater proportion (80.8%) of patients with concern on MRI for ECE on only the left side compared to those with MRIs suggesting only right-sided ECE (50%) (P=0.034).
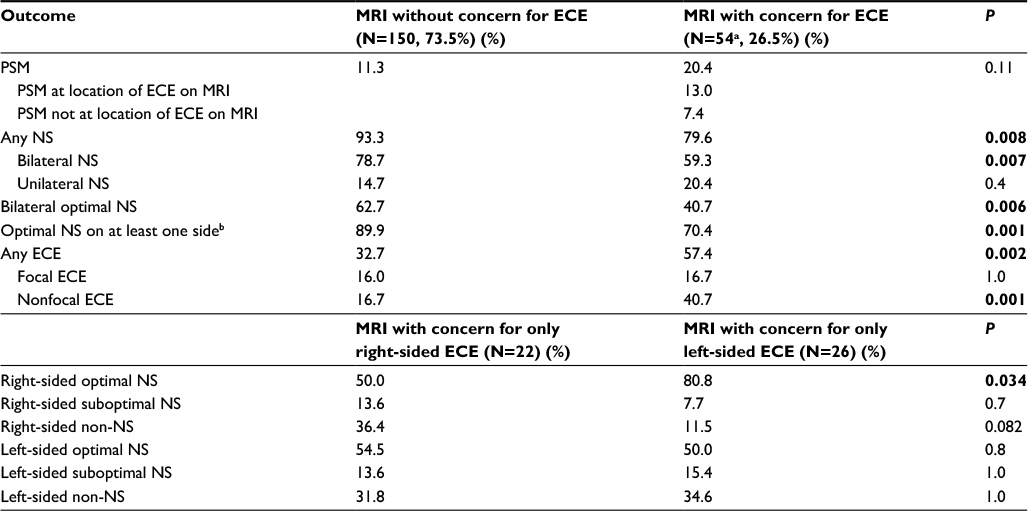 | Table 3 Outcomes in those with and without concern for extracapsular extension on MRI Notes: aIn total, 88.9% had unilateral ECE; 96.3% of MRIs were pMRIs. bOne patient with unilateral nerve sparing but unknown levels of nerve sparing was excluded from analysis. Significant P-values (<0.05) are shown in bold. Abbreviations: ECE, extracapsular extension; NS, nerve sparing; PSM, positive surgical margin. |
Finally, Table 4 summarizes the performance characteristics of pelMRI (again, 86.3% of which are pMRI) to detect nfECE. The sensitivity was 33.9%, the specificity was 89.0%, the PPV was 35.6%, and the NPV was 88.2%.
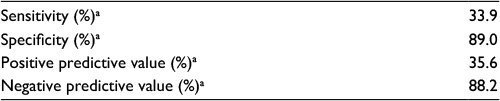 | Table 4 The performance of pelvic MRI to detect nonfocal extracapsular extension Note: aMRI performance was calculated by determining the 2¥2 contingency tables for pelvic MRI to detect nonfocal ECE on the right and left sides of the prostate independently, using nonfocal ECE on final pathology as the “gold standard”, and combining the corresponding segments of the two 2¥2 contingency tables. Thus, pelvic MRI was tested for its ability to detect ECE twice in each patient, once on the right side and once on the left side. One patient with nonfocal ECE but without information on location of the ECE was excluded from analysis. Abbreviation: ECE, extracapsular extension. |
Discussion
Several studies have, to our knowledge, examined PSM rates and/or NS after preoperative pMRI, but none except the present retrospective comparative analysis and the recent randomized controlled trial (RCT) by Rud et al15 have included a nonimaged comparison group.
In 1996, D’amico et al16 published a study of 445 men having RP after a 1.5 T MRI with endorectal coil and found that ECE on MRI was associated with PSM on multivariate analysis. In 2007, Zhang et al17 reported on 110 men undergoing RP after MRI and found that having ECE on MRI was not associated with having a PSM, a finding echoed by McClure et al18 and Roethke et al,19 suggesting that surgeons are resecting tissue more widely on sides of MRI-demonstrated ECE. Meanwhile, Brown et al20 reported on 62 patients undergoing RP after MRI with endorectal coil and suggested that ECE on MRI did not affect the rates of bilateral NS in this very small cohort. Finally, in 2015, Rud et al15 reported a landmark single-institution RCT of 438 patients undergoing RARP by one of the four surgeons, in which half of the patients underwent 1.5 T mpMRI without endorectal coil or DCE. There was no statistically significant difference in the rates of PSM between the MRI and no-MRI groups when looking at all-comers, a similar result to our study. For patients with cT1 disease, however, they found a 41% relative risk reduction of PSM in the MRI group (P=0.035), despite their finding of similar rates of NS between the groups. Those with cT2/3 disease had similar rates of PSM whether imaged or not, even though the imaged group had less NS (wider excisions) performed. A large proportion of PSMs (89%) were caused by a dominant (index) tumor, more often than not associated with ECE, and almost all of these dominant lesions (98%) were detected by MRI, suggesting that even wider excisions are necessary to lower PSM rates.
The RCT by Rud et al15 was a significant contribution to the literature, though patients were imaged at 1.5 T. The present study adds to it by examining, for the first time, a contemporary MRI-imaged cohort using primarily (~80%) 3 T pMRI. Despite the 3 T MRI imaging protocol, we also did not find any statistically significant difference in PSM between those who did and those who did not have a preoperative MRI, just as in the trial of Rud et al.15 We did not find any significant difference in PSM rates when stratifying by clinical stage either. One reason for this lack of a significant difference may be due to insufficient heeding of the MRI results by the surgeons; in other words, surgeons may not be resecting widely enough in areas suspicious for advanced disease on MRI. This is illustrated by the fact that of the 54 patients with ECE on MRI, 13% had a PSM at the location of the ECE on MRI. More aggressive resection at those sights may have reduced the rate of PSM. Alternatively, limited sample size may account for this lack of statistical significance. We estimate that a sample size of 510 per group would be necessary to show a significant difference, using an alpha of 0.05 and a power of 0.8 for this two-sample one-sided test of proportions. Certainly, post hoc power calculations are subject to error;21 this information nonetheless aids in future study design.
We also did not find a statistically significant difference in the rates of PSM within the MRI group between those with MRIs suggesting ECE and those with MRIs not suggesting ECE. Surgeons resected more of the NVB when ECE was demonstrated on MRI and, thus, may have brought down the PSM rate in such higher risk patients to approach that of lower risk patients. Underpowering may also be contributing to this lack of statistical significance.
On the diagnostic performance of MRI to detect nfECE, MRI detected ECE in 26.5% of the patients, and on final pathology, 39.2% of those patients had ECE, over half of whom had nfECE. Despite a similar percentage of nfECE on final pathology and ECE detected on MRI, MRI was poorly sensitive (33.9%) for nfECE but rather specific (89.0%), which may in part be due to MRI detecting ECE on one side of the prostate but not on the other side in cases of bilateral nfECE. Nonetheless, this sensitivity is similar to that observed in low-risk patients in the trial by Somford et al14 but inferior to the performance of MRI observed in the higher risk groups in that study. This may be due to study heterogeneity and contamination of the MRI group by the 13.7% of patients who received a non-pMRI pelMRI discussed later. In addition, >93% of MRI patients were clinically gland confined, illustrating that ECE is challenging to diagnose on clinical examination. Preoperative imaging appears to be a more useful tool for detecting ECE, despite its limited performance.
This study is not without its limitations. First, there is considerable heterogeneity in our cohort, with regard to disease aggressiveness, surgery type, and MRI type. While that heterogeneity may contribute to our lack of statistically significant findings, it is in some ways a strength of the study since it represents a “real-world” cohort with minimal selection bias. Of those who had a pelMRI, 13.7% (28 patients) did not receive a pMRI but instead had an MRI of the pelvis that included the prostate. pelMRI without a specific prostate focus (ie, without being a pMRI) is expected to have subpar ability to diagnose ECE and thus may be diluting our performance calculations, as mentioned earlier. Nonetheless, this does again portray the real-world scenario, where many patients are referred in to a tertiary care center with imaging performed at various locations. We believe that this study is marginally limited by this small number of patients who had non-pMRI pelMRI. Indeed, subset analysis of the pMRI-only subgroup (Table 2) shows similar results to calculations using the full pelMRI cohort. Second, each surgeon’s technique and skill level, as well as the degree to which they heeded the results of the MRI, are likely to be variable and this likely had an effect on the PSM and NS rates observed in this study. We attempted to correct for this variability by matching our cohorts by surgeon, so while the absolute rates of PSM and NS may not be generalizable since they may be surgeon specific, the comparison between the MRI and non-MRI groups takes into account this variability between surgeons. Third, we discovered several differences between patients undergoing RRP vs RARP (Tables S1 and S2). Patients in the RRP group had higher PSA and lower degrees of NS. However, since the control and MRI groups each had roughly equivalent proportions of patients undergoing RRP and RARP, we believe that the inclusion of both RRP and RARP group patients in our study should have minimal effect on our conclusions. Fourth, as noted earlier, sample size may have been a limiting factor.
Conclusion
With the added information afforded by MRI, one would expect lower rates of PSM than those in a matched, oncologically similar, nonimaged comparison group, which was not observed, including in the subset of patients with nfECE on final pathology. Furthermore, we observed several PSMs in regions where MRI suggested ECE. These findings suggest that even wider resection may be necessary in patients with preoperative MRIs suggestive of locally-advanced disease. The study was limited by patient sample size and heterogeneity. Our findings support the continued need for investigating the utility of preoperative MRI, using the latest MRI technology in larger cohorts of men.
Acknowledgments
We acknowledge Dr. Alan W. Partin, Dr. Misop Han, and Ms. Elizabeth Humphreys from The James Buchanan Brady Urological Institute and Department of Urology at The Johns Hopkins University School of Medicine, Baltimore, MD, USA, for assistance with this study. The abstract of this paper was presented as a poster at the 31st Annual Meeting of the Engineering and Urology Society on May 7, 2016, in San Diego, CA, USA. The abstract was published in the Journal of Endourology.
This study was supported by NIH SPORE grant P50CA58236. It was performed at The James Buchanan Brady Urological Institute and Department of Urology and Department of Radiology and Radiological Sciences at The Johns Hopkins University School of Medicine, Baltimore, MD, USA.
Disclosure
The authors report no conflicts of interest in this work.
References
Yossepowitch O, Briganti A, Eastham JA, et al. Positive surgical margins after radical prostatectomy: a systematic review and contemporary update. Eur Urol. 2014;65(2):303–313. | ||
Wright JL, Dalkin BL, True LD, et al. Positive surgical margins at radical prostatectomy predict prostate cancer specific mortality. J Urol. 2010;183(6):2213–2218. | ||
Mohler JL, Antonarakis ES, Armstrong AJ, et al. NCCN Clinical Practice Guidelines in Oncology – Prostate Cancer; 2017. Available from: http://www.nccn.org/professionals/physician_gls/pdf/prostate.pdf. Accessed February 7, 2017. | ||
American Urological Association. Adjuvant and Salvage Radiotherapy after Prostatectomy: ASTRO/AUA Guideline. Available from: https://www.auanet.org/common/pdf/education/clinical-guidance/Radiation-After-Prostatectomy.pdf. Accessed September 26, 2016. | ||
Tewari AK, Srivastava A, Huang MW, et al. Anatomical grades of nerve sparing: a risk-stratified approach to neural-hammock sparing during robot-assisted radical prostatectomy (RARP). BJU Int. 2011;108(6 pt 2):984–992. | ||
Tewari AK, Ali A, Metgud S, et al. Functional outcomes following robotic prostatectomy using athermal, traction free risk-stratified grades of nerve sparing. World J Urol. 2013;31(3):471–480. | ||
Reeves F, Preece P, Kapoor J, et al. Preservation of the neurovascular bundles is associated with improved time to continence after radical prostatectomy but not long-term continence rates: results of a systematic review and meta-analysis. Eur Urol. 2015;68(4):692–704. | ||
Moskovic DJ, Alphs H, Nelson CJ, et al. Subjective characterization of nerve sparing predicts recovery of erectile function after radical prostatectomy: defining the utility of a nerve sparing grading system. J Sex Med. 2011;8(1):255–260. | ||
Johnson MT, Ramsey ML, Ebel JJ, Abaza R, Zynger DL. Do robotic prostatectomy positive surgical margins occur in the same location as extraprostatic extension? World J Urol. 2014;32(3):761–767. | ||
Kang YJ, Abalajon MJ, Jang WS, et al. Association of anterior and lateral extraprostatic extensions with base-positive resection margins in prostate cancer. PLoS One. 2016;11(7):e0158922. | ||
Bloch BN, Furman-Haran E, Helbich TH, et al. Prostate cancer: accurate determination of extracapsular extension with high-spatial-resolution dynamic contrast-enhanced and T2-weighted MR imaging – initial results. Radiology. 2007;245(1):176–185. | ||
Oon SF, Power SP, Kelly JS, McDermott V, Ryan P, Ryan PC. The accuracy of magnetic resonance imaging in prostate cancer staging: a single-institution experience. Ir J Med Sci. 2015;184(2):313–317. | ||
Feng TS, Sharif-Afshar AR, Smith SC, et al. Multiparametric magnetic resonance imaging localizes established extracapsular extension of prostate cancer. Urol Oncol. 2015;33(3):109.e15–109.e22. | ||
Somford DM, Hamoen EH, Fütterer JJ, et al. The predictive value of endorectal 3 Tesla multiparametric magnetic resonance imaging for extraprostatic extension in patients with low, intermediate and high risk prostate cancer. J Urol. 2013;190(5):1728–1734. | ||
Rud E, Baco E, Klotz D, et al. Does preoperative magnetic resonance imaging reduce the rate of positive surgical margins at radical prostatectomy in a randomised clinical trial? Eur Urol. 2015;68(3):487–496. | ||
D’Amico AV, Whittington R, Malkowicz SB, et al. Critical analysis of the ability of the endorectal coil magnetic resonance imaging scan to predict pathologic stage, margin status, and postoperative prostate-specific antigen failure in patients with clinically organ-confined prostate cancer. J Clin Oncol. 1996;14(6):1770–1777. | ||
Zhang JQ, Loughlin KR, Zou KH, Haker S, Tempany CMC. Role of endorectal coil magnetic resonance imaging in treatment of patients with prostate cancer and in determining radical prostatectomy surgical margin status: report of a single surgeon’s practice. Urology. 2007;69(6):1134–1137. | ||
McClure TD, Margolis DJA, Reiter RE, et al. Use of MR imaging to determine preservation of the neurovascular bundles at robotic-assisted laparoscopic prostatectomy. Radiology. 2012;262(3):874–883. | ||
Roethke MC, Lichy MP, Kniess M, et al. Accuracy of preoperative endorectal MRI in predicting extracapsular extension and influence on neurovascular bundle sparing in radical prostatectomy. World J Urol. 2013;31(5):1111–1116. | ||
Brown JA, Rodin DM, Harisinghani M, Dahl DM. Impact of preoperative endorectal MRI stage classification on neurovascular bundle sparing aggressiveness and the radical prostatectomy positive margin rate. Urol Oncol. 2009;27(2):174–179. | ||
Noordzij M, Tripepi G, Dekker FW, Zoccali C, Tanck MW, Jager KJ. Sample size calculations: basic principles and common pitfalls. Nephrol Dial Transplant. 2010;25(5):1388–1393. | ||
ACR. Prostate Imaging – Reporting and Data System, Version 2; 2015. Available from: https://www.acr.org/~/media/ACR/Documents/PDF/QualitySafety/Resources/PIRADS/PIRADS%20V2.pdf. Accessed November 23, 2016. | ||
Woo S, Cho JY, Kim SY, Kim SH. Extracapsular extension in prostate cancer: added value of diffusion-weighted MRI in patients with equivocal findings on T2-weighted imaging. AJR Am J Roentgenol. 2015;204(2):W168–W175. | ||
Fütterer JJ, Engelbrecht MR, Huisman HJ, et al. Staging prostate cancer with dynamic contrast-enhanced endorectal MR imaging prior to radical prostatectomy: experienced versus less experienced readers. Radiology. 2005;237(2):541–549. |
Supplementary materials
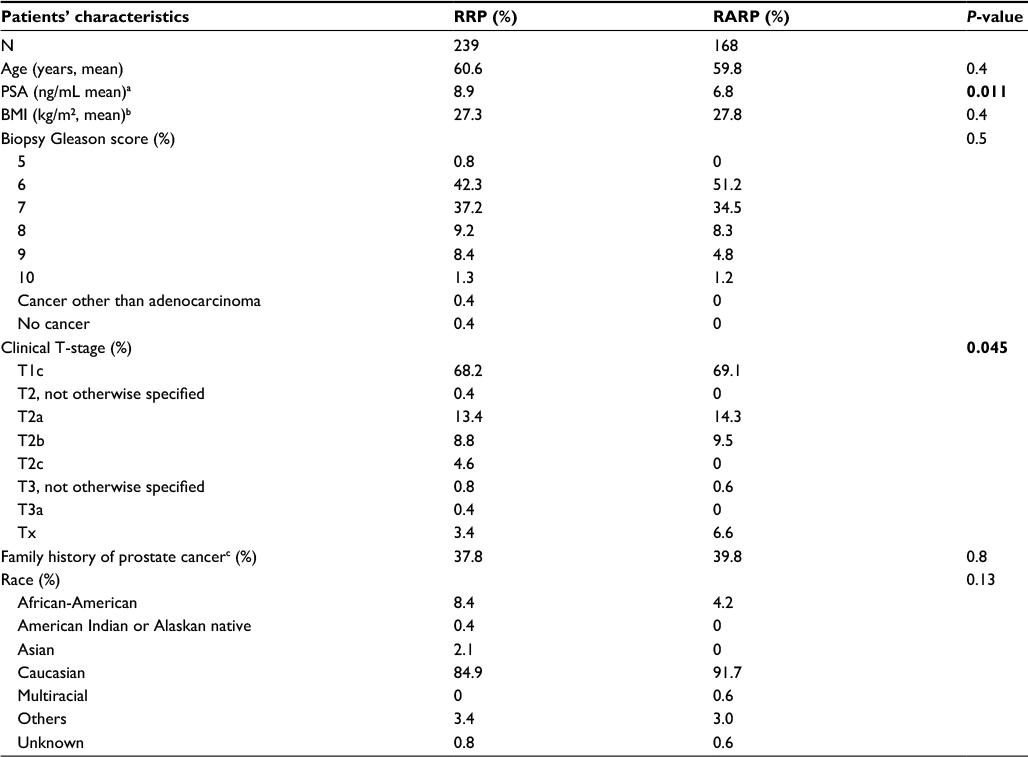 | Table S1 Patients’ characteristics by surgery type: robotic-assisted laparoscopic vs open retropubic radical prostatectomy Notes: aExcludes two patients in the RRP group and four patients in the RARP group with unknown PSA. bExcludes 53 patients in the RRP group and 20 patients in the RARP group with unknown BMI. cExcludes one patient in the RRP group and two patients in the RARP group with unknown family history. Significant P-values (<0.05) are shown in bold. Abbreviations: BMI, body mass index; PSA, prostate-specific antigen; RARP, robotic-assisted laparoscopic radical prostatectomy; RRP, (open) retropubic radical prostatectomy. |
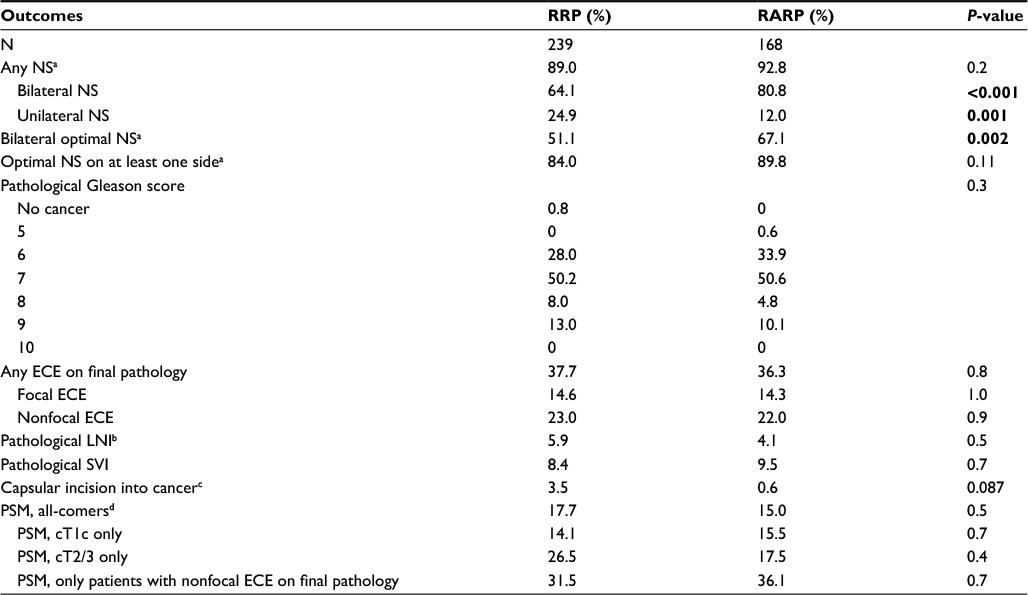 | Table S2 Pathological and surgical outcomes by surgery type: robotic-assisted laparoscopic vs open retropubic radical prostatectomy Notes: aThe three patients with unknown nerve sparing status were excluded from these analyses. Where applicable, one patient with unilateral nerve sparing but unknown levels of nerve sparing was excluded from analysis as well. bExcludes two patients in the RRP group and 21 patients in the RARP group with unknown lymph node invasion. cExcludes nine patients in the RRP group and six patients in the RARP group with unknown capsular incision into cancer status. dOne patient with equivocal margins (RRP group) and one patient with an unknown margin (RARP group) were excluded from these analyses. Significant P-values (<0.05) are shown in bold. Abbreviations: ECE, extracapsular extension; LNI, lymph node invasion; NS, nerve sparing; PSM, positive surgical margin; RARP, robotic-assisted laparoscopic radical prostatectomy; RRP, (open) retropubic radical prostatectomy; SVI, seminal vesicle invasion. |
 © 2017 The Author(s). This work is published and licensed by Dove Medical Press Limited. The full terms of this license are available at https://www.dovepress.com/terms.php and incorporate the Creative Commons Attribution - Non Commercial (unported, v3.0) License.
By accessing the work you hereby accept the Terms. Non-commercial uses of the work are permitted without any further permission from Dove Medical Press Limited, provided the work is properly attributed. For permission for commercial use of this work, please see paragraphs 4.2 and 5 of our Terms.
© 2017 The Author(s). This work is published and licensed by Dove Medical Press Limited. The full terms of this license are available at https://www.dovepress.com/terms.php and incorporate the Creative Commons Attribution - Non Commercial (unported, v3.0) License.
By accessing the work you hereby accept the Terms. Non-commercial uses of the work are permitted without any further permission from Dove Medical Press Limited, provided the work is properly attributed. For permission for commercial use of this work, please see paragraphs 4.2 and 5 of our Terms.