")
Back to Journals » Journal of Pain Research » Volume 11
Prospective one-year follow-up of lumbar spinal stenosis in a regional community
Authors Otani K , Kikuchi S, Yabuki S , Onda A, Nikaido T , Watanabe K , Konno S
Received 5 August 2017
Accepted for publication 8 December 2017
Published 2 March 2018 Volume 2018:11 Pages 455—464
DOI https://doi.org/10.2147/JPR.S148402
Checked for plagiarism Yes
Review by Single anonymous peer review
Peer reviewer comments 4
Editor who approved publication: Professor E Alfonso Romero-Sandoval
Koji Otani, Shin-Ichi Kikuchi, Shoji Yabuki, Akira Onda, Takuya Nikaido, Kazuyuki Watanabe, Shin-Ichi Konno
Department of Orthopaedic Surgery, Fukushima Medical University School of Medicine, Fukushima, Japan
Purpose: Lumbar spinal stenosis (LSS) is a common condition in the aging population. However, limited information exists on discrepancies between LSS symptoms and imaging findings and/or prognostic factors of LSS, as well as the relationship between changes in LSS symptoms and quality of life (QoL) during the natural course of LSS. The purpose of the current study was to clarify any changes in clinically diagnosed LSS at a one-year follow-up, and identify its prognostic factors, using a community-dwelling cohort.
Participants and methods: In this study, the presence of LSS, its associated comorbidities, and the status of QoL pertaining to general health and low-back pain were assessed in 1,080 community-dwelling volunteers. The same assessment was carried out a year after the initial survey. Clinically diagnosis as LSS (LSS-positive) was determined by a validated diagnostic support tool in the form of a self-administered, self-reported history questionnaire. QoL was assessed using the 36-Item Short Form Health Survey and the Roland–Morris Disability Questionnaire.
Results: Among subjects who were LSS-positive in the initial assessment, 54% were clinically diagnosed as negative for LSS (LSS-negative) after the one-year period, whereas 10% of those who were initially diagnosed as LSS-negative changed to LSS-positive during the same period. With the improvement or deterioration of LSS-positive/negative status, low-back pain-related QoL and some components of the 36-Item Short Form Health Survey similarly improved or deteriorated. Decisive prognostic factors of LSS-positive status were not determined at the one-year follow-up.
Conclusion: Approximately half of the subjects who had initially been diagnosed as LSS-positive converted to LSS-negative after one year. Prognostic factors of LSS-positive diagnosis after one-year follow-up were not detected.
Keywords: epidemiology, natural history, quality of life, prognostic factors, comorbidities
Introduction
Lumbar spinal stenosis (LSS) is a common condition in the elderly,1–4 and there have been several studies in clinics or hospitals on its time course.5–12 Although clinical symptoms in such settings are usually expected to be more severe in comparison to those in a community setting, these studies have reported that LSS symptoms did not progress in approximately half of the patients who received conservative treatment. On the other hand, only a few reports exist on the time course of LSS in a regional community. In 2013, we reported a cross-sectional study on the relationship between LSS symptoms and quality of life (QoL) in community-dwelling individuals.4 The purpose of the current study was to clarify any changes in LSS and prognostic factors of LSS at the one-year follow-up in the same community-dwelling cohort.
Participants and methods
This study was approved by the ethics committee of Fukushima Medical University.
Participants
In 2004, 1,754 people (636 males and 1,118 females) aged 40 or older agreed to be interviewed and to participate in this study. Participants were recruited from the respondents to an announcement of assessment of LSS that was part of a public health survey being conducted by their local governments. All participants were self-sufficient (living in their own houses without the need for supplemental care and walking independently with or without support such as a cane or a walker).4 A year later, in 2005, 1,080 participants (375 males and 705 females) could be followed-up and re-interviewed (follow-up rate 61.6%). These participants comprised 15.9% of the combined local population of Tadami town, Tateiwa village, and Ina village in Fukushima Prefecture, Japan. Those conducting follow-up interviews were blinded to baseline data. Both, in 2004 and 2005, all participants provided written informed consent.
Assessment
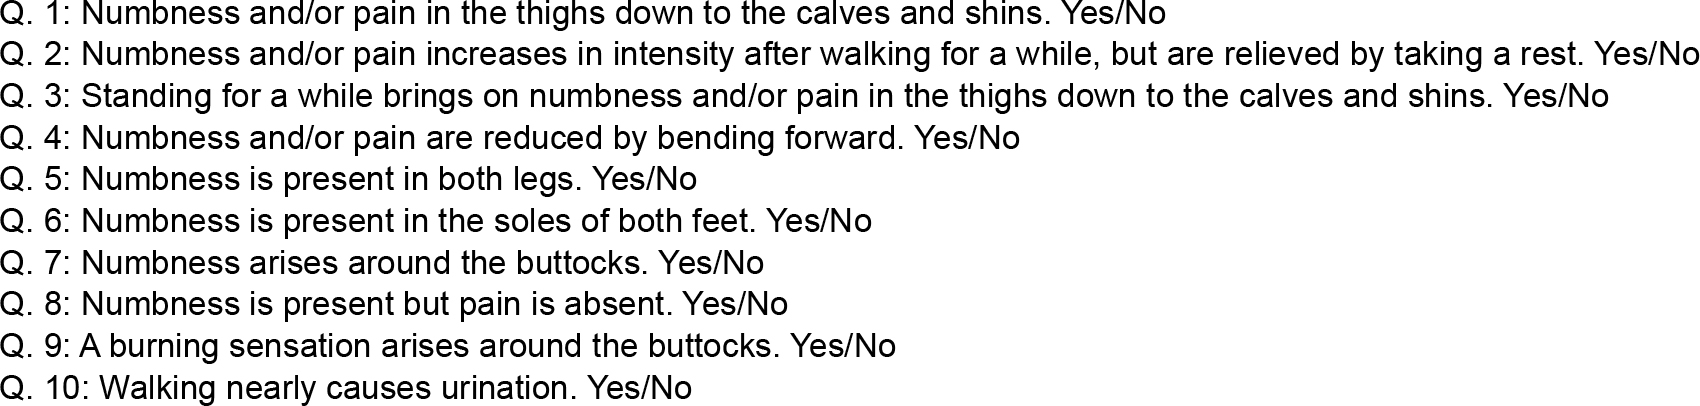
The presence of LSS was determined by a validated LSS diagnostic support tool, which is a self-administered, self-reported history questionnaire (LSS-SSHQ, Figure S1).13 The 36-Item Short Form Health Survey (SF-36) (Japanese version)14–16 and the Roland–Morris Disability Questionnaire (RDQ; Japanese version)17–19 were also used to measure general health-related QoL (HR-QoL) and low-back pain-related QoL (LBP-related QoL), respectively. Higher RDQ scores mean worse LBP-related QoL. The LSS-SSHQ, SF-36, and RDQ scores were collected by each questionnaire in 2004 and 2005. Six experienced public health nurses asked all participants in the 2004 interview whether they had received treatment for hypertension, cardiovascular disease, cerebrovascular disease, respiratory disease, or diabetes mellitus as comorbidities. In addition, all participants were assessed for their smoking status, and their pack-years were calculated.
We assessed depressive symptoms using the mental health (MH) scores from the SF-36, based on the four grades suggested by Yamazaki et al.20 An MH score of <52 was considered severe, 52–59 as moderate, 60–67 as mild, and ≥68 as none.
Ten experienced orthopedic surgeons assessed the presence of osteoarthritis (OA) of the knee and hip using Altman’s criteria.21,22 To achieve better accuracy, before the assessment, an investigator provided all physicians guidance on how to judge the presence of hip and knee OA using Altman’s criteria.4
Inclusion/exclusion criteria
Participants aged 40 and older were considered eligible for this study, including those with a history of cerebral infarction or bleeding. Participants were excluded if they were unable to walk independently, fill out questionnaires due to visual impairment, had ever undergone brain or spinal surgery, or had experienced a fracture of the lower extremities in the year preceding the start of the study period.
Statistical analysis
The Mann–Whitney U test was used to analyze the difference or change of RDQ score and eight SF-36 components between those who were clinically diagnosed as the LSS (LSS-positive) group and those who were not (LSS-negative) at the beginning and end of the one-year period. Related factors of LSS were analyzed using data collected in 2004 through multiple logistic regression analysis. Furthermore, predictive factors for the development of LSS in 2005 were examined using the same analysis with the following independent variables: gender, age, body mass index (BMI), RDQ score, knee OA, hip OA, treatment for hypertension, cardiovascular disease, cerebrovascular disease, respiratory disease, diabetes mellitus, smoking (pack-years), and depressive symptoms.
Risk ratios of the occurrence of LSS-positive at the one-year follow-up were estimated by comparing participants who answered “yes” to one or more of Q1–6 in the LSS-SSHQ (excluding those who were diagnosed as LSS-positive) and those who gave no positive answers. Questions 1–6 in the LSS-SSHQ evaluate leg symptoms (characteristics of leg pain and numbness).
All statistical analyses were conducted using the StatView software package (version 5.0; SAS Institute Inc., Cary, NC, USA). A p-value of less than 0.05 was considered indicative of statistically significance.
Results
Participants
Age, gender, BMI, as well as prevalence of knee and hip OA, comorbidities, smoking, and depression were proportionally similar between the 1,754 participants in 2004 to those of the 1,080 participants followed-up in 2005 (Tables 1 and 2). The follow-up rate was 61.6%.
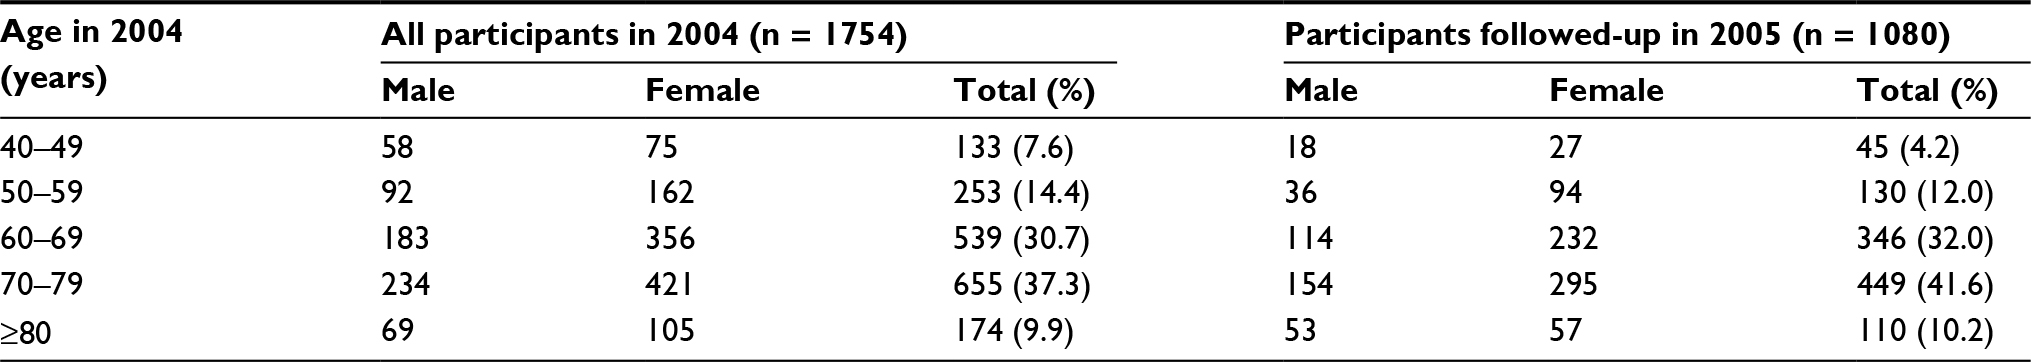 | Table 1 Proportion of participants in 2004 (initial assessment) and in 2005 (one-year follow-up) by age groups Note: There was no difference in proportion by age and gender between participants in the initial and one-year follow-up groups. |
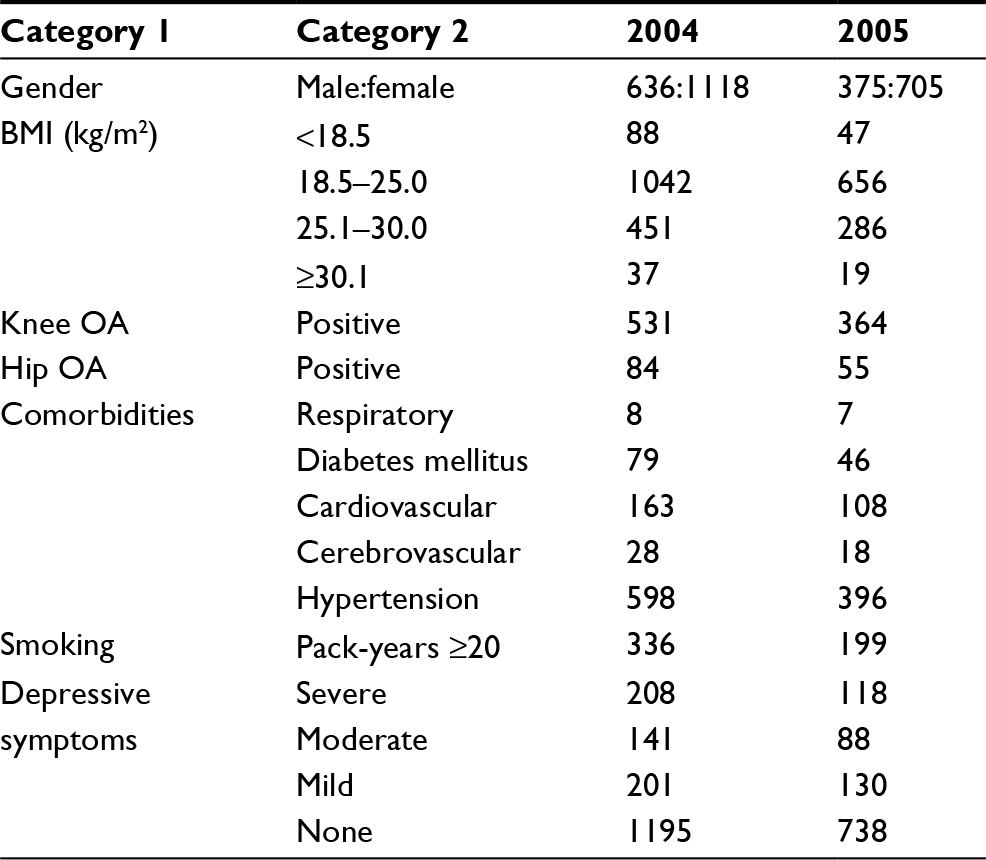 | Table 2 Demographic data in the 2004 and 2005 Note: Proportions of almost all demographic data in 2004 and 2005 were similar except for respiratory disease. Abbreviations: BMI, body mass index; OA, osteoarthritis. |
Time course of LSS-positive and LSS-negative groups
With regard to the 1,080 participants who underwent the assessment, both in 2004 and 2005, 269 subjects (25%) fell in the LSS-positive group and 811 (75%) in the LSS-negative group in 2004; however, in 2005, 207 subjects (19%) fell in the LSS-positive group and 873 (81%) in the LSS-negative group. In 2005, 124 of the 269 subjects (46%) in the LSS-positive group were still categorized into the LSS-positive group, whereas 145 subjects (54%) were categorized into the LSS-negative group. Among these 145 subjects, only 49 answered negatively to all 10 of the LSS-SSHQ questions, and 96 had some positive symptoms but did not meet the criteria for being clinically diagnosed as LSS by the LSS-SSHQ. On the other hand, 728 of the 811 subjects (90%) in the 2004 LSS-negative group remained in the LSS-negative group in 2005, whereas the remaining 83 subjects (10%) were re-categorized into the LSS-positive group (Figure 1). The time-course pattern of the LSS-positive group varied with age. For example, the prevalence of LSS decreased (LSS-positive in 2004 and LSS-negative in 2005) by approximately 50% in subjects in their 60s and 70s, which was much lower than that in subjects in their 50s and 80s. However, the prevalence of LSS-positive in octogenarians was much higher than in any other age (21.2% in 80s vs 2.5%–10.0% in other decades; Table 3). There was no statistically significant relationship between gender and the time course of the LSS-positive and LSS-negative groups (data not shown).
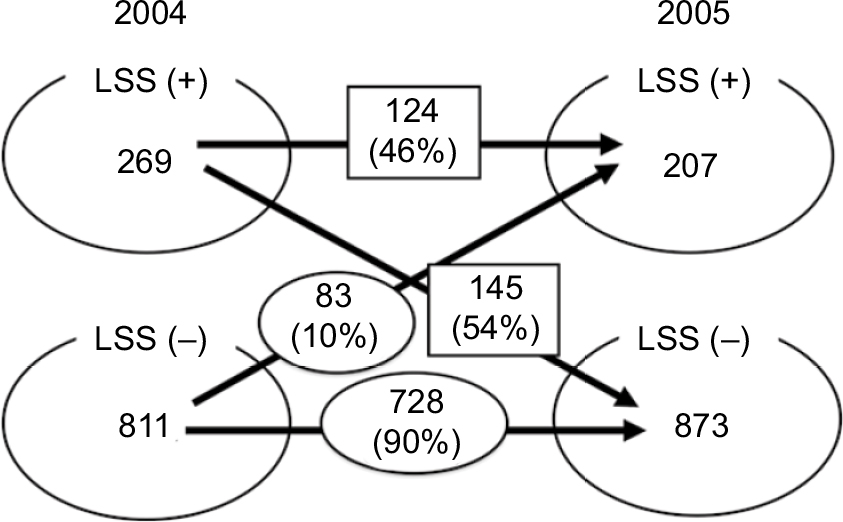 | Figure 1 Time course of LSS-positive and LSS-negative groups. Notes: LSS-positive group in 2004: 46% remained LSS-positive group in 2005, whereas 54% were reclassified as the LSS-negative group. On the other hand, 90% of the LSS-negative group in 2004 were still in the LSS-negative group in 2005, with the other 10% being reclassified as LSS-positive group. Abbreviation: LSS, lumbar spinal stenosis. |
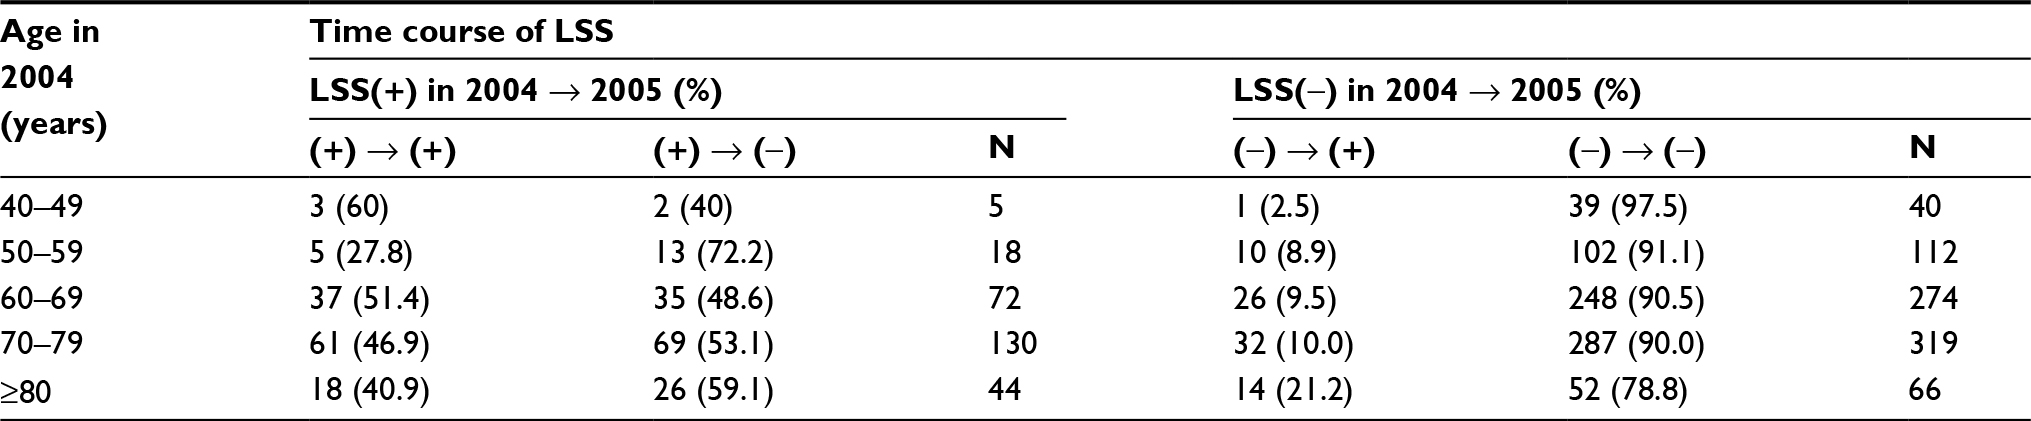 | Table 3 Time course of LSS-positive and LSS-negative by age group Notes: There was no tendency for improvement from LSS-positive in 2004 to LSS-negative in 2005 with age. On the other hand, the prevalence of LSS-positive in 2005 from LSS-negative in 2004 increased with age. Abbreviation: LSS, lumbar spinal stenosis. |
No lumbar operations were undertaken during the one-year period.
Changes in LBP-related QoL with time course of LSS-positive and LSS-negative groups
The RDQ score in the LSS-positive group was much higher than in the LSS-negative group (LSS-positive: 7.2 ± 5.7, LSS-negative: 2.6 ± 4.0, p < 0.0001) in 2004. However, in subjects who switched from the positive to the negative group in 2005, the RDQ score improved to 4.2 ± 5.0 (p < 0.0001; Table 4). Similarly, in subjects who moved from the negative to the positive group in 2005, the RDQ score worsened (2.6 ± 4.0 in 2004, 4.9 ± 5.4 in 2005, p < 0.0001; Table 3). The RDQ score of subjects who remained in the same group in 2005 did not show any change (Table 4). This supports the RDQ as being able to assess the relationship between improvement and worsening of LSS-positive and LSS-negative and the improvement and worsening of LBP-related QoL.
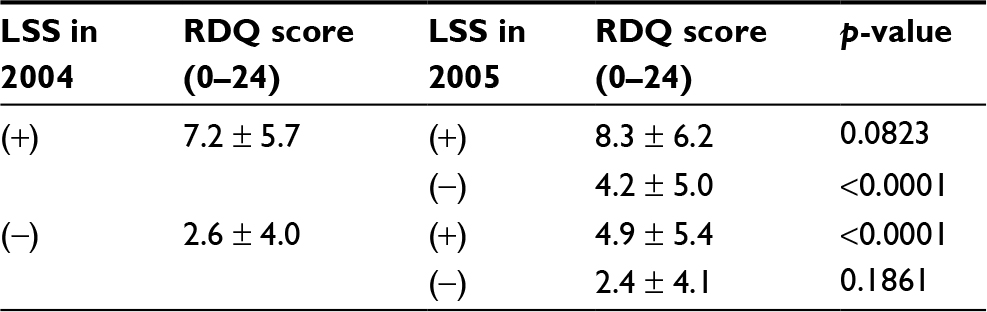 | Table 4 Changes in LSS-positive/negative and RDQ(1) Notes: Values are presented as mean ± SD. The RDQ score improved with an improvement from LSS-positive in 2004 to LSS-negative in 2005. Similarly, the occurrence of LSS-positive in 2005 from LSS-negative in 2004 increased with worsening of the RDQ score. Abbreviations: LSS, lumbar spinal stenosis; RDQ, Roland–Morris Disability Questionnaire; SD, standard deviation. |
From a time-course point of view, those with LSS-negative in 2005 showed a statistically lower RDQ score in 2004 (6.2 ± 5.3) than those who were LSS-positive in both 2004 and 2005 (8.3 ± 5.9; p = 0.0021; Table 5). Subjects who were LSS-positive in 2005, but negative in 2004, showed a statistically higher RDQ score in 2004 (4.0 ± 4.4) than those who were LSS-negative in both 2004 and 2005 (2.5 ± 3.9; p = 0.0011; Table 5).
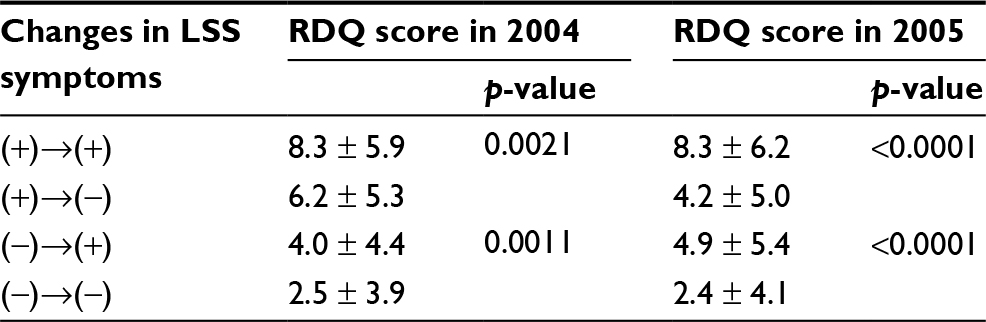 | Table 5 Changes in LSS-positive/negative and RDQ(2) Notes: Values are presented as mean ± SD. In the LSS-positive group in 2004, the RDQ score of those with LSS-negative in 2005 was statistically lower than those who remained LSS-positive in 2005. Similarly, in the LSS-negative group in 2004, the RDQ score in 2004 was statistically higher in those with LSS-positive in 2005 than in those who remained LSS-negative in 2005. Abbreviations: LSS, lumbar spinal stenosis; RDQ, Roland–Morris Disability Questionnaire; SD, standard deviation. |
Changes in HR-QoL with time course of LSS-positive and LSS-negative groups
In the present study, contrary to the LBP-related QoL, changes in HR-QoL did not correlate with changes in the clinically diagnosed LSS. Among subjects with LSS-negative in 2005 from an LSS-positive in 2004, six of the eight components of SF-36 worsened. Exceptions were general health (GH) and MH, which improved together with LSS symptoms. Similarly, among subjects who were LSS-positive in both 2004 and 2005, the same six of eight SF-36 components worsened (Table 6). These findings suggest that, once LSS symptoms appear, HR-QoL worsens regardless of whether LSS symptoms improve or persist. This is supported by the fact that there was no statistical difference in the HR-QoL between subjects who were LSS-positive in both 2004 and 2005, and those who were LSS-positive in 2004 but negative in 2005 (Table 7).
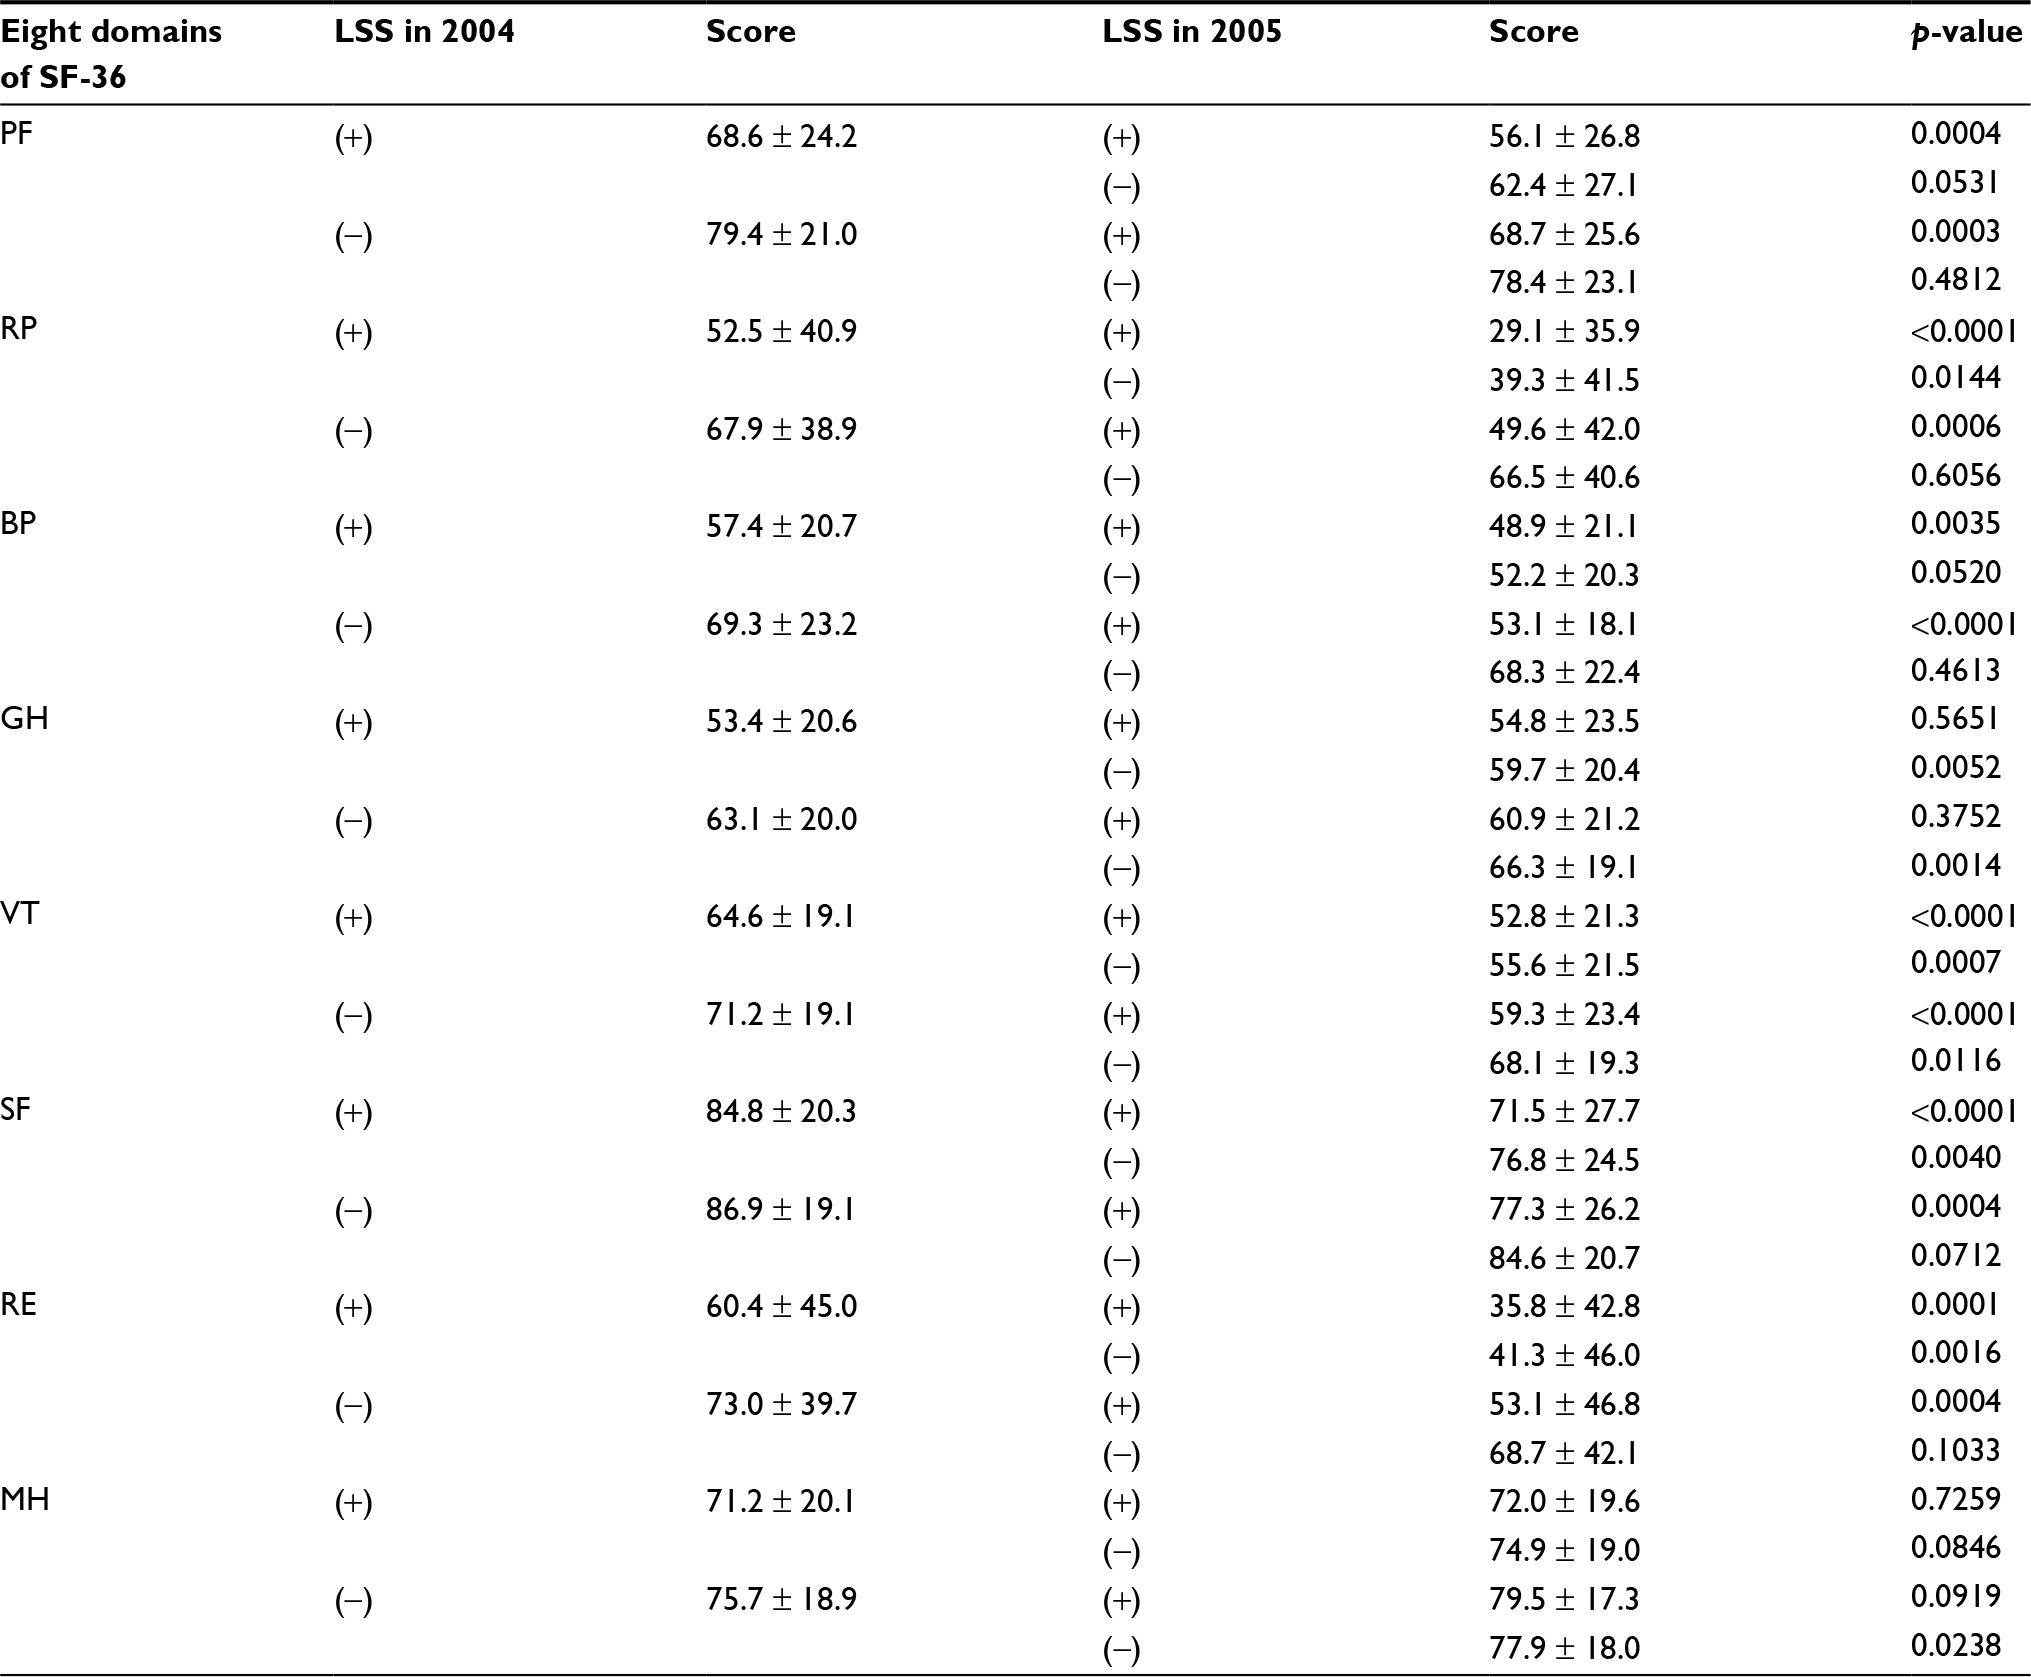 | Table 6 Changes in LSS-positive/negative and eight domains of SF-36(1) Notes: Values are presented as mean ± SD. As LSS-positive in 2004 changed to negative in 2005, of the eight components, only GH improved in a statistically significant manner. Contrarily, as LSS developed from negative in 2004 to positive in 2005, six of the eight components (PF, RP, BP, VT, SF, and RE) worsened in a statistically significant manner. Abbreviations: LSS, lumbar spinal stenosis; SF-36, The 36-Item Short Form Health Survey; SD, standard deviation; PF, physical functioning; RP, role-physical; BP, bodily pain; GH, general health perception; VT, vitality; SF, social functioning; RE, role-emotional; MH, mental health. |
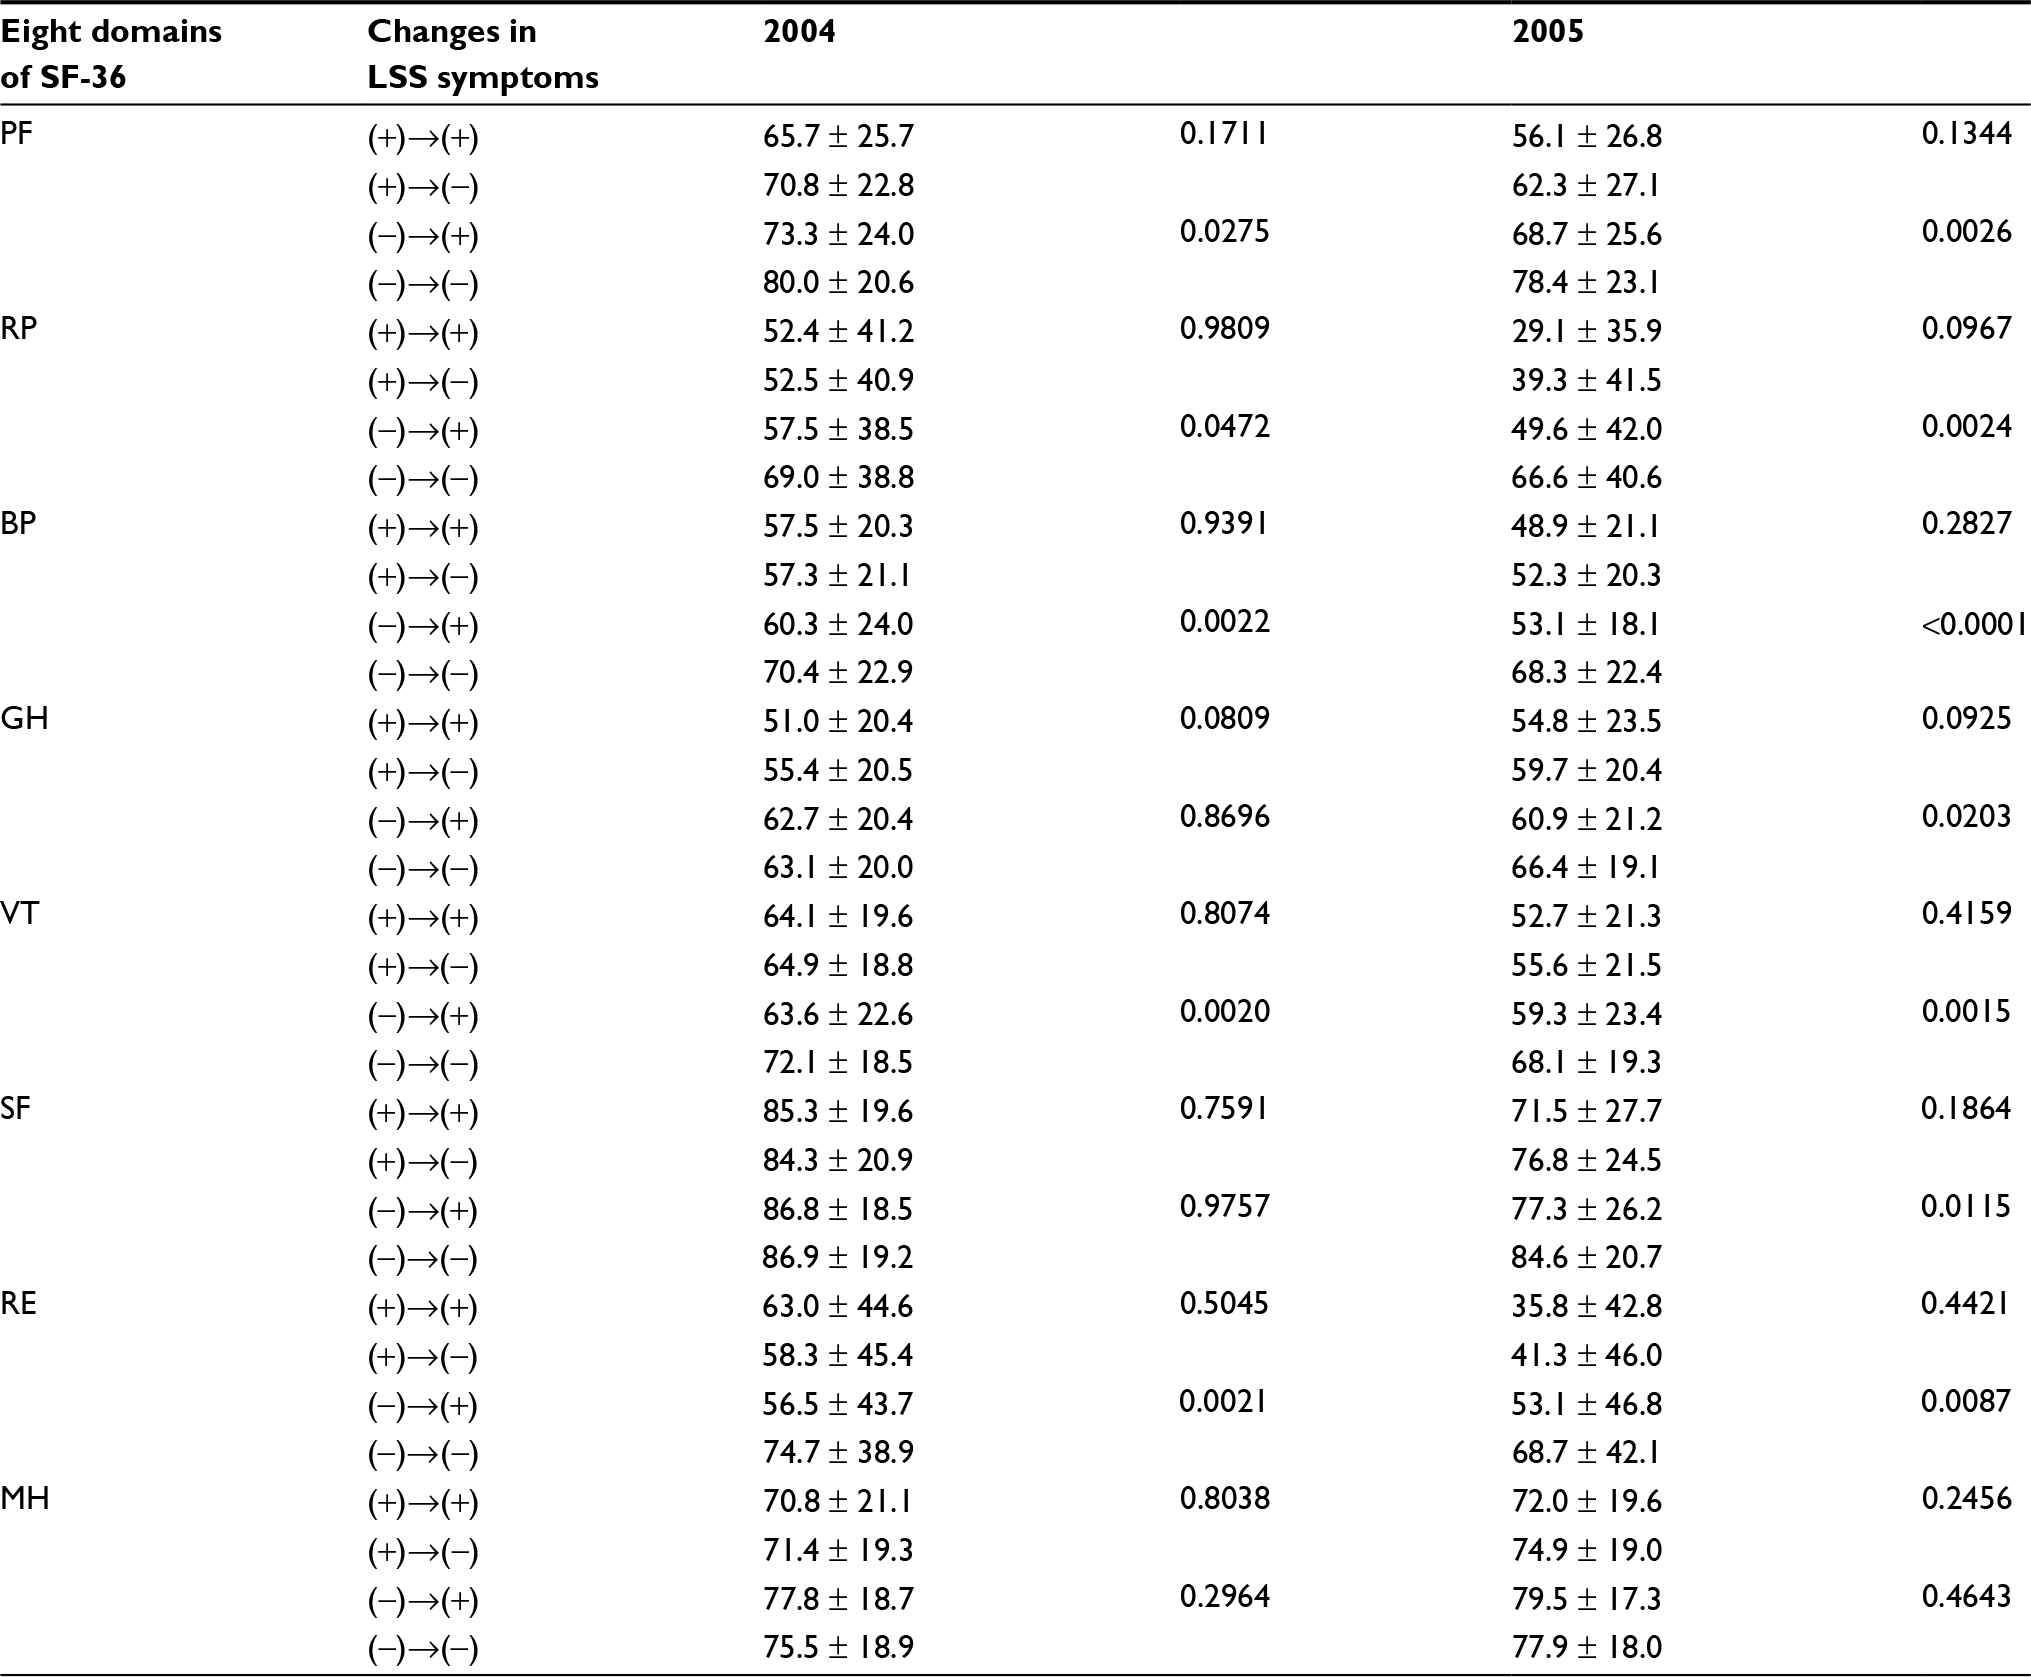 | Table 7 Changes in LSS-positive/negative and eight domains of SF-36(2) Notes: Values are presented as mean ± SD. In the initial LSS-positive group, no statistically significant difference was observed in any of the eight SF-36 components in 2004. At the one-year follow-up, no difference was observed although some LSS-positive subjects had become LSS-negative whereas the others remained LSS-positive. However, for subjects who were categorized as LSS-positive in 2005 but negative in 2004, five of the eight SF-36 components were significantly lower in 2004 when compared to subjects who remained LSS-negative in 2005. Abbreviations: LSS, lumbar spinal stenosis; SF-36, The 36-Item Short Form Health Survey; SD, standard deviation; PF, physical functioning; RP, role-physical; BP, bodily pain; GH, general health perception; VT, vitality; SF, social functioning; RE, role-emotional; MH, mental health. |
With regard to those who were LSS-negative in 2004, but LSS-positive in 2005, the same six of the eight SF-36 components statistically worsened (Table 6). There was a statistically significant difference in five components other than GH, social functioning (SF), and MH in 2004 between subjects who were LSS-negative both in 2004 and 2005 and those who were LSS-negative in 2004, but positive in 2005 (p<0.0020–0.0472; Table 7). These results indicate that, when LSS symptoms occur, HR-QoL may worsen; however, HR-QoL may have already been lower prior to the appearance of clinically diagnosable LSS. Subjects who remained LSS-negative at the one-year follow-up showed statistically improved GH and MH, as well as statistically worsened vitality (VT; Table 6). These findings imply that continuing to remain LSS-negative might not affect the HR-QoL status.
Related factors, predictive factors, and risk ratio of leg symptoms for LSS-positive subjects
The RDQ score, knee OA, cerebrovascular disease, and smoking were suggested to be related factors of LSS-positive status in a cross-sectional analysis in 2004 (Table 8). LSS-positive status and higher RDQ score (lower LBP-related QoL) at the initial analysis were detected as predictive factors of LSS-positive at the one-year follow-up (Table 9). With regard to the risk of LSS development at the one-year follow-up in the LSS-negative group in 2004, subjects who answered “yes” to one or more of questions 1–6 in the LSS-SSHQ (excluding those who were diagnosed as LSS) had 3.4 times higher risk than those without positive answers (Table 10).
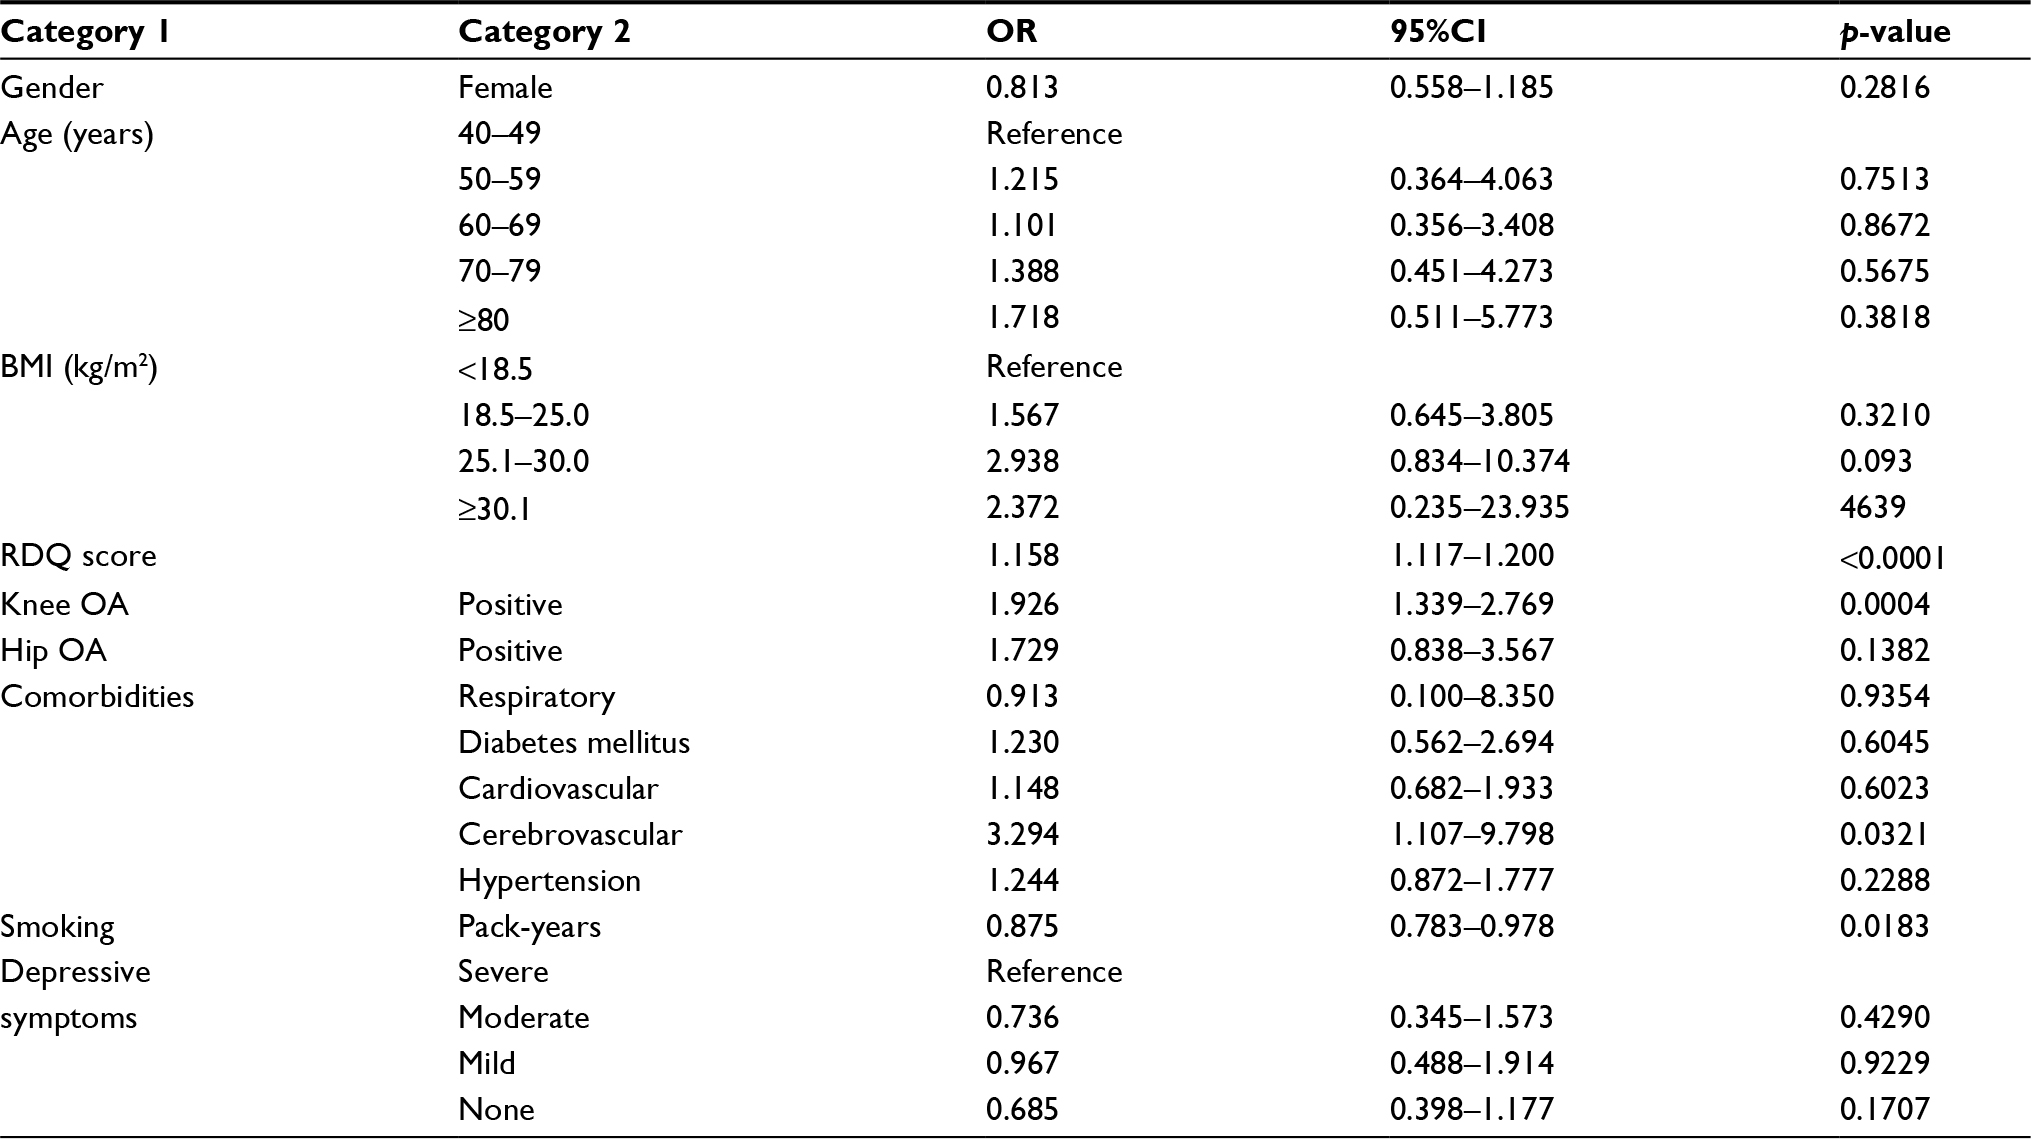 | Table 8 Related factors of the presence of LSS-positive in cross-sectional analysis in 2004 Notes: RDQ score, knee OA, cerebrovascular disease, and smoking were identified as related factors of LSS-positive status. Abbreviations: LSS, lumbar spinal stenosis; BMI, body mass index; RDQ, Roland–Morris Disability Questionnaire; OA, osteoarthritis. |
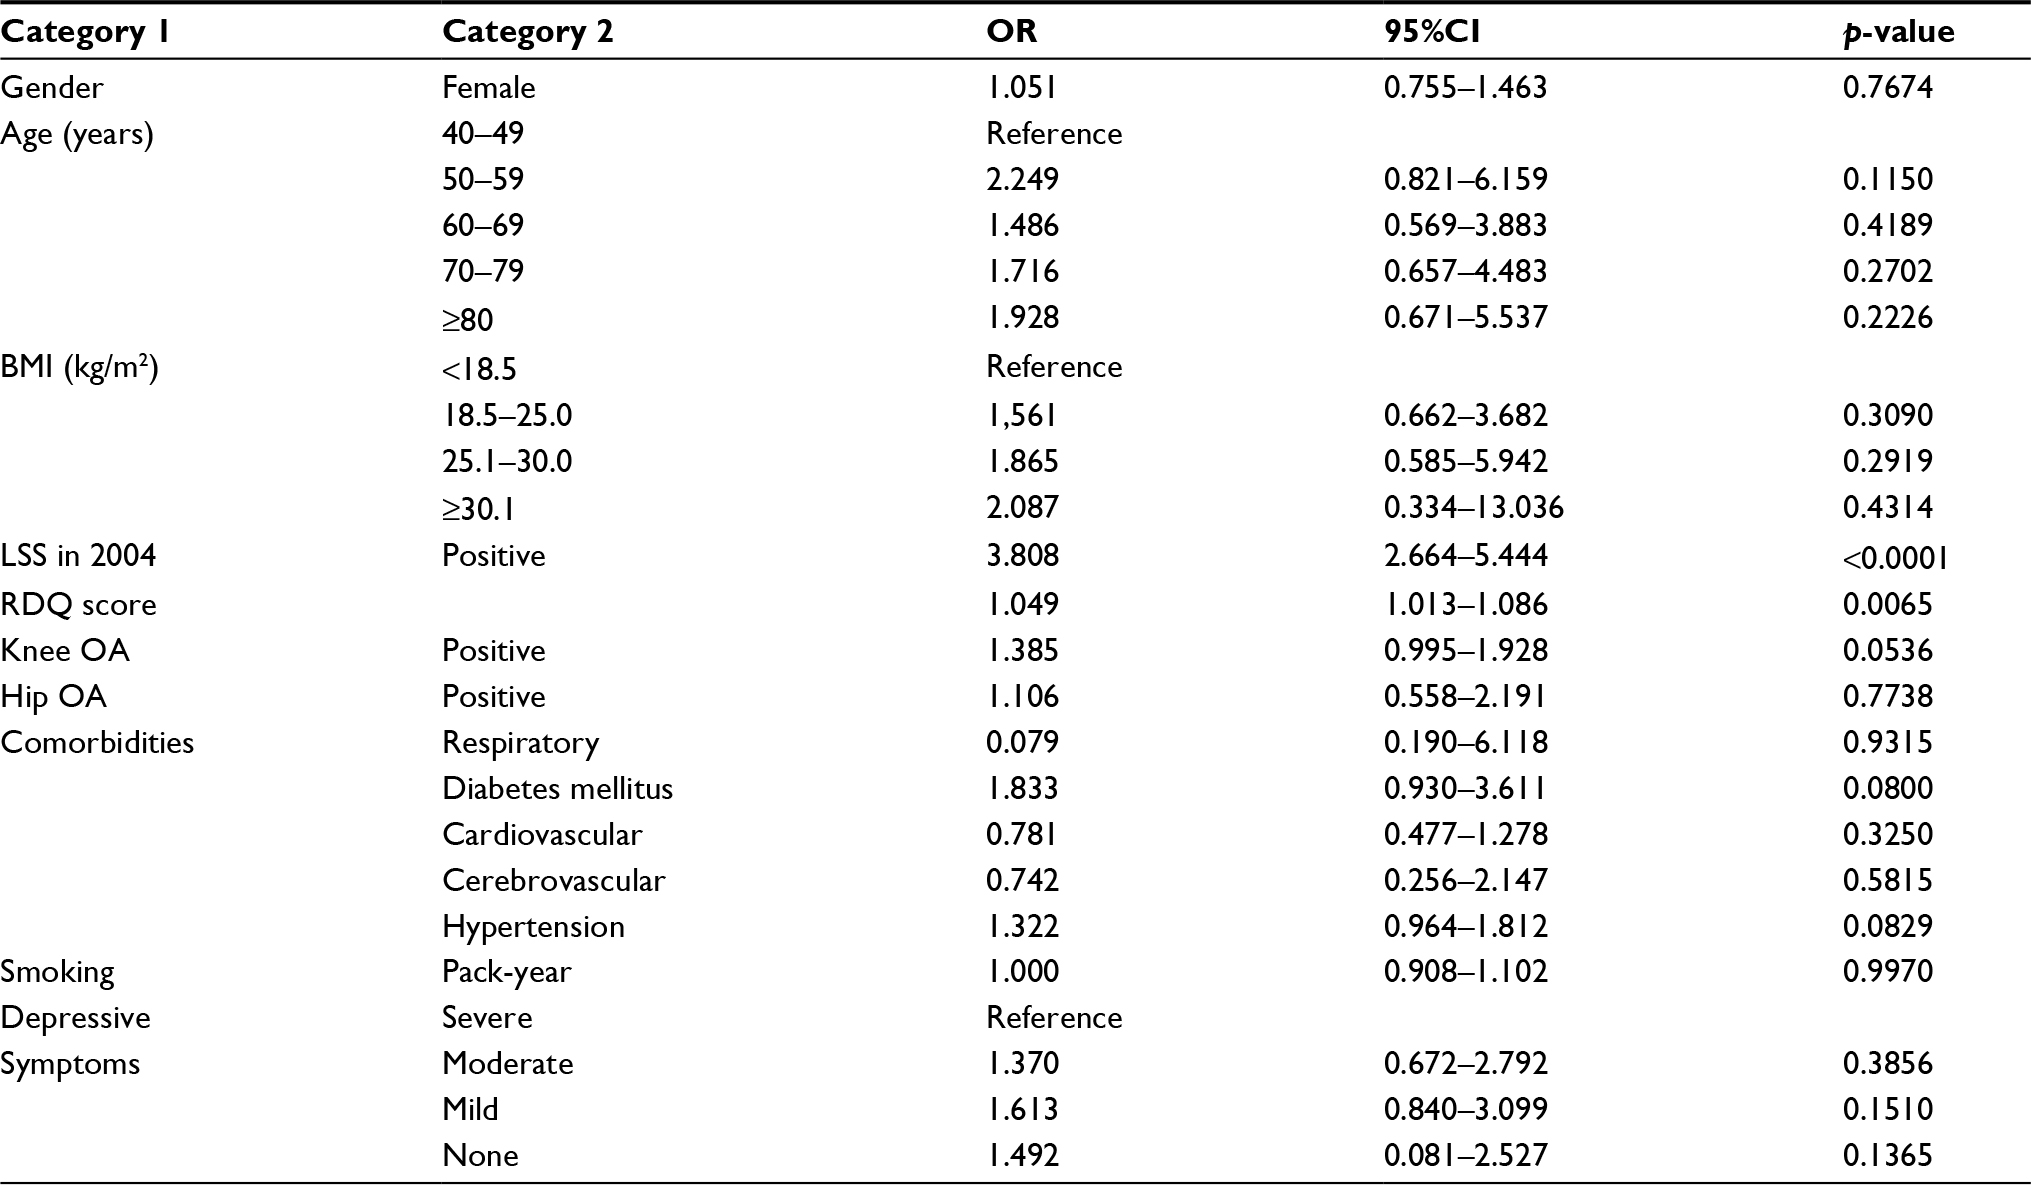 | Table 9 Predictive factors of the occurrence of LSS-positive during the one-year follow-up period Notes: LSS-positive status and RDQ score in the initial analysis appeared to be predictive factors of the occurrence and/or presence of LSS-positive during the one-year follow-up period. Abbreviations: LSS, lumbar spinal stenosis; BMI, body mass index; RDQ, Roland–Morris Disability Questionnaire; OA, osteoarthritis. |
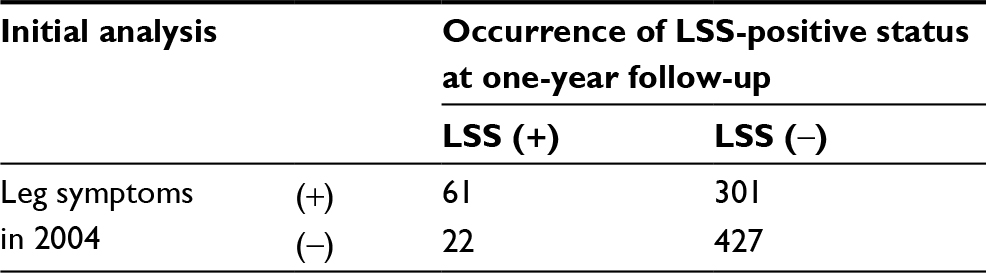 | Table 10 Risk ratio of leg symptoms resulting in LSS-positive during the one-year follow-up period Notes: The risk ratio was 3.439 of LSS-positive status at the one-year follow-up in subjects with leg symptoms to those without leg symptoms in the LSS-negative group in 2004. Abbreviation: LSS, lumbar spinal stenosis. |
Discussion
The prevalence of LSS increases with age, which is to be expected as most LSS cases are caused by degenerative change (acquired stenosis).23–28 In addition, LSS symptoms have a strongly negative influence on QoL, compared with other comorbidities such as hip and knee OA (in musculoskeletal disorders), respiratory diseases, diabetes mellitus, cardiovascular diseases, cerebrovascular diseases, and hypertension.4,23 Although LSS symptoms are an important issue in healthcare, details of the natural course of LSS symptoms remain unclear.
The present study showed the time course of clinically diagnosed LSS over 1 year in an elderly community-dwelling population. Symptoms of more than half of the subjects in the LSS-positive group improved during the study period. On the other hand, 10% of subjects in the LSS-negative group developed clinically diagnosed LSS after the one-year period.
Our results suggest that LBP-related QoL improves or worsens in relation to changes of LSS-positive/negative status according to the RDQ and certain components of the SF-36. Subjects with LSS-positive status and slightly disturbed QoL may show improvement within a year; however, those who are LSS-negative but have disturbed QoL may develop LSS within the same period. In a recent report on patients with moderate LSS symptoms, during an average follow-up period of 3.3 years, spontaneous improvement was observed in pain and health-related quality of life, but not in walking.31 In the current study, Q2 of the LSS-SSHQ evaluated walking capacity (Q2: Numbness and/or pain increases in intensity after walking for a while, but are relieved by taking a rest). The percentage of subjects who answered positively to Q2 at the one-year follow-up was 46% (143/309) of those who initially answered positively to the same question (data not shown). More than half of these subjects might show improvement in walking. In addition, none of the subjects had undergone surgery for LSS during the one-year follow-up period. One of the reasons why changes in walking capacity were different between the two studies might be attributed to the difference in LSS symptom severity and/or disturbed QoL status. Nevertheless, the most important fact emerging from these studies is that some LSS-related symptoms are changeable.
The present study was not fully successful in describing related or predictive factors of clinically diagnosed LSS. Several comorbidities, such as diabetes mellitus and hypertension, may possibly be related and can be predictive factors29,30; however, there was no statistical significance to suggest this in the present study. A long-term follow-up study is required to clarify whether these comorbidities truly are predictive factors. Furthermore, knee OA may be a predictive factor, although it should be noted that results of the LSS-SSHQ may have included symptoms of knee OA. This issue should also be resolved in a long-term follow-up study.
Limitations
There were several limitations to the present study.4 First, our research was carried out in a mountainous, rural area, and the participants of this study were volunteers. The follow-up rate of 61.5% was not high. Moreover, although age was proportionally similar in the 1,754 participants in 2004 to those of the 1,080 participants followed-up in 2005, males were statistically fewer at the follow-up (p < 0.01, 636/1754=36.3%, and 207/1080=19.2% in 2005). These factors suggest the possibility of selection bias. For example, there might be a possibility that subjects with worsening of LSS symptoms and walking ability dropped out by the one-year follow-up. The second limitation is that clinically diagnosable LSS was defined by the LSS-SSHQ. According to a validation study, the sensitivity and specificity of the LSS-SSHQ was 84% and 78%, respectively. False positives were suspected in approximately 20% of the LSS-positive results.13 Moreover, the reliability and sensitivity of LSS-SSHR over the years are not confirmed. The third limitation is that the reliability of knee and hip OA judgment between physicians was not assessed. Fourth, in the current study, we only assessed the presence of knee and hip OA, but not their severity – for example, by pain intensity measurement or imaging findings. Severity assessment might have enabled us to predict the presence of clinical LSS symptoms. Fifth, we did not assess changes in comorbidities during the one-year follow-up period. Sixth, vascular claudication was not evaluated in this study. However, 420 of the 1,754 subjects (129 males and 291 females, the average age: 64.6±10.9, ranging from 40 to 87) underwent ankle–brachial pressure index (ABPI) in 2004, and only two of the 420 (0.4%) showed an ABPI less than 0.9 (data not shown). It is likely that the proportion of people with vascular claudication in this research domain might be so small that the presence of vascular claudication did not affect the results of this study. Finally, although the present study tried to focus on the natural history of LSS symptoms, information on the treatment of LSS – such as medication, physical therapy, or epidural injection – was not collected. In spite of these limitations, the present study is still helpful because, to our knowledge, this is the largest prospective study reported using a validated diagnostic tool and outcome measures, in terms of the time course of clinically diagnosed LSS in a regional community. Further studies are required to investigate the natural course of LSS through long-term follow-up, and to determine risk factors for the maintenance of health among the elderly in the community.
Conclusion
More than half of the subjects in the current study clinically diagnosed with LSS-positive showed an LSS-negative at the one-year follow-up, and 10% of those who were clinically negative for LSS in the initial analysis developed LSS-positive within one year. Our study shows that a relationship exists between the improvement and worsening of LSS symptoms and the improvement and worsening of LBP-related QoL; however, certain, but not all, components of HR-QoL were evaluated by the SF-36.
Acknowledgments
The authors thank Drs. Kazuya Yamauchi, Yoshiaki Takeyachi, Ichiro Takahashi, Hisayoshi Tachihara, and Bunji Takayama for participating in the data collection. The authors also thank six public health nurses (Nobuko Fujita, Nakako Hoshi, Misako Hoshi, Naoko Imada, and Seiko Kanno) for their support in carrying out this study. Moreover, the authors would especially like to thank Prof. Steven Garfin and Mrs. Wendy Hess for their critical and valuable comments.
This study was supported by a grant from the Fukushima Society for the Promotion of Medicine and a grant from the Fukushima Prefectural Hospitals Office.
Author Contributions
Study design: KO, Ski, and SKo; Data analysis: KO, SY, AO, TN and KW; Manuscript preparation: KO and SKi. All authors contributed toward data analysis, drafting and revising the paper and agree to be accountable for all aspects of the work.
Disclosure
The authors report no conflicts of interest in this work.
References
Kalichman L, Cole R, Kim DH, et al. Spinal stenosis prevalence and association with symptoms: the Framingham study. Spine J. 2009;9(7):545–550. | ||
Miyakoshi N, Hongo M, Kasukawa Y, Ishikawa Y, Shimada Y. Prevalence, spinal alignment, and mobility of lumbar spinal stenosis with or without chronic low back pain: a community-dwelling study. Pain Res Treat. 2011;2011:340629. | ||
Ishimoto Y, Yoshimura N, Muraki S, et al. Prevalence of symptomatic lumbar spinal stenosis and its association with physical performance in a population-based cohort in Japan: the Wakayama spine study. Osteoarthr Cartil. 2012;20(10):1103–1108. | ||
Otani K, Kikuchi S, Yabuki S, et al. Lumbar spinal stenosis has a negative impact on quality of life compared with other comorbidities: an epidemiological cross-sectional study of 1862 community-dwelling individuals. Sci World J. 2013;2013:590652. | ||
Jones RA, Thomson JL. The narrow lumbar canal. A clinical and radiological review. J Bone Joint Surg Br. 1968;50(3):595–601. | ||
Blau JN, Logue V. The natural history of intermittent claudication of the cauda equina. Brain. 1978;101(2):211–222. | ||
Johnsson KE, Rosén I, Udén A. The natural course of lumbar spinal stenosis. Clin Orthop Relat Res. 1992;279:82–86. | ||
Swezey RL. Outcome for lumbar stenosis: a 5-year follow-up study. J Clin Rheumatol. 1996;2:129–134. | ||
Simotas AC, Dorey FJ, Hansraj KK, Cammisa F Jr. Nonoperative treatment for lumbar spinal stenosis. Clinical outcome results and 3-year survivorship analysis. Spine (Phila Pa 1976). 2000;25(2):197–204. | ||
Miyamoto H, Sumi M, Uno K, Tadokoro K, Mizuno K. Clinical outcome of nonoperative treatment for lumbar spinal stenosis, and predictive factors relating to prognosis, in a 5-year minimum follow-up. J Spinal Disord Tech. 2008;21:563–568. | ||
Minamide A, Yoshida M, Maio K. The natural clinical course of lumbar spinal stenosis: a longitudinal cohort study over a minimum of 10 years. J Orthop Sci. 2013;18(5): 693–698. | ||
Atlas SJ, Keller RB, Wu YA, Deyo RA, Singer DE. Long-term outcomes of surgical and nonsurgical management of lumbar spinal stenosis: 8 to 10 year results from the maine lumbar spine study. Spine (Phila Pa 1976). 2005;30(8):936–943. | ||
Konno S, Kikuchi S, Tanaka Y, et al. A diagnostic support tool for lumbar spinal stenosis: a self-administered, self-reported history questionnaire. BMC Musculoskelet Disord. 2007;8:102. | ||
Fukuhara S, Bito S, Green J, Hsiao A, Kurokawa K. Translation, adaptation, and validation of the SF-36 Health Survey for use in Japan. J Clin Epidemiol. 1998;51(11):1037–1044. | ||
Fukuhara S, Ware JE Jr, Kosinski M, Wada S, Gandek B. Psychometric and clinical tests of validity of the Japanese SF-36 Health Survey. J Clin Epidemiol. 1998;51(11):1045–1053. | ||
Fukuhara S, Suzukamo Y, Bito S, Kurokawa K. Manual of SF-36 Japanese version 1.2. Tokyo: Public Health Research Foundation; 2001. | ||
Suzukamo Y, Fukuhara S, Kikuchi S, et al; Committee on Science Project, Japanese Orthopaedic Association. Validation of the Japanese version of the Roland-Morris Disability Questionnaire. J Orthop Sci. 2003;8(4):543–548. | ||
Fujiwara A, Kobayashi N, Saiki K, Kitagawa T, Tamai K, Saotome K. Association of the Japanese Orthopaedic Association score with the Oswestry Disability Index, Roland-Morris Disability Questionnaire, and short-form 36. Spine (Phila Pa 1976). 2003;28(14):1601–1607. | ||
Nakamura M, Miyamoto K, Shimizu K. Validation of the Japanese version of the Roland-Morris Disability Questionnaire for the Japanese patients with lumbar spinal disease. Spine (Phila Pa 1976). 2003;28(20):2414–2418. | ||
Yamazaki S, Fukuhara S, Green J. Usefulness of five-item and three-item Mental Health Inventories to screen for depressive symptoms in the general population of Japan. Health Qual Life Outcomes. 2005; 3:48. | ||
Altman R, Asch E, Bloch D, et al. Development of criteria for the classification and reporting of osteoarthritis. Classification of osteoarthritis of the knee. Diagnostic and Therapeutic Criteria Committee of the American Rheumatism Association. Arthritis Rheum. 1986;29(8):1039–1049. | ||
Altman R, Alarcon G, Appelrouth D, et al. The American College of Rheumatology criteria for the classification and reporting of osteoarthritis of the hip. Arthritis Rheum. 1991;34(5):505–514. | ||
Beattie PF, Meyers SP, Stratford P, Millard RW, Hollenberg GM. Associations between patient report of symptoms and anatomic impairment visible on lumbar magnetic resonance imaging. Spine (Phila Pa 1976). 2000;25(7):819–828. | ||
Verbiest H. A radicular syndrome from developmental narrowing of the lumbar vertebral canal. J Bone Joint Surg Br. 1954;36-B(2):230–237. | ||
Epstein JA. Diagnosis and treatment of painful neurological disorders caused by spondylosis of the lumbar spine. J Neurosurg. 1960;17:991–1001. | ||
Epstein JA, Epstein BS, Rosenthal AD, Carras R, Lavine LS. Sciatica caused by nerve root entrapment in the lateral recess: the superior facet syndrome. J Neurosurg. 1972;36(5):584–589. | ||
Epstein JA, Epstein BS, Lavine LS, Carras R, Rosenthal AD, Sumner P. Lumbar nerve root compression at the intervertebral foramina caused by arthritis of the posterior facets. J Neurosurg. 1973;39(3):362–369. | ||
Verbiest H. Neurogenic intermittent claudication in cases with absolute and relative stenosis of the lumbar vertebral canal (ASLC and RSLC) in cases with narrow lumbar intervertebral foramina, and in cases with both entities. Clin Neurosurg. 1973;20:204–214. | ||
Uesugi K, Sekiguchi M, Kikuchi S, Konno S. Relationship between lumbar spinal stenosis and lifestyle-related disorders: a cross-sectional multicenter observational study. Spine (Phila Pa 1976). 2013;38(9): E540–E545. | ||
Abbas J, Hamoud K, May H, et al. Socioeconomic and physical characteristics of individuals with degenerative lumbar spinal stenosis. Spine (Phila Pa 1976). 2013;38(9):E554–E561. | ||
Wessberg P, Frennered K. Central lumbar spinal stenosis: natural history of non-surgical patients. Eur Spine J. 2017; 26(10):2536–2542. |
Supplementary material
 | Figure S1 Lumbar spinal stenosis- self-administered, self-reported history questionnaire (LSS-SSHQ). |
 © 2018 The Author(s). This work is published and licensed by Dove Medical Press Limited. The full terms of this license are available at https://www.dovepress.com/terms.php and incorporate the Creative Commons Attribution - Non Commercial (unported, v3.0) License.
By accessing the work you hereby accept the Terms. Non-commercial uses of the work are permitted without any further permission from Dove Medical Press Limited, provided the work is properly attributed. For permission for commercial use of this work, please see paragraphs 4.2 and 5 of our Terms.
© 2018 The Author(s). This work is published and licensed by Dove Medical Press Limited. The full terms of this license are available at https://www.dovepress.com/terms.php and incorporate the Creative Commons Attribution - Non Commercial (unported, v3.0) License.
By accessing the work you hereby accept the Terms. Non-commercial uses of the work are permitted without any further permission from Dove Medical Press Limited, provided the work is properly attributed. For permission for commercial use of this work, please see paragraphs 4.2 and 5 of our Terms.