")
Back to Journals » Journal of Inflammation Research » Volume 14
Propofol Ameliorates Exaggerated Human Neutrophil Activation in a LPS Sepsis Model
Authors Bredthauer A , Geiger A, Gruber M , Pfaehler SM , Petermichl W, Bitzinger D , Metterlein T, Seyfried T
Received 3 April 2021
Accepted for publication 17 June 2021
Published 11 August 2021 Volume 2021:14 Pages 3849—3862
DOI https://doi.org/10.2147/JIR.S314192
Checked for plagiarism Yes
Review by Single anonymous peer review
Peer reviewer comments 3
Editor who approved publication: Professor Ning Quan
Andre Bredthauer,1,2 Angela Geiger,1 Michael Gruber,1 Sophie-Marie Pfaehler,1 Walter Petermichl,1 Diane Bitzinger,1 Thomas Metterlein,1,3 Timo Seyfried1,4
1Department of Anesthesiology, University Medical Center Regensburg, Regensburg, Germany; 2Department of Neurology at the University of Regensburg – Center for Vascular Neurology and Intensive Care Medicine, Regensburg, Germany; 3Department of Anesthesiology, Ansbach Hospital, Ansbach, Germany; 4Department of Anesthesiology, Ernst von Bergmann Hospital, Potsdam, Germany
Correspondence: Michael Gruber
Department of Anesthesiology, University Medical Center Regensburg, Franz-Josef-Strauß-Allee 11, Regensburg, 93053, Germany
Tel +49 941-944-17870
Fax +49 941-944-7802
Email [email protected]
Background: Sepsis is a leading cause of morbidity and mortality worldwide. Many patients suffering from sepsis are treated on intensive care units and many of them require mechanical ventilation under sedation or general anesthesia. Propofol, a drug used for these purposes, is known to interact with polymorphonuclear granulocytes (PMNs). Therefore, the aim of this study was to investigate the influence of propofol on PMN functions after experimental Gram-negative induced sepsis using lipopolysaccharide (LPS) stimulation.
Methods: A total of 34 granulocyte-enriched samples were collected from healthy subjects. PMNs were isolated by density gradient centrifugation and incubated simultaneously with either 6 μg/mL or 60 μg/mL propofol, or none (control). Additionally, the experimental sepsis samples were incubated with either 40 pg/mL or 400 pg/mL LPS. Live cell imaging was conducted in order to observe granulocyte chemotactic migration, ROS production, and NETosis. Flow cytometry was used to analyze viability and antigen expression.
Results: Propofol led to significantly reduced PMN track length (p < 0.001) and track speed (p < 0.014) after LPS-induced sepsis in a dose-dependent manner. NETosis (p = 0.018) and ROS production (p = 0.039) were accelerated by propofol without LPS incubation, indicating improved immune function. Propofol also ameliorated LPS-induced increased NETosis and ROS-production. Antigen expression for CD11b, CD62l and CD66b was unaffected by propofol.
Conclusion: Propofol improves LPS-induced exaggerated PMN activation in an ex vivo model. Beneficial effects due to restored immune function in septic patients might be possible, but needs further investigation.
Keywords: polymorphonuclear neutrophils, sepsis, propofol, immune modulation, LPS
Introduction
Sepsis is a life-threatening organ dysfunction caused by a dysregulated host response to infection.1 Despite its unknown true incidence,2 sepsis is one of the leading causes of morbidity, death, long-term impairment, and functional disability worldwide.3–5 Many patients suffering from sepsis require intensive care treatment, and a high percentage of them need mechanical ventilation due to respiratory failure.6
Mechanical ventilation is bearable only under sedation or general anesthesia. One agent used for this purpose is the drug propofol (2,6-diisopropylphenol). Propofol was discovered in 19737 and was officially approved for human use in Great Britain in 1986, in Germany in 1988, and received FDA approval in 1989.8 The potential to use propofol for continuous application was also discovered at an early stage of research and has been used ever since.9 This drug exerts its effects mainly through interaction with gamma-amino-butyric-acid (GABA) and N-methyl-D-aspartate (NMDA) receptors, and modulation of neuronal calcium and sodium channels.10 As PMNs express the voltage gated sodium channel 1.3 (Nav1.3) this is of great importance as this channel is involved and regulates PMN adhesion, transmigration, and chemotaxis.11 Furthermore, several non-anesthetic properties are inherent in propofol, such as antioxidant, immunomodulatory, analgesic, antiemetic and neuroprotective effects.10,12 Additionally, propofol has anti-inflammatory effects due to its inhibition of the formyl peptide receptor 1 (FPR1).13
Lipopolysaccharide (LPS) is a substance found in the outer membrane of Gram-negative bacteria (GNB), such as E. coli and Pseudomonas aeruginosa, and is composed of three subunits: a hydrophilic polysaccharide, an O antigen, and the hydrophobic domain lipid A.14 Lipid A is responsible for the high endotoxin activity of GNB, as it binds to Toll-like receptor 4 (TLR4) expressed by cells of the innate immune system, eg polymorphonuclear granulocytes (PMNs), resulting in the activation and subsequent expression and release of cytokines, chemokines and interferons.15,16 The extent of the immune response depends on the severity of the infection and LPS structure, and as this is variable among GNB, the result is different virulence. For example, bacteria such as E. coli induce an immune response while other GNB, like Helicobacter pylori, are only weakly antigenic.17
As the body’s first line of defense, PMNs play a pivotal role in protecting the body from infection by killing bacteria and fungi. On the other hand, continuous PMN infiltration of infection sites and PMN activation result in exaggerated cytokine and chemokine production, which might lead to a “cytokine storm” worsening the septic inflammatory state of the immune system.18,19 Therefore, a well-balanced PMN response is wanted during infections, and propofol is one amongst many drugs used for intensive care treatment which affect PMN functions.10,12
Thus, the aim of this study was to investigate the impact of propofol on the function of isolated granulocytes after experimental induction of Gram-negative sepsis. The study was conducted by performing in vitro assays for a comparative and time-resolved analysis of granulocyte chemotactic migration capacity, reactive oxygen species (ROS) production, neutrophil extracellular trap formation (NETosis), time-dependent viability, and expression of adhesion and activation antigens.
Materials and Methods
Granulocyte Preparation
The experimental setup was based on previous studies of ours.20–24 In brief, whole blood was drawn from 34 healthy blood donors (Table 1) with their informed consent and as approved by the University of Regensburg’s ethics committee (File number 18-1210-10) and was conducted in accordance with the Declaration of Helsinki. This blood was then anticoagulated using lithium heparin. In accordance with the manufacturer’s instructions, PMNs were isolated by density gradient centrifugation (756 g) at an ambient temperature of 21°C for 20 minutes with Lympho Spin Medium on top of Leuko Spin Medium (pluriSelect Life Science, Leipzig, Germany) Purity of PMNs was checked by flow cytometry (n = 3; 54.7±8.4%). After two washing steps, PMNs were resuspended in RPMI 1640 with 2 mM glutamine, (P04-16516; Pan-Biotech, Aidenbach, Germany) made up with 10% fetal calf serum (FCS, Sigma-Aldrich, Steinheim, Germany) to a cell concentration of 18 million per milliliter. The viability (> 97.6%) of the PMNs is unharmed by the procedure as described earlier.22
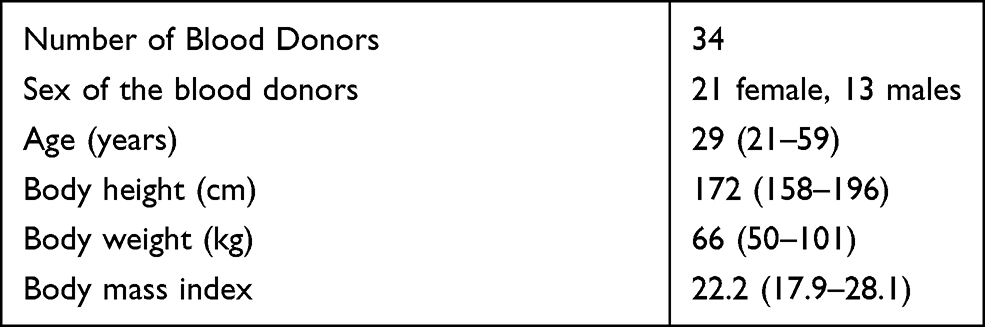 |
Table 1 Characteristics of the Study Population. Data are Expressed as Mean Values (Range) |
Parallel samples of cells from a single donor were incubated at 37°C for 30 minutes with either 0.39% dimethyl sulfoxide (DMSO, Sigma-Aldrich, Steinheim, Germany) serving as control, 6 µg/mL of propofol (Alfa Aesar, Karlsruhe, Germany) dissolved in 0.39% DMSO, or 60 µg/mL of propofol dissolved in 0.39% DMSO. For the experiments with artificial Gram-negative sepsis, the granulocytes aliquots were also incubated in parallel for 30 minutes as described above, as well as with either 40 pg/mL or 400 pg/mL LPS (from Escherichia coli, L2880, Thermo Fisher, Waltham, USA).
Microscopy and Live Cell Imaging
The cells were examined in temporal resolution by light and fluorescence microscopy over 7 hours. Each of the 3D-µ-slides (ibidi© GmbH, Martinsried, Germany) used for chemotactic assays consisted of three separate channels with two reservoirs bordering each channel. In accordance with the manufacturer’s instructions, the cells were embedded in collagen gel (1.5 mg/mL PureCol, Advanced BioMatrix, Carlsbad, USA) and followed by fluorescent stains. This cell-enriched gel matrix (3000 PMNs/µL) was filled into the µ-slide channels and incubated under constant humid conditions at 37°C and 5% CO2. The chemoattractant (CA) N-formyl-met-leu-phe (10 nM fMLP, Sigma Aldrich, St. Louis, USA) was introduced to the left reservoir of each channel immediately before microscopy to create a linear gradient provoking chemotactic PMN movement. To visualize intracellular ROS production, 1 µM dihydrorhodamine-123 (DHR-123, Molecular Probes Inc., Eugene, USA) was used to detect its fluorescent product, rhodamine-123. Utilizing the NETosis-associated release of extracellular DNA, NET formation was visualized with 0.5 µg/mL 4’,6-diamidin-2-phenylindole (DAPI, Sigma Aldrich, Steinheim, Germany). The NETosis associated release of myeloperoxidase (MPO) was detected by APC-conjugated MPO antibodies REA491 (Miltenyi Biotec, Bergisch Gladbach, Germany)
A Leica DMi8 microscope with a motorized adjustable microscope stage, a Leica DFC9000 camera and a pE-4000 light source (CoolLED, NY, USA) were used for live cell imaging. Leica Application Suite X software (version 3.4.2.18368; all Leica equipment from Leica Microsystems, Wetzlar, Germany) automatically recorded phase contrast images and both fluorescence images (in total 9 frames per cycle). The turnaround time was 35 ± 2 seconds over a time span of 7 hours. Stable test conditions were maintained in all assays using a stage top incubator (ibidi).
Image Data Analysis
Image sequences obtained consisting of 2700 frames per µ-slide were analyzed using Imaris software (version 9.0.3, bitplane, Zurich, Switzerland). Cell migration was analyzed in 30-minute periods and was detected up to 3 hours after cell-gel contact, whereby phase contrast images provided the basis this migratory analysis. Cell-gel contact occurred approximately 45 minutes before drug exposure and 50 minutes before the beginning of microscopic evaluation. Imaris recognized the cells that matched the selected criteria, and determined spots and calculated tracks for every moving cell. The resulting data included the following parameters: track displacement length (TDL, Euclidean track: in total as well as subdivided into x- and y-directed movement), track straightness (Str: fraction of Euclidean track length and total track length epitomizing the cell’s directness with a maximum of 1 for linear movement), mean track speed (TSM), and track length (TL: accumulated track). To exclude passive cells and reduce artefacts due to spots on non-PMN, tracks under 25 µm TL and movement under a duration of 800 seconds were excluded.
ROS production, NETosis and MPO release were quantified by detecting the fluorescent area and processing the total surface area per time point. ROS production and NETosis of these PMN functions were visualized in Excel (Microsoft Excel 2016) and showed characteristic graphs, with a parabolic curve for ROS production and a sigmoidal curve for NETosis. To analyze ROS production, maximal intracellular ROS time (TmaxROS) was calculated by creating and fitting a third degree polynomial trendline to the graph and extracting the matching equation. To calculate the time points of half maximal NETosis (ET50NET) and half maximal MPO release (ET50MPO), the data were processed using Phoenix 64 version 8.0.0 (Certara, New York, USA) to fit Michaelis-Menten-like equations to the data.
Flow Cytometry
In addition to live cell imaging an aliquot of the cells was observed using flow cytometry (FACSCalibur) in combination with CellQuest Pro software version 5.2 (both from BD Biosciences, San Jose, USA). All analyses were performed using FlowJo software version 10.0.7 (FlowJo LLC, Ashland, OR, USA). The methods used included observing ROS production by measuring oxidative burst and detecting cell-surface antigens CD11b, CD62L and CD66b. A detailed description is given in.25,26
For oxidative burst, cells were preincubated in 1 mL Dulbecco’s phosphate buffered saline (DPBS, Sigma Aldrich, Steinheim, Germany), 10 µL DHR 123 (10 µM), and 10 µL seminaphtharhodafluor (SNARF, 10 µM, Invitrogen, Eugene, USA). Oxidative burst was then triggered by adding either 10 µL fMLP (10 µM) and 10 µL tumor necrosis factor alpha (TNF, 1 µg/mL, Pepro Tech Inc., Rocky Hill, USA), or 10 µL phorbol-12-myristate-13-acetate (PMA; 10 µM, Sigma-Aldrich). Simultaneously, a concentration of the study drugs identical to that used for the live cell imaging samples was made up simultaneously. To assess cell vitality, 5 µL propidium iodide (PI, 1.5 mM, Invitrogen, Eugene, USA) were added.
To detect cell-surface antigen expression, the antibodies mentioned above and labelled either phycoerythrin (PE, CD11b ICRF44), fluorescein isothiocyanate (FITC, CD62L DREG-56), or allophycocyanin (APC, CD66b G10F5, all BioLegend) were used. Results are given as median-fluorescence-intensities (MFI).
Statistical Analysis
Data from live cell imaging and flow cytometry were collected in Excel (Microsoft Excel 2016), and SPSS Statistics version 25 (IBM Corp., Armonk, NY, USA) was used for further statistical analyses. Initially, normal distribution was tested with the Kolmogorov–Smirnov test. Based on a non-normal distribution, a Kruskal–Wallis one-way analysis of variance (ANOVA) was used to compare the groups. Bonferroni correction was used in post hoc analysis and p-values below 0.05 were considered statistically significant. The distribution of results is visualized with boxplots displaying median, lower, and upper quartile, and calculated minima and maxima. Statistical outliers (≥1.5*IQR) are represented as circles, and extreme values (≥3*IQR) are depicted as asterisks.
Results
Track Length (TL) without LPS
In all time frames observed there were significant differences in the median TL of the PMNs incubated with a propofol concentration of either 6 µg/mL or 60 µg/mL compared to the median TL of the control group. In the 31 to 60 minute time frame (31–60 min) there was a significant difference between the TL of the 6 µg/mL and the 60 µg/mL propofol concentrations (p = 0.011). In the other time frames, there were significant differences (p < 0.001) between the control group and the 6 µg/mL and 60 µg/mL propofol concentrations, respectively.
As displayed in Figure 1, incubation with propofol leads to a concentration-dependent decrease in the median TL compared to the control group. This is consistent for all time frames.
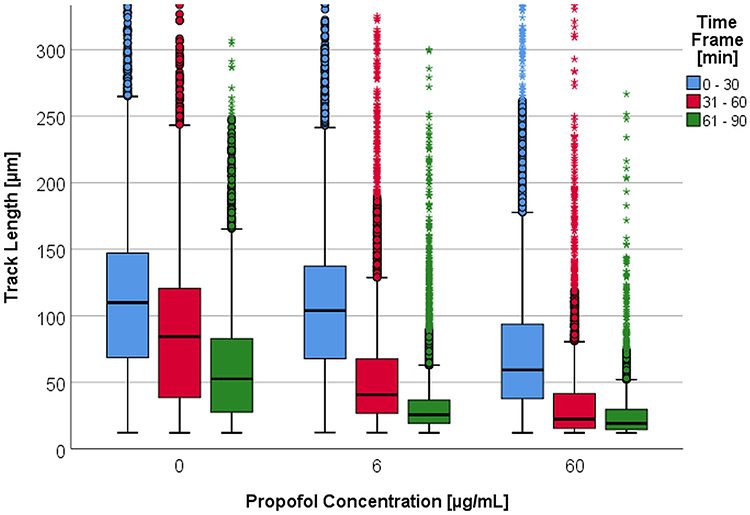 |
Figure 1 Track length [µm] depending on propofol concentration [0 – 6 – 60 µg/mL] per time frame [min]. Some upper outliers (circles) and extreme values (asterisks) are cut off for better comparability of the medians and boxes. |
Within the first hour, the median TL of the control group had decreased by 23% (Table 2 columns with 0 pg/mL LPS). After incubation with 6 µg/mL propofol, the median TL decreased by 61% from the 0 to 30-minute (0–30 min) to the 31–60 min time frames. The same effect was observed using a 10-fold higher concentration of propofol (62%, p < 0.001).
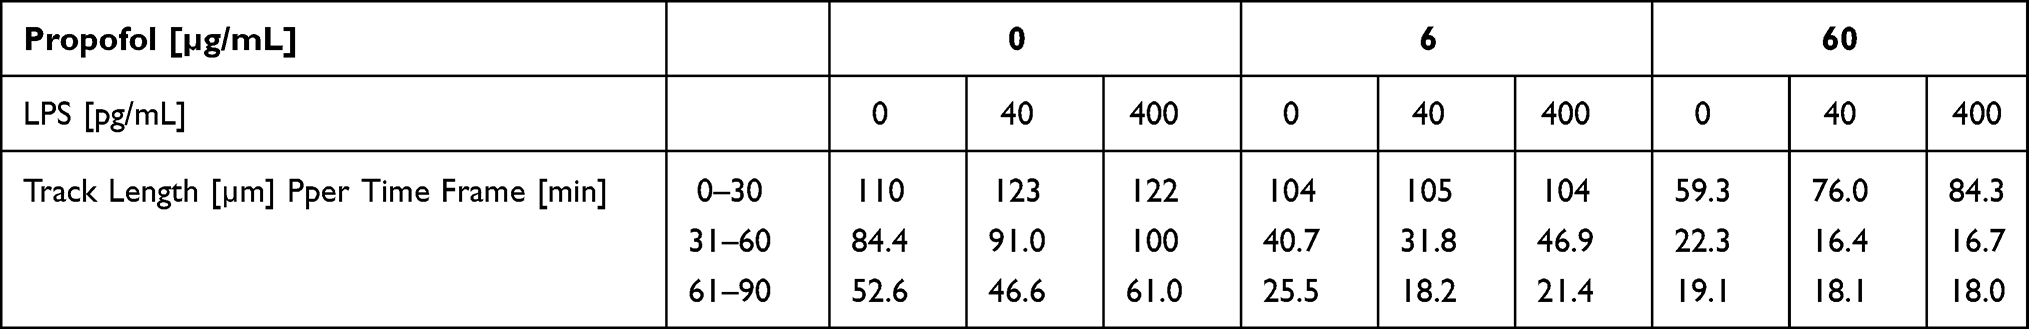 |
Table 2 Medians of the Track Length [µm] Depending on Propofol Concentration and LPS Concentration per Time Frame [min] |
Track Displacement Length (TDL) without LPS
The median TDL within the time frames and dependent on propofol concentration are listed in Table 3 (columns with 0 pg/mL LPS). The median TDL of the PMNs which were incubated with 60 µg/mL propofol dropped by 16% in comparison to the control group. Regarding the median TDL, the differences between the two propofol groups and the control group were significant (p < 0.001), except between the control group and the 6 µg/mL propofol group over the 0–30 min time frame.
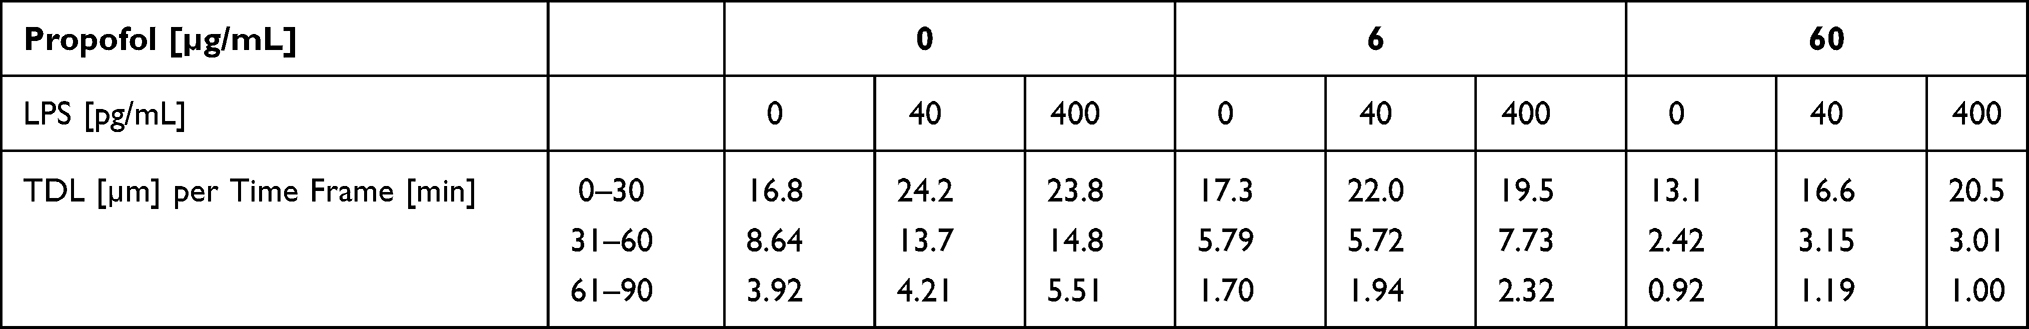 |
Table 3 Track Displacement Length (TDL) Medians [µm] Depending on Propofol Concentration and LPS Concentration per Time Frame [min] |
Track Speed Mean (TSM) without LPS
Differences in the mean TSM between both propofol concentrations, there were also significant differences in comparison to the control group within the three time frames (p < 0.001) (Table 4, columns with 0 pg/mL LPS). The PMN TSM slowed depending on the concentration of propofol. Furthermore, the median TSM decreased independent of the propofol concentration within the observation period. Under the influence of propofol, however, the median TSM dropped significantly.
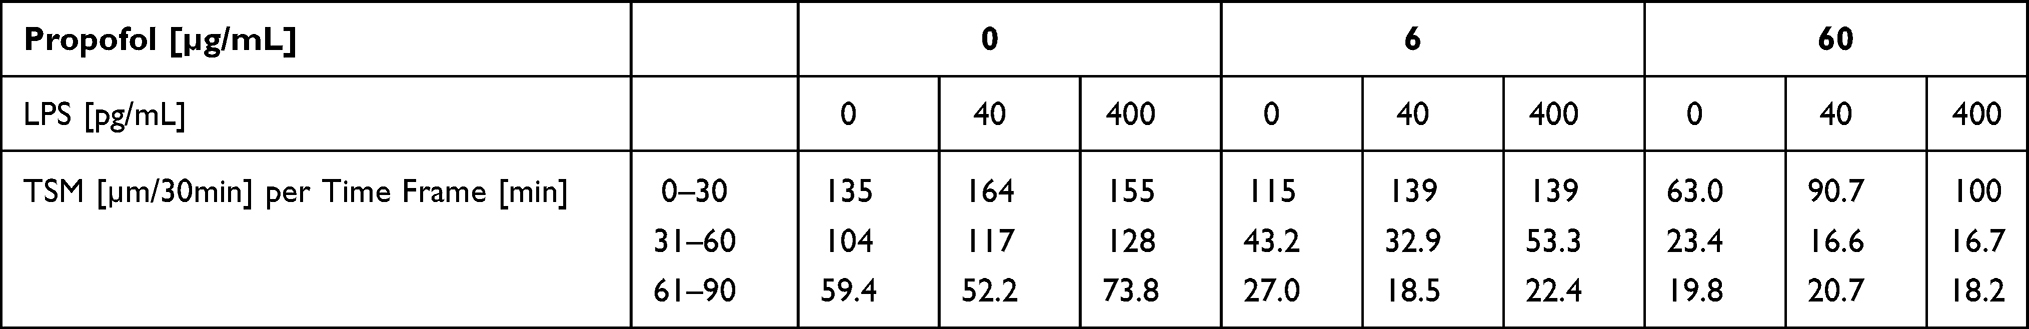 |
Table 4 Track Speed Mean (TSM) [µm/30min] Depending on Propofol Concentration and LPS Concentration per Time Frame [min] |
Track Length (TL) with LPS Incubation
Without previous propofol incubation and with increasing LPS concentration, the boxplot in Figure 2A shows a slight tendency towards an increased migration of the PMN median TL.
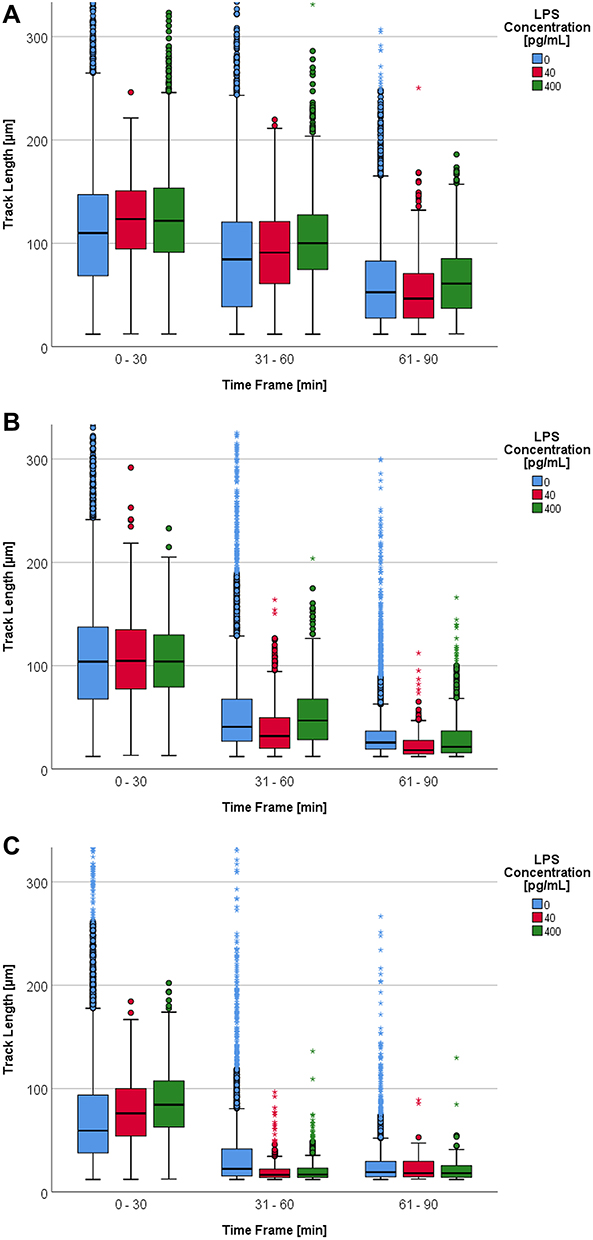 |
Figure 2 (A) Track length [µm] depending on LPS concentration [0 – 40 – 400 pg/mL] per time frame [min] and without propofol. Some upper outliers (circles) and extreme values (asterisks) are cut off for better comparability of the medians and boxes. (B) Track length [µm] depending on LPS concentration [0 – 40 – 400 pg/mL] per time frame [min] with a propofol concentration of 6 µg/mL. Some upper outliers (circles) and extreme values (asterisks) are cut off for better comparability of the medians and boxes. (C) Track length [µm] depending on LPS concentration [0 – 40 – 400 pg/mL] per time frame [min] with a propofol concentration of 60 µg/mL. Some upper extreme values (asterisks) are cut off for better comparability of the medians and boxes. |
This tendency for increased movement under the influence of LPS was only partially confirmed by the median TL. There were significant differences (p < 0.001) in the PMN median TL for both LPS concentrations in comparison to the control group within the first three time frames. Simultaneously, an LPS concentration of 40 pg/mL led to a more significant decrease of PMN TL within the time frames under consideration. Without the influence of LPS the TL dropped by an average of 53% compared to the baseline within 0 to 90 minutes (0–90 min), whereas the TL dropped by 62% using 40 pg/mL LPS within the same time frame. A 10-fold higher LPS concentration led to a 50% reduction within the three time frames (Table 2, columns with 0 µg/mL propofol).
The median TL decreased with a propofol concentration of 6 µg/mL. The addition of LPS did not have an effect on this drop (Figure 2B).
Based on the median TL (Table 2, columns with 6 µg/mL propofol), the addition of LPS to the PMN under the influence of a propofol concentration of 6 µg/mL did not affect the PMN’s TL significantly (p = 0.581). The statistical significances in TL of the 31–60 min and the 61–90 min time frames showed a wide variation with no tendency.
The influence of LPS was limited to the first time frame, 0–30 min (Figure 2C). Compared to the control group, the PMN TL increased by 30% with an LPS concentration of 400 pg/mL in this specific time frame (Table 2, columns with 60 µg/mL propofol). Using the Kruskal–Wallis test, the TL of all LPS groups was found to be significantly different (p < 0.001) in this first time frame. The PMN median TL of both LPS groups was significantly different compared to the baseline (p < 0.001). There were, however, no significant differences between the groups. Depending on LPS concentration, the PMN TL decreased within this time frame. For the 61–90 min time frame there were no longer any significant differences between the PMN median TL of the LPS categories.
Figure 1 depicts how TL drops under a rising propofol concentration without LPS. The influence of propofol led to a drop in the PMN TL within the 31–90 min time frames. In combination with LPS this drop intensified substantially (Figure 2B an C).
From the 0–30 min to the 31–60 min time frame the median TL decreased by 61% under the influence of 6 µg/mL propofol. In comparison to the baseline, the PMN median TL dropped by 38%. An LPS concentration of 40 pg/mL led to a decrease of 70% for 6 µg/mL propofol compared to the control group in the same time frame. Using 60 µg/mL propofol, the TL decreased by 78% under the same conditions (Table 2).
Without the influence of propofol, the PMN TL with 400 pg/mL LPS dropped by 18% from the 0–30 min to the 31–60 min time frame. After the addition of 6 µg/mL propofol the TL dropped by 55%. With 60 µg/mL propofol the TL decreased by 80% (Table 2).
Track Displacement Length (TDL) with LPS Incubation
Within the first time frame, the median TDL scattered around 21 µm for all LPS and propofol concentrations. For this particular time frame, significant differences between the median TDL of the LPS groups and the control group were observed. This was independent of propofol concentration. P-values ranged from p = 0.021 to < 0.001. The median TDL difference between the LPS groups and the control group was at a maximum of 7 µm with no definite direction (Table 3).
Track Speed Mean (TSM) with LPS Incubation
In general, TSM decreased within a channel throughout the observation period (Table 4). The addition of LPS led to an increase of the median TSM within the 0–30 min time frame. The addition of propofol within this time frame did not alter this TSM tendency under LPS. All median TSMs under the influence of the three propofol concentrations showed significant differences between the control group and the individual LPS groups. The p-values ranged from < 0.001 to 0.014 with the following exceptions: 6 µg/mL propofol in the 0–30 min time frame between 40 pg/mL and 400 pg/mL LPS, 60 µg/mL propofol in the 31–60 min time frame between 40 pg/mL and 400 pg/mL LPS, and 60 µg/mL propofol in the 61–90 min time frame.
In the 31–60 min and 61–90 min time frames the LPS effect on TSM was blocked by the addition of 6 µg/mL and 60 µg/mL propofol. The median TSM of the 31–60 min time frame was only slightly different between the individual LPS groups and the baseline. Within the 61–90 min time frame these significant differences were no longer observed. A significant drop in the TSM medians for the 0–30 min and 31–60 min time frames was due to the influence of the combination of LPS and propofol on the PMN. After incubating PMN with 400 pg/mL LPS and without propofol, the TSM medians of the 0–30 min time frame decreased by 56% during the observation period. Additional incubation with 6 µg/mL propofol saw TSM medians decrease by 84% from the baseline (60 µg/mL propofol, 82%).
NETosis
Without the LPS experiments, ET50NET values showed (Figure 3A) significant differences with propofol concentrations of 0 µg/mL and 60 µg/mL (p = 0.004).
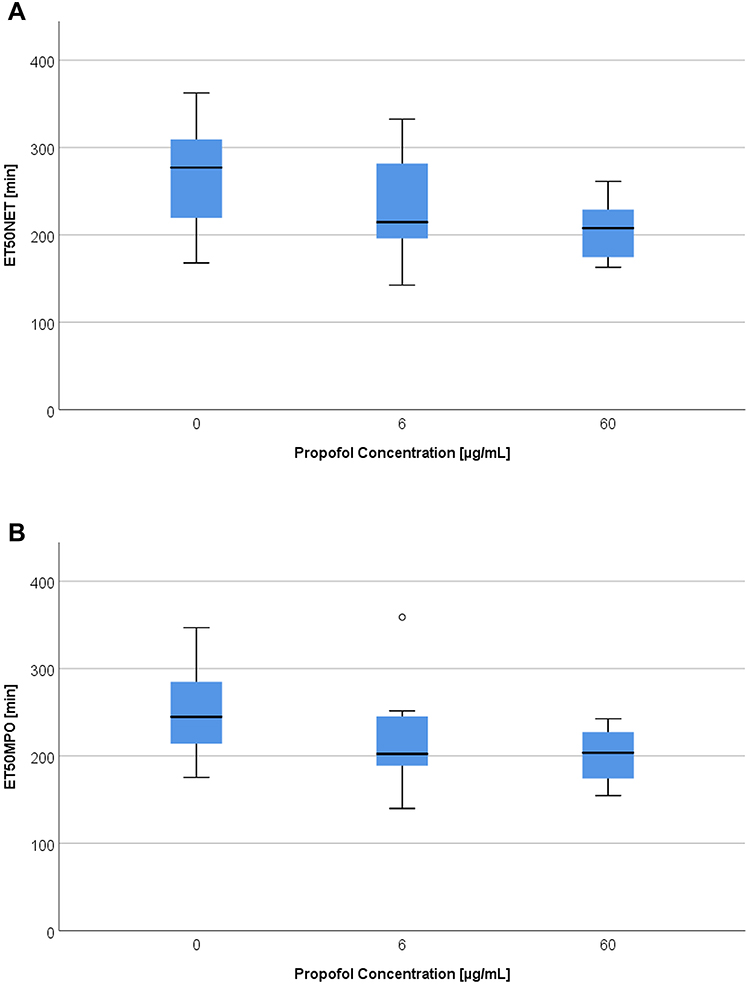 |
Figure 3 (A) ET50NET values [min] depending on propofol concentration [0 – 6 – 60 µg/mL] without LPS. (B) ET50MPO [min] depending on propofol concentration [0 – 6 – 60 µg/mL] without LPS. |
In particular, the median ET50NET dropped by 69 minutes in comparison to the reference values at a propofol concentration of 60 µg/mL (Table 5). This corresponds to a 25% reduction. A propofol concentration of 6 µg/mL also reduced the median by 62 minutes (22%) compared to the reference values. The addition of LPS with a concentration of 40 pg/mL in combination with both propofol concentrations led to a significant decrease of the ET50NET medians in comparison to the reference value (p = 0.018). The ET50NET was accelerated by 32 minutes with a 6 µg/mL propofol concentration and by 60 minutes (19%) with a 60 µg/mL propofol concentration. Therefore, an addition of 40 pg/mL LPS mitigated the influence of propofol pre-incubation on the PMN ET50NET medians. With an LPS concentration of 400 pg/mL there were no longer any significant differences between the ET50NET reference values and both propofol concentrations. ET50NET was reached faster depending on the concentration of propofol. This tendency was weakened by LPS. A comparison of the LPS categories (reference value, 40 pg/mL and 400 pg/mL) did not reveal any significant differences. Without the influence of propofol there was only a significant difference of p = 0.05 amongst the ET50NET medians between 40 pg/mL and 400 pg/mL LPS. However, a deceleration of the ET50NET medians was observed with the addition of 40 pg/mL LPS.
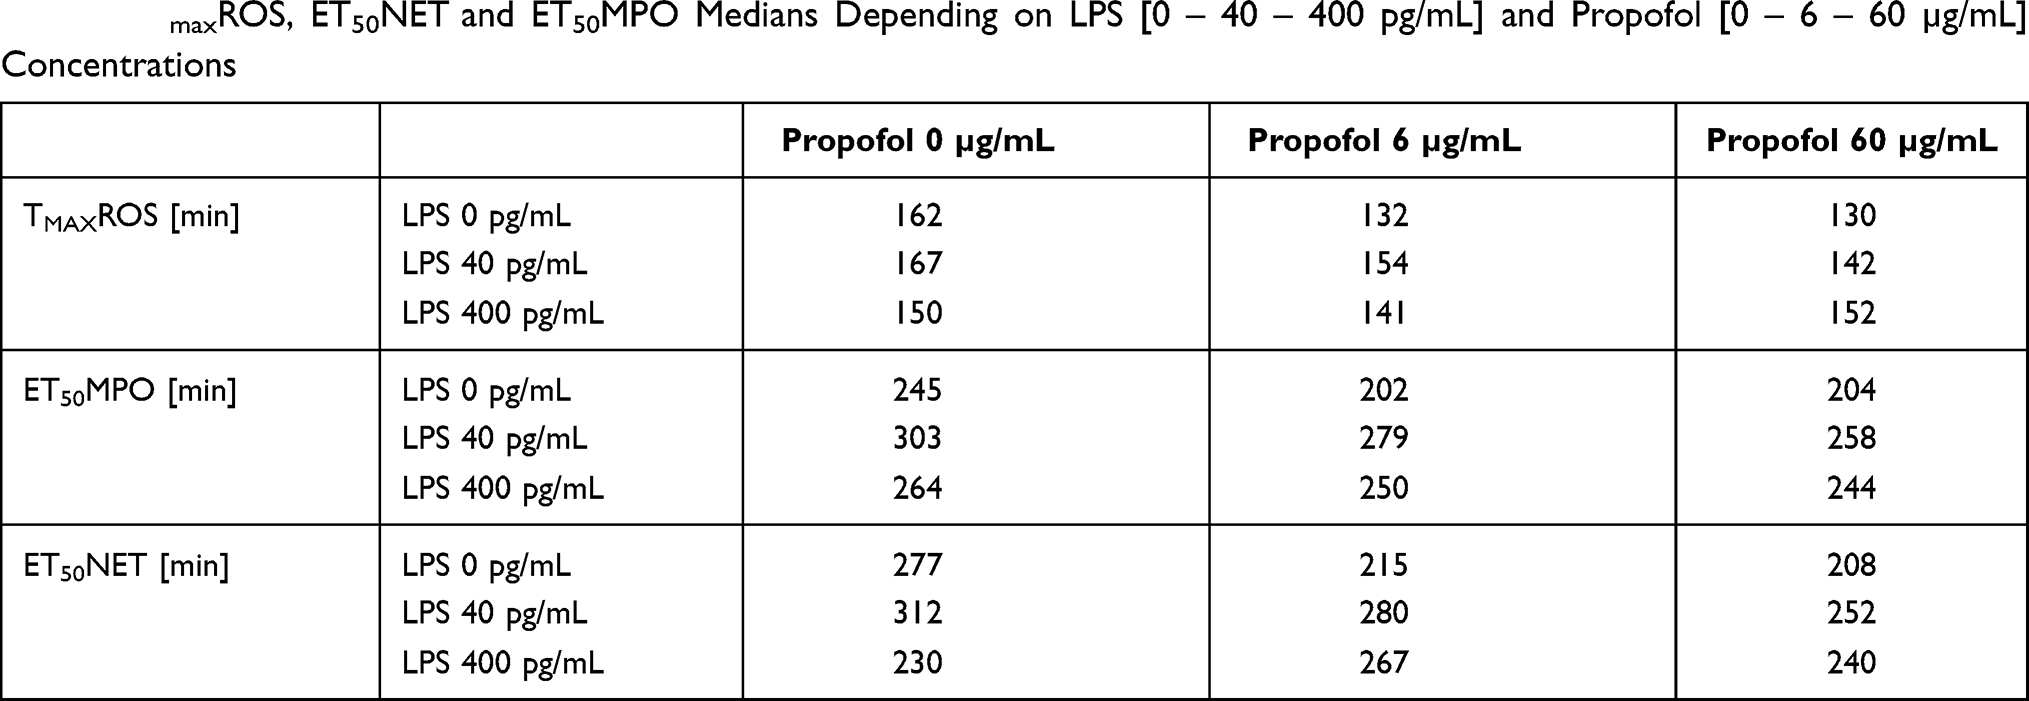 |
Table 5 TmaxROS, ET50NET and ET50MPO Medians Depending on LPS [0 – 40 – 400 pg/mL] and Propofol [0 – 6 – 60 µg/mL] Concentrations |
An analysis of the MPO release timeline leads to comparable results to those of the DHR or DAPI measurements. Without the influence of LPS, there was a significant difference (p = 0.006) between the reference value ET50MPO medians and the group with a propofol concentration of 60 µg/mL (Figure 3B)
The moment of half maximal MPO release was accelerated on average by 41 minutes (17%) compared to the reference value with 60 µg/mL propofol. A concentration of 6 µg/mL propofol had a similar effect on MPO release (Table 5).
The values measured for the combination with LPS (40 pg/mL or 400 pg/mL) did not result in significant differences compared to the ones of the propofol concentration dependent ET50MPO medians. Propofol caused a drop in ET50MPO medians at a concentration of 40 pg/mL LPS. With an LPS concentration of 400 pg/mL, propofol only caused a minimal acceleration of MPO release.
A significant influence on ET50MPO by LPS was only observed with a propofol concentration of 60 µg/mL. The ET50MPO of LPS concentrations of 40 pg/mL and 400 pg/mL differed significantly from the reference value by p = 0.022 and p = 0.045, respectively. The influence of LPS caused a deceleration of ET50NET and ET50MPO.
ROS Production and Oxidative Burst Microscopic and Flow Cytometric Results
Live Cell Imaging:
With the addition of propofol to PMN there was a significant difference between the reference value TmaxROS medians and those of the 60 µg/mL propofol group. ROS production was, generally speaking, accelerated by an increase in propofol concentration. The moment of maximal ROS production was accelerated by 30 minutes with both propofol concentrations. This means that the PMN content of ROS was reached 19% faster compared to a release without propofol (Table 5). A significant difference (p = 0.039) between the TmaxROS values of the reference value and a propofol concentration of 60 µg/mL was also observed with an LPS concentration of 40 pg/mL. Propofol thereby caused an acceleration of 25 minutes (or 15%) of the TmaxROS in comparison to the reference values. There were no longer any significant differences between the TmaxROS medians of both propofol groups and the control group at an LPS concentration of 400 pg/mL. A reduction in TmaxROS due to propofol was not observed. The time points of all three propofol concentrations remained constant. A comparison of the TmaxROS medians of both LPS concentrations and the reference value did not reveal any significant differences. However, a tendency of deceleration in TmaxROS with an LPS concentration of 40 pg/mL was observed.
Flow Cytometry
The activation with fMLP (100 nM) led to significant differences between the PMN MFI with a 60 µg/mL propofol incubation and the reference value (Figure 4). These differences occurred with 0.39% DMSO (p < 0.001) and without DMSO (p = 0.015). The MFI values were different (p = 0.043) from the DMSO reference value even with a propofol concentration of 6 µg/mL. Incubation with 0.39% DMSO led to an increase of MFI. The addition of propofol combined with 0.39% DMSO again led to a decrease in MFI with significant differences between both propofol groups and the DMSO-reference value.
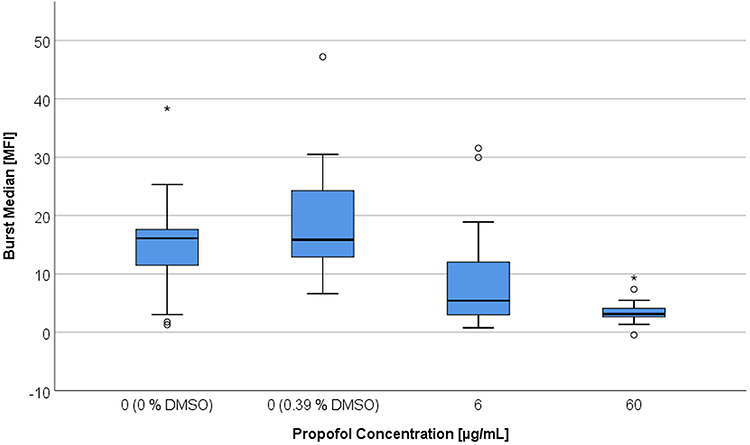 |
Figure 4 Respiratory burst activity expressed by median fluorescence intensity (MFI) after stimulation by fMLP and TNFα, depending on DMSO and propofol concentration [6 µg/mL vs 60 µg/mL]. |
Thus, with the addition of propofol and fMLP activation the median fluorescence intensity dropped on average by 69% in comparison to the reference value. An increase in the propofol concentration to 60 µg/mL raised the MFI decrease to 81%. Incubation with 0.39% DMSO led to a significant increase of 31% (p = 0.007) of the median respiratory burst activity compared to the reference value without DMSO. Referring to this DMSO reference value, MFI decreased significantly (p = 0.035) by 29% when using a propofol concentration of 6 µg/mL. A propofol concentration of 60 µg/mL led to a median MFI reduction of 45% (p < 0.001) in comparison to the DMSO reference value. The MFI medians of the PMN incubated with 6 or 60 µg/mL were not significantly different from one another. Taken together, incubation with propofol led to a decrease in ROS production (MFI). The viability of PMNs was not significantly affected by propofol. Without activation median fractions of dead cells were between 2.2 and 1.5% which was not worsened by fMLP (1.6 to 1.1%) or PMA (2.4 to 1.4%) activation.
Antigen Expression for CD11b/CD62l/CD66b
With a sample size of 5 test persons measured in a dual approach, no significant differences regarding the fluorescence intensity were found in any of the antigen determinations. Graphic analysis also did not show any differences in the expression of antigens after the addition of propofol in all antibodies considered here.
Discussion
This study investigated the impact of propofol on isolated granulocytes, with or without induction of experimental Gram-negative sepsis by incubation with LPS, in terms of granulocyte migration, time dependency in ROS production and NET formation, and vitality.
We used a well-established experimental setup with PMNs from healthy donors of both genders that were unstimulated until the beginning of the experiments in order to exclude any influence on baseline granulocyte function. PMN activation with fMLP for migration assays has been proven safe and reliable. For flow cytometry, granulocyte activation was also initiated with fMLP with PMA serving as positive control.21–24
Propofol is a widely used drug for the induction and maintenance of anesthesia and sedation and is also considered a first-line agent for patients suffering from COVID-19.27,28 It is often used as a monotherapy for sedation, and clinically achieved plasma levels range from 2 to 30 µg/mL.29,30 Due to the SARS-CoV-2/COVID-19 pandemic many patients require long-term intensive care and, therefore, often sedation and anesthesia for mechanical ventilation.31 As a result of patients’ prolonged sedation and their subsequent high tolerance to anesthetic agents, and furthermore, to minimize the risk to health care givers, a high dose of propofol is often required for these patients. Supra-clinical propofol concentrations beyond 30 µg/mL have been investigated in human (33 µg/mL32) or animal models (53 µg/mL33 and up to 300 µg/mL34)
Propofol was dissolved in DMSO in our study to exclude any influence of the lipid carrier in which propofol is commonly formulated for use in humans. This decision was based on the findings of Meier et al, who have shown that ROS-dependent NETosis is induced to the same extent by propofol and lipids.35 The 30-minute incubation time prior to observation was chosen in accordance with this same study.35 With an observation time of up to 7 hours we were able to simulate long-term general anesthesia or intensive care sedation. Our findings regarding TL, TDL and TSM with those of another study investigating the influence of propofol on PMN.36 The underlying mechanisms seem to be activation of mitogen-activated protein-kinases (MAPK) pathways and inhibition of FPR1.13,36–38 We could not observe a directed PMN migration when using an fMLP concentration of 10 µM (data not shown), whereas at 10 nM fMLP, the given chemotactic PMN migration (TDX) was reduced by the addition of propofol. This is attributed to the resulting disorientation from a saturation of fMLP-receptors at high fMLP concentration.
Regarding the influence of propofol on ROS production, our flow cytometric findings indicate a reduction of 70–80% and an earlier onset (TmaxROS) of around 30 minutes on average. The mechanisms for these propofol-based findings are a matter of ongoing debate. It is obvious that one mechanism seems to be the interaction with the GABAA receptor, which is the predominant effect within the central nervous system.10 Two studies have proven that PMNs express GABAA receptors on their surface.35,39 For example, Sanders et al observed a reduced immune response in mice treated with diazepam, which was restored by simultaneous treatment with a GABAA blocker, though this effect was limited to macrophages and monocytes.39 Other studies have shown further effects of propofol; Yang et al attribute its effect on ROS production to an inhibition of the FPR1, as propofol had the same effect on this with or without prior blockage of the GABAA receptor.13 A study by Chen et al supports these findings.40 Another signaling pathway involved for propofol is the aforementioned influence on MAPK, which results in reduced ROS levels and reduced NETosis.30 In accordance with the observations regarding ROS production, we found an earlier NETosis onset of 60–70 minutes for both concentrations of propofol, and ET50NET values were reduced by 40 minutes in both cases. These findings reflect the proven sequence from one of our previous studies,23 and our findings are in line with several other studies. ROS production is a known activator of NETosis41,42 and it has been shown that a defect in NADPH oxidase in patients suffering from chronic granulomatosis has led to an inability to generate NETs.41 In our study, premature NETosis is explained by premature ROS production. Two studies have shown reduced NETosis in propofol-incubated PMN:30,35 Meier et al assume that propofol only inhibits ROS-dependent NETosis, whereas ROS-independent pathways are not involved;35 Chen et al ascertain propofol’s effect of reducing levels of hypochloric acid (HOCl), as well as intracellular pathways, to be responsible for this finding.30
The LPS concentrations of 40 pg/mL and 400 pg/mL were chosen to match clinical states. Wiedermann et al observed levels of less than 50 pg/mL for arteriosclerosis, chronic obstructive pulmonary disease and less severe infections.43 In contrast, LPS blood concentrations of patients suffering from severe sepsis ranged from around 300 pg/mL to 500 pg/mL.44 The effect of LPS on PMN chemotaxis is ambiguous. For example, two studies by Wang et al revealed contrary results. In 2016 they showed that LPS had no effect on fMLP-mediated chemotaxis up to a concentration of 0.1 µg/mL. In higher concentrations LPS increased the amount of FPR1, reduced the amount of other chemoattractant receptors, and supported hierarchical chemotaxis which allowed a targeted migration towards the infection site.45 In 2017, the same group reported an LPS-mediated migration arrest with a subsequent oxidative burst followed by NETosis.46 It was speculated that the underlying mechanism was an LPS-induced activation of the P2X1 receptor. This theory is supported by a study by Kahn et al, who also observed reduced LPS-mediated chemotaxis.47 The putative background for this finding could be that LPS serves as a signal of arrival at infection site. We observed a slight increase in PMN TL, but it did not reach significance and was limited to the first 60 minutes of the observation period. The concentration increase from 40 pg/mL to 400 pg/mL LPS did not result in greater TL, which is due to the LPS-stimulated arrival at infection site. This very slight effect of LPS in our study could be caused by fMLP-mediated activation. Wang et al observed an LPS effect on fMLP-mediated chemotaxis only above a threshold of 0.1 µg/mL LPS,45 which is far beyond the concentration we used. LPS ameliorated the observed effect of propofol on ROS production and NETosis without gaining significance for both LPS concentrations.
With the combined effects of propofol and LPS, we observed a significant TL reduction within the first 30 minutes. This matches the results of another study by Wang et al which found significantly increased p38 MAPK activity after 30 minutes of LPS incubation.45
It is speculated that these discrepancies between the various studies are due to a propofol and LPS interaction on the same effector pathways involved.
Limitations
We cannot rule out that the in vivo situation might be different from our in vitro study with a collagen-I-matrix for simulation of extravascular PMN migration after extravasation due to interference. Furthermore, we used incubation periods of 30 minutes, whereas other studies used different incubation times. To shorten the time in the lead up to PMN observation, we purified the PMNs prior to incubation and did not incubate whole blood with the study medication. We added LPS 30 minutes after propofol, and as propofol is also able to influence PMN chemotaxis mediated by MAPK,38 it could be speculated or even argued that propofol interfered with the LPS-mediated impact. However, we chose this setup of a short period of contact with artificial surfaces in order to limit or exclude factors other than the study drug that may have prevented PMN activation before microscopy. Furthermore, in our experimental setup live cell imaging required observation periods of 8 hours. Had we used longer incubation periods of up to 3 or 4 hours, PMNs would have been out of the body for more than 12 hours, thus most likely generating activation and cell death during the subsequent observation period. It also needs to be emphasized that LPS does not reflect the pathomechanism for sepsis in total. It could also be argued, that LPS from various sources might influence PMNs to a different extent due to its varying virulence. A biological or clinical relevant effect of propofol on PMNs still has to be investigated.
Conclusion
We have shown in this study by means of a time-resolved experimental setup that the widely used anesthetic propofol has a significant impact on PMN immune response ex vivo. Our findings concur with the literature currently available, although the underlying mechanisms and pathways remain unclear and are a matter of ongoing debate and also might be different in vivo. The broad variety of putative mechanisms that propofol exerts on PMNs shows that further studies are warranted to reveal the pathways responsible for these mechanisms. In particular, the high mortality rates caused by exaggerated PMN activation in severe diseases, such as sepsis48 or COVID-19,49,50 demonstrate the urgent need for continued research in this field.
Data Sharing Statement
The datasets generated and/or analyzed in this study are available from the corresponding author upon reasonable request.
Acknowledgments
We would like to thank the laboratory staff of the Department of Anesthesiology, University Medical Center Regensburg, for their outstanding technical assistance throughout this research project. We would also like to thank the volunteer donors. Without their participation and flexibility this study would not have been possible. Furthermore, we would like to thank Rosemary Simpson and Arlyn Bradley from “Bradley & Simpson – English Language Specialists” for language editing.
Author Contributions
All authors made a significant contribution to the work reported, whether in conception, study design, execution, acquisition of data, analysis, and interpretation, or in all of these areas. All authors took part in drafting, revising or critically reviewing this article, gave final approval of the version to be published, and have agreed on the journal to which this article has been submitted. All authors agree to be accountable for all aspects of this work.
Funding
This study was funded in-house by the Department of Anesthesiology.
Disclosure
The authors declare no conflicts of interest.
References
1. Singer M, Deutschman CS, Seymour CW, et al. The third international consensus definitions for Sepsis and Septic Shock (Sepsis-3). JAMA. 2016;315(8):801–810. doi:10.1001/jama.2016.0287
2. Rudd KE, Johnson SC, Agesa KM, et al. Global, regional, and national sepsis incidence and mortality, 1990–2017: analysis for the Global Burden of Disease Study. Lancet. 2020;395(10219):200–211. doi:10.1016/S0140-6736(19)32989-7
3. Fleischmann C, Scherag A, Adhikari NKJ, et al. Assessment of global incidence and mortality of hospital-treated sepsis. current estimates and limitations. Am J Respir Crit Care Med. 2016;193(3):259–272. doi:10.1164/rccm.201504-0781OC
4. Iwashyna TJ, Ely EW, Smith DM, et al. Long-term cognitive impairment and functional disability among survivors of severe sepsis. JAMA. 2010;304(16):1787–1794. doi:10.1001/jama.2010.1553
5. Vincent J-L, Marshall JC, Ñamendys-silva SA, et al. Assessment of the worldwide burden of critical illness: the Intensive Care Over Nations (ICON) audit. Lancet Respir Med. 2014;2(5):380–386. doi:10.1016/S2213-2600(14)70061-X
6. Matthay MA, Zemans RL, Zimmerman GA, et al. Acute respiratory distress syndrome. Nat Rev Dis Prim. 2019;5(1):18.
7. Skues MA, Prys-Roberts C. The pharmacology of propofol. J Clin Anesth. 1989;1(5):387–400. doi:10.1016/0952-8180(89)90080-9
8. Sahinovic MM, Struys MMRF, Absalom AR. Clinical pharmacokinetics and pharmacodynamics of propofol. Clin Pharmacokinet. 2018;57(12):1539–1558. doi:10.1007/s40262-018-0672-3
9. Bateman BT, Kesselheim AS. Propofol as a transformative drug in anesthesia: insights from key early investigators. Drug Discov Today. 2015;20(8):1012–1017. doi:10.1016/j.drudis.2015.04.007
10. Fan W, Zhu X, Wu L, et al. Propofol: an anesthetic possessing neuroprotective effects. Eur Rev Med Pharmacol Sci. 2015;19(8):1520–1529.
11. Poffers M, Bühne N, Herzog C, et al. Sodium channel Nav1.3 is expressed by polymorphonuclear neutrophils during mouse heart and kidney ischemia in vivo and regulates adhesion, transmigration, and chemotaxis of human and mouse neutrophils in vitro. Anesthesiology. 2018;128(6):1151–1166. doi:10.1097/ALN.0000000000002135
12. Vasileiou I, Xanthos T, Koudouna E, et al. Propofol: a review of its non-anaesthetic effects. Eur J Pharmacol. 2009;605(1–3):1–8. doi:10.1016/j.ejphar.2009.01.007
13. Yang S-C, Chung P-J, Ho C-M, et al. Propofol inhibits superoxide production, elastase release, and chemotaxis in formyl peptide-activated human neutrophils by blocking formyl peptide receptor 1. J Immunol. 2013;190(12):6511–6519. doi:10.4049/jimmunol.1202215
14. Oliveira J, Reygaert WC. StatPearls: Gram Negative Bacteria. Treasure Island (FL): StatPearls Publishing; 2020.
15. Auer GK, Weibel DB. Bacterial cell mechanics. Biochemistry. 2017;56(29):3710–3724. doi:10.1021/acs.biochem.7b00346
16. Livermore DM. Current epidemiology and growing resistance of gram-negative pathogens. Korean J Intern Med. 2012;27(2):128–142. doi:10.3904/kjim.2012.27.2.128
17. Wang X, Quinn PJ. Endotoxins: lipopolysaccharides of gram-negative bacteria. Subcell Biochem. 2010;53:3–25.
18. Tomar B, Anders H-J, Desai J, et al. Neutrophils and neutrophil extracellular traps drive necroinflammation in COVID-19. Cells. 2020;9(6):1383. doi:10.3390/cells9061383
19. Németh T, Sperandio M, Mócsai A. Neutrophils as emerging therapeutic targets. Nat Rev Drug Discov. 2020;19(4):253–275.
20. Kraus RF, Gruber MA, Kieninger M. The influence of extracellular tissue on neutrophil function and its possible linkage to inflammatory diseases. Immun Inflamm Dis. 2021. doi:10.1002/iid3.472
21. Bredthauer A, Kopfmueller M, Gruber M, et al. Therapeutic anticoagulation with argatroban and heparins reduces granulocyte migration: possible impact on ECLS-therapy? Cardiovasc Ther. 2020;2020:9783630. doi:10.1155/2020/9783630
22. Doblinger N, Bredthauer A, Mohrez M, et al. Impact of hydroxyethyl starch and modified fluid gelatin on granulocyte phenotype and function. Transfusion. 2019;59(6):2121–2130.
23. Pai D, Gruber M, Pfaehler S-M, et al. Polymorphonuclear cell chemotaxis and suicidal NETosis: simultaneous observation using fMLP, PMA, H7, and live cell imaging. J Immunol Res. 2020;2020:1–10. doi:10.1155/2020/1415947
24. Kolle G, Metterlein T, Gruber M, et al. Potential impact of local anesthetics inducing granulocyte arrest and altering immune functions on perioperative outcome. J Inflamm Res. 2021;14:1–12. doi:10.2147/JIR.S275525
25. Bitzinger DI, Schlachetzki F, Lindner R, et al. Flow-cytometric measurement of respiratory burst in rat polymorphonuclear granulocytes: comparison of four cell preparation procedures, and concentration-response evaluation of soluble stimulants. Cytometry A. 2008;73(7):643–650. doi:10.1002/cyto.a.20539
26. Trabold B, Gruber M, Fröhlich D. Functional and phenotypic changes in polymorphonuclear neutrophils induced by catecholamines. Scandinavian Cardiovasc J. 2007;41(1):59–64. doi:10.1080/14017430601085948
27. Payen J-F, Chanques G, Futier E, et al. Sedation for critically ill patients with COVID-19: which specificities? One size does not fit all. Anaesth Crit Care Pain Med. 2020;39(3):341–343. doi:10.1016/j.accpm.2020.04.010
28. Chanques G, Constantin J-M, Devlin JW, et al. Analgesia and sedation in patients with ARDS. Intensive Care Med. 2020;46(12):2342–2356. doi:10.1007/s00134-020-06307-9
29. Khan MS, Zetterlund E-L, Gréen H, et al. Pharmacogenetics, plasma concentrations, clinical signs and EEG during propofol treatment. Basic Clin Pharmacol Toxicol. 2014;115(6):565–570. doi:10.1111/bcpt.12277
30. Chen M-S, Lin W-C, Yeh H-T, et al. Propofol specifically reduces PMA-induced neutrophil extracellular trap formation through inhibition of p-ERK and HOCl. Life Sci. 2019;221:178–186. doi:10.1016/j.lfs.2019.02.030
31. Thomson RJ, Hunter J, Dutton J, et al. Clinical characteristics and outcomes of critically ill patients with COVID-19 admitted to an intensive care unit in London: a prospective observational cohort study. PLoS One. 2020;15(12):e0243710. doi:10.1371/journal.pone.0243710
32. González-Correa JA, Cruz-Andreotti E, Arrebola MM, et al. Effects of propofol on the leukocyte nitric oxide pathway: in vitro and ex vivo studies in surgical patients. Naunyn Schmiedebergs Arch Pharmacol. 2008;376(5):331–339. doi:10.1007/s00210-007-0220-4
33. Lam C-F, Chang P-J, Chen Y-A, et al. Inhibition of ATP-sensitive potassium channels attenuates propofol-induced vasorelaxation. Crit Care Resusc. 2010;12(3):186–190.
34. Dominik S, Markus K, Kerstin L, et al. The mesenterially perfused rat small intestine: a versatile approach for pharmacological testings. Ann Anat. 2014;196(2–3):158–166. doi:10.1016/j.aanat.2014.02.008
35. Meier A, Chien J, Hobohm L, et al. Inhibition of human Neutrophil Extracellular Trap (NET) production by propofol and lipid emulsion. Front Pharmacol. 2019;10:323. doi:10.3389/fphar.2019.00323.
36. Nagata T, Kansha M, Irita K, et al. Propofol inhibits FMLP-stimulated phosphorylation of p42 mitogen-activated protein kinase and chemotaxis in human neutrophils. Br J Anaesth. 2001;86(6):853–858. doi:10.1093/bja/86.6.853
37. Kuroki M, O’Flaherty JT. Differential effects of a mitogen-activated protein kinase kinase inhibitor on human neutrophil responses to chemotactic factors. Biochem Biophys Res Commun. 1997;232(2):474–477. doi:10.1006/bbrc.1997.6296
38. Coffer PJ, Geijsen N, M’rabet L, et al. Comparison of the roles of mitogen-activated protein kinase kinase and phosphatidylinositol 3-kinase signal transduction in neutrophil effector function. Biochem J. 1998;329(Pt 1):121–130. doi:10.1042/bj3290121
39. Sanders RD, Godlee A, Fujimori T, et al. Benzodiazepine augmented γ-amino-butyric acid signaling increases mortality from pneumonia in mice. Crit Care Med. 2013;41(7):1627–1636. doi:10.1097/CCM.0b013e31827c0c8d
40. Chen C-Y, Tsai Y-F, Huang W-J, et al. Propofol inhibits endogenous formyl peptide-induced neutrophil activation and alleviates lung injury. Free Radic Biol Med. 2018;129:372–382. doi:10.1016/j.freeradbiomed.2018.09.048
41. Fuchs TA, Abed U, Goosmann C, et al. Novel cell death program leads to neutrophil extracellular traps. J Cell Biol. 2007;176(2):231–241. doi:10.1083/jcb.200606027
42. Yousefi S, Mihalache C, Kozlowski E, et al. Viable neutrophils release mitochondrial DNA to form neutrophil extracellular traps. Cell Death Differ. 2009;16(11):1438–1444. doi:10.1038/cdd.2009.96
43. Wiedermann CJ, Kiechl S, Dunzendorfer S, et al. Association of endotoxemia with carotid atherosclerosis and cardiovascular disease. J Am Coll Cardiol. 1999;34(7):1975–1981. doi:10.1016/S0735-1097(99)00448-9
44. Opal SM, Scannon PJ, Vincent JL, et al. Relationship between plasma levels of lipopolysaccharide (LPS) and LPS-binding protein in patients with severe sepsis and septic shock. J Infect Dis. 1999;180(5):1584–1589. doi:10.1086/315093
45. Wang X, Qin W, Zhang Y, et al. Endotoxin promotes neutrophil hierarchical chemotaxis via the p38-membrane receptor pathway. Oncotarget. 2016;7(45):74247–74258. doi:10.18632/oncotarget.12093
46. Wang X, Qin W, Xu X, et al. Endotoxin-induced autocrine ATP signaling inhibits neutrophil chemotaxis through enhancing myosin light chain phosphorylation. Proc Natl Acad Sci U S A. 2017;114(17):4483–4488. doi:10.1073/pnas.1616752114
47. Khan AI, Heit B, Andonegui G, et al. Lipopolysaccharide: a p38 MAPK-dependent disrupter of neutrophil chemotaxis. Microcirculation. 2005;12(5):421–432. doi:10.1080/10739680590960368
48. Zhu L, Liu L, Zhang Y, et al. High level of neutrophil extracellular traps correlates with poor prognosis of severe influenza a infection. J Infect Dis. 2018;217(3):428–437. doi:10.1093/infdis/jix475
49. Saksena S, Chattopadhyay P. Illuminating the immunopathology of SARS-CoV-2. Cytometry B Clin Cytom. 2021;100(1):33–41. doi:10.1002/cyto.b.21988
50. Borges L, Pithon-Curi TC, Curi R, et al. COVID-19 and neutrophils: the relationship between hyperinflammation and neutrophil extracellular traps. Mediators Inflamm. 2020;2020:8829674. doi:10.1155/2020/8829674
 © 2021 The Author(s). This work is published and licensed by Dove Medical Press Limited. The full terms of this license are available at https://www.dovepress.com/terms.php and incorporate the Creative Commons Attribution - Non Commercial (unported, v3.0) License.
By accessing the work you hereby accept the Terms. Non-commercial uses of the work are permitted without any further permission from Dove Medical Press Limited, provided the work is properly attributed. For permission for commercial use of this work, please see paragraphs 4.2 and 5 of our Terms.
© 2021 The Author(s). This work is published and licensed by Dove Medical Press Limited. The full terms of this license are available at https://www.dovepress.com/terms.php and incorporate the Creative Commons Attribution - Non Commercial (unported, v3.0) License.
By accessing the work you hereby accept the Terms. Non-commercial uses of the work are permitted without any further permission from Dove Medical Press Limited, provided the work is properly attributed. For permission for commercial use of this work, please see paragraphs 4.2 and 5 of our Terms.