")
Back to Journals » Diabetes, Metabolic Syndrome and Obesity » Volume 13
Promotion of Adropin Expression by Hyperglycemia Is Associated with STAT3 Activation in Diabetic Rats
Authors Kuo FY , Cheng KC , Li Y, Cheng JT, Tsai CC
Received 25 December 2019
Accepted for publication 9 June 2020
Published 29 June 2020 Volume 2020:13 Pages 2269—2277
DOI https://doi.org/10.2147/DMSO.S243755
Checked for plagiarism Yes
Review by Single anonymous peer review
Peer reviewer comments 2
Editor who approved publication: Dr Xiao
Feng Yu Kuo, 1, 2 Kai-Chun Cheng, 3 Yingxiao Li, 4 Juei-Tang Cheng, 5 Cheng-Chia Tsai 6, 7
1Cardiovascular Centre, Kaohsiung Veterans General Hospital, Kaohsiung Citty, Taiwan; 2Department of Pharmacy, College of Pharmacy and Health Care, Tajen University, Pingtung County, Taiwan; 3Pharmacological Department of Herbal Medicine and Department of Psychosomatic Internal Medicine, Graduate School of Medical and Dental Sciences, Kagoshima Unuversity, Kagoshima, Japan; 4Department of Nursing, Tzu Chi University of Science and Technology, Hualien 97005, Taiwan; 5Department of Medical Research, Chi-Mei Medical Center, Tainan, Taiwan; 6Department of Surgery, Mackay Memorial Hospital, Taipei City, Taiwan; 7Department of Medicine, Mackay Medical College, New Taipei, Taiwan
Correspondence: Juei-Tang Cheng
Department of Medical Research, Chi-Mei Medical Center, No. 901, Zhonghua Road Yongkang District, Tainan 71004, Taiwan
Tel +886-6-2517864
Email [email protected]
Cheng-Chia Tsai
Department of Surgery, Mackay Memorial Hospital, No. 92, Sec.2, Chung-Shan North Road, Taipei City 10449, Taiwan
Tel +886-2-25433535
Email [email protected]
Background: Adropin is a secreted polypeptide that has been demonstrated to play an important role in energy homeostasis and lipid metabolism. Signal transducer and activator of transcription 3 (STAT3) may promote the transcription of target genes including adropin. In the current study, we investigated the effect of adropin on glucose metabolism in diabetic rats and the mechanism that governs this effect was subsequently assessed.
Materials and Methods: Rats received a single injection of streptozotocin to induce type 1 diabetes. The diabetic rats were treated with insulin or phloridzin, another antidiabetic agent through inhibition of glucose reabsorption, for 7 days. Plasma glucose levels and adropin levels were measured. The interaction between STAT3 and adropin was evaluated using the human hepatoma HepG2 cell line. HepG2 cells were pretreated with the specific antagonist Stattic or with STAT3-specific siRNAs to knockout STAT3. Changes in energy homeostasis-associated gene expression were measured using real-time PCR. The protein expression levels of pSTAT3 and STAT3 were measured using Western blotting.
Results: In diabetic rats, the serum concentrations of adropin were increased in the vehicle-treated group and decreased in the insulin- or phloridzin-treated group. In liver tissues, the Enho expression level and the activity of STAT3 also showed similar tendencies. After HepG2 cells were treated with medium containing high glucose, the ratio of p-STAT3 to STAT3, Enho mRNA levels and reactive oxygen species expression levels in HepG2 cells were significantly increased in conjunction with increased glucose levels. The effect was inhibited after pretreatment with Stattic or knockdown with STAT3-specific siRNAs.
Conclusion: STAT3 is involved in the genetic regulation of adropin, increasing the levels of circulating adropin and promoting Enho expression in the livers of diabetic rats.
Keywords: adropin, Enho gene, STAT3, type 1 diabetes, reactive oxygen species
Introduction
Adropin, an endogenous peptide containing 76 amino acids, is encoded by the energy homeostasis-associated (Enho) gene.1 It is expressed in various tissues and organs, namely, the liver, heart, kidney, and central nervous system.2 Adropin is involved in energy homeostasis and lipid metabolism.3 Adropin is also expressed in regions of the brain that can regulate complex behaviors, including circadian rhythms and feeding-associated rewards.4 A higher adropin level is observed in both the serum and in tissues of rats with streptozotocin (STZ)-induced diabetes.2 Intraperitoneal injection of adropin results in a reduction of food intake and a decrease in body weight in obese mice.1 Adropin-deleted mice show dyslipidemia, insulin resistance, obesity and hepatosteatosis.5 Some clinical studies have indicated that circulating adropin concentrations are decreased in type 2 diabetes with obesity,6 and polycystic ovary syndrome.7 Additionally, the adropin level in obese patients with nonalcoholic fatty liver disease (NAFLD) is much lower than that in patients without NAFLD and healthy controls.8 Therefore, adropin seems to play a role in the glucose homeostasis.
Hyperglycemia has been found to increase signal transducer and activator of transcription 3 (STAT3) by regulating either its gene expression or its phosphorylation.9 Furthermore, STAT signaling contributes to cellular transformation through the modulation of target genes.10 STAT3 may promote the transcription of target genes, including adropin.11 However, the role of STAT3 and adropin in glycemic control in diabetes remains unclear. In the current study, we investigated the changes of adropin in diabetic rats, and the mechanism that governs this effect has subsequently assessed.
Materials and Methods
Animal Experiments
Male Sprague-Dawley (SD) rats weighing 250 to 280 g were obtained from the National Laboratory Animal Center (Taipei, Taiwan) and used in animal experiments that were performed under anesthesia with 2% isoflurane to minimize suffering. The experimental protocols were approved by the Institutional Animal Ethics Committee (103,120,201) at the Chi-Mei Medical Center. All experiments conformed to the Guide for the Care and Use of Laboratory Animals of the National Institutes of Health as well as the guidelines of the Animal Welfare Act.
A type 1-like diabetes was induced in fasting rats by a single intraperitoneal injection of streptozotocin (STZ) 60 mg/kg (Sigma-Aldrich, St. Louis, MO, USA).12 Three days after STZ administration, the animals with a non-fasting plasma glucose levels greater than 350 mg/dl might indicate diabetes.13 All experiments were performed 4 weeks after diabetes induction. The age-matched rats were used in the present study and the total number was 42 rats while 36 rats received STZ injection for diabetes induction.
The nondiabetic control group were treated with a distilled water vehicle. To compare the adropin level at different glucose conditions, the STZ-diabetic rats were treated daily for 7 days with long-lasting human insulin (1 IU/kg; Monotard® HM., Denmark, i.p.) or phloridzin (1 mg/kg; Fluka Chemie AG, Switzerland, i.p.)14 or vehicle, respectively.13 Phloridzin is a glycoside of phloretin, which is an established inhibitor of sodium glucose cotransporter (SGLT) to attenuate the hyperglycemia through inhibition of glucose reabsorption in intestine and/or kidney.15 Stattic is a pharmacological inhibitor of STAT3, which could be used both in vitro and in vivo.13 To investigate the interaction between adropin and STAT3, Stattic (ab120952, Abcam, Cambridge, UK) at indicated doses (1 mg/kg/day or 2 mg/kg/day) or vehicle were intravenously administered to the other groups of STZ-diabetic rats for 7 days.13 After the last dosing, rats were anesthetized with 2% isoflurane and blood samples were collected from the tail vein. Then, the livers were rapidly collected from the sacrificed animals. All samples were stored at −80°C until processing.
Biochemical Assay
To investigate the changes in diabetic rats, blood glucose levels were determined using commercial kit (DiaSys Diagnostic Systems, Germany).12 The levels of plasma Adropin were determined using commercial kit (Peninsula Laboratories International, Inc., San Carlos, CA, USA) as described previously.2
Cell Cultures
The human hepatoma cell line (HepG2 cells) obtained from the Culture Collection and Research Center of the Food Industry Institute (BCRC No. 60,025) were cultured in the Dulbecco’s modified Eagle’s medium (DMEM) (GE Healthcare Life Sciences, Pittsburgh, PA, USA) containing 10% fetal bovine serum (GE Healthcare Life Sciences, Pittsburgh, PA, USA), 1% penicillin/streptomycin (GE Healthcare Life Sciences) under standard conditions (95% air, 5% CO2, 37 °C). HepG2 cells (1×10⁶ cells/dish) were seeded in the 10-cm culture dishes.
To investigate the change of adropin in HepG2 cells under high-glucose conditions, cells were incubated in serum-free medium with varying concentrations of D-glucose (10, 20 or 30 mM) for 48 h. HepG2 cells exposed to normal medium containing 5.5 mM glucose were used as the controls for comparison. HepG2 cells treated with the culture medium supplemented with 30 mM mannitol to get an osmotic control as 30 mM glucose.
Small Interfering RNA (siRNA)
To understand the interaction between STAT3 and adropin, cells were transfected on 6 well plates at ~70% confluency. STAT3-specific siRNA (siSTAT3, 40 pmol, Dharmacon, Lafayette, CO, USA) or scrambled siRNA (Sc) were transfected into cells using Lipofectamine 2000 (Thermo Fisher Scientific, Inc., Waltham, MA, USA), according to the manufacturer’s protocols. Twenty-four hours after transfection, the cell culture medium was replaced with fresh medium, before being further investigated as described in our previous report.13
Intracellular Reactive Oxygen Species (ROS) and Superoxide Measurement
Intracellular ROS generation during hyperglycemia in HepG2 cells was measured by dihydroethidium (DHE) (Thermo Fisher Scientific Inc., Rockford, IL, USA) following a previous study.16 Cells were treated with high glucose plus tiron (1 µM or 5 µM) for 48 h. Tiron (4,5-dihydroxy-1,3-benzenedisulfonic; Sigma-Aldrich) is a membrane-permeable antioxidant,17 which has been shown to have a hepatoprotective effect.18 Cells treated with Tiron at the indicated concentrations did not show noticeable change in the cell growth. After treatment, HepG2 cells were incubated with DHE, a unique cell-permeable fluorogenic probe for 30 min at 37 °C and fixed. The fluorescence at Ex/Em=495/529 nm in the samples were measured by microplate reader.
Western Blotting Analysis
The protein samples were extracted from rat liver tissues and HepG2 cells. Equal amounts of protein (20 µg/lane) were separated using 10% sodium dodecyl sulfate -polyacrylamide gel electrophoreses (SDS-PAGE) and transferred to polyvinylidene difluoride membranes (Millipore, Billerica, MA, USA). The membranes were further incubated overnight at 4°C with primary antibodies against p-STAT3 (1:1000, phosphor-Y705, ab76315, Abcam, Cambridge, UK), STAT3 (1:1000, ab68153, Abcam), and β-actin (1:5000; Sigma-Aldrich). The membranes were continuously incubated with appropriate secondary antibodies and developed using a chemiluminescence kit (Thermo Scientific, Inc.). The immunoblot densities of the band corresponding to p-STAT3 (88 kDa), STAT3 (92 kDa), and β-actin (43 kDa) were detected and quantified using densitometric analysis.
Reverse Transcription-Polymerase Chain Reaction (RT‑PCR)
Total RNA was extracted from liver tissues or cell lysates using TRIzol (Qiagen, Hilden, Germany). One microgram of isolated RNA was reverse transcribed into cDNA using Transcriptor First Strand cDNA Synthesis Kit (Roche Diagnostics, Rotkreuz, ZG, Switzerland). The primer pairs of rat adropin (Enho) (5′-GCTCAACTCAGGCTCAGGAC-3′; 5′-CGACTTTCCAAGGAGGCTGT-3′) or human Enho gene (5ʹ-GTTGTCCCGCCTCTC-3ʹ; 5ʹ-CCACACACAGCGACTTCTTG-3ʹ) were designed by Roche Diagnostics based on a previous report.3 For quantification, real-time PCR analysis was performed using TaqMan PCR reagent kit (Roche Diagnostics) on a Light Cycler 480 II (Roche Diagnostics). The relative fold changes were quantified using the comparative threshold cycle method, and β‑actin was used as the internal control.19
Statistical Analysis
The results are showed as the mean ± SEM of the group of samples (n=6). Data were statistically analyzed using one-way analysis of variance followed by a post hoc Tukey’s multiple comparison test. Data analysis was performed using SPSS version 17 (IBM, Chicago, IL, USA). P < 0.05 indicated significant difference.
Results
Correction of Hyperglycemia Reversed the High Expression of Adropin in Diabetic Rats
An increase in plasma glucose was observed in diabetic rats as compared to normal rats (Figure 1A). After 7 days of treatment with insulin or phloridzin, the plasma glucose levels were significantly reduced in these diabetic rats, which was similar to the previous reports.20,21 Treatment of insulin or phloridzin at a dose sufficient to correct hyperglycemia reversed plasma adropin levels in diabetic rats (Figure 1B). Additionally, Enho expression (Figure 1C) and p-STAT3/STAT3 expression levels (Figure 1D) also increased in liver tissues of the diabetic group and decreased in the Insulin- or phloridzin-treated group.
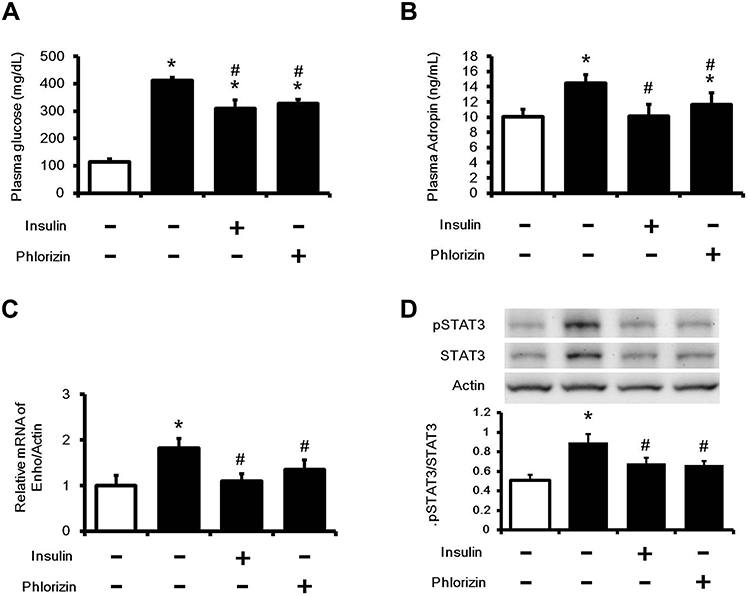 |
Figure 1 Changes in glucose levels and adropin concentrations in the serum and liver tissues of diabetic rats. STZ rats were treated with insulin (1 IU/kg, i.p.) or phloridzin (1 mg/kg, i.p.) to correct hyperglycemia. After 7 days treatment, (A) The serum glucose levels (B) The concentrations of adropin (C) Enho gene expression in liver tissues (D) pSTAT3/STAT3 expression ratio in liver tissues were measured. The values are expressed as the mean ± SEMs (n=6). *P < 0.05 compared with the normal control group, #P < 0.05 compared with the vehicle-treated diabetic group. |
High Glucose Mediated STAT3 Activation, Enho Gene Expression and ROS Production in HepG2 Cells
In the present experiments, cells were incubated with various concentration of glucose (final concentration range from 10 mM to 30 mM). The ratio of p-STAT3 to STAT3 and Enho mRNA levels in HepG2 cells were markedly increased alone with the changes in glucose concentrations (Figure 2A, 2B). Meanwhile, the mediation of osmolarity in the effects of high-glucose has been ruled out by mannitol. Thus, the possibility that hyperosmolarity affects STAT3 and Enho mRNA expression has been excluded. Moreover, intracellular ROS and superoxide were significant increase in the cells treated with high glucose (Figure 2C and D). Therefore, the high glucose improved adropin gene expression in HepG2 cells, which was consistent with that in the diabetic rats.
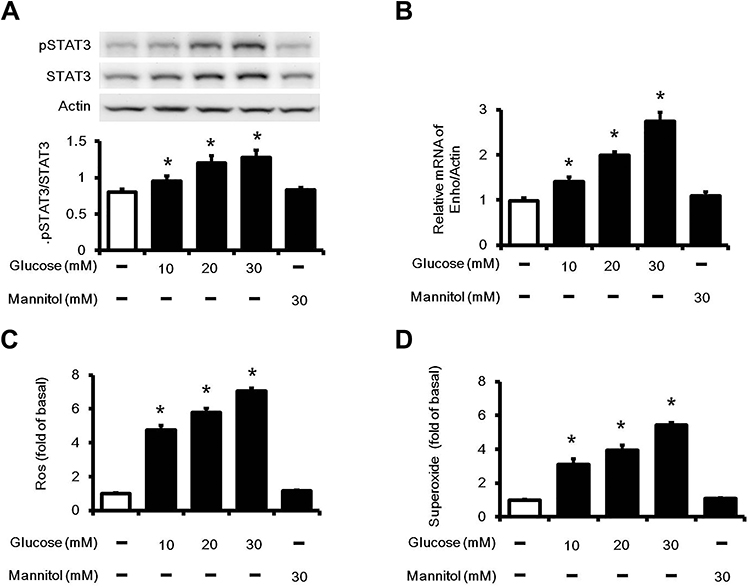 |
Figure 2 STAT3 and Enho expression in high glucose-treated HepG2 cells. Cells were incubated in normal (5.5 mM) or varying concentrations (10, 20 or 30 mM) glucose medium for 24 hours. (A) The ratio of pSTAT3 to STAT3 expression, (B) Enho mRNA levels were increased by glucose at different concentrations. To evaluate hyperglycemia-induced oxidative stress, (C) changes in ROS and (D) superoxide observed in the cells were measured. The values are expressed as the mean ± SEMs (n=6). *P < 0.05 compared with the normal control group. |
The Effects of Tiron in High Glucose-Induced HepG2 Cells
After administered with tiron, the pSTAT3/STAT3 ratio and Enho gene expression were decreased (Figure 3A and B) and accompanied by the reduction of high glucose induced ROS and superoxide formation (Figure 3C and D).
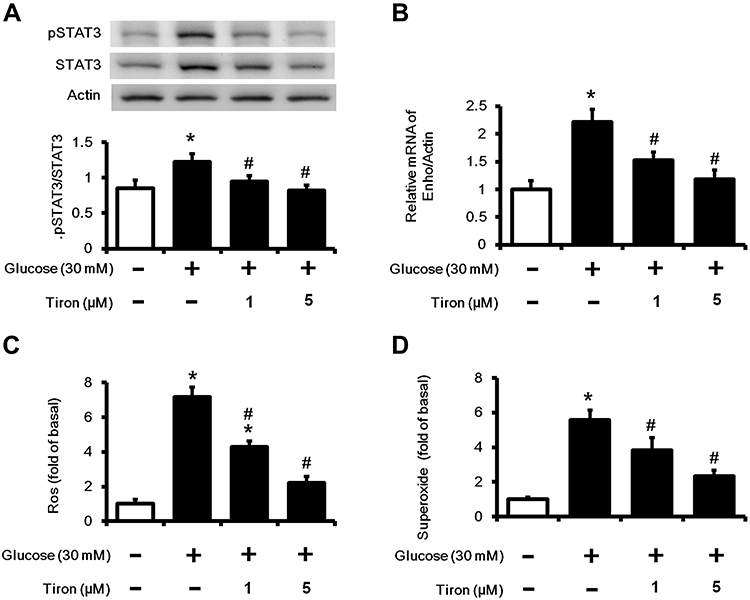 |
Figure 3 Effect of tiron in high glucose-induced HepG2 cells. Cells were treated with high glucose plus tiron (10−6M or 5×10⁻⁶ M) for 48 h, (A) The ratio of pSTAT3 to STAT3, (B) Enho mRNA levels, (C) ROS and (D) superoxide production were measured. *P < 0.05 compared with the normal control group; #P < 0.05 compared with the high glucose treated vehicle group. |
STAT3 Mediated Enho Gene Expression in High Glucose-Induced HepG2 Cells
To understand the interaction between STAT3 and Enho gene expression in high glucose-induced HepG2 cells, siRNA was used to silence STAT3 expression. The significant decrease of expression of pSTAT3 and STAT3 were confirmed in the cells transfected with siSTAT3 and treated with high glucose (Figure 4A). Notably, mRNA expression levels of adropin (Enho) (Figure 4B) were significantly decreased in STAT3 knockdown cells. However, the Enho gene expression did not change in cells transfected with Sc (negative control). Thus, STAT3 silencing reduced Enho gene expression in HepG2 Cells.
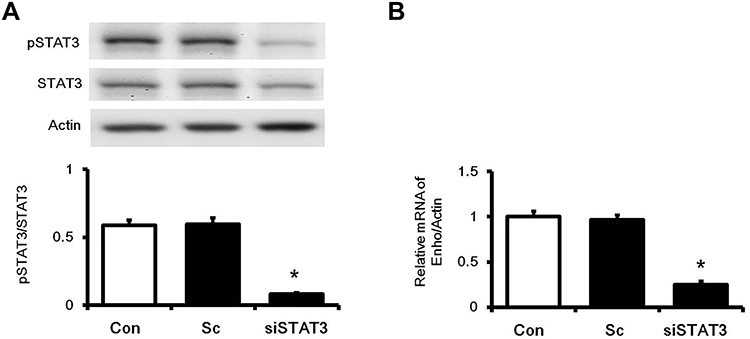 |
Figure 4 Effects of STAT3 activation on the increase in Enho expression in high glucose-induced HepG2 cells. To understand the interaction between STAT3 and adropin, cells were transfected into siSTAT3 (40 pmol) or scrambled siRNA (Sc). Twenty-four hours after transfection, (A) Western blot confirmed silencing of STAT3 expression. (B) The expression of adropin mRNA (Enho) was significantly reduced in cells transfected with siRNA of STAT3. The values are expressed as the mean ± SEMs (n=6). *P < 0.05 compared to the normal control group. |
Stattic Inhibited the Adropin (Enho) Expression in vitro and in vivo
In the present study, cells treated with Stattic at the indicated concentrations did not show noticeable change in cell growth. After treated with Stattic, the expression levels of p-STAT3 and STAT3 were markedly decreased in HepG2 cells (Figure 5A). Similarly, the mRNA levels of Enho (Figure 5B) were significantly attenuated in Stattic treated cells. In the diabetic rats, Stattic inhibited STAT3 activation, resulting in the reduction of Enho expression in liver (Figure 5C and D). However, administration of Stattic in rats did not affect the blood glucose levels compared with vehicle treated diabetic group (Figure 5E), which was consistent with a previous report.18 Our result demonstrates that STAT3 activation is associated with adropin expression in diabetic rats. This finding provides additional data to support the hypothesis that the decrease in STAT3 activation results in a reduction in adropin expression in the liver.
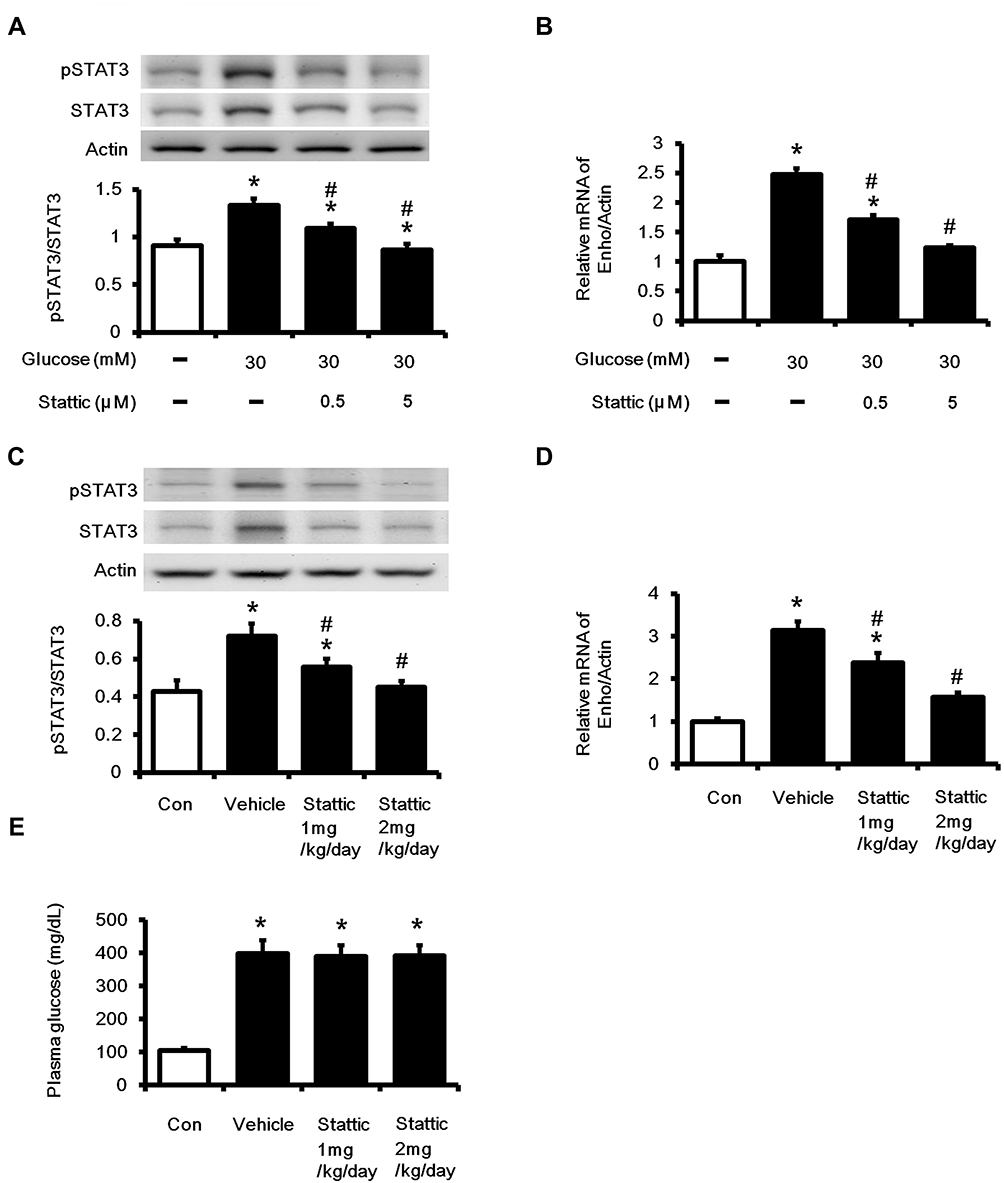 |
Figure 5 Effects of Stattic on the Enho gene expression in high glucose-exposed HepG2 cells and in the liver tissues of diabetic rats. Cells were treated with high glucose plus tiron (5×10⁻⁷M or 5×10⁻⁶ M) for 48 h, (A) the ratios of p-STAT3/STAT3 protein levels, (B) Enho mRNA levels were measured. In STZ rat, vehicle or stattic at different doses (1 mg/kg/day or 2 mg/kg/day) were intravenously administered for 7 days, (C) the ratio of p-STAT3/STAT3 protein levels in the liver tissues, (D) Enho mRNA levels in the liver tissues, (E) the blood glucose levels were measured. (C–E) “Con” indicated the nondiabetic control rats. The values are expressed as the mean ± SEMs (n=6). *P < 0.05 compared to the normal control group. #P < 0.05 compared to the vehicle-treated diabetic group. |
Discussion
In the present study, we demonstrated that hyperglycemia may activate STAT3 to promote adropin expression in the liver. This finding is consistent with a previous report,2 which indicated that higher adropin levels occur spontaneously in the livers of diabetic rats. However, the increase in the hyperglycemia-induced adropin expression through STAT3 activation in the liver is a novel finding not previously mentioned.
First, we generated type 1-like diabetic rats using STZ injection, as in a previous report that showed higher adropin levels in both the serum and tissues.2 Interestingly, low plasma adropin is observed in patients without hyperglycemia, including patients with gestational diabetes mellitus22 and polycystic ovary syndrome.7 Therefore, plasma adropin levels seems to be associated with plasma glucose in patients with diabetes. We confirmed this hypothesis by pharmacologically correcting hyperglycemia in diabetic rats. Insulin and phloridzin attenuates hyperglycemia in rats through different mechanisms: insulin decreases blood glucose through receptor-coupled signaling, while phloridzin acts as an inhibitor of renal tubular glucose reabsorption.13 In the phloridzin or insulin-treated diabetic rats, correction of hyperglycemia and reversal of plasma adropin level was observed. Additionally, similar changes in STAT3 activation as those in adropin expression were observed in the liver of diabetic rats. Therefore, hyperglycemia is associated with the increase in adropin in diabetic rats.
Next, we investigated the potential mechanisms of the increase in adropin in the liver using HepG2 cells.23 We applied the mRNA primer for adropin named Enho that is specific for humans.3 HepG2 cells were treated with high glucose levels to mimic diabetic disorders in vitro and confirmed the increased Enho expression or signal transducer and STAT3 activation. STAT3 is a cytoplasmic transcription factor that transmits extracellular signals to the nucleus.24 Activated STAT3 in the nucleus binds to specific DNA promoter sequences to regulate Enho gene expression.11 Hyperglycemia activated STAT3 expression25 additionally increased tissue damage.9 It has been reported that high glucose conditions increased STAT3 phosphorylation and nuclear translocation. In the present study, we confirmed that STAT3 activation and higher expression of the Enho gene were induced by hyperglycemia in HepG2 cells. The phosphorylation of STAT3 at Y705 and S727 induced by high glucose to activate STAT3 in cells may enhance the progression of cancer.26 However, we did not find the same change in HepG2 cells. Moreover, silencing STAT3 reversed the increased expression of Enho induced by high glucose in HepG2 cells. A STAT3 specific inhibitor (Stattic) also reversed the altered Enho expression in cells, as in a way similar to that observed in the type 1-like diabetic rats, thereby indicating that STAT3 regulates Enho expression, which has not been previously mentioned.
An increase in STAT3 phosphorylation by oxidative stress has been previously shown.27 ROS generation by diacylglycerol (DAG)/protein kinase C (PKC) and the NADPH oxidase pathway has been observed in diabetes.28 ROS and/or oxidative stress induced by glucose fluctuations and/or hyperglycemia mediate diabetic complications.29 Generally, glucose fluctuations are more harmful than constant hyperglycemia.30 Therefore, ROS can be vital factors in triggering the activation of downstream signaling pathways, including the STAT3 pathway. We measured the intracellular ROS levels in HepG2 cells and found a glucose-dependent increase in ROS levels in cells. Notably, tiron inhibits the increase in Enho expression and STAT3 activation under hyperglycemic conditions in HepG2 cells. Tiron was previously shown to be an antioxidant,18 and it produces these effects at a dose sufficient to inhibit intracellular ROS in HepG2 cells. There is no doubt that ROS induced by high glucose are responsible for STAT3 activation, similar to previous views.13,19,27 Expression of the Enho gene is promoted by STAT311 and we confirmed it in HepG2 cells by silencing STAT3 with a specific inhibitor (Stattic). Therefore, hyperglycemia produced ROS to activate STAT3 to induce higher expression of Enho gene in HepG2 cells.
Moreover, treatment with Stattic reversed the plasma adropin levels but did not change the blood glucose levels in type 1-like diabetic rats. Therefore, higher adropin levels in the blood are associated with STAT3 in diabetes. Pharmacologically, Stattic is specific.31 However, Stattic is widely applied as a specific inhibitor of STAT3.13,32 Considering the results in cells using STAT3 siRNA, nonspecific action of Stattic in the current study seems unlikely.
Cytokine receptor-dependent Janus kinase/signal transducer and activator of transcription (JAK/STAT) activation is the main source of STAT3.33 Diabetes is considered in part to be a consequence of subclinical chronic low-grade inflammation.34 The role is cytokines in the pathogenesis of diabetic disorders, particularly type 2 diabetes, has been established.35 However, the current study did not evaluate changes in cytokines that may also influence STAT3 and this is one of the limitations of the study. Additionally, the association of circulating adropin with hepatic adropin is still unclear. This relationship needs to investigate in the near future.
Conclusion
The obtained results showed that the activation of STAT3 is involved in the genetic regulation of adropin, increasing the levels of circulating adropin and promoting Enho expression in the livers of diabetic rats. STAT3 could be a novel therapeutic target to treat complications of diabetes induced by adropin.
Disclosure
The authors report no conflicts of interest in this work.
References
1. Kumar KG, Trevaskis JL, Lam DD, et al. Identification of adropin as a secreted factor linking dietary macronutrient intake with energy homeostasis and lipid metabolism. Cell Metab. 2008;8(6):468–481. doi:10.1016/j.cmet.2008.10.011
2. Aydin S, Kuloglu T, Aydin S, et al. Expression of adropin in rat brain, cerebellum, kidneys, heart, liver, and pancreas in streptozotocin-induced diabetes. Mol Cell Biochem. 2013;380(1–2):73–81. doi:10.1007/s11010-013-1660-4
3. Lovren F, Pan Y, Quan A, et al. Adropin is a novel regulator of endothelial function. Circulation. 2010;122(11 Suppl):S185–S192. doi:10.1161/CIRCULATIONAHA.109.931782
4. Stein LM, Yosten GL, Samson WK. Adropin acts in brain to inhibit water drinking: potential interaction with the orphan G protein-coupled receptor, GPR19. Am J Physiol Regul Integr Comp Physiol. 2016;310(6):R476–R480. doi:10.1152/ajpregu.00511.2015
5. Ganesh Kumar K, Zhang J, Gao S, et al. Adropin deficiency is associated with increased adiposity and insulin resistance. Obesity (Silver Spring). 2012;20(7):1394–1402. doi:10.1038/oby.2012.31
6. Zang H, Jiang F, Cheng X, Xu H, Hu X. Serum adropin levels are decreased in Chinese type 2 diabetic patients and negatively correlated with body mass index. Endocr J. 2018;65(7):685–691. doi:10.1507/endocrj.EJ18-0060
7. Yildirim B, Celik O, Aydin S. Adropin: a key component and potential gatekeeper of metabolic disturbances in policystic ovarian syndrome. Clin Exp Obstet Gynecol. 2014;41(3):310–312.
8. Kutlu O, Altun O, Dikker O, et al. Serum adropin levels are reduced in adult patients with nonalcoholic fatty liver disease. Med Princ Pract. 2019;28(5):463–469. doi:10.1159/000500106
9. Chen Y, Wang JJ, Li J, et al. Activating transcription factor 4 mediates hyperglycaemia-induced endothelial inflammation and retinal vascular leakage through activation of STAT3 in a mouse model of type 1 diabetes. Diabetologia. 2012;55(9):2533–2545. doi:10.1007/s00125-012-2594-1
10. Cimica V, Chen H-C, Iyer JK, Reich NC, Cheriyath V. Dynamics of the STAT3 transcription factor: nuclear import dependent on ran and importin-beta1. PLoS One. 2011;6(5):e20188. doi:10.1371/journal.pone.0020188
11. Wang LY, Cheng KC, Li Y, Niu CS, Cheng JT, Niu HS. Glycyrrhizic acid increases glucagon like peptide-1 secretion via TGR5 activation in type 1-like diabetic rats. Biomed Pharmacother. 2017;95:599–604. doi:10.1016/j.biopha.2017.08.087
12. Cheng JT, Huang CC, Liu IM, Tzeng TF, Chang CJ. Novel mechanism for plasma glucose-lowering action of metformin in streptozotocin-induced diabetic rats. Diabetes. 2006;55(3):819–825. doi:10.2337/diabetes.55.03.06.db05-0934
13. Wang CM, Hsu CT, Niu HS, Chang CH, Cheng JT, Shieh JM. Lung damage induced by hyperglycemia in diabetic rats: the role of signal transducer and activator of transcription 3 (STAT3). J Diabetes Complications. 2016;30(8):1426–1433. doi:10.1016/j.jdiacomp.2016.07.005
14. Cheng MF, Chen LJ, Cheng JT. Decrease of klotho in the kidney of streptozotocin-induced diabetic rats. J Biomed Biotechnol. 2010;2010:513853. doi:10.1155/2010/513853
15. Londzin P, Siudak S, Cegiela U, et al. Phloridzin, an apple polyphenol, exerted unfavorable effects on bone and muscle in an experimental model of type 2 diabetes in rats. Nutrients. 2018;10(11):1701. doi:10.3390/nu10111701
16. Cheng KC, Chang WT, Kuo FY, Chen ZC, Li Y, Cheng JT. TGR5 activation ameliorates hyperglycemia-induced cardiac hypertrophy in H9c2 cells. Sci Rep. 2019;9(1):3633. doi:10.1038/s41598-019-40002-0
17. Oyewole AO, Birch-Machin MA. Mitochondria-targeted antioxidants. FASEB J. 2015;29(12):4766–4771. doi:10.1096/fj.15-275404
18. Morgan A, Ibrahim MA, Galal MK, Ogaly HA, Abd-Elsalam RM. Innovative perception on using tiron to modulate the hepatotoxicity induced by titanium dioxide nanoparticles in male rats. Biomed Pharmacother. 2018;103:553–561. doi:10.1016/j.biopha.2018.04.064
19. Kuo FY, Lee SP, Cheng JT, Wu MC. Cardiac TGR5 expression enhanced by hyperglycaemia in diabetic rats: a preclinical warning for disorders with excess bile acids. Integr Mol Med. 2019;6:1–7.
20. Kuo SC, Li Y, Cheng KC, Niu CS, Cheng JT, Niu HS. Investigation of the pronounced erythropoietin-induced reduction in hyperglycemia in type 1-like diabetic rats. Endocr J. 2018;65(2):181–191. doi:10.1507/endocrj.EJ17-0353
21. Najafian M, Jahromi MZ, Nowroznejhad MJ, et al. Phloridzin reduces blood glucose levels and improves lipids metabolism in streptozotocin-induced diabetic rats. Mol Biol Rep. 2012;39(5):5299–5306. doi:10.1007/s11033-011-1328-7
22. Ryu RJ, Hays KE, Hebert MF. Gestational diabetes mellitus management with oral hypoglycemic agents. Semin Perinatol. 2014;38(8):508–515. doi:10.1053/j.semperi.2014.08.012
23. Lin CL, Huang HC, Lin JK. Theaflavins attenuate hepatic lipid accumulation through activating AMPK in human HepG2 cells. J Lipid Res. 2007;48(11):2334–2343. doi:10.1194/jlr.M700128-JLR200
24. Miller AM, Wang H, Bertola A, et al. Inflammation-associated interleukin-6/signal transducer and activator of transcription 3 activation ameliorates alcoholic and nonalcoholic fatty liver diseases in interleukin-10-deficient mice. Hepatology. 2011;54(3):846–856. doi:10.1002/hep.24517
25. Li X, Cai Y, Wang YS, et al. Hyperglycaemia exacerbates choroidal neovascularisation in mice via the oxidative stress-induced activation of STAT3 signalling in RPE cells. PLoS One. 2012;7(10):e47600. doi:10.1371/journal.pone.0047600
26. Saengboonmee C, Seubwai W, Pairojkul C, Wongkham S. High glucose enhances progression of cholangiocarcinoma cells via STAT3 activation. Sci Rep. 2016;6(1):18995. doi:10.1038/srep18995
27. Chiu YH, Ku PM, Cheng YZ, Li Y, Cheng JT, Niu HS. Phosphorylation of signal transducer and activator of transcription 3 induced by hyperglycemia is different with that induced by lipopolysaccharide or erythropoietin via receptor-coupled signaling in cardiac cells. Mol Med Rep. 2018;17(1):1311–1320. doi:10.3892/mmr.2017.7973
28. Huynh K, Bernardo BC, McMullen JR, Ritchie RH. Diabetic cardiomyopathy: mechanisms and new treatment strategies targeting antioxidant signaling pathways. Pharmacol Ther. 2014;142(3):375–415. doi:10.1016/j.pharmthera.2014.01.003
29. Zhang Z-Y, Miao L-F, Qian -L-L, et al. Molecular mechanisms of glucose fluctuations on diabetic complications. Front Endocrinol (Lausanne). 2019;10:640. doi:10.3389/fendo.2019.00640
30. Mori K, Emoto M, Abe M, Inaba M. Visualization of blood glucose fluctuations using continuous glucose monitoring in patients undergoing hemodialysis. J Diabetes Sci Technol. 2019;13(2):413–414. doi:10.1177/1932296818818429
31. Szelag M, Sikorski K, Czerwoniec A, Szatkowska K, Wesoly J, Bluyssen HA. In silico simulations of STAT1 and STAT3 inhibitors predict SH2 domain cross-binding specificity. Eur J Pharmacol. 2013;720(1–3):38–48. doi:10.1016/j.ejphar.2013.10.055
32. Boengler K, Ungefug E, Heusch G, Schulz R. The STAT3 inhibitor stattic impairs cardiomyocyte mitochondrial function through increased reactive oxygen species formation. Curr Pharm Des. 2013;19(39):6890–6895. doi:10.2174/138161281939131127115940
33. Wang L, Li J, Li D. Losartan reduces myocardial interstitial fibrosis in diabetic cardiomyopathy rats by inhibiting JAK/STAT signaling pathway. Int J Clin Exp Pathol. 2015;8(1):466–473.
34. Calle MC, Fernandez ML. Inflammation and type 2 diabetes. Diabetes Metab. 2012;38(3):183–191. doi:10.1016/j.diabet.2011.11.006
35. Donath MY. Targeting inflammation in the treatment of type 2 diabetes: time to start. Nat Rev Drug Discov. 2014;13(6):465–476. doi:10.1038/nrd4275
 © 2020 The Author(s). This work is published and licensed by Dove Medical Press Limited. The full terms of this license are available at https://www.dovepress.com/terms.php and incorporate the Creative Commons Attribution - Non Commercial (unported, v3.0) License.
By accessing the work you hereby accept the Terms. Non-commercial uses of the work are permitted without any further permission from Dove Medical Press Limited, provided the work is properly attributed. For permission for commercial use of this work, please see paragraphs 4.2 and 5 of our Terms.
© 2020 The Author(s). This work is published and licensed by Dove Medical Press Limited. The full terms of this license are available at https://www.dovepress.com/terms.php and incorporate the Creative Commons Attribution - Non Commercial (unported, v3.0) License.
By accessing the work you hereby accept the Terms. Non-commercial uses of the work are permitted without any further permission from Dove Medical Press Limited, provided the work is properly attributed. For permission for commercial use of this work, please see paragraphs 4.2 and 5 of our Terms.