")
Back to Journals » Cancer Management and Research » Volume 11
Promising diagnostic and prognostic value of E2Fs in human hepatocellular carcinoma
Authors Huang Y, Ning G, Chen L, Lian Y , Gu Y, Wang J, Chen D, Wei H , Huang Y
Received 31 July 2018
Accepted for publication 13 January 2019
Published 19 February 2019 Volume 2019:11 Pages 1725—1740
DOI https://doi.org/10.2147/CMAR.S182001
Checked for plagiarism Yes
Review by Single anonymous peer review
Peer reviewer comments 2
Editor who approved publication: Professor Harikrishna Nakshatri
Yan-Lin Huang,1,2,* Gang Ning,1,* Lu-Biao Chen,1,* Yi-Fan Lian,2 Yu-Rong Gu,1,2 Jia-Liang Wang,2 Dong-Mei Chen,2 Huan Wei,2 Yue-Hua Huang1,2
1Department of Infectious Diseases, The Third Affiliated Hospital of Sun Yat-sen University, Guangzhou, China; 2Guangdong Provincial Key Laboratory of Liver Disease Research, The Third Affiliated Hospital of Sun Yat-sen University, Guangzhou, China
*These authors contributed equally to this work
Background: A growing body of evidence suggests that E2Fs, by regulating gene expression related to cell cycle progression and other cellular processes, play a pivotal role in human cancer. However, the distinct roles of each E2F in the development and treatment of hepatocellular carcinoma (HCC) remain unknown. In the present study, the mRNA expression and prognostic value of different E2Fs in HCC are analyzed.
Materials and methods: Transcriptional and survival data related to E2F expression in patients with HCC were obtained through ONCOMINE and UALCAN databases. Survival analysis plots were drawn with Kaplan–Meier Plotter. The sequence alteration data for E2Fs were obtained from The Cancer Genome Atlas and c-BioPortal. Gene functional enrichment analyses were performed in Database for Annotation, Visualization and Integrated Discovery.
Results: The mRNA expression levels of E2F1–E2F8 were all significantly upregulated in HCC patients, and high expression of each E2F was obviously related to poor prognosis. Similarly, the expression of E2Fs showed prognostic prediction value in HCC patients with different cancer stages and pathological grades. Moreover, the mutation rate of E2Fs was relatively high in HCC patients, and the DNA sequence alterations primarily occurred in E2F5, E2F3, and E2F6, which were associated with worse overall survival and disease-free survival in HCC patients. Network analysis confirmed that the expression levels of cell cycle-related genes were mostly affected by E2F mutations.
Conclusion: High expression of individual E2Fs was associated with poor prognosis in all liver cancer patients. E2Fs may be exploited as good prognostic targets for comprehensive management of HCC patients, but this notion should be further evaluated in clinical studies.
Keywords: HCC, E2F, prognosis, ONCOMINE, Kaplan–Meier plotter
Introduction
Hepatocellular carcinoma (HCC) is the sixth most common, aggressive cancer and the third leading cause of cancer-associated mortality worldwide.1,2 Unfortunately, to date, the precise molecular mechanisms involved in the development, progression, and metastasis of HCC remain largely unknown despite tremendous efforts in the past decades. Moreover, the incidence of HCC is increasing rapidly, and only ~9% of HCC patients survive for >5 years.3 The poor prognosis of HCC is largely attributed to the rapid progression of this disease.4–6 Advances in HCC treatment will no doubt depend on a better understanding of the biology and behavior of HCC. Recently, the mammalian E2F family of transcription factors has been found to have a close relationship with HCC, which may help in finding novel prognostic and therapeutic targets for HCC.7
The mammalian E2Fs lay downstream of cell cycle signaling and play a crucial role in control of cell proliferation, differentiation, senescence, and apoptosis as well as other cellular processes by regulating the expression of a large number of targeted genes related to cell cycle progression.8–10 Since the discovery of the first member, E2F1, in the 1980s, a total of eight E2Fs, E2F1–E2F8, have been identified in mammalian cells.11,12 Conventionally, these eight E2Fs are classified into three categories based on their functional properties and structural features: activator E2Fs (E2F1–E2F3), repressor E2Fs (E2F4–E2F5), and inhibitor E2Fs (E2F6–E2F8).13 In mammalian cells, E2Fs form a network with retinoblastoma protein (pRb) and cyclin-dependent kinases (CDKs) to participate in regulation of the transcriptional activities of cell cycle-related genes.14 Given their important roles in cell cycle regulation, E2Fs are reportedly associated with the development and progression of various types of human cancer.15,16 In recent years, a growing body of evidence has indicated that E2Fs are intimately associated with HCC. For example, E2F1 and E2F3 have been found to be substantially upregulated in HCC tissues compared with adjacent nontumoral tissues.17,18 E2F5 was significantly overexpressed in primary HCC, and knockdown of E2F5 repressed the growth of HCC cells.19 Similarly, E2F8 was also reported to contribute to the oncogenic potential of HCC by upregulating cyclin D1 transcription and enhancing the accumulation of S-phase cells.20
Though their relationship with human cancer is clear, the function of E2Fs in cancer varies. Certain E2Fs, such as E2F3 and E2F4, have been reported to contribute to carcinogenesis, while others, such as E2F1, exhibit tumor suppressive properties in mouse models and specific human cancer types through an unknown mechanism. More surprisingly, even the function of individual E2Fs in the same tumor can be controversial.21 For example, dysregulation of E2F1 can either promote or inhibit tumorigenesis.7 Thus, analyzing the expression, mutation, and prognostic values of different E2Fs in HCC patients via bioinformatics analysis may help to further distinguish their potential roles in HCC. In this study, we address this problem.
Materials and methods
Ethics statement
The study protocol was approved by the Ethics Committee of the Third Affiliated Hospital of Sun Yat-sen University for Human Study and conducted according to the principles of the Declaration of Helsinki. All the data were retrieved from published literature.
ONCOMINE database analysis
The ONCOMINE database (www.oncomine.org), an integrated online cancer microarray database for DNA or RNA sequence analysis, aims at facilitating discovery from gene-wide expression analyses.22 In this study, data regarding transcriptional expression of E2Fs between cancer samples and corresponding normal control liver samples were obtained from the ONCOMINE database, and the differences were compared using Student’s t-test. The cutoff P and fold-change values were as follows: P-value: 0.05; fold change: 1.5; gene rank: 10%; data type: mRNA. Significant correlations are shown in Figure 1.
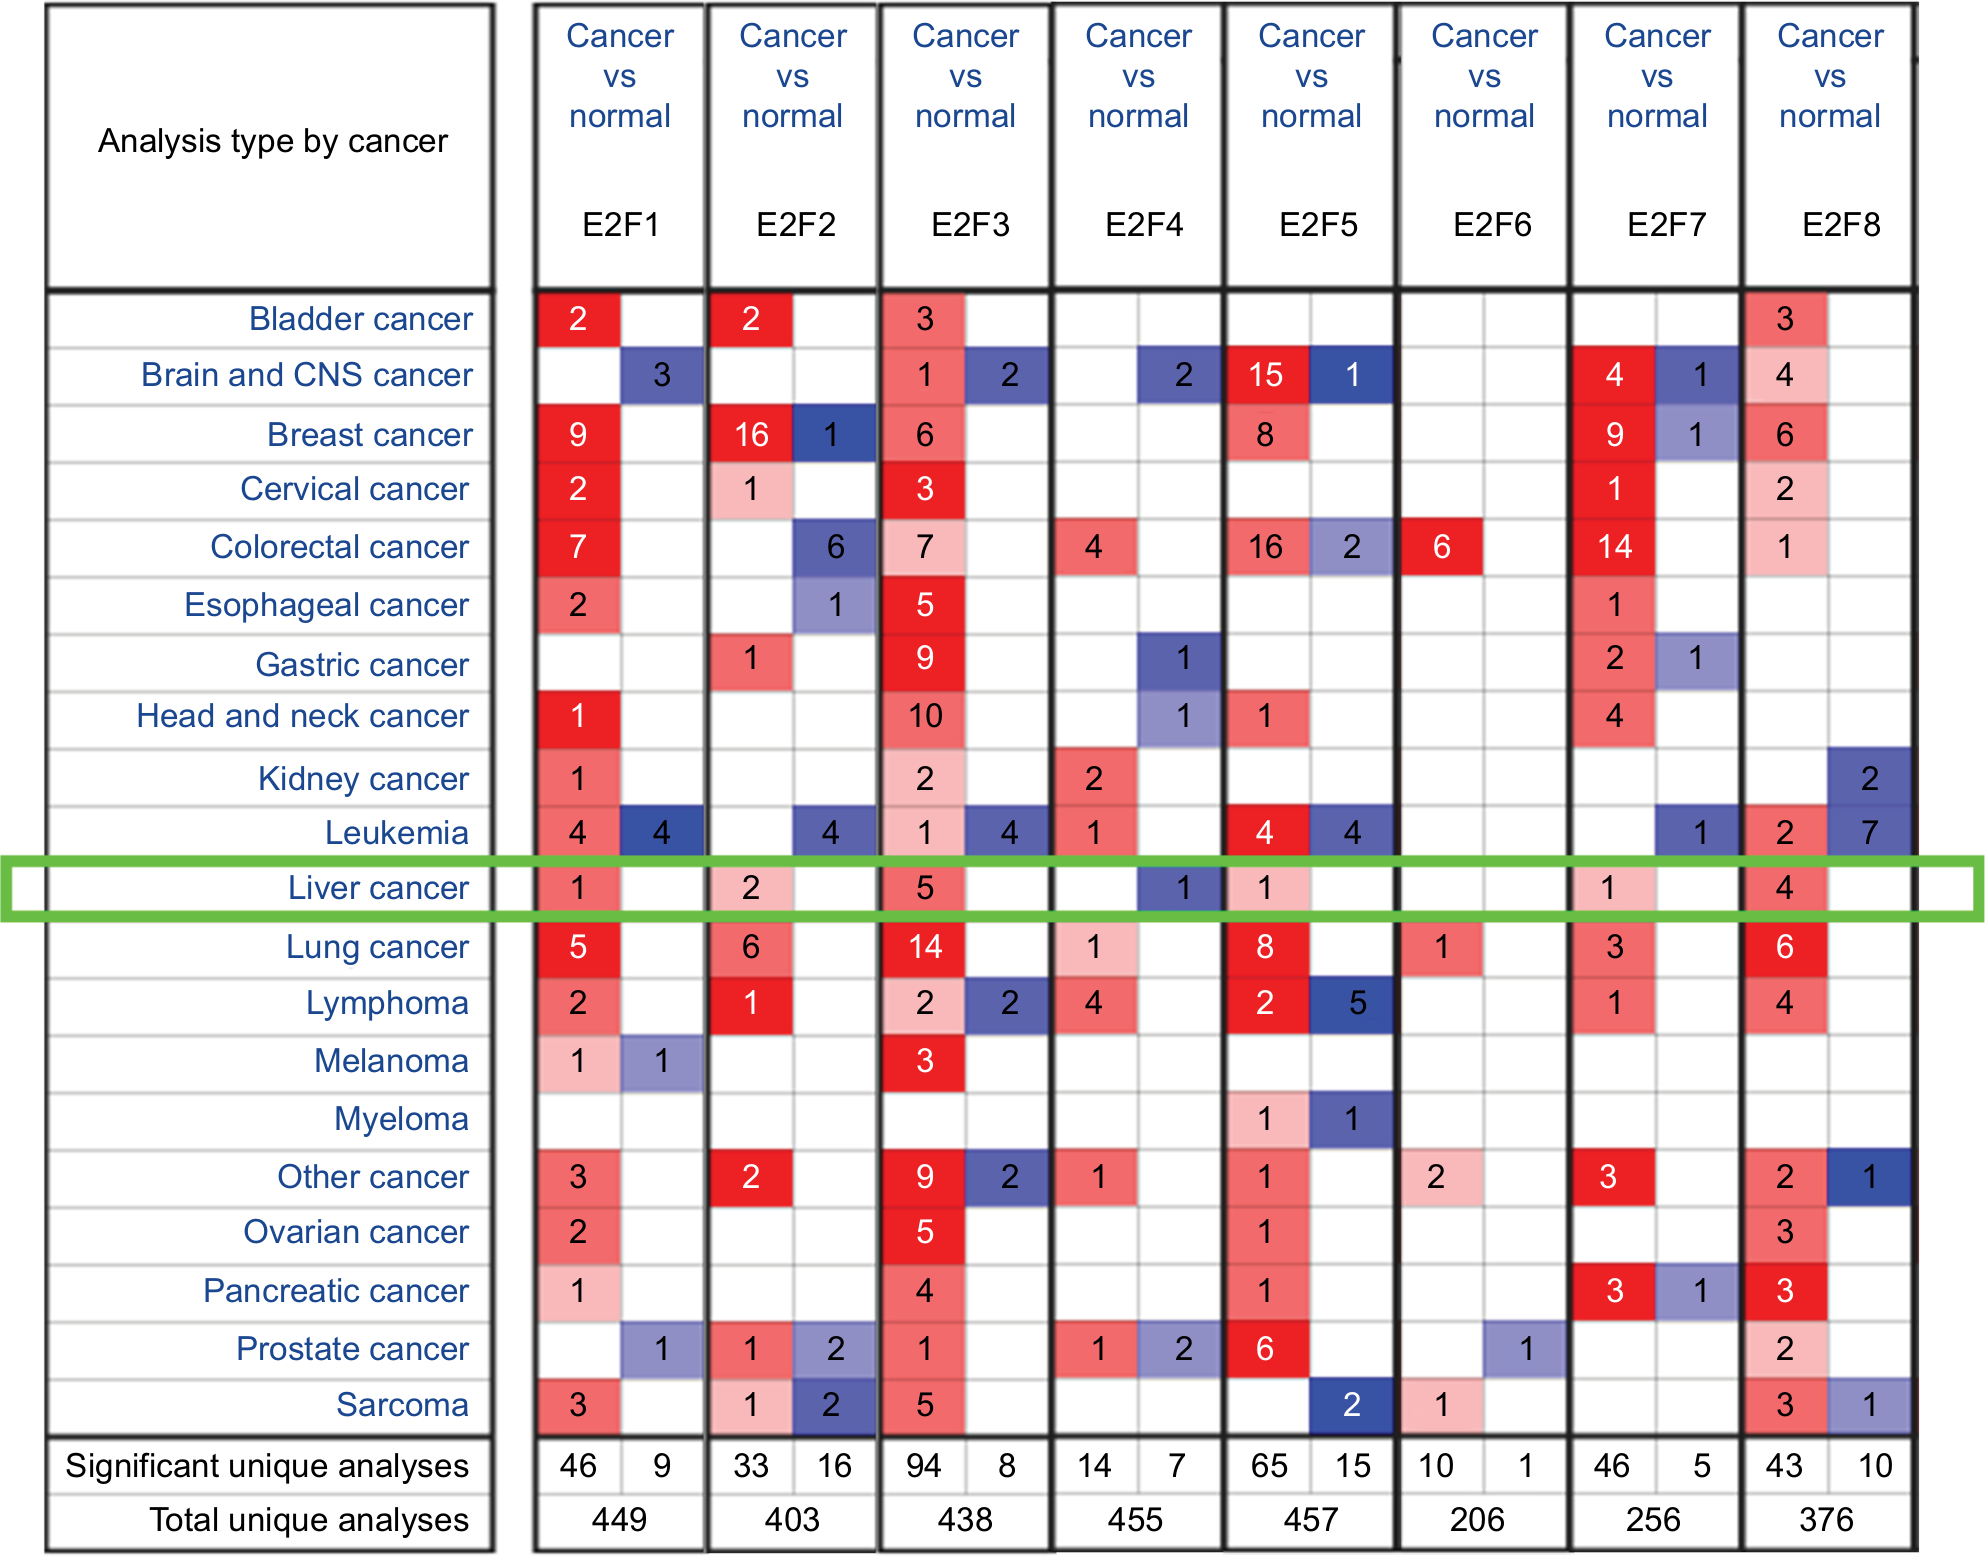 | Figure 1 E2F gene expression in 20 different cancer types. Notes: E2F1–E2F8 mRNA expression (cancer tissue vs normal tissue) was analyzed using the ONCOMINE database. The numbers in colored cells show the quantities of datasets with statistically significant mRNA overexpression (red) or underexpression (blue) of target genes. Cell color was determined by the best gene rank percentile for the analysis within the cells. The number in each cell represents the number of analyses that satisfied the threshold, such as gene rank percentile (10%), P-value (0.05), and fold change (1.5). |
UALCAN
UALCAN (http://ualcan.path.uab.edu) is a newly developed web portal based on level 3 RNA-seq and clinical data from 31 cancer types in The Cancer Genome Atlas (TCGA) database. UALCAN provides web resources that allow cancer researchers and clinicians to analyze the relative expression of a query gene(s) across tumor and normal samples and relative clinicopathologic parameters, obtain a survival plot to estimate the effect of a gene expression level and clinicopathologic parameters on patient survival, and identify novel genes in various individual cancer types.23
The Kaplan–Meier plotter
The prognostic value of the expression of featured E2Fs was analyzed using an open online database, Kaplan–Meier (http://kmplot.com/analysis), which was established using gene expression data and survival information for liver cancer24 and four other types of cancer, namely, breast cancer, ovarian cancer, lung cancer, and gastric cancer.24–27 The desired probe ID was determined according to the file of probe sets provided by K–M plotter. Briefly, eight different E2Fs were entered into the database (http://kmplot.com/analysis/index.php?p=service&cancer=liver_rnaseq). The cancer patients were divided into high and low expression groups according to the median mRNA expression values and validated by K–M survival curves. The number-at-risk cases, median mRNA expression levels, HRs, 95% CIs, and P-values were displayed on the K–M plotter webpage. A P-value <0.01 was considered statically significant.
TCGA and c-BioPortal databases
TCGA, a comprehensive and coordinated project designed to improve diagnosis methods, treatment standards, and ultimately prevent cancer, has helped TCGA users analyze large groups of over 30 human tumors through application of genome analysis technologies, including large-scale genome sequencing and pathological data analysis.28 c-BioPortal (www.cbioportal.org) is an online open-access resource for exploring, visualizing, and analyzing multidimensional cancer genomics data.29 In this study, c-BioPortal was used to access liver HCC (TCGA, Provisional) data. The selected genomic profiles contained mutations, putative copy number alterations from GISTIC and mRNA expression Z-scores (RNASeq V2 RSEM). Eight target genes were automatically calculated using Z-score ±2.0. OncoPrint, overall survival (OS), or disease-free survival (DFS) plotter were obtained according to the online instructions in c-BioPortal.
Gene Ontology (GO) and Kyoto Encyclopedia of Genes and Genomes (KEGG) pathway enrichment analysis
The Database for Annotation, Visualization and Integrated Discovery (DAVID; https://david.ncifcrf.gov/)30 was used to perform GO and KEGG analyses of eight E2F genes. The human genome was selected as the background parameter. P<0.05 was set as the threshold to indicate a statistically significant difference.
Results
Transcriptional expression of different E2Fs in patients with HCC
Eight E2Fs have been identified in the human genome, and their mRNA expression levels in human cancer have been determined using the ONCOMINE database. As shown in Figure 1, we first calculated the expression levels of E2Fs in 20 types of cancer compared with adjacent nontumoral tissues. Noticeably, as shown in Table 1, E2F mRNA expression was significantly upregulated in HCC samples, except E2F4 and E2F6 (fold change >1.5, P-value <0.05).31–33 These results show that the mRNA expression of E2F1/2/3/5/7/8 is distinctively high in liver cancer tissues compared with normal liver tissues, suggesting that E2Fs might play important roles in the development of liver cancer.
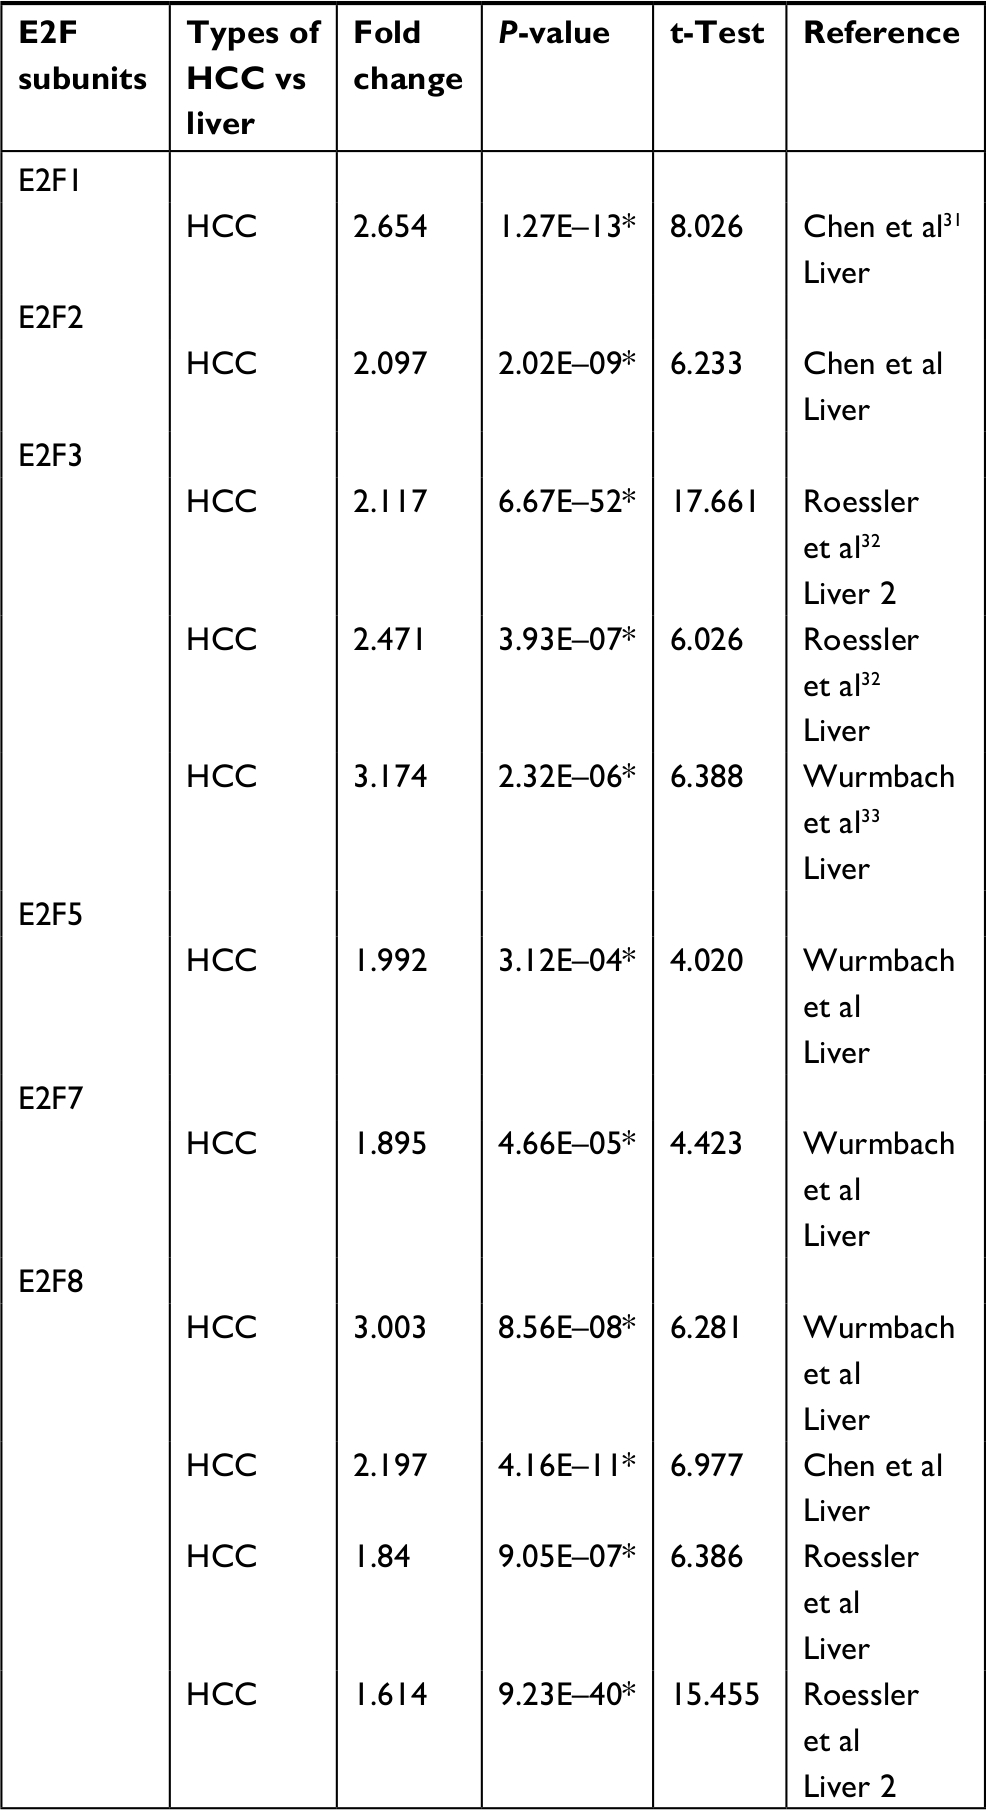 | Table 1 Significant upregulated expression in transcription level of E2Fs between HCC and liver tissues (ONCOMINE database) Note: *P<0.05 is considered significantly different. Abbreviation: HCC, hepatocellular carcinoma. |
Relationship between the mRNA levels of E2Fs and the clinicopathological parameters of patients with HCC
The mRNA expression of E2F factors between HCC and liver tissues was also detected using the UALCAN web portal. The results showed higher mRNA E2F1–E2F8 expression in liver cancer tissues than in normal tissues (Figure 2, P<0.05). Next, we focused on whether mRNA expression of E2Fs was related to cancer stage in individual patients. As shown in Figure 3, the results indicated that patients with a more advanced stage of HCC tended to express higher levels of E2F1–E2F8. Patients in stage III expressed the highest mRNA levels of E2F1–E2F8 (P<0.05). However, no statistical significance was found between the stage IV group and other groups, possibly due to its small sample size. Consistently, the data shown in Figure 4 indicate that patients with higher pathological grade tumors expressed higher levels of E2F mRNA (P<0.05). Taken together, these results indicate that the mRNA expression levels of E2Fs are associated with different cancer stages and pathological grades in HCC patients.
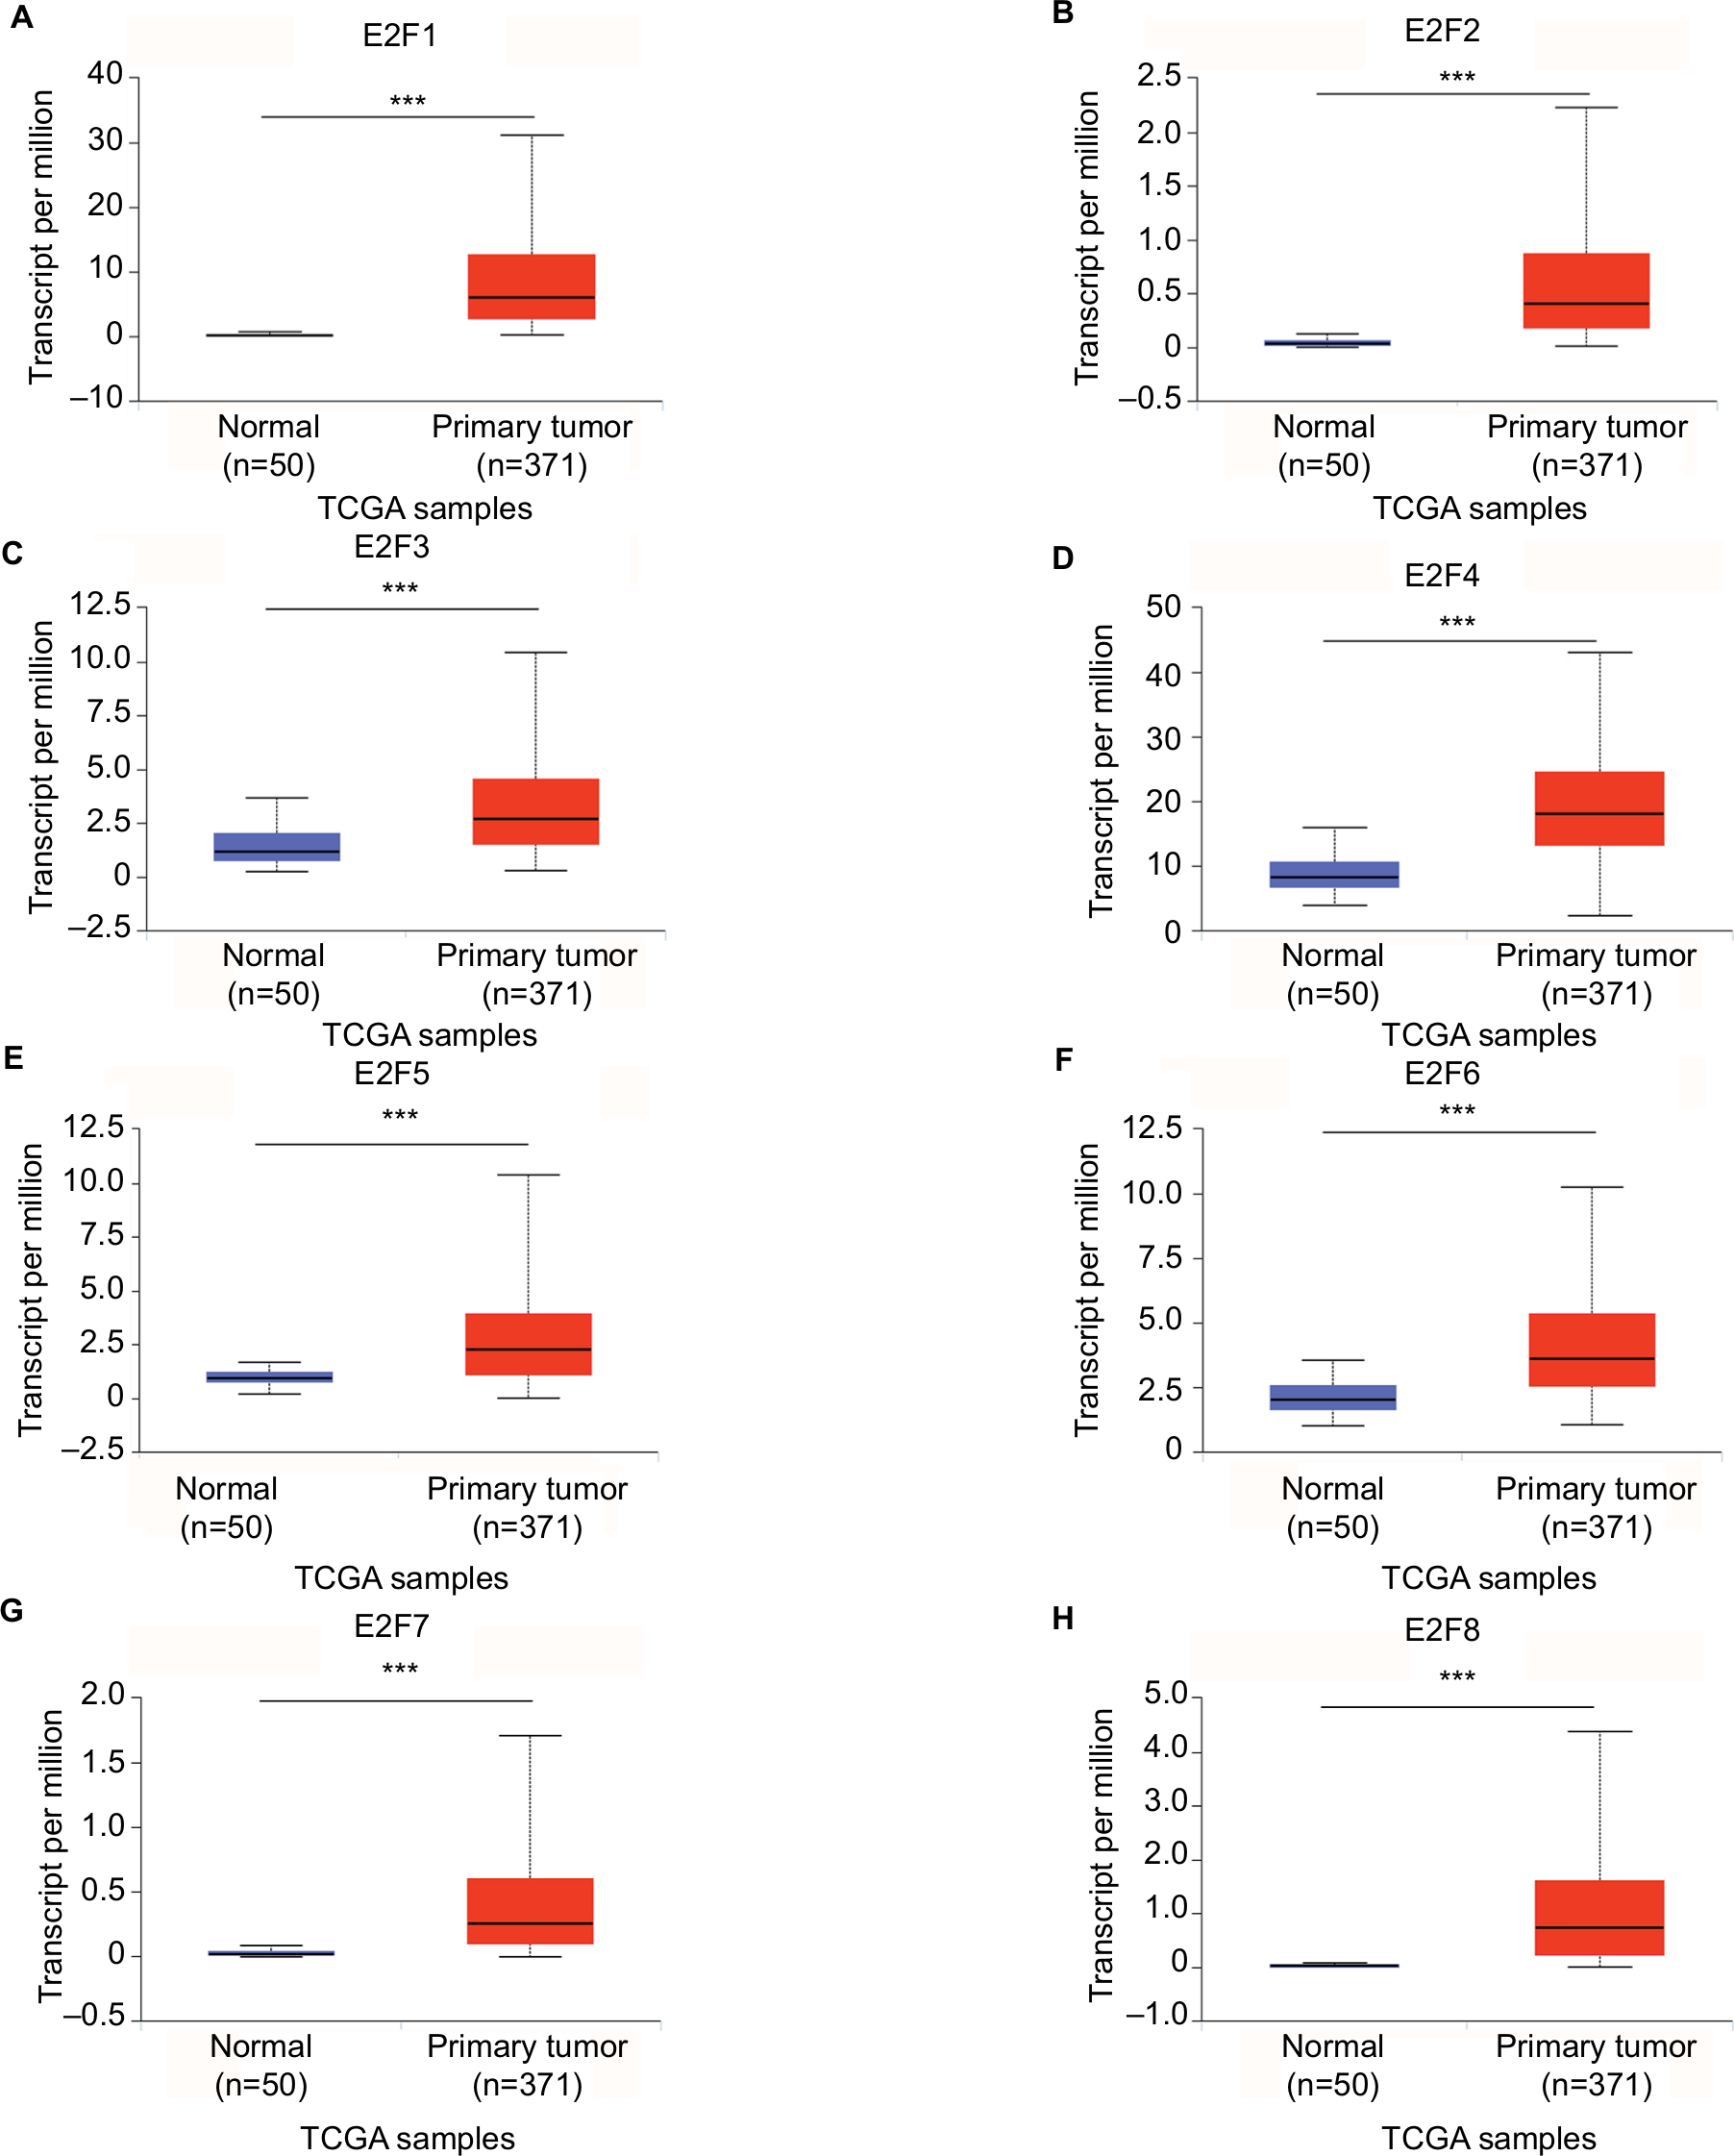 | Figure 2 Transcriptional levels of E2Fs in liver cancer tissues and adjacent nontumoral liver tissues from TCGA database. Notes: Expression panels for E2F1 (A), E2F2 (B), E2F3 (C), E2F4 (D), E2F5 (E), E2F6 (F), E2F7 (G), and E2F8 (H) based on major cancer stage comparing 50 normal individuals and data for 371 HCC patients in TCGA database. Major cancer stage represents liver cancer from stage 1 to stage 4; ***P<0.001. Abbreviations: HCC, hepatocellular carcinoma; TCGA, The Cancer Genome Atlas. |
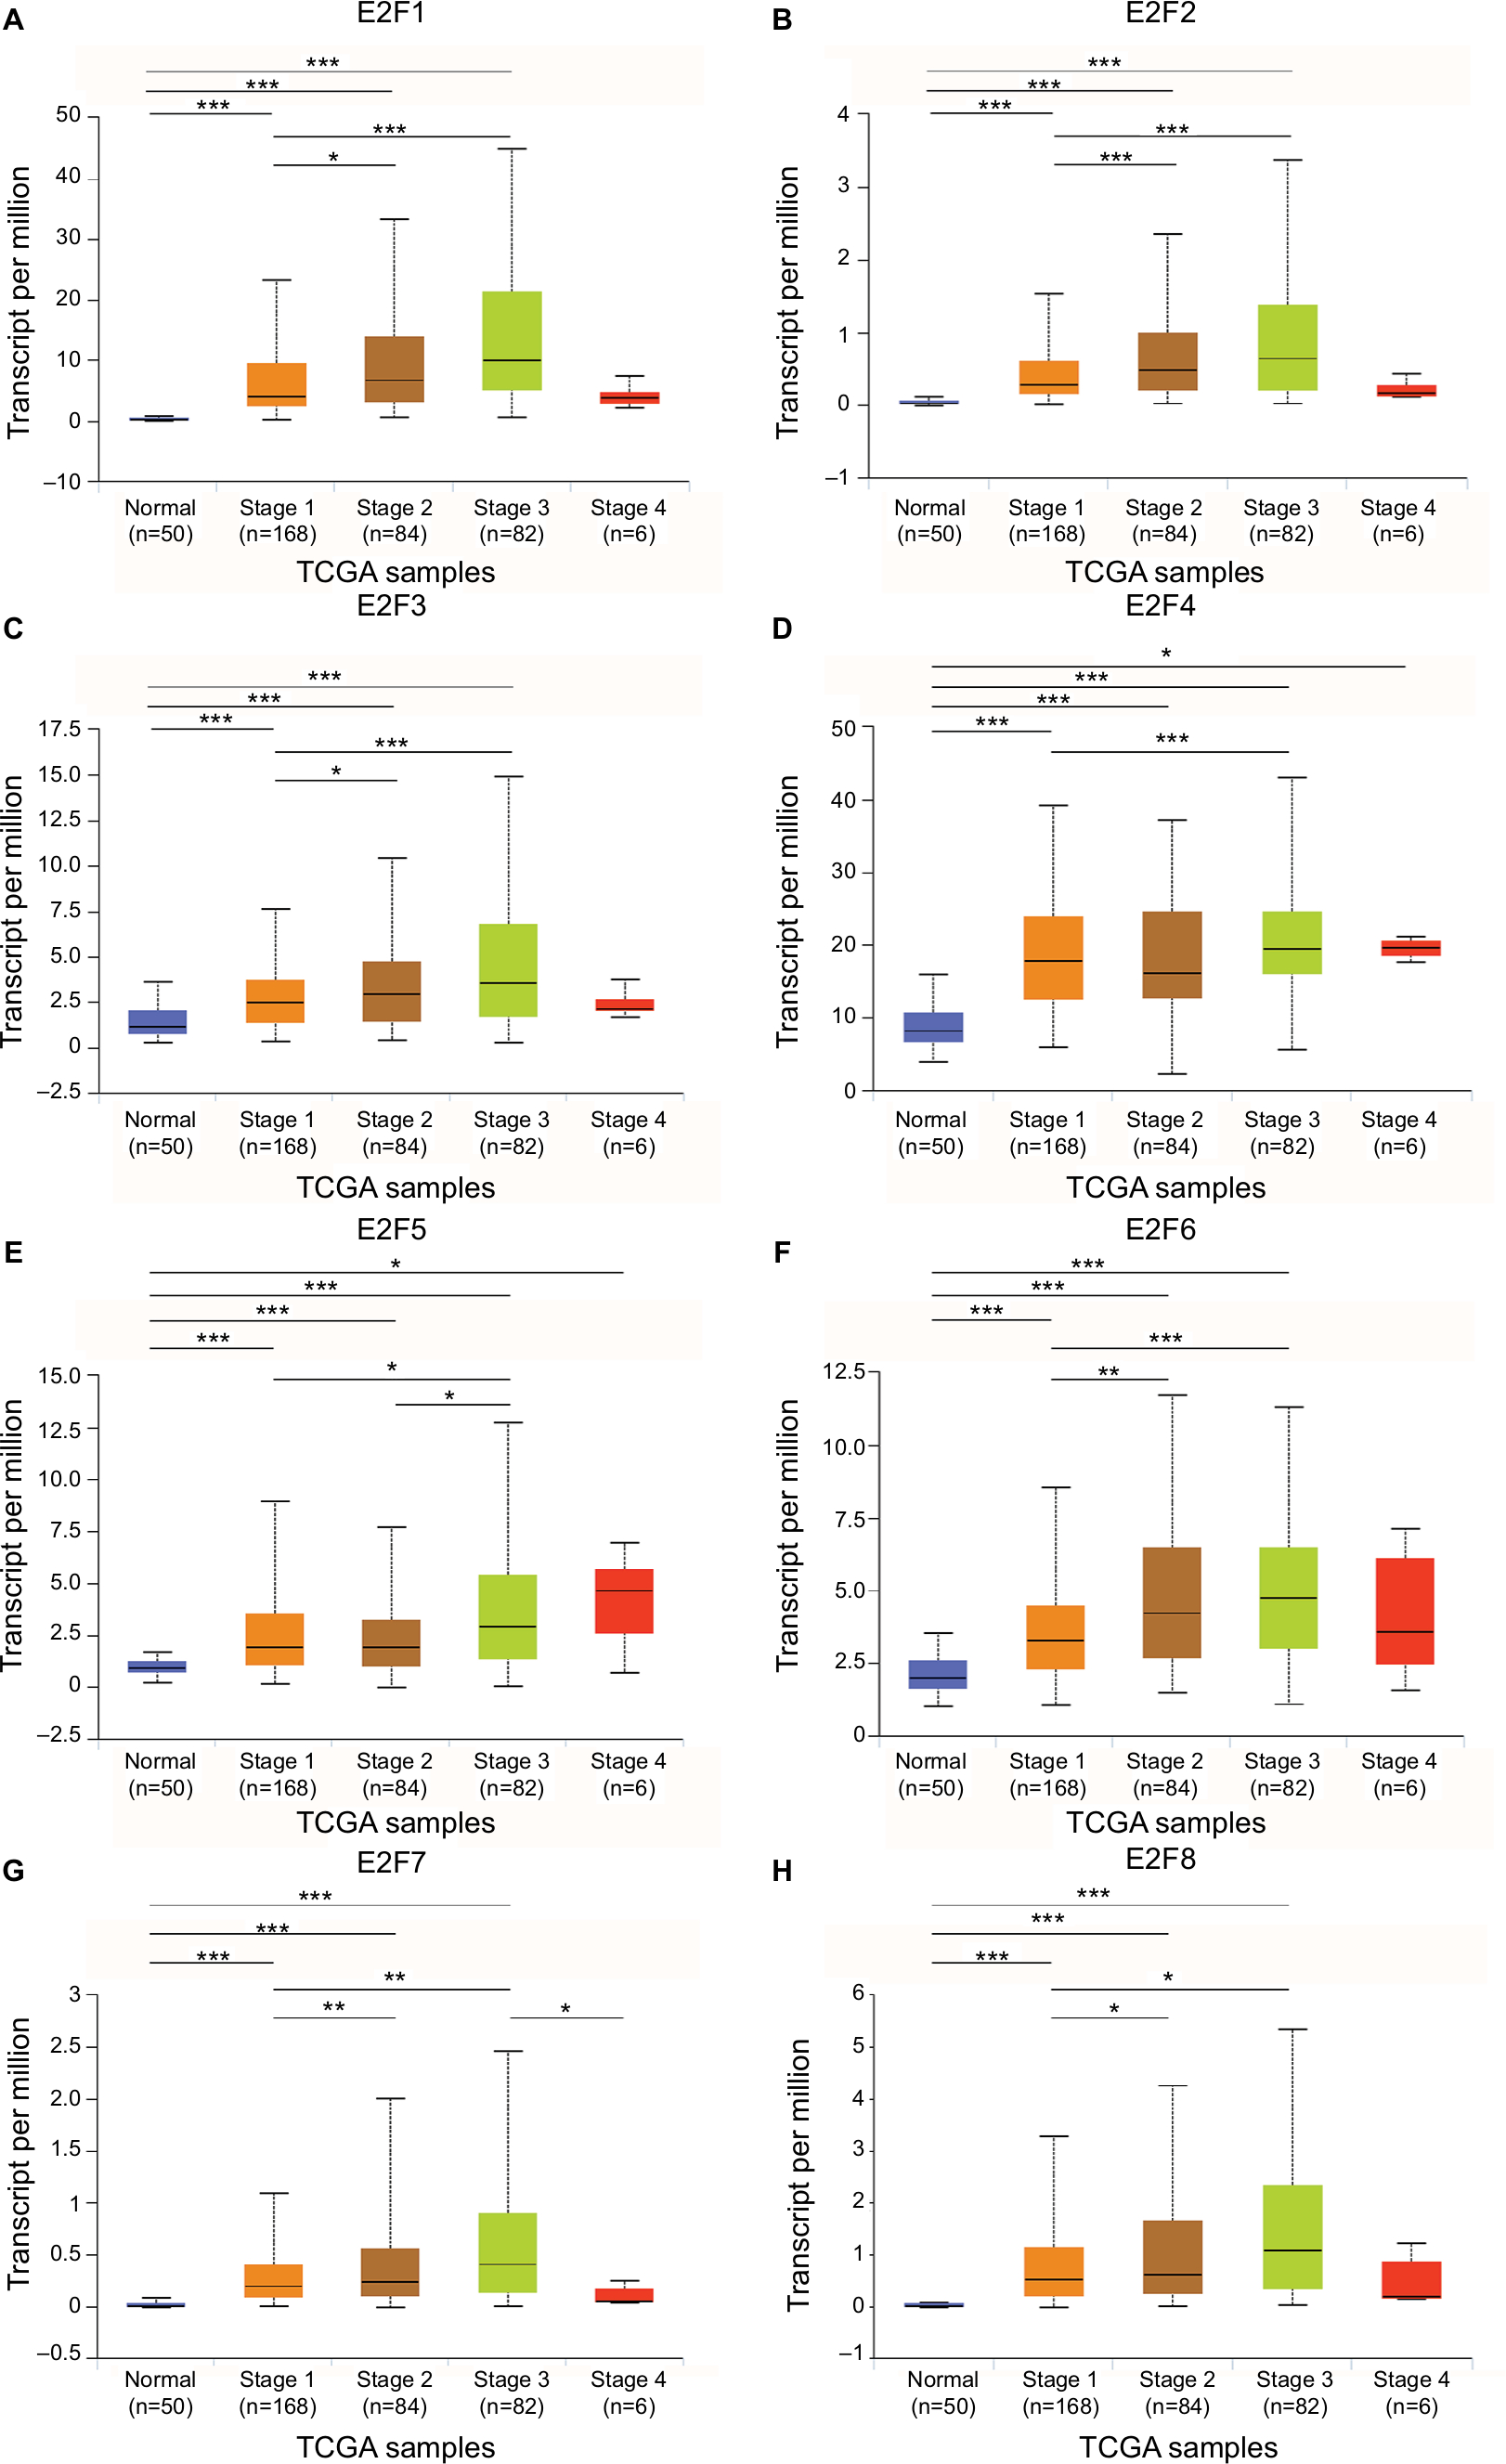 | Figure 3 The relationship between E2F mRNA expression and individual HCC cancer stages from TCGA database. Notes: Expression panels for E2F1 (A), E2F2 (B), E2F3 (C), E2F4 (D), E2F5 (E), E2F6 (F), E2F7 (G), and E2F8 (H) based on individual HCC cancer stages comparing 50 normal individuals and data for 371 HCC patients in TCGA database. Individual cancer stages include liver cancer from stage 1 to stage 4; *P<0.05; **P<0.01; ***P<0.001. Abbreviations: HCC, hepatocellular carcinoma; TCGA, The Cancer Genome Atlas. |
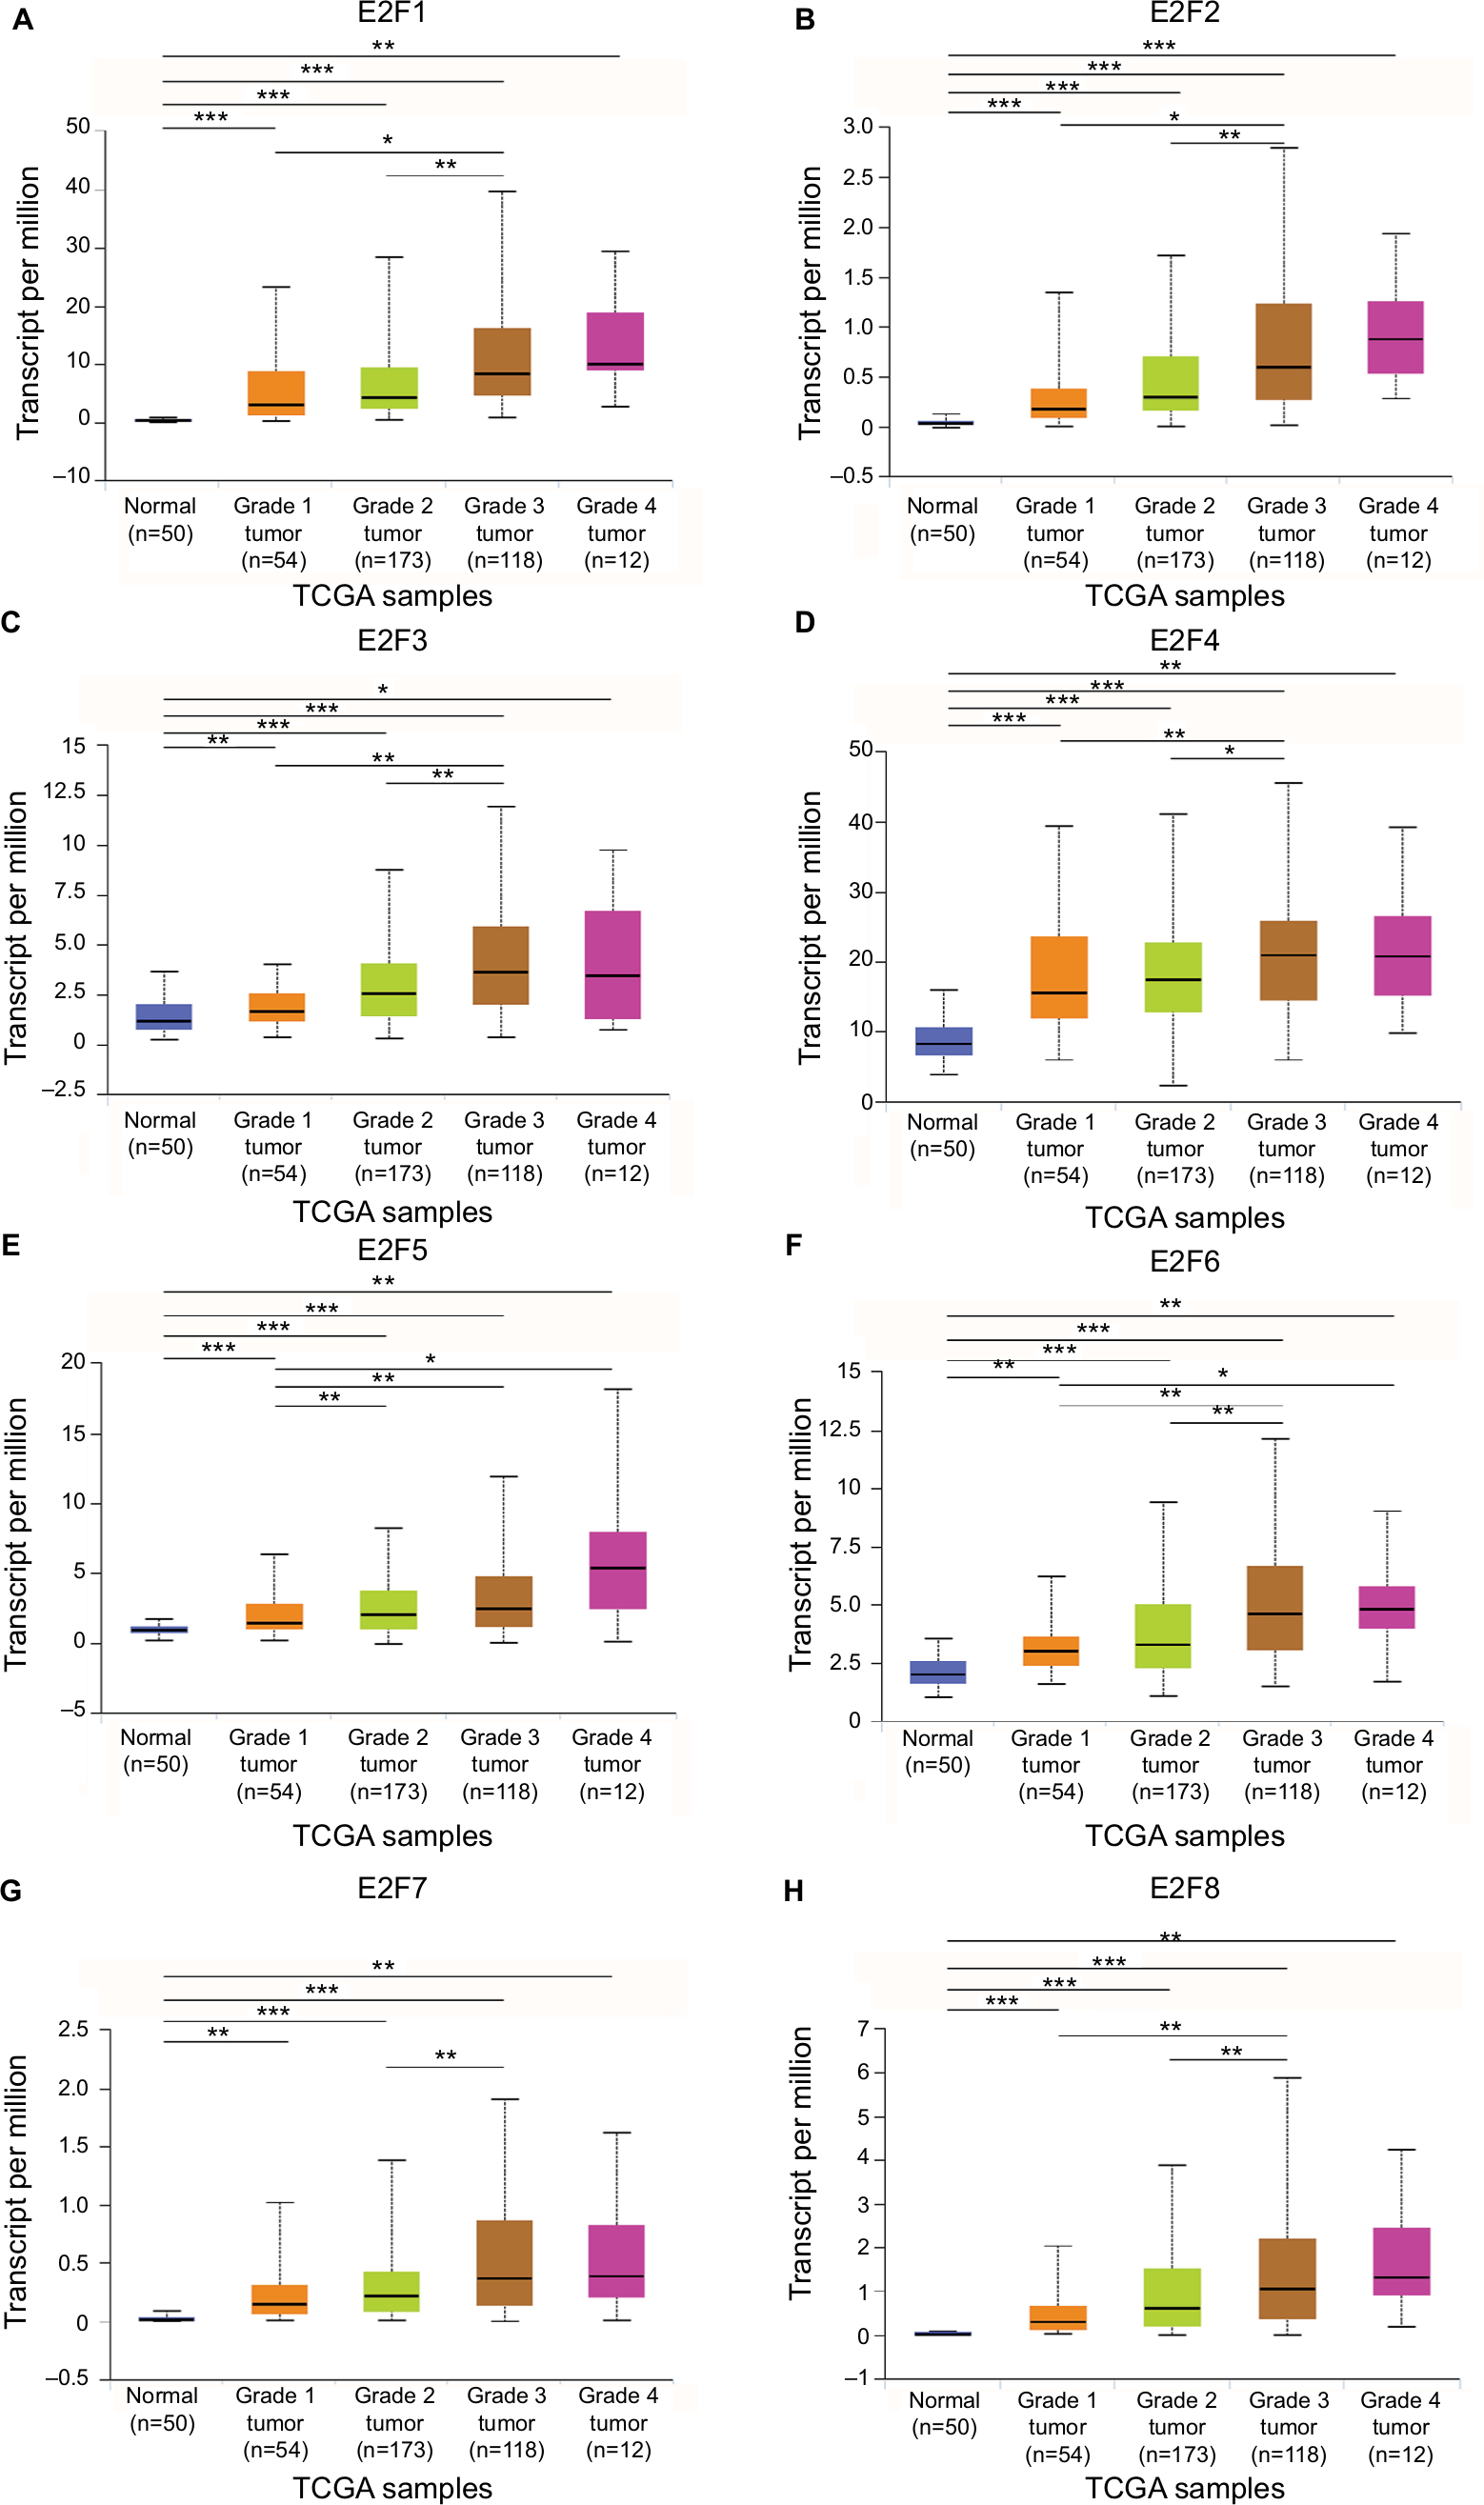 | Figure 4 The relationship between E2F mRNA expression and HCC tumor grade from TCGA database. Notes: Expression panels for E2F1 (A), E2F2 (B), E2F3 (C), E2F4 (D), E2F5 (E), E2F6 (F), E2F7 (G), and E2F8 (H) based on HCC tumor grade comparing 50 normal individuals and data for 371 HCC patients in TCGA database. HCC tumor grade includes liver cancer from grade 1 to grade 4; grade 1: well differentiated, grade 2: moderately differentiated, grade 3: poorly differentiated, grade 4: undifferentiated; *P<0.05; **P<0.01; ***P<0.001. Abbreviations: HCC, hepatocellular carcinoma; TCGA, The Cancer Genome Atlas. |
Prognostic value of E2Fs in liver cancer patients
We used Kaplan–Meier plotter (http://kmplot.com/analysis/) to further determine the prognostic values of the mRNA expression of E2Fs in liver cancer patients. The results showed that all eight E2Fs were significantly associated with patient prognosis. First, we analyzed the relationship between the combined mRNA expression of all E2Fs and the prognosis of HCC patients. The survival curves (Figure 5A) revealed that a higher level of combined E2F expression predicts a poor prognosis in HCC. Next, we focused on the relationship between the mRNA expression levels of individual E2F members and the prognosis of HCC patients. As shown in Figure 5B–I, overexpressed mRNA levels of E2F1–E2F8 were significantly related to shorter OS time. These results suggest that the mRNA expression levels of E2Fs may be useful for prediction of HCC patient survival.
 | Figure 5 Kaplan–Meier curve revealing the OS difference based on E2F mRNA levels in HCC patients. Notes: (A) Overexpressed mRNA levels of all E2Fs are associated with poor OS in HCC patients. (B–I) E2F1–E2F8 mRNA expression levels are associated with poor OS in HCC patients. Abbreviations: HCC, hepatocellular carcinoma; OS, overall survival; TCGA, The Cancer Genome Atlas. |
Sequence alterations in E2Fs affect OS and DFS in HCC patients
Next, TCGA database and the c-BioPortal website were applied to further explore E2F sequence alterations and their effects on OS and DFS in HCC patients. As shown in Figure 6A, E2F sequence alterations occurred in 171 samples out of the 360 patients with liver cancer (the total mutation rate was 48%). E2F5, E2F3, and E2F6 were the three genes with the highest rate of sequence alterations, and their mutation rates were 23%, 14%, and 12%, respectively. Further analysis using a Kaplan–Meier plot and log-rank test showed that sequence alterations in E2Fs were associated with worse OS in HCC patients (Figure 6B, P=0.00368). Consistently, alterations in E2Fs were also associated with worse DFS (P=0.0000901). These results indicated that E2F sequence alterations could have an impact on HCC patient prognosis.
 | Figure 6 E2F expression and mutation analysis in liver cancer (c-BioPortal). Notes: (A) Oncoprint in c-BioPortal showed the distribution and proportion of samples with alterations in E2Fs. (B) Left panel: E2F alterations were associated with worse overall survival in HCC patients. Right panel: E2F alterations were associated with worse disease-free survival in HCC patients. (C) Networks constructed in c-BioPortal showed the interaction relationship between E2F1/2/3/4/5/6/7 and the 50 most frequently altered neighboring genes. Abbreviation: HCC, hepatocellular carcinoma. |
Network analysis of signaling pathways affected by mutations in the E2F family in HCC
We also used c-BioPortal to construct a network for eight E2Fs and the neighboring 50 genes significantly associated with E2Fs. The results showed that the cell cycle-related genes CDC6, TP53, CDK6, CDK4, CCNE2, CDKN1A, and CDKN2A were significantly related to E2F alterations (Figure 6C). Next, GO and KEGG analyses using DAVID were exploited to discover the functional enrichment of E2Fs and their associated genes. GO analysis predicted three main functions of target genes, including biological process (BP), cellular components (CPs), and molecular functions (MFs). The results showed that BPs, such as GO:0006351 transcription, DNA-templated; GO:0090399 replicative senescence; GO:0034644 cellular response to UV; GO:0048146 positive regulation of fibroblasts; and GO:000012 negative regulation of transcription, were remarkably regulated by alterations in E2Fs and the related 50 genes in HCC (Figure 7A). CPs, such as GO:0005667 transcription factor complex; GO:0005634 nucleus; GO:0005654 nucleoplasm; GO:0000307 cyclin-dependent protein kinase; and GO:0070557 PCNA-p21 complex, were prominently associated with E2F alterations (Figure 7B). Last but not least, the alterations also significantly affected MFs, such as GO:0003677 DNA binding; GO:0001047 core promoter binding; GO:0003700 transcription factor activity, sequence-specific DNA binding; GO:0003684 damaged DNA binding; and GO0003887 DNA-directed DNA polymerase activity, in liver cancer cells (Figure 7C). On the other hand, KEGG analysis showed the 20 most relevant pathways associated with E2F alterations and the neighboring 50 genes in HCC. As shown in Figure 8, ptr04110: Cell Cycle, ptr05161: Hepatitis B, ptr04115: p53 signaling pathway, ptr05203: Viral carcinogenesis, ptr05200: pathways in cancer, ptr04350: TGF-beta signaling pathway, ptr04330: Notch signaling pathway, and ptr04151: PI3K–AKT signaling pathway were involved in tumorigenesis and development of HCC.
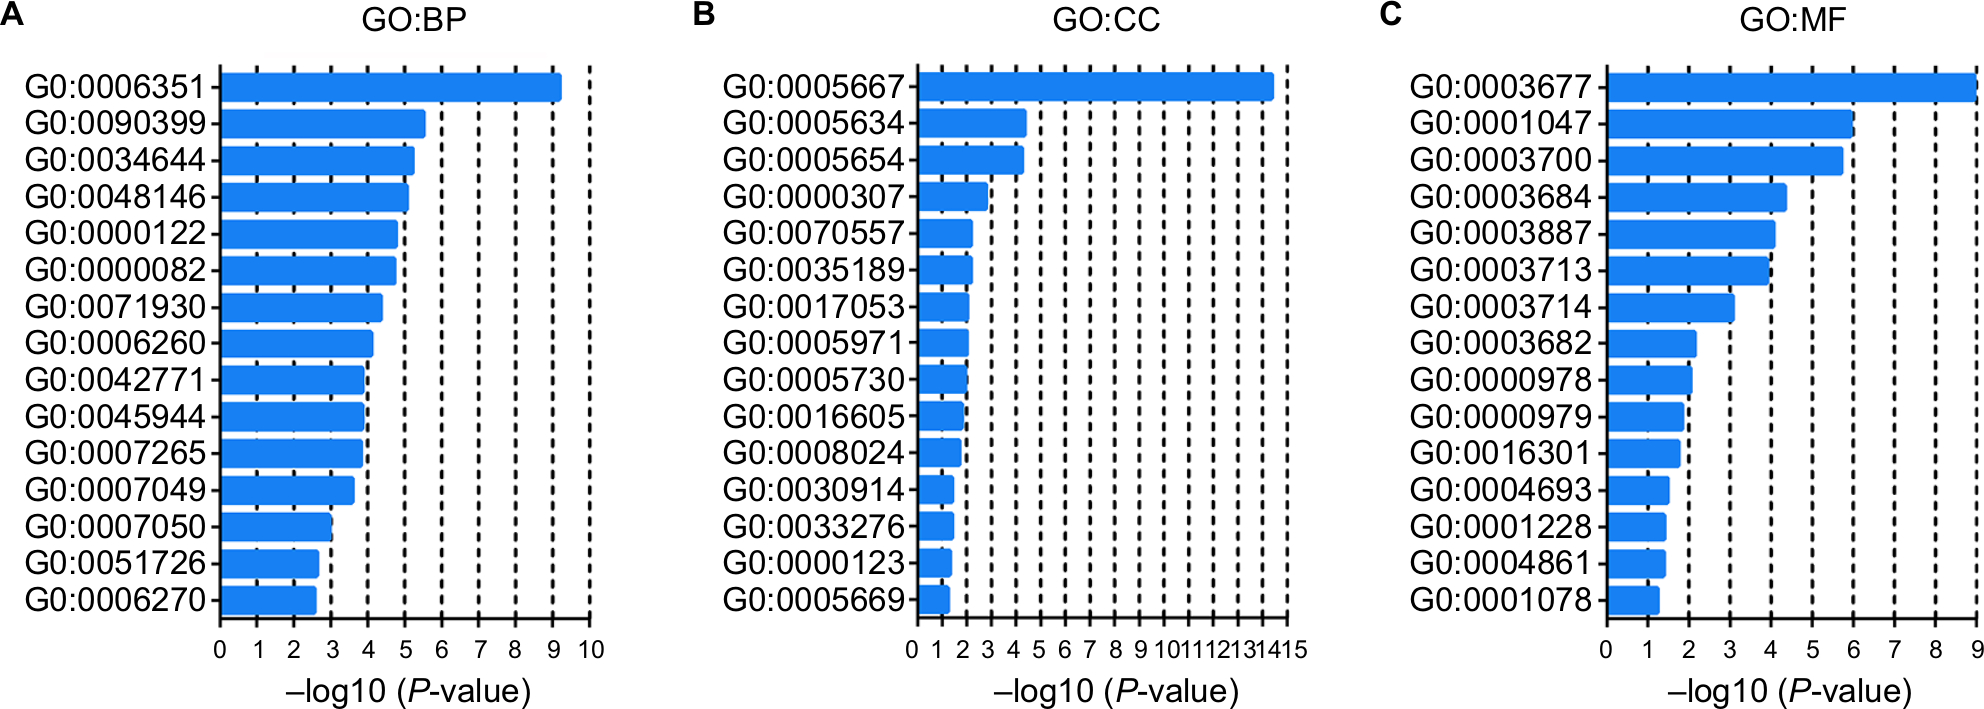 | Figure 7 GO enrichment analysis of E2Fs and their 50 most frequently altered neighboring genes. Note: GO functional enrichment analysis predicted three main functions of target genes: (A) BP; (B) CP, and (C) MF. Abbreviations: BP, biological process; CP, cellular component; GO, Gene Ontology; MF, molecular function. |
 | Figure 8 KEGG pathway analysis of E2Fs and their 50 most frequently altered neighboring genes. Abbreviation: KEGG, Kyoto Encyclopedia of Genes and Genomes. |
Discussion
E2Fs have been reported to take part in a variety of cancer types because they can regulate many cellular functions related to cell cycle progression.21,34,35 Although some E2F family members have been confirmed to play promising roles in HCC, the distinct roles of E2Fs in the development, progression, and metastasis of HCC remain to be elucidated. In the present study, the expression, mutation, and prognostic values of different E2Fs in HCC patients were analyzed.
E2F1, the classic E2F member, is the most well-studied member of the E2F family. Significant overexpression of E2F1 has been found in HCC tissues compared with nontumorous liver tissues, and high E2F1 immunoexpression was found to be predictive of a poor OS rate in HCC patients. In addition, E2F1 can promote the proliferation of HCC cell lines through activation of B-Myb, stathmin 1, BRCA1, and dbp1, which promote the initiation or progression of HCC.36–39 E2F1 is also regulated by Sirtuin 5 (SIRT5) and miR-17-5 p to promote cell proliferation and invasion in HCC cell lines, and knockdown of E2F1 in HCC cells partially reversed the effect of SIRT5 on promoting cell proliferation and invasion.40,41 E2F1 transcription is upregulated by hepatitis B virus (HBV) core promoter mutations, which in turn activates SKP2 transcription, leading to downregulation of cell cycle inhibitors and proliferation of HCC.42 Moreover, E2F1 has been found to play a critical antiapoptotic role in both human and rodent liver cancer via counteraction of c-myc-mediated apoptosis and activation of the PIK3CA/Akt/mTOR and c-Myb/COX-2 pathways.43 Paradoxically, E2F1 has also shown tumor-suppressing activity in HCC. Baiz et al observed that nuclear E2F1 expression determined by immunohistochemistry was inversely related to phospho-pRb expression and positively related to the tumor apoptotic index.17 Choi et al found that E2F1 could inhibit HBV life cycle and HBV-mediated HCC by interfering with the control of HBx on the p53 promoter and direct activation of the p53 promoter through its binding site.44 Furthermore, in animal models, the TFDP3/E2F1 pathway was found to promote HCC cell apoptosis by positive regulation of HIF-2α, and the decreased level of HIF-2α was associated with lower OS of HCC patients.45 In view of the above arguments, Farra et al indicated in their review that the proliferative and apoptotic functions of E2F1 in HCC may coexist but the proliferative effect seems to be more pronounced than the apoptotic one.46 However, in our study, higher E2F1 expression was significantly related to tumor stage and poor survival of HCC patients, which indicated that E2F1 may play a tumor promoting role in HCC from the view of prognosis. More studies are needed to further verify the exact role of E2F1 in HCC.
Overexpression of E2F2 has been observed during hepatocarcinogenesis, and disruption of the pRb/E2F pathway and inhibition of apoptosis are major oncogenic events in c-myc/TGFalpha transgenic mice.47 Huang et al found that ANCCA/PRO2000 promoted the growth and invasion of HCC cells in vitro and enhanced the tumorigenicity of HCC cells in vivo via upregulation of E2F2, and miR-520a was an intermediate regulator between ANCCA/PRO2000 and E2F. A regulatory loop formed by ANCCA/PRO2000, miR-520a, and E2F2 is a driving force for HCC development.48 Dong et al observed that overexpression of miR-218 can inhibit HCC cell proliferation and induce cell cycle arrest at the G0/G1 phase checkpoint by downregulating E2F2 via direct binding to its 3’-UTR.49 Consistent with these findings, significant overexpression of E2F2 was found in liver cancer tissues compared with normal tissues and was associated with a poor survival time in all liver cancer patients who were followed up for 120 months in our study.
Significant upregulation of E2F3 was observed in HCC tissues compared with normal controls and was associated with poor prognosis in HCC patients.50,51 Kent et al found that copy number gains in E2F3b resulted in dosage-dependent spontaneous HCC in mice without the involvement of additional organs. Conversely, germ-line loss of E2F3b protected mice against HCC, suggesting that E2F3 is associated with development and progression of HCC.52 Similarly, in the present study, we demonstrated that significantly higher E2F3 expression was present in HCC tissues and was related to tumor stage and worse OS in patients with liver cancer. Recently, targeting of E2F3 by a variety of microRNAs, including miR-144, miR-503, miR-424, miR-214, and miR-363, has been found to inhibit the growth, migration, and invasion of HCC cells, suggesting that E2F3 may be exploited as a novel and promising therapeutic target for HCC treatment.53–57
As an E2F repressor, E2F4 has also been found to be significantly associated with HCC. Park et al found that both microsatellite instability and E2F4 mutations occurred commonly in HCC as well as in colon and gastric cancers, indicating that E2F4 may play a significant role in HCC.58 Yoshida et al observed that gnidimacrin, which exhibits significant antiproliferation activity, could cause G2-phase arrest in human hepatoma HLE cells by repression of cdc2 via induction of p21 and promotion of E2F4 translocation to the nucleus.59 To the best of our knowledge, to date, no studies have reported the expression pattern or prognostic value of E2F4 in HCC. Thus, our study is the first to report significant overexpression of E2F4 in HCC tissues relative to that in normal tissues and to propose that this higher E2F4 expression is significantly correlated with tumor stage and poor survival in HCC patients, in accordance with the other research.
E2F5 had been found to play a potential oncogenic role in HCC. The results from the study of Jiang et al showed that E2F5 was markedly upregulated in primary HCC compared with normal liver tissues, and knockdown of E2F5 in HCC cells reduced their proliferation and metastasis by promoting G0/G1 arrest.19 Similarly, Sun et al found that the transcription factor FOXN3 could inhibit HCC cell proliferation through downregulation of E2F5 expression.60 However, Zou et al demonstrated that HBV could upregulate miR-181a expression, and overexpression of miR-181a in hepatoma cells promoted cell growth in vitro and tumor formation in vivo by targeting E2F5. Conversely, inhibition of miR-181a suppressed the proliferation of SMMC-7721 cells, and E2F5 inhibition induced cell growth and rescued the suppressive effect of the miR-181a inhibitor on SMMC-7721 cell proliferation,61 suggesting that E2F5 may play a complicated role in HCC, similar to that of E2F1. In the present study, we found that E2F5 expression in HCC tissue was higher than that in normal liver tissue and related to tumor stage. Moreover, high E2F5 expression was markedly associated with worse OS in all the liver cancer patients, which supported the notion that E2F5 plays an oncogenic role in HCC, but the exact role played by E2F5 in HCC should be further evaluated.
Higher E2F6 expression has been found in many malignancies, including non-small-cell lung cancer and acute lymphoblastic leukemia.62,63 However, evidence of the relationship between E2F6 expression and its prognosis value in HCC patients has rarely been reported. Similarly, in our present study, the expression of E2F6 in HCC tissues was found for the first time to be higher than that in normal tissues, and this expression was associated with tumor stage in patients with HCC. HCC patients with higher E2F6 expression had a worse OS than patients with lower E2F6 expression.
Similar to E2F6, research on the correlation of E2F7 with HCC has rarely been reported. However, E2F7 has organizational and functional properties similar to those of E2F8, which is a tumor activator in HCC,20 and they share a variety of transcriptional targets via the formation of homodimers and heterodimers.64,65 Furthermore, E2F7 has been found to participate in the metabolism and proliferation involved in liver regeneration.66 All these studies indicate that E2F7 may have a close relationship with HCC. Likewise, similar to E2F4 and E2F6, our study is the first to report that higher E2F7 expression is present in HCC tissues compared with normal liver tissues and is markedly related to tumor stage and poor OS in liver cancer patients.
As discussed above, E2F8 has been correlated with HCC development. Deng et al observed that overexpression of E2F8 promoted cell proliferation, colony formation, and tumorigenicity in different HCC cell lines by regulating cyclin D1 transcription and promoting the accumulation of S-phase cells, while knockdown of E2F8 reversed these phenotypes.20 Likewise, in our study, higher E2F8 expression was observed in HCC tissues and was significantly correlated with tumor stage and worse OS in liver cancer patients. Interestingly, Kent et al found a specific tumor suppressor role of E2F8 in HCC. They observed that overexpression of wild-type E2F8 but not a DNA binding defective mutant of E2F8 inhibited the proliferation of HepG2 cells. Moreover, specific deletion of E2F8 promoted DEN-induced HCC and in combination with loss of E2F7 led to spontaneous HCC formation in mice. Furthermore, inactivation of the E2F8 DNA-binding activity in 8DBD mice was sufficient to promote HCC in vivo.67 Taken together, similar to E2F1 and E2F5, E2F8 can not only enhance cancer progression but can also protect against cancer initiation, which is dependent on the specific context.
As mentioned above, E2Fs are conventionally classified into the three categories based on their functional properties and structural features.8,68–70 Nevertheless, it should be emphasized that the basic classification of mammalian E2Fs is generally dependent on in vitro study and lack of in vivo identification, so the elegant classification may not be sufficient to highlight their sophisticated roles.10,68,71 For example, genome-wide expression approaches identify that E2F1–E2F3 could function as direct repressors of transcription independent of pocket proteins72 and E2F7 and E2F8 can form complex with the hypoxia-inducible factor 1 and mediate angiogenesis through transcriptional activation of vascular endothelial growth factor.73 In our present paper, higher expressions of E2F6, E2F7, and E2F8 were observed in HCC tissues and were significantly correlated to tumor stages and worse OS in liver cancer patients, suggesting that they may play oncogenic role in HCC. Moreover, in vitro studies by Deng et al had demonstrated that overexpression of E2F8 promoted cell proliferation, colony formation, and tumorigenicity in different HCC cell lines by regulating transcription of cyclin D1 and promoting accumulation of S-phase cells, while knockdown of E2F8 reversed these phenotypes.20 Therefore, although there is a possibility that upregulation of “inhibitor” E2F members is reactive to the upregulation of the proliferative E2Fs, which is an attempt to downregulate cell proliferation, results from our paper indicated that “inhibitors” E2F members may play a role in promoting tumorigenesis as oncogenes in HCC. Further experiments should be done to evaluate the exact role played by “inhibitors” E2F members.
Our study has some limitations. First, we found that E2Fs may be exploited as promising diagnostic and prognostic markers in human HCC. HCC patients with cirrhosis are very common, and there is no doubt that a comparison of E2Fs between cirrhosis and HCC will increase the marker specificity of E2Fs. However, because all the data were retrieved from published literature (reported in the ONCOMINE, UALCAN, and c-BioPortal databases), we could not obtain more data showing E2F mRNA expression in patients with HCC and in patients with cirrhosis; thus, we cannot make this comparison based on the present data. Second, despite overexpressed mRNA levels of E2F1–E2F8 had been shown to be significantly related to shorter OS time of HCC patients by Kaplan–Meier plotter, results of multivariate analysis showed that only E2F5 and E2F6 served as independent factors and they may be a driver in the tumor progression (Table S1). However, multivariate analysis also revealed that other E2Fs may not be independent prognostic factors, which indicated that these other E2Fs may be a passenger that altered with the change of stage/grade in tumor or expression of E2F5/E2F6. Therefore, we are not yet able to determine whether E2Fs are driving factors in tumorigenesis or just associated with the change in tumor stage/grade, and further experiments such as overexpression/knockdown E2Fs on cell or animal models need to be done to reveal their roles during the HCC progression. Examining the E2F levels in the blood of HCC patients and demonstrating that the mRNA expression of E2Fs in the blood has the same predictive value as the mRNA expression of E2Fs in tissue will promote practical (clinical) use of our findings in the future. In fact, studies performed by Al Ahmed et al and Pipinikas et al have shown that blood E2F3 mRNA levels in lung cancer patients and prostate cancer patients can be measured by quantitative RT-PCR;74,75 based on their findings, it is reasonable to speculate that E2F levels in the blood of HCC patients can also be measured by quantitative RT-PCR, and the prediction values of blood E2F mRNA expression levels in HCC patients should be explored in future research.
In summary, the expression, mutation, and prognostic values of different E2Fs in HCC patients were systemically analyzed. Our results showed that all E2F family members were highly expressed in HCC and were associated with poor survival of HCC patients. Thus, E2Fs could be exploited as diagnostic molecular markers and prognostic markers in the management of HCC treatment.
Acknowledgments
This study was funded in part by grants from the International Cooperation Project of Guangzhou Science and Technology Program (2016201604030021), Major Project of Collaborative Innovation of Guangzhou Science and Technology Program (201704020175), and National Natural Science Foundation of China (81872006).
Author contributions
All authors contributed to data analysis, drafting or revising the article, gave final approval of the version to be published, and agree to be accountable for all aspects of the work.
Disclosure
The authors report no conflicts of interest in this work.
References
Torre LA, Bray F, Siegel RL, Ferlay J, Lortet-Tieulent J, Jemal A. Global cancer statistics, 2012. CA Cancer J Clin. 2015;65(2):87–108. | ||
Chen W, Zheng R, Baade PD, et al. Cancer statistics in China, 2015. CA Cancer J Clin. 2016;66(2):115–132. | ||
Clark T, Maximin S, Meier J, Pokharel S, Bhargava P. Hepatocellular carcinoma: review of epidemiology, screening, imaging diagnosis, response assessment, and treatment. Curr Probl Diagn Radiol. 2015;44(6):479–486. | ||
Menrad H, Werno C, Schmid T, et al. Roles of hypoxia-inducible factor-1alpha (HIF-1alpha) versus HIF-2alpha in the survival of hepatocellular tumor spheroids. Hepatology. 2010;51(6):2183–2192. | ||
Dai CX, Gao Q, Qiu SJ, et al. Hypoxia-inducible factor-1 alpha, in association with inflammation, angiogenesis and MYC, is a critical prognostic factor in patients with HCC after surgery. BMC Cancer. 2009;9(1):418. | ||
Huang Y, Wang H, Lian Y, et al. Upregulation of kinesin family member 4A enhanced cell proliferation via activation of Akt signaling and predicted a poor prognosis in hepatocellular carcinoma. Cell Death Dis. 2018;9(2):141. | ||
Zhan L, Huang C, Meng XM, et al. Promising roles of mammalian E2Fs in hepatocellular carcinoma. Cell Signal. 2014;26(5):1075–1081. | ||
Attwooll C, Lazzerini Denchi E, Helin K. The E2F family: specific functions and overlapping interests. EMBO J. 2004;23(24):4709–4716. | ||
Ren B, Cam H, Takahashi Y, et al. E2F integrates cell cycle progression with DNA repair, replication, and G(2)/M checkpoints. Genes Dev. 2002;16(2):245–256. | ||
Dimova DK, Dyson NJ. The E2F transcriptional network: old acquaintances with new faces. Oncogene. 2005;24(17):2810–2826. | ||
Kauffmann S, Legrand M, Geoffroy P, Fritig B. Biological function of “pathogenesis-related” proteins: four PR proteins of tobacco have 1,3-beta-glucanase activity. EMBO J. 1987;6(11):3209–3212. | ||
Butcher DT, Alliston T, Weaver VM. A tense situation: forcing tumour progression. Nat Rev Cancer. 2009;9(2):108–122. | ||
Hazar-Rethinam M, Endo-Munoz L, Gannon O, Saunders N. The role of the E2F transcription factor family in UV-induced apoptosis. Int J Mol Sci. 2011;12(12):8947–8960. | ||
Harbour JW, Luo RX, Dei Santi A, Postigo AA, Dean DC. CDK phosphorylation triggers sequential intramolecular interactions that progressively block Rb functions as cells move through G1. Cell. 1999;98(6):859–869. | ||
Yang M, Wu S, Jia J, May WS. JAZ mediates G1 cell cycle arrest by interacting with and inhibiting E2F1. Cell Cycle. 2011;10(14):2390–2399. | ||
Jiang X, Nevins JR, Shats I, Chi JT. E2F1-mediated induction of NFYB attenuates apoptosis via joint regulation of a pro-survival transcriptional program. PLoS One. 2015;10(6):e0127951. | ||
Baiz D, Dapas B, Farra R, et al. Bortezomib effect on E2F and cyclin family members in human hepatocellular carcinoma cell lines. World J Gastroenterol. 2014;20(3):795–803. | ||
Li W, Ni GX, Zhang P, Zhang ZX, Li W, Wu Q. Characterization of E2F3a function in HepG2 liver cancer cells. J Cell Biochem. 2010;111(5):1244–1251. | ||
Jiang Y, Yim SH, Xu HD, et al. A potential oncogenic role of the commonly observed E2F5 overexpression in hepatocellular carcinoma. World J Gastroenterol. 2011;17(4):470–477. | ||
Deng Q, Wang Q, Zong WY, et al. E2f8 contributes to human hepatocellular carcinoma via regulating cell proliferation. Cancer Res. 2010;70(2):782–791. | ||
Johnson DG, Degregori J. Putting the oncogenic and tumor suppressive activities of E2F into context. Curr Mol Med. 2006;6(7):731–738. | ||
Rhodes DR, Yu J, Shanker K, et al. ONCOMINE: a cancer microarray database and integrated data-mining platform. Neoplasia. 2004;6(1):1–6. | ||
Chandrashekar DS, Bashel B, Balasubramanya SAH, et al. UALCAN: a portal for facilitating tumor subgroup gene expression and survival analyses. Neoplasia. 2017;19(8):649–658. | ||
Szász AM, Lánczky A, Nagy Á, et al. Cross-validation of survival associated biomarkers in gastric cancer using transcriptomic data of 1,065 patients. Oncotarget. 2016;7(31):49322–49333. | ||
Györffy B, Lanczky A, Eklund AC, et al. An online survival analysis tool to rapidly assess the effect of 22,277 genes on breast cancer prognosis using microarray data of 1,809 patients. Breast Cancer Res Treat. 2010;123(3):725–731. | ||
Győrffy B, Lánczky A, Szállási Z. Implementing an online tool for genome-wide validation of survival-associated biomarkers in ovarian-cancer using microarray data from 1287 patients. Endocr Relat Cancer. 2012;19(2):197–208. | ||
Győrffy B, Surowiak P, Budczies J, Lánczky A. Online survival analysis software to assess the prognostic value of biomarkers using transcriptomic data in non-small-cell lung cancer. PLoS One. 2013;8(12):e82241. | ||
Tomczak K, Czerwińska P, Wiznerowicz M. The Cancer Genome Atlas (TCGA): an immeasurable source of knowledge. Contemp Oncol (Pozn). 2015;19(1A):68–77. | ||
Gao J, Aksoy BA, Dogrusoz U, et al. Integrative analysis of complex cancer genomics and clinical profiles using the cBioPortal. Sci Signal. 2013;6(269):pl1. | ||
Sherman BT, Huang Daw, Tan Q, et al. DAVID Knowledgebase: a gene-centered database integrating heterogeneous gene annotation resources to facilitate high-throughput gene functional analysis. BMC Bioinformatics. 2007;8(1):426. | ||
Chen X, Cheung ST, So S, et al. Gene expression patterns in human liver cancers. Mol Biol Cell. 2002;13(6):1929–1939. | ||
Roessler S, Jia HL, Budhu A, et al. A unique metastasis gene signature enables prediction of tumor relapse in early-stage hepatocellular carcinoma patients. Cancer Res. 2010;70(24):10202–10212. | ||
Wurmbach E, Chen YB, Khitrov G, et al. Genome-wide molecular profiles of HCV-induced dysplasia and hepatocellular carcinoma. Hepatology. 2007;45(4):938–947. | ||
Chen HZ, Tsai SY, Leone G. Emerging roles of E2Fs in cancer: an exit from cell cycle control. Nat Rev Cancer. 2009;9(11):785–797. | ||
Tsantoulis PK, Gorgoulis VG. Involvement of E2F transcription factor family in cancer. Eur J Cancer. 2005;41(16):2403–2414. | ||
Nakajima T, Yasui K, Zen K, et al. Activation of B-Myb by E2F1 in hepatocellular carcinoma. Hepatol Res. 2008;38(9):886. | ||
Chen YL, Uen YH, Li CF, et al. The E2F transcription factor 1 transactives stathmin 1 in hepatocellular carcinoma. Ann Surg Oncol. 2013;20(12):4041–4054. | ||
Chen Q, Wang L, Jiang M, et al. E2F1interactive with BRCA1 pathway induces HCC two different small molecule metabolism or cell cycle regulation via mitochondrion or CD4+ T to cytosol. J Cell Physiol. 2018;233(2):1213–1221. | ||
Arakawa Y, Kajino K, Kano S, et al. Transcription of dbpA, a Y box binding protein, is positively regulated by E2F1: implications in hepatocarcinogenesis. Biochem Biophys Res Commun. 2004;322(1):297–302. | ||
El Tayebi HM, Omar K, Hegy S, et al. Repression of miR-17-5p with elevated expression of E2F-1 and c-myc in non-metastatic hepatocellular carcinoma and enhancement of cell growth upon reversing this expression pattern. Biochem Biophys Res Commun. 2013;434(3):421–427. | ||
Chang L, Xi L, Liu Y, Liu R, Wu Z, Jian Z. SIRT5 promotes cell proliferation and invasion in hepatocellular carcinoma by targeting E2F1. Mol Med Rep. 2018;17(1):342. | ||
Huang Y, Tai AW, Tong S, Lok AS. HBV core promoter mutations promote cellular proliferation through E2F1-mediated upregulation of S-phase kinase-associated protein 2 transcription. J Hepatol. 2013;58(6):1068–1073. | ||
Ladu S, Calvisi DF, Conner EA, Farina M, Factor VM, Thorgeirsson SS. E2F1 inhibits c-Myc-driven apoptosis via PIK3CA/Akt/mTOR and COX-2 in a mouse model of human liver cancer. Gastroenterology. 2008;135(4):1322–1332. | ||
Choi M, Lee H, Rho HM. E2F1 activates the human p53 promoter and overcomes the repressive effect of hepatitis B viral X protein (HBx) on the p53 promoter. IUBMB Life. 2002;53(6):309–317. | ||
Hx S, Xu Y, Yang XR, et al. HIF-2α inhibits hepatocellular carcinoma growth through the TFDP3/E2F1-dependent apoptotic pathway. Hepatology. 2013;57(3):1088. | ||
Farra R, Grassi G, Tonon F, et al. The role of the transcription factor E2F1 in hepatocellular carcinoma. Curr Drug Deliv. 2017;14(2):272–281. | ||
Santoni-Rugiu E, Jensen MR, Thorgeirsson SS. Disruption of the pRb/E2F pathway and inhibition of apoptosis are major oncogenic events in liver constitutively expressing c-myc and transforming growth factor alpha. Cancer Res. 1998;58(1):123. | ||
Huang J, Yang J, Lei Y, et al. An ANCCA/PRO2000-miR-520a-E2F2 regulatory loop as a driving force for the development of hepatocellular carcinoma. Oncogenesis. 2016;5(5):e229. | ||
Dong Y, Zou J, Su S, et al. MicroRNA-218 and microRNA-520a inhibit cell proliferation by downregulating E2F2 in hepatocellular carcinoma. Mol Med Rep. 2015;12(1):1016–1022. | ||
Zeng X, Yin F, Liu X, et al. Upregulation of E2F transcription factor 3 is associated with poor prognosis in hepatocellular carcinoma. Oncol Rep. 2014;31(3):1139–1146. | ||
Liu LX, Jiang HC, Liu ZH, et al. Expression of cell cycle/growth regulator genes in human hepatocellular carcinoma and adjacent normal liver tissues. Oncol Rep. 2003;10(6):1771–1775. | ||
Kent LN, Bae S, Tsai SY, et al. Dosage-dependent copy number gains in E2F1 and E2F3 drive hepatocellular carcinoma. J Clin Invest. 2017;127(3):830–842. | ||
Cao T, Li H, Hu Y, Ma D, Cai X. miR-144 suppresses the proliferation and metastasis of hepatocellular carcinoma by targeting E2F3. Tumour Biol. 2014;35(11):10759–10764. | ||
Xiao F, Zhang W, Chen L, et al. MicroRNA-503 inhibits the G1/S transition by downregulating cyclin D3 and E2F3 in hepatocellular carcinoma. J Transl Med. 2013;11:195. | ||
Yang H, Zheng W, Shuai X, et al. MicroRNA-424 inhibits Akt3/E2F3 axis and tumor growth in hepatocellular carcinoma. Oncotarget. 2015;6(29):27736. | ||
Yang Y, Chang S, Zhao Z, et al. MicroRNA-214 suppresses the proliferation of human hepatocellular carcinoma cells by targeting E2F3. Oncol Lett. 2015;10(6):3779–3784. | ||
Ye J, Zhang W, Liu S, Liu Y, Liu K. miR-363 inhibits the growth, migration and invasion of hepatocellular carcinoma cells by regulating E2F3. Oncol Rep. 2017;38(6):3677–3684. | ||
Park YM, Choi JY, Bae SH, et al. Microsatellite instability and mutations of E2F-4 in hepatocellular carcinoma from Korea. Hepatol Res. 2000;17(2):102–111. | ||
Yoshida M, Matsui Y, Iizuka A, Ikarashi Y, Aa I. G2-phase arrest through p21(WAF1/Cip1) induction and cdc2 repression by gnidimacrin in human hepatoma HLE cells. Anticancer Res. 2009;29(4):1349–1354. | ||
Sun J, Li H, Huo Q, et al. The transcription factor FOXN3 inhibits cell proliferation by downregulating E2F5 expression in hepatocellular carcinoma cells. Oncotarget. 2016;7(28):43534–43545. | ||
Zou C, Li Y, Cao Y, et al. Up-regulated microRNA-181a induces carcinogenesis in hepatitis B virus-related hepatocellular carcinoma by targeting E2F5. BMC Cancer. 2014;14:97. | ||
Armstrong SA, Staunton JE, Silverman LB, et al. MLL translocations specify a distinct gene expression profile that distinguishes a unique leukemia. Nat Genet. 2002;30(1):41–47. | ||
Lammens T, Li J, Leone G, DeVeylder L. Atypical E2Fs: new players in the E2F transcription factor family. Trends Cell Biol. 2009;19(3):111–118. | ||
Logan N, Graham A, Zhao X, et al. E2F-8: an E2F family member with a similar organization of DNA-binding domains to E2F-7. Oncogene. 2005;24(31):5000–5004. | ||
Moon NS, Dyson N. E2F7 and E2f8 keep the E2F family in balance. Dev Cell. 2008;14(1):1–3. | ||
Liu HX, Fang Y, Hu Y, Gonzalez FJ, Fang J, Wan YJ. PPARβ regulates liver regeneration by modulating Akt and E2F signaling. PLoS One. 2013;8(6):e65644. | ||
Kent LN, Rakijas JB, Pandit SK, et al. E2f8 mediates tumor suppression in postnatal liver development. J Clin Invest. 2016;126(8):2955–2969. | ||
Cam H, Dynlacht BD. Emerging roles for E2F: beyond the G1/S transition and DNA replication. Cancer Cell. 2003;3(4):311–316. | ||
Gaubatz S, Wood JG, Livingston DM. Unusual proliferation arrest and transcriptional control properties of a newly discovered E2F family member, E2F-6. Proc Natl Acad Sci U S A. 1998;95(16):9190–9195. | ||
Carvajal LA, Hamard PJ, Tonnessen C, Manfredi JJ. E2F7, a novel target, is up-regulated by p53 and mediates DNA damage-dependent transcriptional repression. Genes Dev. 2012;26(14):1533–1545. | ||
Wenzel PL, Chong JL, Sáenz-Robles MT, et al. Cell proliferation in the absence of E2F1-3. Dev Biol. 2011;351(1):35–45. | ||
Bracken AP, Ciro M, Cocito A, Helin K. E2F target genes: unraveling the biology. Trends Biochem Sci. 2004;29(8):409–417. | ||
Weijts BG, Bakker WJ, Cornelissen PW, et al. E2F7 and E2f8 promote angiogenesis through transcriptional activation of VEGFA in cooperation with HIF1. EMBO J. 2012;31(19):3871–3884. | ||
Pipinikas CP, Nair SB, Kirby RS, Nd C, Fenske CD. Measurement of blood E2F3 mRNA in prostate cancer by quantitative RT-PCR: a preliminary study. Biomarkers. 2007;12(5):541–557. | ||
Al Ahmed HA, Nada O. E2F3 transcription factor: a promising biomarker in lung cancer. Cancer Biomark. 2017;19(1):21–26. |
Supplementary materials
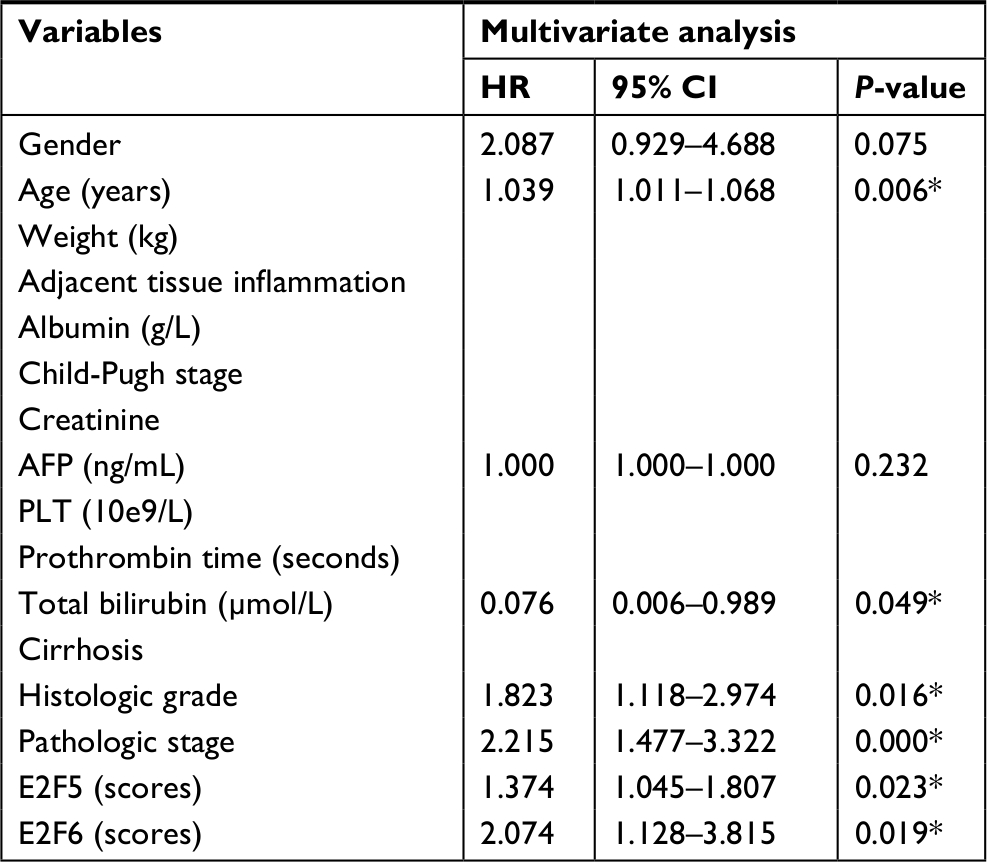 | Table S1 Multivariate analysis of overall survival in 371 HCC specimens Notes: Statistical analysis was performed by Cox test analysis. *P-values with significant difference. Abbreviations: AFP, alpha fetoprotein; HCC, hepatocellular carcinoma; PLT, platelet. |
 © 2019 The Author(s). This work is published and licensed by Dove Medical Press Limited. The full terms of this license are available at https://www.dovepress.com/terms.php and incorporate the Creative Commons Attribution - Non Commercial (unported, v3.0) License.
By accessing the work you hereby accept the Terms. Non-commercial uses of the work are permitted without any further permission from Dove Medical Press Limited, provided the work is properly attributed. For permission for commercial use of this work, please see paragraphs 4.2 and 5 of our Terms.
© 2019 The Author(s). This work is published and licensed by Dove Medical Press Limited. The full terms of this license are available at https://www.dovepress.com/terms.php and incorporate the Creative Commons Attribution - Non Commercial (unported, v3.0) License.
By accessing the work you hereby accept the Terms. Non-commercial uses of the work are permitted without any further permission from Dove Medical Press Limited, provided the work is properly attributed. For permission for commercial use of this work, please see paragraphs 4.2 and 5 of our Terms.