")
Back to Journals » Cancer Management and Research » Volume 10
Prognostic value of tumor burden in nasopharyngeal carcinoma
Authors Chen CB, Fei ZD, Huang CX, Ding JM, Chen LS
Received 28 March 2018
Accepted for publication 12 June 2018
Published 3 September 2018 Volume 2018:10 Pages 3169—3175
DOI https://doi.org/10.2147/CMAR.S169459
Checked for plagiarism Yes
Review by Single anonymous peer review
Peer reviewer comments 2
Editor who approved publication: Dr Antonella D'Anneo
Chuanben Chen,1,2 Zhaodong Fei,1,2 Chaoxiong Huang,2 Jianming Ding,1,2 Lisha Chen1,2
1Department of Radiation Oncology, Fujian Cancer Hospital, Fujian Medical University Cancer Hospital, Fuzhou, Fujian, People’s Republic of China; 2Provincial Clinical College, Fujian Medical University, Fuzhou, Fujian, People’s Republic of China
Background: The prognostic value of primary tumor volume (TV) in nasopharyngeal carcinoma (NPC) has been confirmed. However, studies of the prognosis value of tumor burden, including TV and nodal volume (NV), have been relatively infrequent. Therefore, the aim of this study was to evaluate the prognostic value of tumor burden in NPC patients treated with intensity-modulated radiotherapy.
Methods: Receiver operating characteristics curves were generated to determine rational cutoff points for TV and NV. The volumes identified included 12.5, 25.0, and 50.0 mL, and 0, 12.5, and 25 mL, respectively. According to these cutoff volumes, four subgroups were established for TV as TV1–TV4, and four subgroups were established for NV as NV0–NV3. Then, the entire cohort (992 NPC patients) was divided into 16 subgroups according to these four levels of TV and NV. Based on similarities in the 5-year overall survival (OS) rates for these 16 subgroups, four patient groups were established, G1–G4.
Results: The mean TV and NV values for our cohort were 39.5±30.8 mL and 16.5±17.6 mL, respectively. The 5-year distant failure-free rate, the 5-year disease-free survival rate, and the 5-year OS rate for G3 and G4 were significantly lower than those for G1 and G2. In particular, the OS curves of the four patient groups were significantly separated. A multivariate analysis identified TV >50 mL, T-stage (3–4), and N-stage (2–3) as adverse prognostic factors for OS.
Conclusions: The results of this study demonstrate that tumor burden has a significant prognostic value for NPC patients treated with intensity-modulated radiotherapy. Hence, tumor burden, including TV and NV, should be incorporated into the current staging system for NPC to improve prognostic significance.
Keywords: prognostic value, tumor burden, primary tumor volume , nodal volume, nasopharyngeal carcinoma
Introduction
The geographic and ethnic incidence of nasopharyngeal carcinoma (NPC) significantly differs worldwide. For example, NPC is commonly diagnosed in southern China and southeast Asia, yet it is rarely diagnosed in western Europe and North America.1,2 Radiotherapy, especially intensity-modulated radiotherapy (IMRT), is currently recognized as the primary treatment for NPC due to the complex anatomic site of NPC and its high radiosensitivity.3
The American Joint Committee on Cancer (AJCC) staging system (seventh edition) has been widely applied to NPC patients. However, in contrast with the staging of other types of malignant tumors, including lung, breast, and oropharyngeal carcinomas, where tumor volume is widely used for predicting prognosis,4 tumor volume is not considered in the TNM-staging system developed by AJCC for NPC. This is inconsistent with the observations by our group and others that primary tumor volume (TV) has a significant value in the prognosis of NPC.5–9 This had also been confirmed in our previous study.10 Nodal volume (NV) is a critical aspect of tumor burden and primary tumors, and thus, it may also affect patient prognosis of NPC. However, most of the previous studies were confined to the prognostic value of TV in NPC. Very few studies have examined the prognosis value of NV. In this study, we evaluated the prognostic value of tumor burden, including TV and NV. Our goal was to determine whether these two aspects of tumor burden should be considered when evaluating prognosis and establishing a treatment plan for NPC.
Methods
Patients and staging evaluation
Between May 2002 and September 2009, a total of 992 NPC patients underwent IMRT at our center. Disease staging was performed for all of the patients according to AJCC seventh edition guidelines. All of the patients provided written informed consent for their clinical data to be used for clinical research. A retrospective analysis of these patients’ data was approved by the Ethics Committee of Fujian Provincial Cancer Hospital (KT2016-012-01), with patient information anonymized and de-identified prior to analysis. Patient characteristics are summarized in Table 1. All of the patients involved have given their written informed consent for this publication.
 | Table 1 Patients’ characteristics |
Study design
Receiver operating characteristic (ROC) curves were generated to assess different cutoff points for TV and NV. An ROC curve is a plot of sensitivity vs specificity for a range of cutoff points, and it facilitates selection of a cutoff point that optimizes sensitivity and specificity for a continuous predictor. According to AJCC T-staging, we then further divided the patients into four groups according to TV, NV, T-stage, and N-stage. The advanced stages were characterized by a larger tumor volume compared with the less advanced stages. Consequently, advanced T-stage was established as a positive parameter in our determinations of rational cutoff points. For example, T2 patients were used as a positive actual state, while T1 patients were used as the negative state, in generating ROC curves. A rational cutoff point was then used as the standard for distinguishing TV1 and TV2.10 A rational cutoff point should maximize the true positive rate and minimize the false positive rate.
The cutoff volumes determined for TV and NV were 12.5, 25.0, and 50.0 mL, and 0, 12.5, and 25 mL, respectively. Based on the four subgroups that were established as TV1–TV4, and the four subgroups that were established as NV0–NV3, all of the NPC patients (n=992) were divided into 16 subgroups. The 16 subgroups were then recombined to form four groups (G1–G4) according to similarities in 5-year overall survival (OS) curves, thereby representing the different levels of tumor burden. The prognostic value of tumor burden, including TV and NV, were subsequently assessed.
Measurements of TV and NV
Pretreatment, contrast-enhanced computed tomography scans were performed from the top of the head to 2 cm below the sternoclavicular joint to assess tumor volume. Briefly, contiguous axial scanning at a slice thickness of 3 mm was imported into a three-dimensional (3D) treatment-planning system, and a radiation oncologist manually outlined the primary lesion in each image by using pretreatment magnetic resonance images as a reference. As a result, the area of the primary tumor and metastatic lymph nodes were independently delineated prior to treatment. Gross tumor volume-primary tumor (GTV-T) included all gross diseases as determined by imaging, clinical, and endoscopic findings. Gross tumor volume-node (GTV-N) was delineated as follows:11,12 1) lymph node with a minimal axial diameter ≥1 cm, 2) three or more enlarged lymph nodes with a minimal axial diameter of 8 mm, or 3) a lymph node with an irregular enhancement or an enhanced rim. Subsequently, tumor volume, including GTV-T and GTV-N, were automatically calculated by reconstructing a 3D image.
Treatment methods
All of the patients in this study were treated with IMRT. In addition, most of the patients received neoadjuvant, concurrent, or adjuvant chemotherapy which consisted of platinum-based drugs. Target volumes were delineated according to an institutional treatment protocol previously defined by our center.10,13 Briefly, a total dose of 66.00–69.96 Gy at 2.0–2.25 Gy/fraction was applied for GTV-T and GTV-N, while 60–66 Gy for high-risk clinical target volume (CTV-1) and 54–60 Gy for low-risk clinical target volume (CTV-2) and lymphatic drainage regions (CTV-N) were also prescribed.
Follow-up
The first evaluation of curative effect was conducted within the first 3 months after completing IMRT. Patients were subsequently evaluated every 3 months within the first 3 years after IMRT, then every 6 months up to the first 5 years, and once a year thereafter. The 5-year local regional relapse-free survival (LRRFS) rate, the 5-year distant failure-free rate (DFFR), the 5-year disease-free survival (DFS) rate, and the 5-year OS rate were calculated from the date of diagnosis to the first defining event and were used to estimate prognosis.
Statistical methods
Statistical analyses were performed with SPSS statistical software. The Kaplan–Meier method was used for analyses of patient survival. ROC curves were used to assess different cutoff points for TV and NV. The significance of differences between multiple survival curves was calculated according to the log-rank test. The independent significance of different prognostic factors was analyzed by performing a Cox proportional hazards regression analysis. P-values <0.05 were considered to indicate statistical significance.
Results
The median duration of follow-up was 65.0 months (range, 3–110 months). The 5-year LRRFS, DFFR, DFS, and OS rates for the entire cohort were 90.7%, 85.7%, 74.9%, and 83.2%, respectively. The mean TV was 39.5±30.8 mL (range 1.25–235.6 mL) and the mean NV was 16.5±17.6 mL (range 0–180.8 mL).
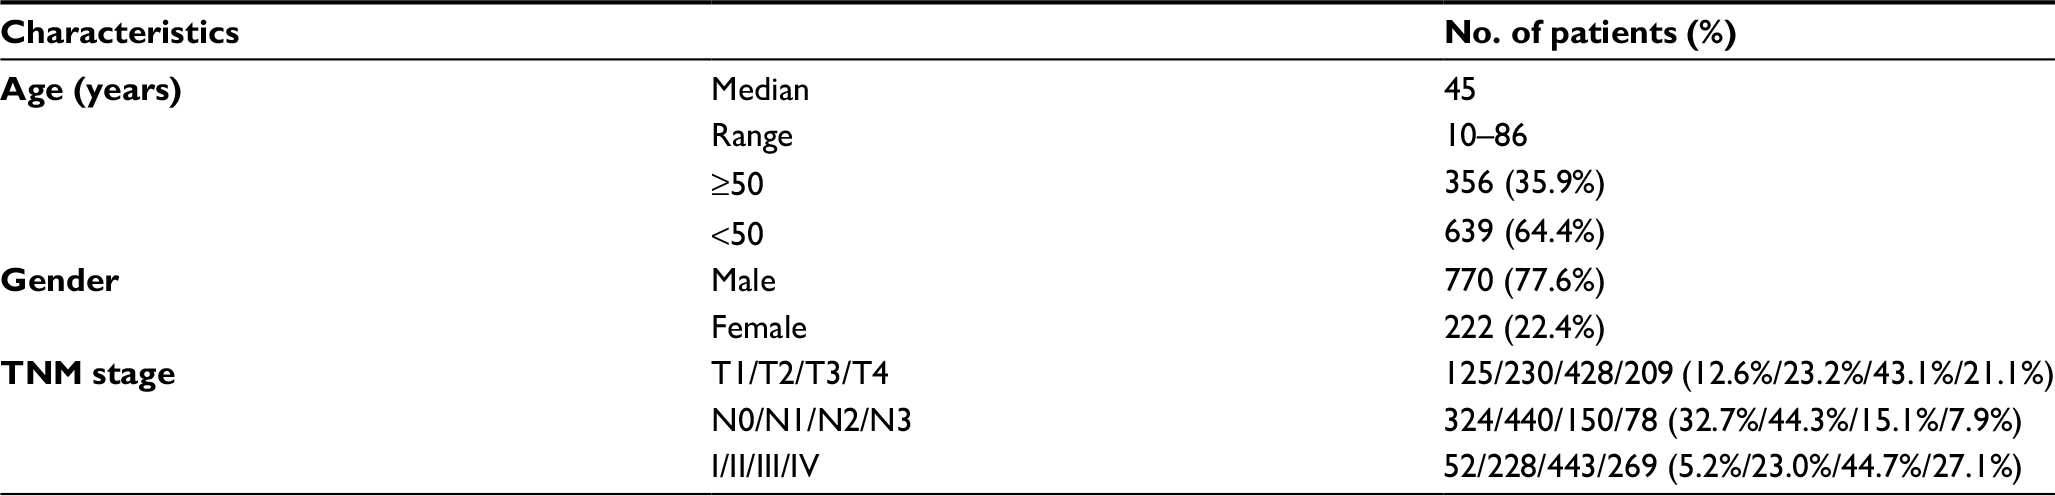
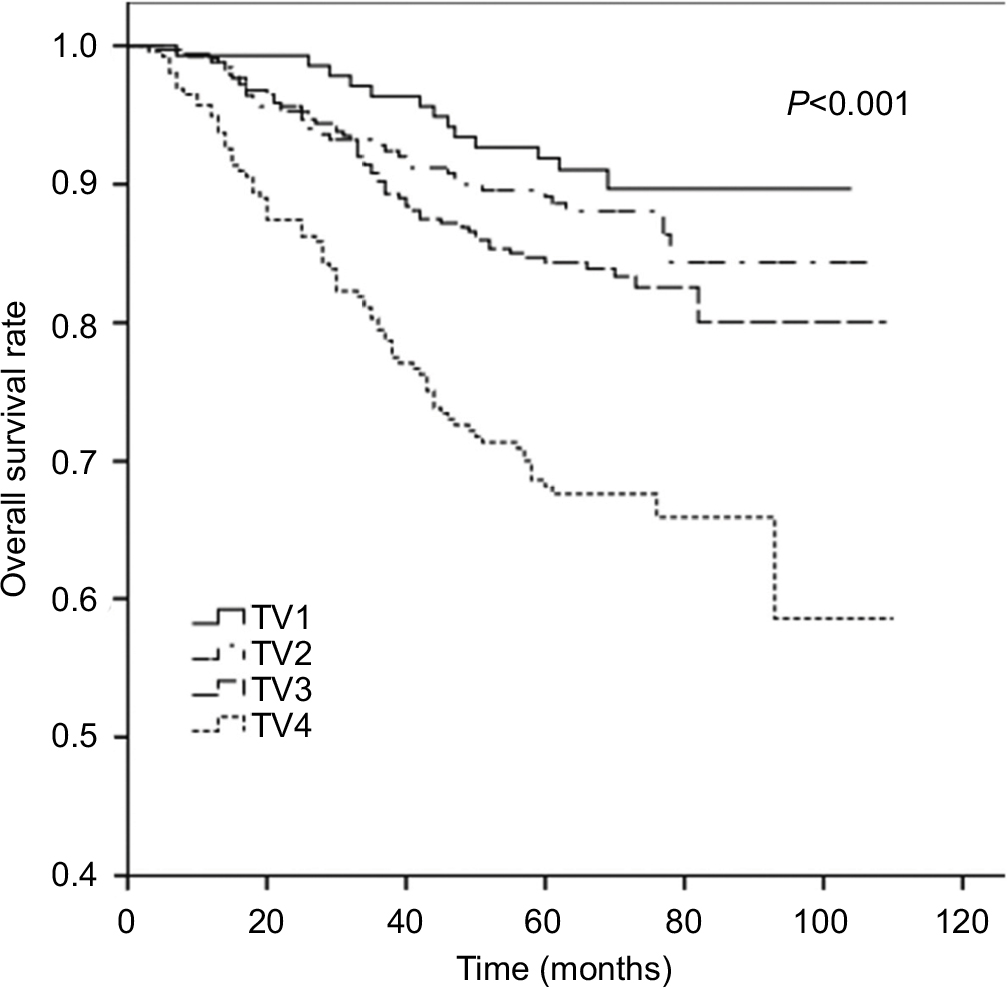
Volumes of 12.5, 25.0, and 50.0 mL were determined to be cutoff points for TV. The corresponding sensitivity and 1–specificity values for these cutoff points were 0.656 and 0.248 (area under the ROC curve [AUC] =0.71, P<0.001), 0.739 and 0.352 (AUC =0.74, P<0.001), and 0.703 and 0.339 (AUC =0.79, P<0.001), respectively in each case. Volumes of 0, 12.5, and 25 mL were determined to be the cutoff points for NV. The corresponding sensitivity and 1–specificity values for these cutoff points were 0.782 and 0.437 (AUC =0.70, P<0.001) and 0.780 and 0.480 (AUC =0.72, P<0.001). According to these cutoff values, the NPC patients were divided into four subgroups according to TV and NV. The former included TV1 ≤12.5 mL, 12.5 mL < TV2 ≤ 25 mL, 25 mL< TV3 ≤ 50 mL, and TV4 > 50 mL. The latter included NV0 =0 mL, 0 mL <NV1 ≤12.5 mL, 12.5 mL < NV2 ≤ 25 mL, and NV3 >25 mL.
The 5-year OS rates for TV1–TV4 were 92.2%, 89.8%, 84.8%, and 69.5%, respectively (P<0.001). For NV0–NV3, the 5-year OS rates were 90.3%, 85.3%, 83.4%, and 75.2%, respectively (P=0.004). Thus, an increase in TV or NV resulted in a marked downward trend in 5-year OS rate. Cumulative survival curves for TV1, TV2, and TV3 were relatively similar and were clearly separated from TV4 (Figure 1). Similarly, NV3 was clearly separated from the other subgroups (Figure 2). In comparison with the other groups, the 5-year OS rates for TV4 and NV3 were significantly lower.
 | Figure 1 Cumulative survival curves according to primary tumor volume (TV). |
 | Figure 2 Cumulative survival curves according to nodal volume (NV). |
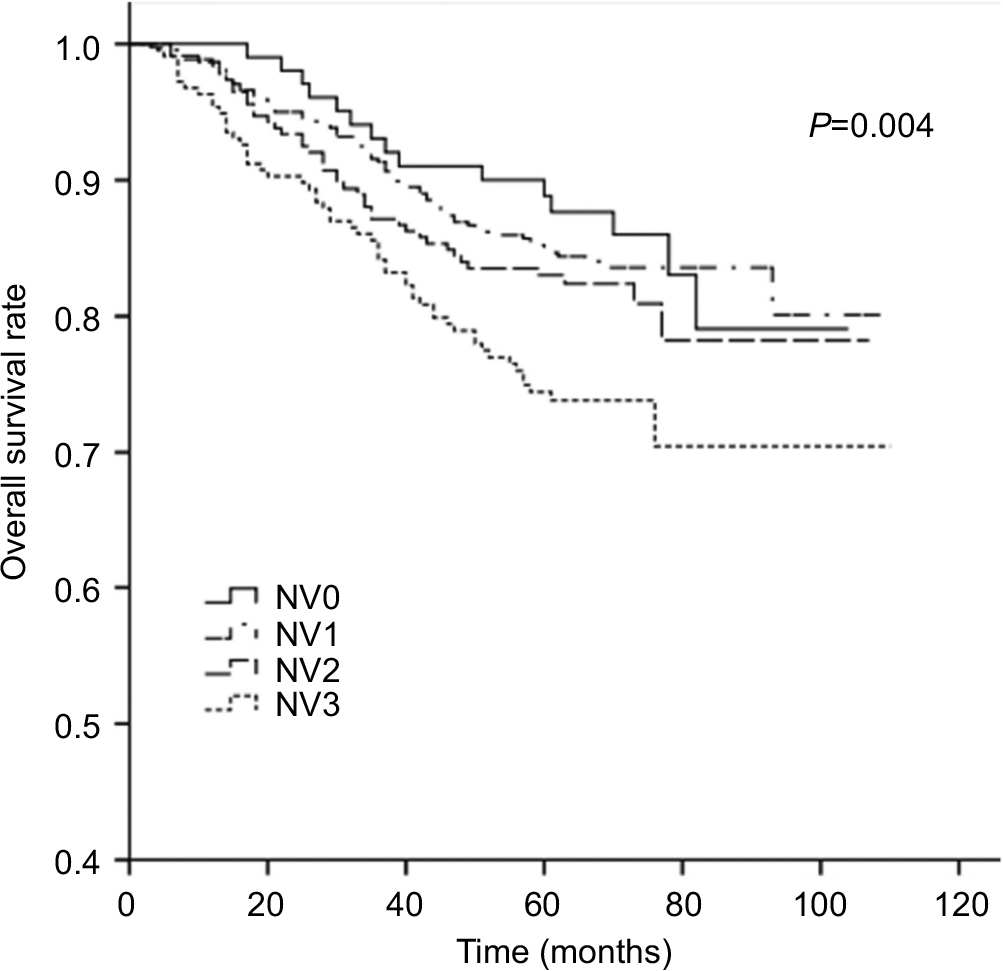
Based on the four subgroups that were established as TV1–TV4, and the four subgroups that were established as NV0–NV3, all of the patients were divided into 16 subgroups. In Figure 3, the 5-year OS rates are shown for each of these 16 subgroups. We then further subdivided the 16 subgroups into four groups according to similarities in 5-year OS rates. This produced G1 (TV1NV0, TV1NV1), G2 (TV1NV2, TV2NV0, TV2NV1, TV2NV2, TV3NV0, TV3NV1, and TV3NV2), G3 (TV1NV3, TV2NV3, TV3NV3, and TV4NV0), and G4 (TV4NV1, TV4NV2, and TV4NV3) subgroups, with the difference in 5-year OS among the subgroups being nearly <5%.
 | Figure 3 The 5-year overall survival curves for the 16 subgroups and the corresponding establishment of groups, G1–G4. |
The 5-year LRRFS, DFFR, DFS, and OS rates for G1–G4 are presented in Table 2, and all four rates exhibited a downward trend. The 5-year DFFR, DFS, and OS rates for G3 and G4 were also significantly lower than those for G1 and G2. Moreover, cumulative survival curves for G1–G4 exhibited a significant difference in 5-year OS between the four groups (P<0.001; Figure 4). The cumulative survival curves of TNM stage (sevevth edition,2010) were also made for a simple comparison and analysis with G1–4 (Figure 5).
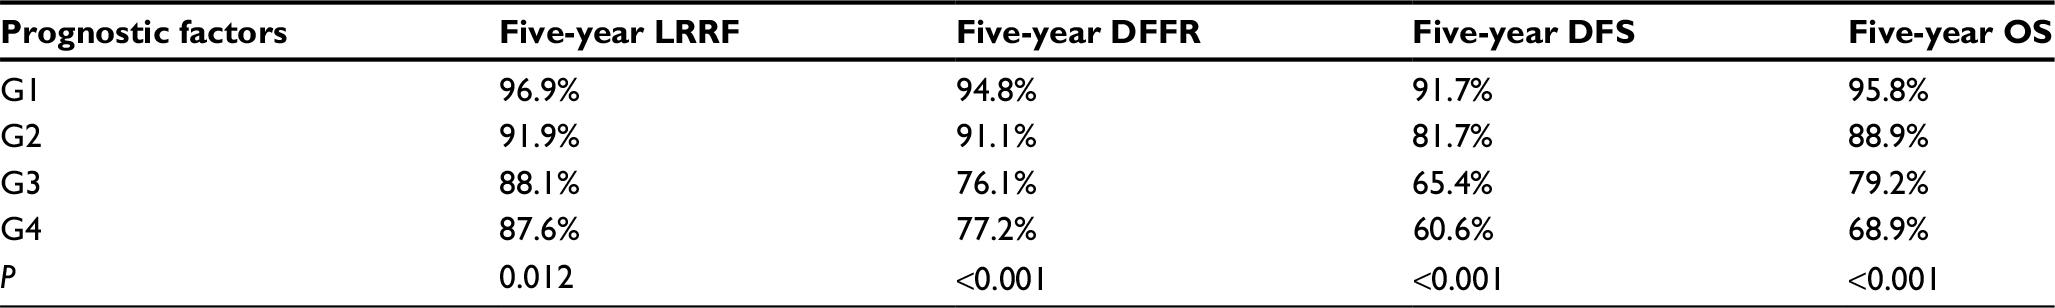 | Table 2 Treatment outcomes of the different tumor burden Abbreviations: DFFR, distant failure-free rate; DFS, disease-free survival; LRRF, local regional relapse free; OS, overall survival. |
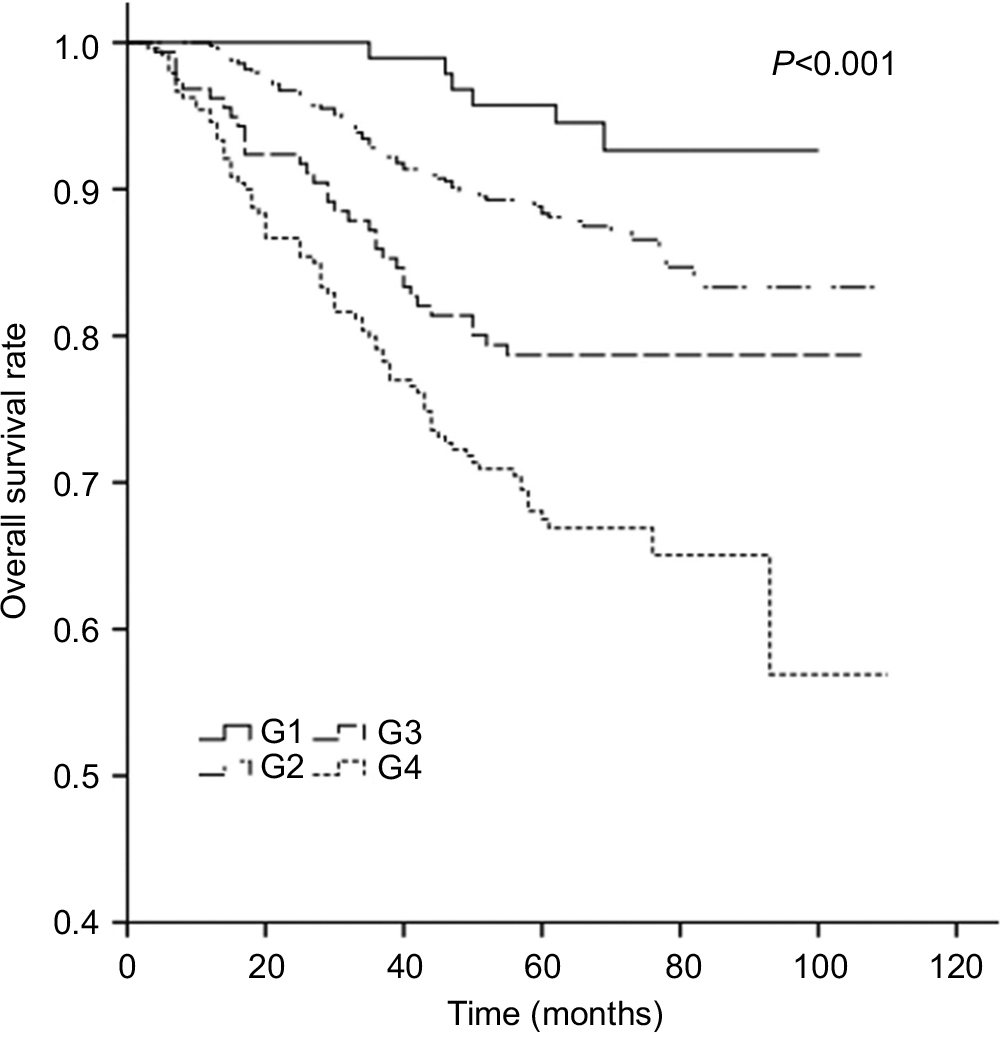 | Figure 4 Cumulative survival curves according to tumor burden. |
| Figure 5 Cumulative survival curves according to AJCC TNM-staging (seventh edition, 2010).23 Abbreviation: AJCC, American Joint Committee on Cancer. |
The Cox proportional hazards regression model was constructed to calculate the relative risks (RRs) and CIs for different prognostic factors. A multivariate analysis revealed that TV >50 mL, T3–T4 stage, and N2–N3 stage were adverse prognostic factors for OS.
Discussion
The most widely used primary treatment for NPC is IMRT, and this landmark radiation treatment has greatly improved the quality of life and survival rate of NPC patients by optimizing the dose distribution of radiotherapy. Currently, the AJCC TNM-staging system is the only major indicator available for assessing the prognosis of malignant tumors. However, in several recent studies, a TNM-staging system based on anatomic location was found to be limited in its ability to predict prognosis for NPC patients treated with IMRT.14–16 In contrast, the prognostic value of TV for NPC patients undergoing IMRT treatment has been confirmed in many studies.
In this study, univariate and multivariate analyses confirmed that TV is a significant prognostic factor for survival rate in NPC, with TV >50 mL predicting poor treatment outcome. T stage and N stage were also identified as adverse prognostic factors for 5-year OS rate. In the univariate analyses, NV >25 mL was also shown to predict poor prognosis, yet it did not maintain statistical significance in our multivariate analysis. For the G1–G4 groups, their 5-year LRRFS, DFFR, DFS, and OS rates exhibited a distinct downward trend. Moreover, the cumulative survival curves for G1–G4 were distinct during follow-up. These results indicate that this new prognostic indicator has a significant prognostic value in IMRT therapy for NPC. Furthermore, the prognostic value for tumor burden was found to be comparable to that of clinical staging by the AJCC TNM-staging system.
In previous studies, significance of TV on the prognosis of NPC was confirmed, and various cutoff values for TV were proposed.6,7,10,17 For example, Wu et al7 divided 321 patients into the following three subgroups according to an ROC curve analysis: V1 (<19 mL, n=94), V2 (19–49 mL, n=154), and V3 (GTV, P≥49 mL, n=73). The 5-year distance metastasis free survival (DMFS) rates for these groups were 93.5%, 77.5%, and 66.6%, respectively, and the 5-year OS rates were 96.7%, 84.5%, and 64.6%, respectively. In the multivariate analysis performed in the present study, TV was identified as an independent prognostic factor (P<0.001). In our previous study of 112 NPC patients who underwent IMRT,10 the 5-year OS rate for V1 (<15.65 mL), V2 (15.65–24.25 mL), V3 (24.25–50.55 mL), and V4 (>50.55 mL) were 88.5%, 83.3%, 82.4%, and 54.5%, respectively. In addition, the cumulative survival curves for V1–V4 showed a distinct curve for TV >50 mL. In a study conducted by Feng et al,17 the 5-year OS rates for TV1 (≤20 mL), TV2 (20–30 mL), TV3 (30–40 mL), and TV4 (>40 mL) were 83.7%, 77.8%, 76.4%, and 61.3%, respectively (P=0.002). TV >40 mL was identified as an independent prognostic factor for the 5-year local and regional control rate in a multivariate analysis (RR: 2.454, P=0.002). These results, in combination with those of previous studies, strongly support the prognostic value of TV in NPC. In our univariate analyses in the present study, TV >50 mL and NV >25 mL predicted a poor 5-year OS rate. However, in our multivariate analysis, TV >50 mL still represented an adverse prognostic factor for 5-year OS rate, while NV >25 mL did not exhibit statistical significance. Similar studies17–19 have also revealed a correlation between NV and prognosis, although these studies have been relatively infrequent. In the present study, NV predicted poor 5-year OS. It will be important for these results to be confirmed in additional high-quality studies.
Previously, use of TV and NV to predict prognosis has not been extensively examined. In the present study, tumor burden was measured based on both TV and NV, and the relationship between tumor volume burden and prognostic evaluation in NPC patients treated with IMRT was examined. For this, we initially divided 992 NPC patients into 16 subgroups according to four levels of TV (TV1–TV4) and four levels of NV (NV0–NV3). Next, similarities in the 5-year OS curves for these 16 subgroups led to a redistribution of these 16 subgroups into four groups with distinct 5-year OS curves (G1–G4). When the 5-year LRRFS, DFFR, DFS, and OS rates were examined for G1–G4 (Table 2), all except LRRFS were significantly worse for G3 and G4 compared with G1 and G2. The differences in the 5-year LRRFS rates for G1–G4 did exhibit a downward trend, although no significant differences were observed. Some scholars have reported that IMRT improves tumor target conformity and clinical efficacy, and this leads to better local control.20–22 Based on the AJCC staging system, cumulative survival curves were generated according to TNM staging of the 992 NPC patients examined in the present study. These survival curves were clearly distinct, thereby indicating that the AJCC TNM-staging system is appropriate for clinical staging. The cumulative survival curves of groups G1–G4 were also distinct. When our cohort of NPC patients was assigned a clinical stage according to the AJCC TNM-staging system, the proportions for stages I–IV were 5.2%, 23.0%, 44.7%, and 27.1%, respectively. In comparison, the proportions for G1–G4 were 9.7%, 50.0%, 16.0%, and 24.3%, respectively. Currently, the widespread application of IMRT and concurrent chemotherapy has substantially improved the treatment for NPC. However, we would further advocate that NPC patients at an early stage should account for a larger proportion of the patients who undergo treatment. And the proportion of the patients at an advanced stage which has poor prognosis should decline. From this point of view, the proportionality of four groups was more reasonable.
Conclusion
The present results demonstrate that the 5-year OS rate and 5-year DFFR for TV >50 mL and NV >25 mL were significantly worse in the univariate analyses performed. Meanwhile, our multivariate analysis showed that TV is a significant prognostic factor in NPC patients receiving IMRT. Our analysis of cumulative survival curves further demonstrated that the establishment of subgroups according to TV and NV, as shown with G1–G4, was found to be comparable to clinical staging in the AJCC TNM-staging system. However, the proportionality of patient distribution of G1–G4 according to clinical stage of the AJCC TNM-staging system was more reasonable. Therefore, in addition to use of the current TNM-staging system, we suggest that tumor burden, including TV and NV, should be considered as prognostic factors when evaluating diagnosis and treatment plans for NPC.
Data sharing statement
The dataset for this study can be requested from the corresponding author.
Acknowledgments
This work was supported by a research project for youths from the Department of Health of Fujian Province (2013-2-10), the Natural Science Foundation of Fujian Province (2015J01380), Innovative Medical Subject of Fujian Province (2014-CX-7), Fujian Provincial Health and Family Research Talent Training Program, the Key Clinical Specialty Discipline Construction Program of Fujian Province (2012), and the National Clinical Key Specialty Construction Program of China (2013).
Disclosure
The authors report no conflicts of interest in this work.
References
Sun X, Tong LP, Wang YT, et al. Can global variation of nasopharynx cancer be retrieved from the combined analyses of IARC Cancer Information (CIN) databases? PLoS One. 2011;6(7):2112–2126. | ||
Lo KW, To KF, Huang DP, Kw L, Kf T. Focus on nasopharyngeal carcinoma. Cancer Cell. 2004;5(5):423–428. | ||
Wenzeqiu P, Junlishi H, Chongzhao K. Neoadjuvant chemotherapy plus intensity-modulated radiotherapy versus concurrent chemoradiotherapy plus adjuvant chemotherapy for the treatment of locoregionally advanced nasopharyngeal carcinoma: a retrospective controlled study. Chin J Cancer. 2016;35(1):46–54. | ||
Egner JR. AJCC Cancer Staging Manual. JAMA. 2010;304(15):1726–1727. | ||
Chen MK, Chen TH, Liu JP, Chang CC, Chie WC. Better prediction of prognosis for patients with nasopharyngeal carcinoma using primary tumor volume. Cancer. 2004;100(10):2160–2166. | ||
Guo R, Sun Y, Yu XL, et al. Is primary tumor volume still a prognostic factor in intensity modulated radiation therapy for nasopharyngeal carcinoma? Radiother Oncol. 2012;104(3):294–299. | ||
Wu Z, Su Y, Zeng RF, Gu MF, Huang SM. Prognostic value of tumor volume for patients with nasopharyngeal carcinoma treated with concurrent chemotherapy and intensity-modulated radiotherapy. J Cancer Res Clin Oncol. 2014;140(1):69–76. | ||
Liu D, Long G, Mei Q, Hu G. Primary tumor volume should be included in the TNM staging system of nasopharyngeal carcinoma. Med Hypotheses. 2014;82(4):486–487. | ||
Lee CC, Huang TT, Lee MS, et al. Clinical application of tumor volume in advanced nasopharyngeal carcinoma to predict outcome. Radiat Oncol. 2010;5(1):1–6. | ||
Chen C, Fei Z, Pan J, Bai P, Chen L. Significance of primary tumor volume and T-stage on prognosis in nasopharyngeal carcinoma treated with intensity-modulated radiation therapy. Jpn J Clin Oncol. 2011;41(4):537–542. | ||
Som PM. Detection of metastasis in cervical lymph nodes: CT and MR criteria and differential diagnosis. Am J Roentgenol.1992;158(5):961–969. | ||
van den Brekel MW, Stel HV, Castelijns JA, et al. Cervical lymph node metastasis: assessment of radiologic criteria. Radiology. 1990;177(2):379–384. | ||
Lin S, Pan J, Han L, Zhang X, Liao X, Lu JJ, Jj L. Nasopharyngeal carcinoma treated with reduced-volume intensity-modulated radiation therapy: report on the 3-year outcome of a prospective series. Int J Radiat Oncol Biol Phys. 2009;75(4):1071–1078. | ||
Sze W-M, Lee AWM, Yau T-K, et al. Primary tumor volume of nasopharyngeal carcinoma: prognostic significance for local control. Int J Radiat Oncol Biol Phys. 2004;59(1):21–27. | ||
Lin H, Lin H-X, Ge N, Wang H-Z, Sun R, Hu W-H, Wh H. Plasma uric acid and tumor volume are highly predictive of outcome in nasopharyngeal carcinoma patients receiving intensity modulated radiotherapy. Radiat Oncol. 2013;8(1):121–127. | ||
Shen C, Lu JJ, Gu Y, Zhu G, Hu C, He S. Prognostic impact of primary tumor volume in patients with nasopharyngeal carcinoma treated by definitive radiation therapy. Laryngoscope. 2008;118(7):1206–1210. | ||
Feng M, Wang W, Fan Z, et al. Tumor volume is an independent prognostic indicator of local control in nasopharyngeal carcinoma patients treated with intensity-modulated radiotherapy. Radiat Oncol. 2013;8(1):208–210. | ||
Chua DTT, Sham JST, Leung LHT, Tai KS, Au GKH. Tumor volume is not an independent prognostic factor in early-stage nasopharyngeal carcinoma treated by radiotherapy alone. Int J Radiat Oncol Biol Phys. 2004;58(5):1437–1444. | ||
Kim JH, Lee JK, Jeong-Hyun K, Joon-Kyoo L. Prognostic value of tumor volume in nasopharyngeal carcinoma. Yonsei Med J. 2005;46(2):221–227. | ||
Peng G, Wang T, Yang KY, et al. A prospective, randomized study comparing outcomes and toxicities of intensity-modulated radiotherapy vs. conventional two-dimensional radiotherapy for the treatment of nasopharyngeal carcinoma. Radiother Oncol. 2012;104(3):286–293. | ||
Kam MK, Chau RM, Suen J, Choi PH, Teo PM, Mkm K, Pml T. Intensity-modulated radiotherapy in nasopharyngeal carcinoma: dosimetric advantage over conventional plans and feasibility of dose escalation. Int J Radiat Oncol Biol Phys. 2003;56(1):145–157. | ||
Lai SZ, Li WF, Chen L, et al. How does intensity-modulated radiotherapy versus conventional two-dimensional radiotherapy influence the treatment results in nasopharyngeal carcinoma patients? Int J Radiat Oncol Biol Phys. 2011;80(3):661–668. | ||
Edge S, Byrd DR, Compton CC, et al. AJCC cancer staging handbook from the AJCC cancer staging manual. 7th ed. New York; 2010:63–79. |
 © 2018 The Author(s). This work is published and licensed by Dove Medical Press Limited. The full terms of this license are available at https://www.dovepress.com/terms.php and incorporate the Creative Commons Attribution - Non Commercial (unported, v3.0) License.
By accessing the work you hereby accept the Terms. Non-commercial uses of the work are permitted without any further permission from Dove Medical Press Limited, provided the work is properly attributed. For permission for commercial use of this work, please see paragraphs 4.2 and 5 of our Terms.
© 2018 The Author(s). This work is published and licensed by Dove Medical Press Limited. The full terms of this license are available at https://www.dovepress.com/terms.php and incorporate the Creative Commons Attribution - Non Commercial (unported, v3.0) License.
By accessing the work you hereby accept the Terms. Non-commercial uses of the work are permitted without any further permission from Dove Medical Press Limited, provided the work is properly attributed. For permission for commercial use of this work, please see paragraphs 4.2 and 5 of our Terms.