")
Back to Journals » OncoTargets and Therapy » Volume 13
Prognostic Value of the FOXK Family Expression in Patients with Locally Advanced Rectal Cancer Following Neoadjuvant Chemoradiotherapy
Authors Zhang Y, Xu M, Chen J, Chen K, Zhuang J , Yang Y, Liu X, Guan G
Received 3 April 2020
Accepted for publication 24 July 2020
Published 16 September 2020 Volume 2020:13 Pages 9185—9201
DOI https://doi.org/10.2147/OTT.S255956
Checked for plagiarism Yes
Review by Single anonymous peer review
Peer reviewer comments 2
Editor who approved publication: Dr Leo Jen-Liang Su
Yiyi Zhang,1,* Meifang Xu,2,* Jianhua Chen,3,* Kui Chen,4 Jinfu Zhuang,1 Yuanfeng Yang,1 Xing Liu,1 Guoxian Guan1
1Department of Colorectal Surgery, The First Affiliated Hospital of Fujian Medical University, Fuzhou, People’s Republic of China; 2Department of Pathology, Fujian Medical University Union Hospital, Fuzhou, People’s Republic of China; 3Department of Radiology, Fujian Medical University Union Hospital, Fuzhou, People’s Republic of China; 4Department of General Surgery, The First Hospital of Fuzhou City Affiliated Fujian Medical University, Fuzhou, People’s Republic of China
*These authors contributed equally to this work
Correspondence: Guoxian Guan; Xing Liu
Department of Colorectal Surgery, The First Affiliated Hospital of Fujian Medical University, 20 Chazhong Road, Fuzhou City 350001, Fujian, People’s Republic of China
Email [email protected]; [email protected]
Purpose: To assess the role of the expression levels of FOXK family members, FOXK1 and FOXK2, in predicting response to neo-chemoradiotherapy (NCRT) and prognosis in locally advanced rectal cancer (LARC).
Methods: A total of 256 LARC patients who underwent NCRT and radical resection between 2011 and 2017 were enrolled in the present study. The patients were divided into a training dataset (n=169, 2011– 2015) and a validation dataset (n=87, 2016– 2017). Tumor tissues were collected before NCRT and post-surgery and were used for immunohistochemical analysis.
Results: Oncomine database analysis revealed that FOXK1 and FOXK2 were overexpressed in most cancers especially in colorectal cancer. Additionally, overexpression of FOXK1 and FOXK2 was associated with poorer prognosis by the R2 database. In both our training and validation datasets, the expression of FOXK1 and FOXK2 was lower in the pathological complete response (pCR) group compared with the non-pCR group (P< 0.05). Cox regression analysis demonstrated that pathological N stage (HR=1.810, 95% CI 1.159– 2.827, P=0.009), FOXK1 expression (HR=5.831, 95% CI 2.925– 11.625, P< 0.001), and FOXK2 expression (HR=2.390, 95% CI 11.272– 4.491, P=0.007) were independent predictors of disease-free survival (DFS). Based on the Cox multivariate analysis, we constructed a risk score model that served as a prognostic biomarker and had a powerful ability to predict pCR in LARC patients upon NCRT in both training and validation groups.
Conclusion: Expression levels of FOXK family members were associated with chemoradiotherapy resistance and prognosis of LARC patients following NCRT and were used to construct a risk score model that is a promising biomarker for LARC.
Keywords: rectal cancer, neoadjuvant chemoradiotherapy, FOXK1, FOXK2, prognosis
Introduction
The Forkhead box (FOX) family can be grouped into 19 subfamilies (FOXA to FOXS) based on sequence homology.1–3 The FOXK transcription factors are ubiquitously expressed in various tissues and organs and play vital roles in cellular functions of higher organisms. In mammalian species, the FOXK family includes two members, FOXK1 and FOXK2. FOXK family can regulate cell proliferation, survival, skeletal muscle regeneration, and myogenic differentiation as well as carcinogenesis.4–7 A tightly controlled expression and activity of FOXKs provide a balanced transcriptional network to ensure appropriate cell function and tissue development. Therefore, the deregulation of FOXKs affects cell proliferation, differentiation, apoptosis, autophagy, migration, invasion and DNA repair, which are closely associated with cancer initiation, development, metastasis, angiogenesis and drug resistance.8–13 Previous studies have implicated the FOXK family members in several cancers, including breast cancer, gastric cancer, colorectal cancer, and lung cancer.14–19 However, the exact role of these proteins in cancer remains to be fully elucidated. Moreover, the expression levels of the FOXK family members in cancers are still unclear. Sun et al20 reported that FOXK1 expression is lower in breast cancer tissue and cell lines compared with normal tissue. In contrast, Li et al19 showed that the expression of FOXK1 was higher in breast cancer tissue compared with adjacent-cancer tissues. Low expression of FOXK2 in tumor tissue compared with normal tissue was identified in breast cancer, clear-cell renal, gastric cancer, glioma, and non-small cell lung cancer.21–25 On the other hand, the expression of FOXK2 was high in colorectal cancer and hepatocellular cancer.26,27 In addition, the expression and role of the FOXK family in the locally advanced rectal cancer (LARC) patients receiving neoadjuvant chemoradiotherapy (NCRT) is still unclear.
NCRT followed by total mesorectal excision (TME) has become the standard of care for LARC. This strategy offers a higher probability of tumor downsizing and downstaging, increased tumor resectability, sphincter preservation, and better local tumor control.28–30 However, LARC patients show a wide range of responsiveness to NCRT. Approximately 15% to 45% of LARC patients develop resistance to NCRT.31 Unfortunately, there is a lack of reliable biomarkers and the mechanisms of resistance to NCRT are still unclear. Previous studies have demonstrated that FOXK2 expression is associated with the response to paclitaxel in breast cancer,32 and Wu et al reported that knockdown of FOXK1 promoted 5-fluorouracil (FU)-induced apoptosis in colorectal cancer.6 However, there is no relevant report regarding the association between the FOXK family and CRT in LARC patients. Thus, exploration of the relationship between the expression of FOXK family members and resistance to NCRT in the LARC patients is imperative.
To address this gap in the literature, the present study explored the effect of the pre-NCRT and post-surgery expression of FOXK family members in LARC patients in terms of NCRT response and survival outcome and resulted in the construction of a predictive and prognostic risk score model.
Patients and Method
Patient Eligibility
This study was a retrospective study based on our prospectively maintained colorectal cancer database and the colonoscopy samples collected before NCRT. Consecutive LARC patients who underwent NCRT and radical resection between 2011 and 2017 were identified. Patient inclusion criteria were as follows: 1) clinical stage II or III (cT3/4 or cN1/2) disease; 2) histopathologically confirmed adenocarcinomas; and 3) tumors located within 12 cm from the anal verge. Exclusion criteria included: 1) concurrent with previous or concurrent malignancies; 2) patients who underwent emergency surgery, palliative resection, or local excision. A total of 256 patients were enrolled in the present study and were divided into the training dataset (n=169, 2011–2015) and the validation dataset (n=87, 2016–2017) according to the year of diagnosis. This study was approved by the Institutional Review Board of Fujian Medical University Union Hospital (2,013-051).
Treatment Protocol
Tumor assessments were performed for tumor staging by means of a digital rectal examination, colonoscopy, chest radiography or computed tomography (CT), abdominopelvic magnetic resonance imaging (MRI) scan, and transrectal ultrasound (ERUS). Preoperative long-course radiation consisted of a total dose of 45 Gy to the pelvis (45 Gy in 25 fractions, 5 days a week), followed by a boost to the primary tumor (5.4 Gy in 3 fractions) which was according to the national comprehensive cancer network (NCCN) guidelines.33 Concurrent chemotherapy was initiated on the first day of radiotherapy using one of two chemotherapeutic regimens: 5FU plus oxaliplatin (FOLFOX) or capecitabine plus oxaliplatin (CapeOX).
The surgery was performed 8–12 weeks after the completion of radiation. Surgical techniques for rectal cancer, such as total mesorectal excision (TME) and high ligation of the inferior mesenteric artery, are routinely performed at our institution. The surgical procedure consisted of low anterior resection (LAR), abdominoperineal resection (APR), or Hartmann’s procedure. About 3–4 weeks after surgery, patients received postoperative adjuvant chemotherapy (FOLFOX or CapeOX) for 6 months.
Follow-Up
Follow-up protocol was performed every 3 months for the first 3 years, then every 6 months for the next 2 years, and annually thereafter. Physical examination (including digital rectal examination), serum carcinoembryonic antigen (CEA) test, chest X-ray or CT scan, and abdominopelvic MRI or CT scan were performed during each visit. A colonoscopy was scheduled annually after surgery. Positron emission tomography (PET) was performed when needed. Patient follow-up lasted until death or the cut-off date of December 31, 2019.
Definitions
Tumor response to NCRT was graded according to the American Joint Committee on Cancer pathological tumor regression grade (AJCC TRG);33,34 that is, TRG 0, no residual tumor cells; TRG 1, single cells or small groups of cells; TRG 2, residual cancer with the desmoplastic response; and TRG 3, minimal evidence of tumor response. Pathological complete response (pCR) was defined as the absence of viable tumor cells in the resected specimen, either at the primary site or in the lymph nodes. Venous blood samples were obtained within one week before NCRT.
Immunohistochemical Analysis and Identification of FOXK1 and FOXK2 in the Public Database
The protein expression of FOXK1 (bs-16168R, 1:200, BIOSS, China) and FOXK2 (DF13638, 1:100, Affinity Biosciences. OH. USA) in specimens obtained before and after NCRT in 256 LARC patients was assessed using the immunohistochemical streptavidin-biotin complex method.35 Phosphate-buffered saline (PBS) was used as the negative control and the image of the positive control from GE Healthcare Life Sciences. Due to a total of 216 patients who developed pCR after NCRT, the above patients’ post-surgery specimens were not enrolled in the immunohistochemical analysis. Immunoreactivity was scored by semi-quantitative analysis, and the fields were randomly selected in five directions (up, center, down, left, and right) under high magnification (×400). The color was determined based on the intensity score as follows: 0 (no staining), 1 (light yellow), 2 (brown), and 3 (deep brown). The percentage of positive cells was scored as 0 (<5%), 1 (5–25%), 2 (25–50%), 3 (50–75%), and 4 (>75%). The mean value was calculated for each case with the aforementioned scoring methods and the final score was obtained by multiplying these two scores. All analyses were performed in a double-blind manner.
The Oncomine database (https://www.oncomine.org) was also used to investigate the differential expression of FOXK1 and FOXK2 between cancer and adjacent-cancer tissues including CRC and normal groups. In addition, we explored the prognostic value of FOXK1 and FOXK2 in patients with CRC by the R2: Genomics Analysis and Visualization Platform (http://r2.amc.nl).
Statistical Analysis
Statistical analyses were performed using SPSS version 23.0 (SPSS INC., Chicago, USA) and R software packages, version 3.5.1 (The R Foundation for Statistical Computing, http://www.-rproject.org/). Categorical variables were presented in frequencies and percentages and assessed using the Chi-square or Fisher’s exact test. Continuous variables were described as means and standard deviations and assessed via the analysis of variance (ANOVA) test. The optimal cut-off points for pre-NCRT FOXK1 and FOXK2 expression were calculated and determined by using the X-tile program (http://www.tissuearray.org/rimmlab/), a new bio-informatics tool for biomarker assessment and outcome-based cut-point optimization, which identified the cut-off with the minimum p values from log-rank χ2 statistics in terms of disease-free survival (DFS).36 Survival outcomes were assessed using the Kaplan-Meier method and the Log rank test. A Cox proportional hazards model was used to identify risk factors for overall survival (OS) and DFS. Based on Cox regression model analysis, a risk factor model was developed by using the R software. The corresponding risk scores for the samples from the validation dataset were calculated using the risk score system. Based on cut-off values determined by receiver operating characteristics (ROC) analysis, patients were divided into high-risk and low-risk groups. The entire patient cohort was divided into two subgroups according to patient outcomes (recurrence or not). The risk score was selected as the cut-off value when the area under the curve (AUC) reached its maximum. Kaplan-Meier curves and Cox regression analysis were performed to compare DFS risk between high-risk and low-risk groups. The performance of the model was evaluated by time-dependent ROC analysis. P < 0.05 was considered statistically significant.
Results
Assessing the Expression and Prognostic Ability of FOXK1 and FOXK2 in the Oncomine and R2 Database
The role of the FOXK family members in different types of cancer is still controversial. To explore the role of FOXK1 and FOXK2 in different types of cancers, we analyzed the expression of FOXK1 and FOXK2 in tumor tissues and adjacent normal tissues from the Oncomine database. The results (Figure 1A and C) indicated that FOXK1 expression was higher in cancerous tissues compared with adjacent normal tissues for most cancers including bladder cancer, brain and central nervous system cancer, cervical cancer, colorectal cancer, gastric cancer, kidney cancer, liver cancer, melanoma, prostate cancer, and sarcoma. On the other hand, the overexpression of FOXK1 remained controversial in breast cancer, esophageal cancer, head and neck cancer, leukemia, lung cancer, and pancreatic cancer. Only in lymphoma, the expression of FOXK1 was low. We also found that FOXK2 expression was higher in most cancers including in colorectal cancer. To further explore the FOXK1 and FOXK2 expression in colorectal cancer we performed a meta-analysis of 22 GEO-sourced data sets mined from the Oncomine database. The results showed that FOXK1 mRNA levels were significantly higher in colorectal cancer tissues than in normal colorectal tissues (P<0.001; Figure 1B). Likewise, FOXK2 expression was also higher in colorectal cancer tissue than in normal colorectal tissues (P<0.001; Figure 1D), which was revealed by a meta-analysis of 34 GEO-sourced data sets mined from the Oncomine database.
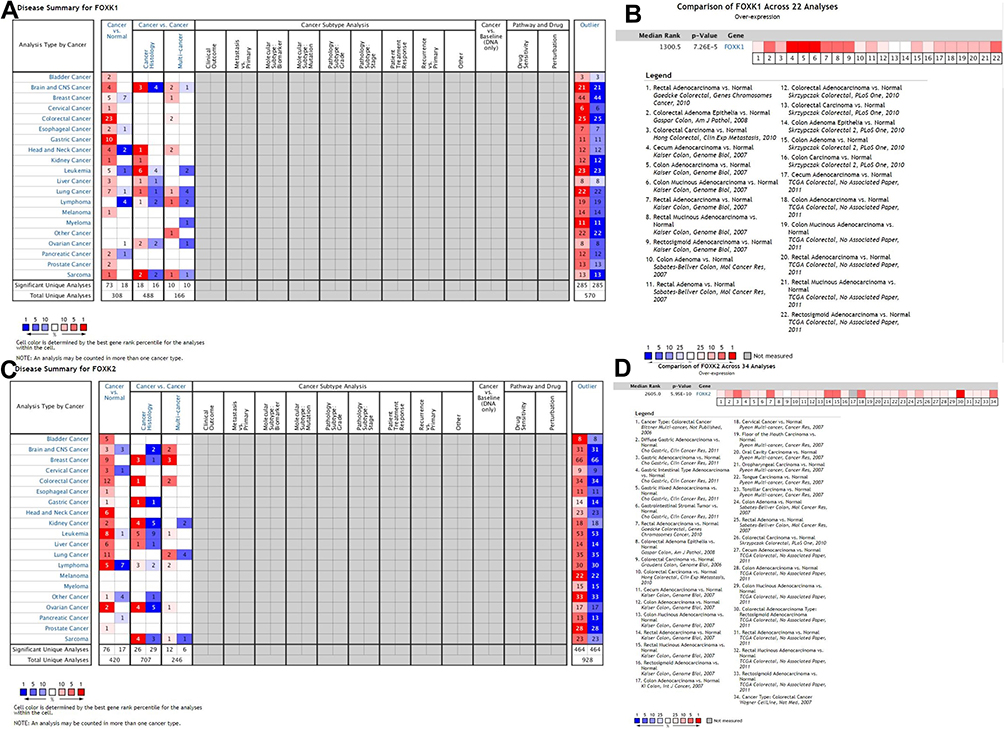 |
Figure 1 Validation of the FOXK family expression in the Oncomine database. (A and C) The FOXK1 and FOXK2 expression between cancer tissue and normal tissue in the multiple cancers. (B and D) The FOXK1 and FOXK2 expression between colorectal cancer tissue and normal tissue in the meta-analysis basing on the Oncomine database (P<0.01). |
The R2: Genomics Analysis and Visualization Platform were used to generate Kaplan-Meier event-, disease-, relapse-free, and overall survival curves using the “Tumor Colon-Sieber-290-MAS5.0-u133p2” data set, “Tumor Colon CIT (Combat)-Marisa-566-rma-u133p2” data set, “Tumor Colon (Core-Transcript)-Sveen-333-rma-sketch - huex10p data set” Tumor Colon-SieberSmith-355-MAS5.0 - u133p2” data set, “Tumor Colon MSI-status (Core Exon)-Sveen-95-rma-sketch- huex10p” data set, “Tumor Colon MSI-status (Core Transcript)-Sveen-95-rma-sketch- huex10p” data set, and “Tumor Colon (Core-Exon)-Sveen-333-rma-sketch - huex10p data set”. Low FBXW4 expression was correlated with a significantly worse event and relapse-free survival (both P < 0.05; Figure 2A–G).
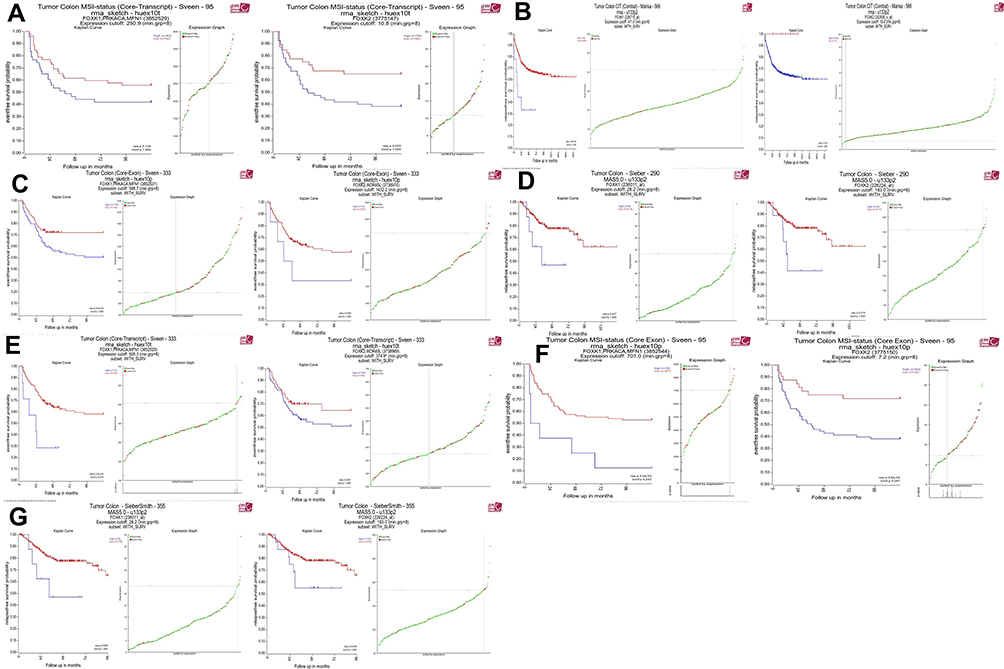 |
Figure 2 High FOXK family expression was associated with a worse event-, disease-, and relapse-free survival. (A–G) High FOXK family expression was associated with a significantly better event-, disease- and relapse-free survival. (both P <0.05). |
Clinicopathological Parameters Between the Training and Validation Datasets
Among a total of 257 LARC patients, 169 LARC patients were enrolled in the training dataset and 87 patients in the validation dataset. No statistical differences were observed between two datasets in terms of gender, age, interval time between NCRT and surgery, distance from the anal verge, clinical T stage, clinical N stage, hypoproteinemia, and pre-NCRT carcinoembryonic antigen (CEA) level, as shown in Supplementary Table 1. In terms of perioperative clinicopathological parameters, no statistical differences were found between the two datasets, as shown in Supplementary Table 1 and Supplementary Table 2.
Association of Pre-NCRT FOXK1, FOXK2 Expression with pCR
pCR is considered a short-term endpoint of NCRT. To analyze the expression of the FOXK family members in the pCR and the non-pCR groups, we explored the role of the FOXK family in LARC patients receiving NCRT. As shown in Figure 3A and B, the expression of the FOXK family members was lower in the pCR group compared with the non-pCR group (FOXK1, 9.15±0.28 vs. 5.40±0.50, P<0.01; FOXK2, 5.25±0.39 vs. 2.50±0.39, P<0.01) in the training dataset. Moreover, ROC analysis was performed to analyze the predictive ability of the FOXKs. The results demonstrated that both FOXK1 and FOXK2 had a powerful ability to predict pCR in the training dataset (FOXK1, AUC=0.80, P<0.01; FOXK2, AUC=0.76, P<0.01; Figure 3E and F). To further verify the expression of FOXK1 and FOXK2 in LARC patients, we analyzed the FOXK family members in the validation dataset as shown in Figure 3C, D, G, and H. The results indicated that also in the validation set the expression of both FOXK1 and FOXK2 was higher in the non-pCR group compared with the pCR group (FOXK1, 9.93±0.24 vs. 8.67±0.65, P=0.03; FOXK2 5.96±0.42 vs. 3.27±0.60, P<0.01). For both FOXK1 and FOXK2 the predictive power for pCR was strong (FOXK1, AUC=0.67, P=0.04; FOXK2, AUC=0.79, P<0.01; Figure 3G and H)
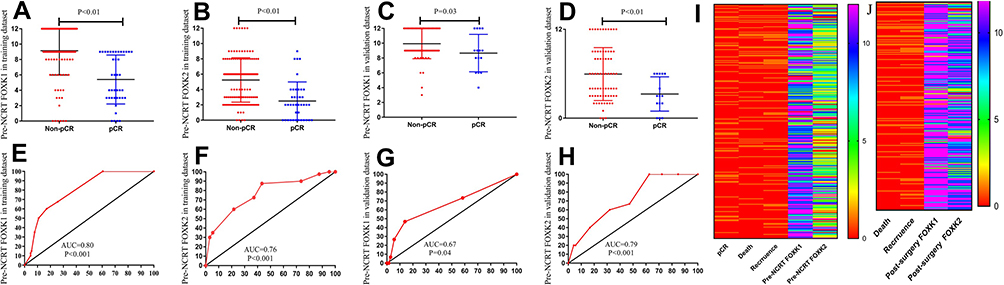 |
Figure 3 Association of pre-NCRT FOXK1, FOXK2 expression with pCR. (A–D) the expression of FOXK family were lower in the pCR group compared with the non-pCR group in the training dataset (FOXK1, 9.15±0.28 vs. 5.40±0.50, P<0.01; FOXK2. 5.25±0.39 vs. 2.50±0.39, P<0.01) and validation dataset (FOXK1, 9.93±0.24 vs. 8.67±0.65, P=0.03; FOXK2. 5.96±0.42 vs. 3.27±0.60, P<0.01). (E–H) ROC analysis demonstrated that both FOXK1 and FOXK2 have a powerful ability to predict pCR in the training dataset (FOXK1, AUC=0.80, P<0.01; FOXK2, AUC=0.76, P<0.01; (E and F) and the training dataset (FOXK1, AUC=0.67, P=0.04; FOXK2, AUC=0.79, P<0.01). (I) the immunohistochemical analysis score of the pre-NCRT FOXK1 and FOXK2 expression. (J) the immunohistochemical analysis score of the post-surgery FOXK1 and FOXK2 expression. |
The Expression of FOXK1 and FOXK2 in LARC Patients and Cut-off Values for Pre-NCRT FOXK1 and FOXK2 Expression
Biopsy tissues from 169 LARC patients in the training dataset and 87 patients in the validation dataset were used to analyze the expression levels of FOXK1 and FOXK2 prior to NCRT. Additionally, surgical tissues from 129 non-pCR LARC patients in the training dataset and 72 non-pCR patients in the validation dataset were used to analyze FOXK1 and FOXK2 expression post-surgery. The pre-NCRT/post-surgery FOXK1 and FOXK2 expression levels are shown in the Figure 3I and J. To select the optimal cut-off points for FOXK1 and FOXK2 expression, 169 LARC patients in the training dataset were used for X-tile analysis. As shown in Figure 4A and B, and Supplement Figure 1, X-tile plots were constructed and values of 12 and 6 were identified as cut-off values for FOXK1 and FOXK2, respectively. Based on these cut-off points, we divided the entire cohort into low and high subgroups to assess their effect on OS and DFS.
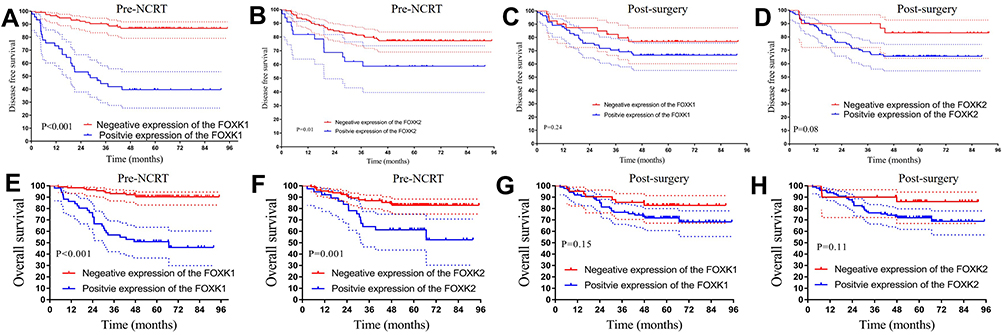 |
Figure 4 The Kaplan-Meier analysis of the FOXK family in the training dataset. (A–D) Kaplan-Meier analysis of both pre-NCRT and post-surgery FOXK1 and FOXK2 expression for DFS. (E–H) Kaplan-Meier analysis of both pre-NCRT and post-surgery FOXK1 and FOXK2 expression for OS. |
Association of Pre-NCRT FOXK1, FOXK2 and Post-Surgery FOXK1, FOXK2 Levels with Survival in the Training Dataset
To explore the relationship between FOXK family members and prognosis in the LARC patients following NCRT, we performed Kaplan-Meier analysis. The results demonstrated that higher expression of pre-NCRT FOXK family members was associated with worse prognosis in LARC patients following NCRT. The 3-year OS rates for the low pre-NCRT FOXK1 and FOXK2 group were 93.1% and 87.0%, respectively, which were significantly higher than in high pre-NCRT FOXK1 and FOXK2 group 56.9% and 64.2%, respectively, in the training dataset (all P<0.01, Figure 4E and F). Interestingly, lower pre-NCRT FOXK1 and FOXK2 expression levels were correlated with improved DFS, and the 3-year DFS rates for the low pre-NCRT FOXK1 and FOXK2 groups were 90.5% and 81.3%, respectively, which was significantly higher than in the high pre-NCRT FOXK1 and FOXK2 groups (44.3%, P<0.01 and 62.2%, P=0.01, respectively), as shown in Figure 4A and B. The effects of post-surgery FOXK1 and FOXK2 expression levels on DFS and OS were also analyzed in the present study. Although the 3-year DFS rates for the high post-surgery expression levels of FOXK1 and FOXK2 were 70.5% and 69.0%, respectively, these values were lower than in the low post-surgery FOXK1 and FOXK2 group (82.3%, P=0.24 and 90.0%, P=0.08, respectively, see Figure 4C and D). Moreover, we observed a similar result in the OS analysis in the post-surgery FOXK1 and FOXK2 expression analysis (P=0.15 and P=0.11, respectively, Figure 4 G and H).
Association of Pre-NCRT FOXK1, FOXK2 and Post-Surgery FOXK1, FOXK2 with Survival in the Validation Dataset
To validate whether high expression of the FOXK family members was associated with worse prognosis in the LARC patients following NCRT, we performed the Kaplan-Meier analysis in the validation dataset. The 3-year OS rates in the low pre-NCRT FOXK1 and FOXK2 group were 97.9% and 98.3%, respectively, which was significantly higher than in the high pre-NCRT FOXK1 and FOXK2 group in the training dataset (85.1%, P=0.02 and 80.1%, P<0.01; Figure 5E and F). Noteworthy, lower pre-NCRT FOXK1 and FOXK2 expression levels were correlated with improved DFS, and the 3-year DFS rates for the low pre-NCRT FOXK1 and FOXK2 groups were 94.2% and 89.8%, which was significantly higher than in high pre-NCRT FOXK1 and FOXK2 groups (67.6%, P<0.01 and 73.9%, P=0.02), as shown in Figure 5A and B. The results of the post-surgery FOXK1 and FOXK2 is shown in Figure 5C, D, G, and H. Although the 3-year DFS rates for the high expression of FOXK1 and FOXK2 post-surgery were 78.3% and 78.8%, lower than 94.1% and 100.0% in the low post-surgery FOXK1 and FOXK2 group (P=0.11, P=0.10). Moreover, we found a similar result in OS rates in the post-surgery FOXK1 and FOXK2 expression groups (P=0.66, P=0.97).
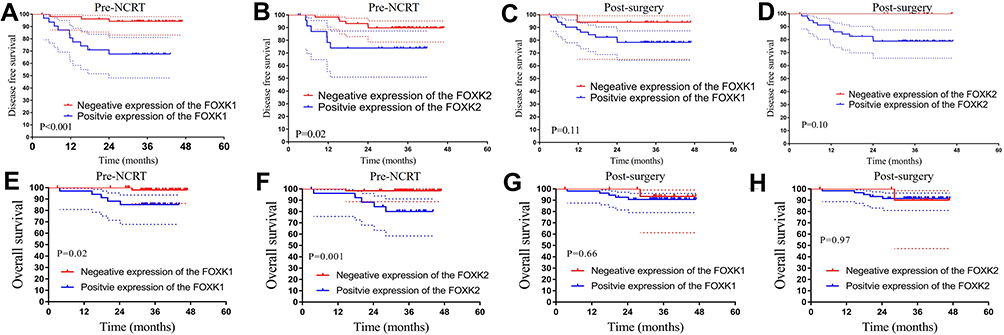 |
Figure 5 The Kaplan-Meier analysis of the FOXK family in the validation dataset. (A–D) Kaplan-Meier analysis of both pre-NCRT and post-surgery FOXK1 and FOXK2 expression for DFS. (E–H) Kaplan-Meier analysis of both pre-NCRT and post-surgery FOXK1 and FOXK2 expression for OS. |
Prognostic Value of Pre-NCRT FOXK Family and Construction of the Risk Score
To explore the prognostic impact of pre-NCRT expression levels of the FOXK family members on OS and DFS in LARC patients, we performed a Cox regression analysis. Univariate analysis revealed that tumor size (P<0.001), pathological T stage (P=0.001), pathological N stage (P<0.001), AJCC grade (P=0.005), FOXK2 expression (P=0.001), FOXK1 expression (P<0.001), perineural invasion (P=0.015), and tumor differentiation (P=0.013) were independently associated with DFS in LARC patients following NCRT and TME (Table 1). Multivariate Cox regression analysis demonstrated that pathological N stage (HR=1.810, 95% CI 1.159–2.827, P=0.009), FOXK1 expression (HR=5.831, 95% CI 2.925–11.625, P<0.001), and FOXK2 expression (HR=2.390, 95% CI 11.272–4.491, P=0.007) were independent predictors of DFS following NCRT, as shown in Table 1.
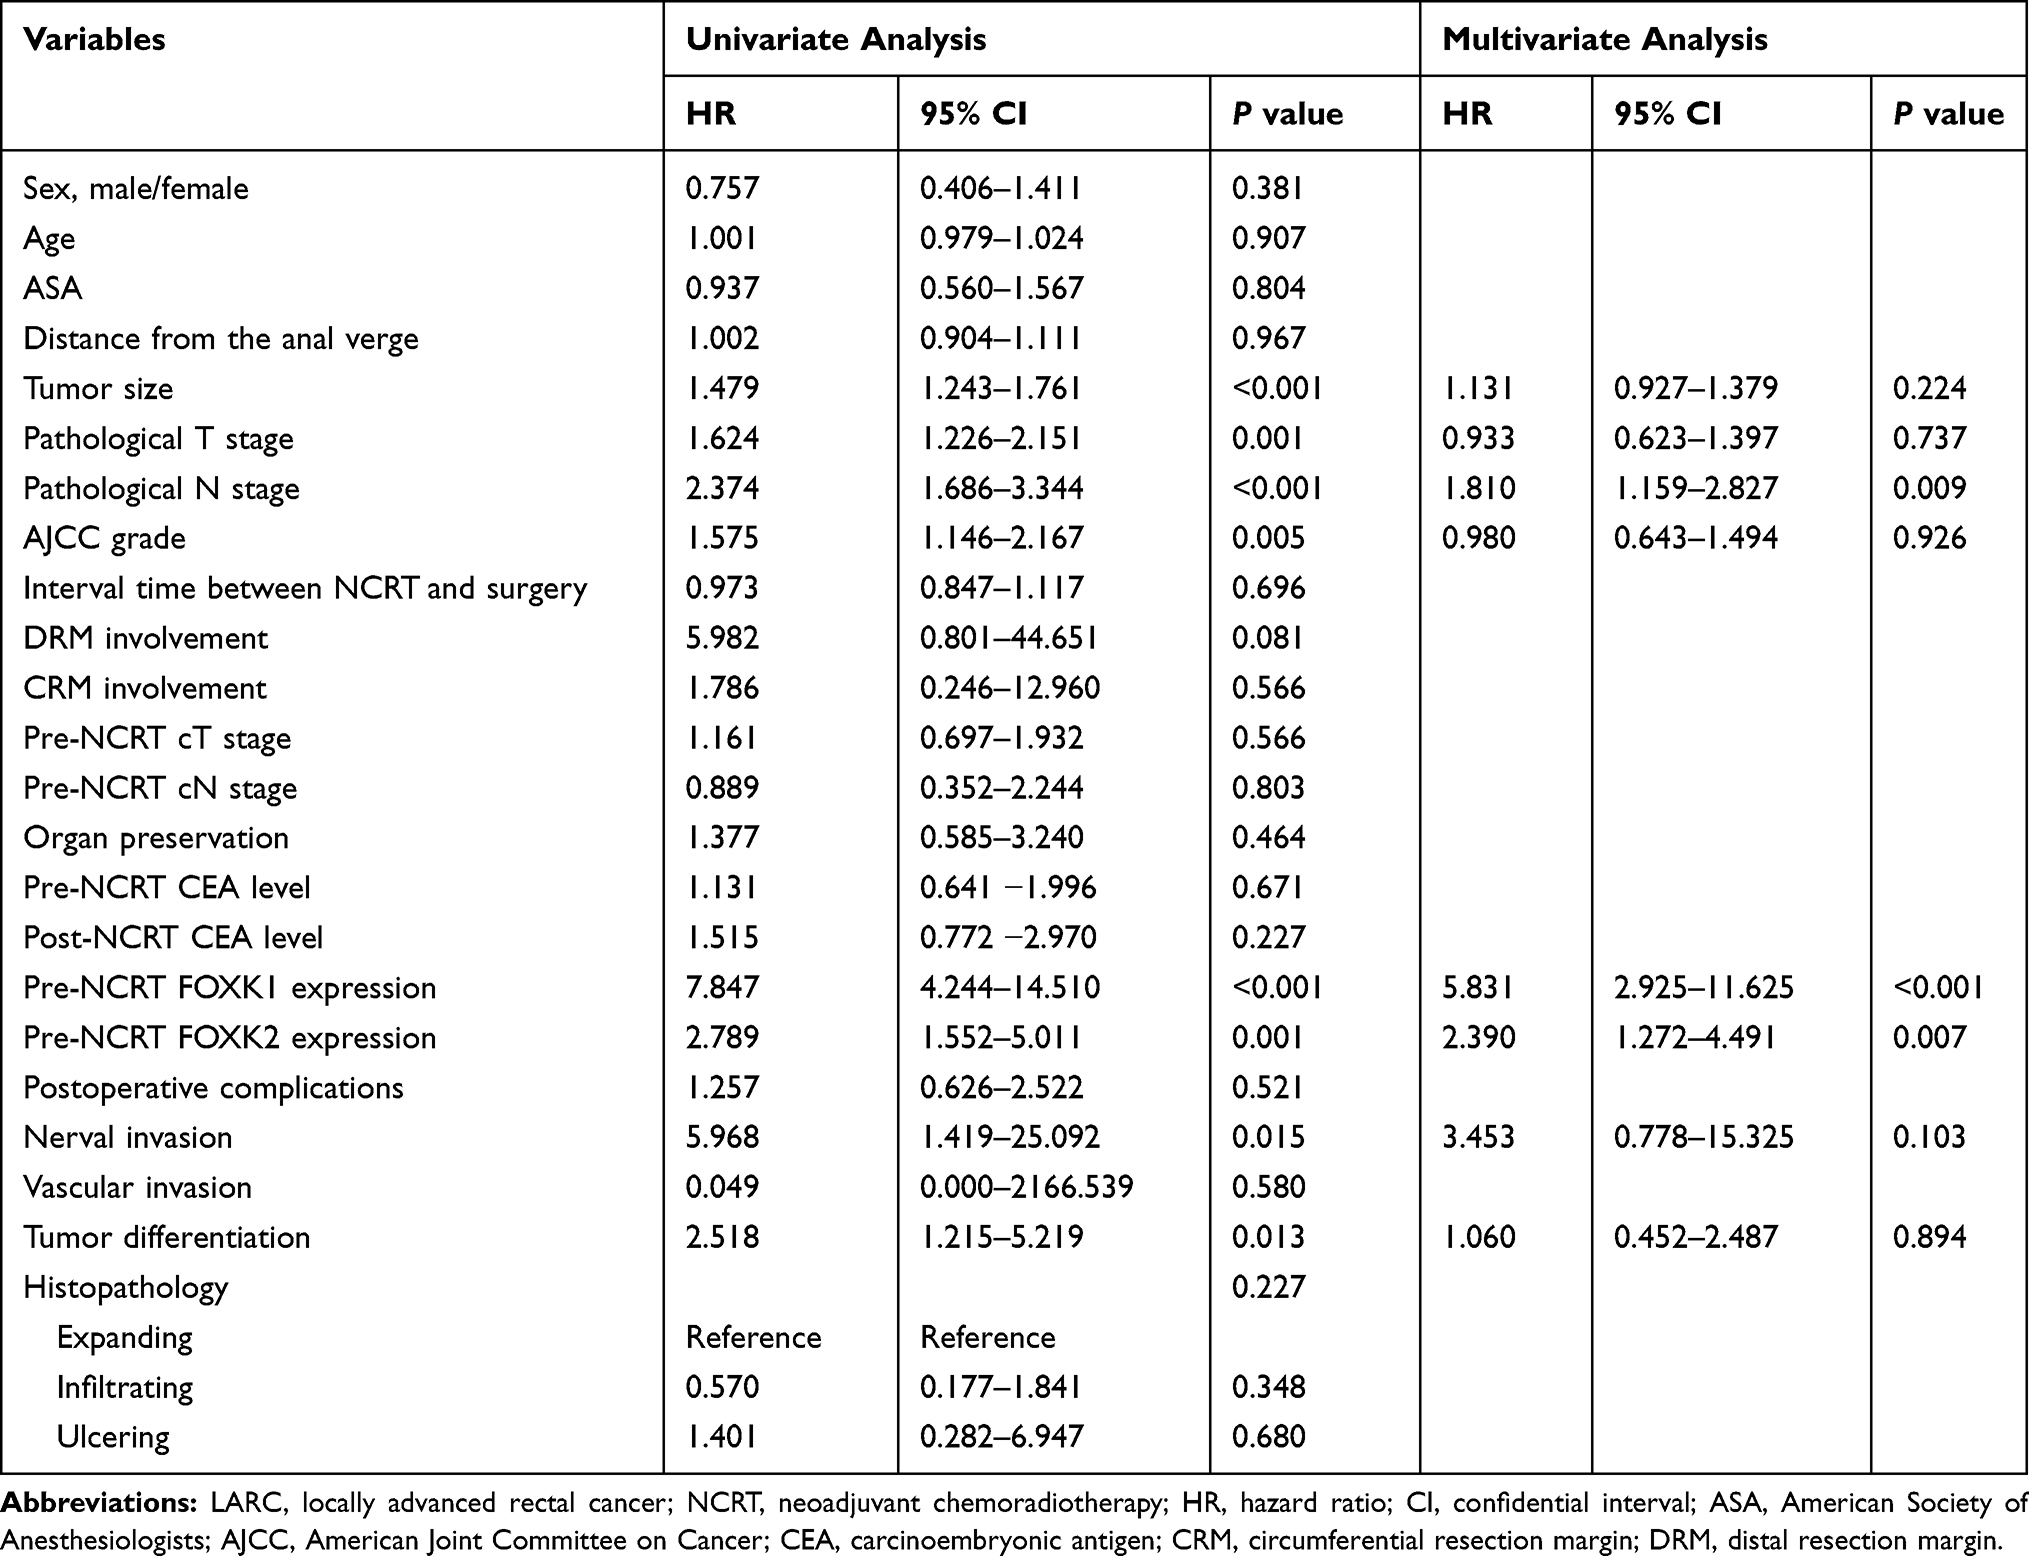 |
Table 1 Cox Regression Analysis of Predictive Factors for Disease-Free Survival in the Training Dataset Patients with LARC Following NCRT (n=169) |
Upon univariate analysis of predictors of OS, tumor size (P<0.001), pathological T stage (P=0.006), pathological N stage (P<0.001), pathological M stage (P=0.011), American Joint Committee on Cancer (AJCC) grade (P=0.010), FOXK2 expression (P=0.002), FOXK1 expression (P<0.001), perineural invasion (P=0.003), distal resection margin (DRM) involvement (P=0.037), and tumor differentiation (P=0.008) were independently associated with OS in LARC patients following NCRT and TME (Table 2). Results from the multivariate Cox regression model demonstrated that pathological N stage (HR=2.136, 95% CI 1.242–3.674, P=0.006), FOXK1 expression (HR=5.353, 95% CI 2.331–12.296, P<0.001), and FOXK2 expression (HR=4.943, 95% CI 1.062–23.011, P=0.042) were independent predictors of OS following NCRT, as shown in Table 2.
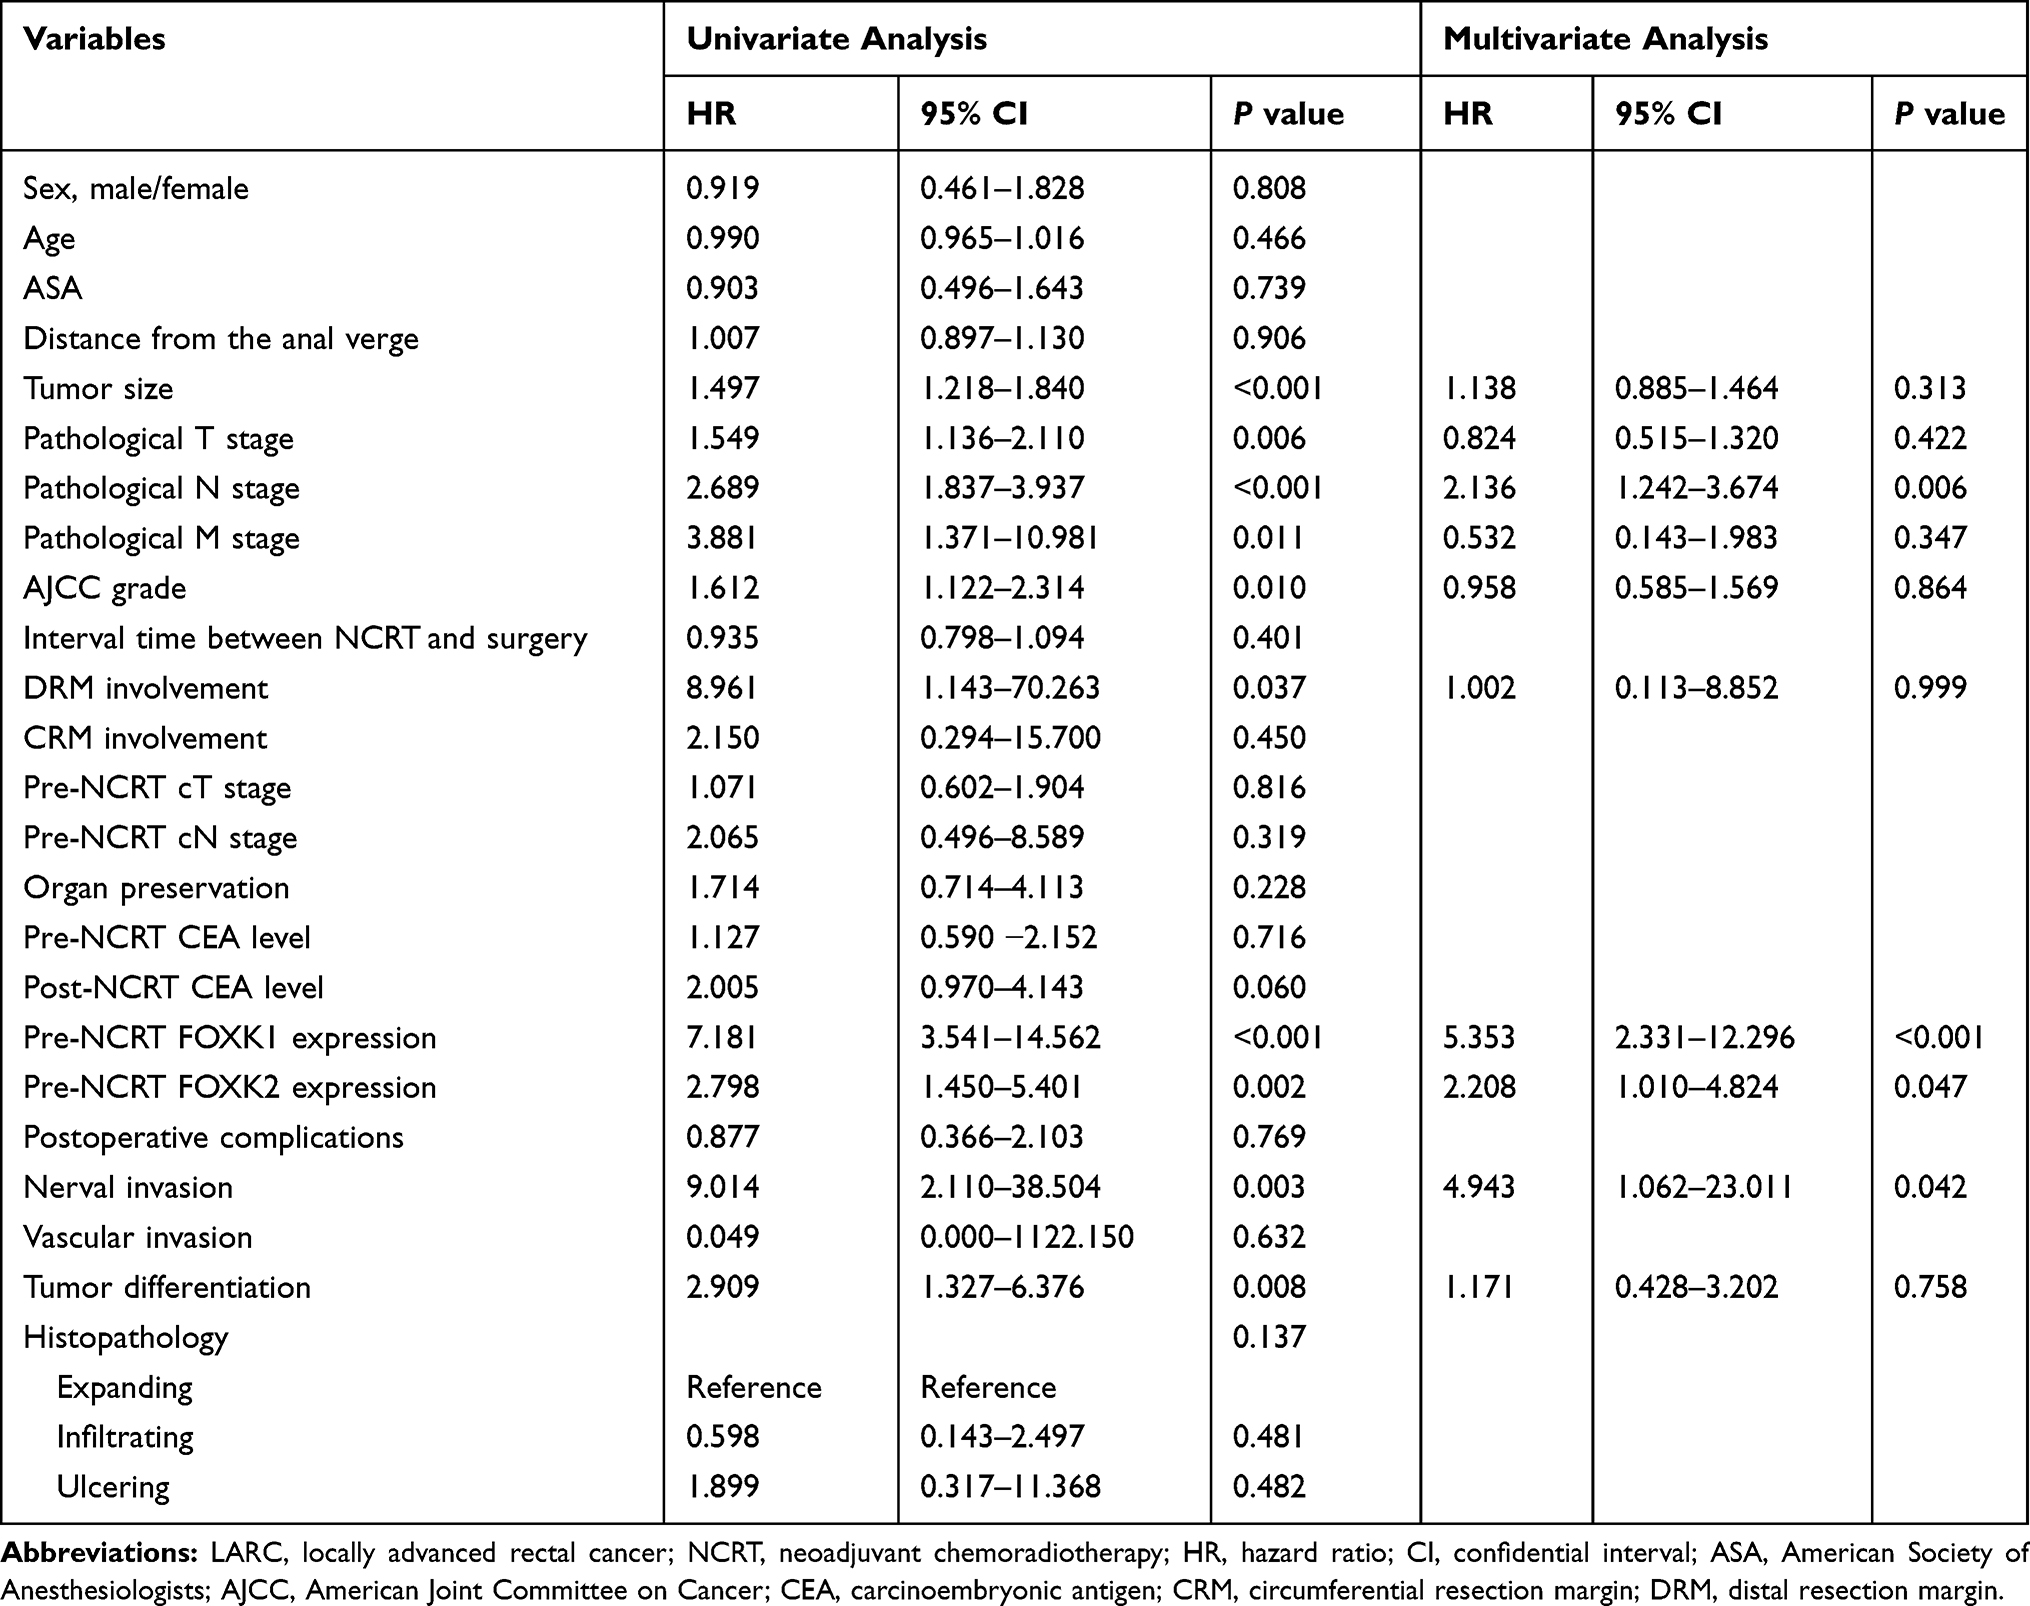 |
Table 2 Cox Regression Analysis of Predictive Factors for Overall Survival in the Training Dataset Patients with LARC Following NCRT (n=169) |
Based on the DFS Cox regression result, we selected the expression of pre-NCRT FOXK1 and pre-NCRT FOXK2, and pathology TNM stage to construct a risk factor model as follows: risk score =1.799×(pre-NCRT FOXK1 expression) + 0.891×(pre-NCRT FOXK2 expression) + 0.662×pathology N stage), as demonstrated in Figure 6A. Using this formula, each patient had a risk score that was associated with an individual prognosis. Using the cutoff value of 2.7 for risk scores generated from ROC curves, patients were divided into high-risk and low-risk groups. Moreover, based on the risk score, we confirmed the above result in the validation dataset as shown in Figure 6B.
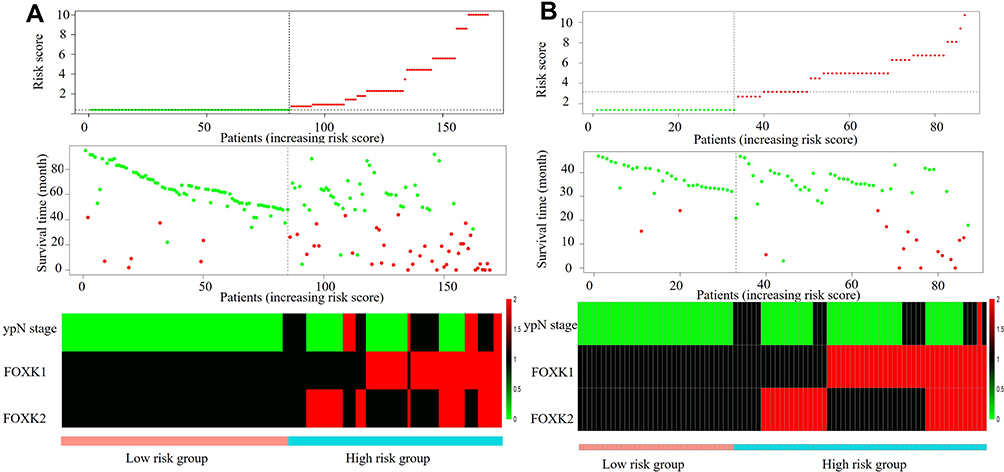 |
Figure 6 Construction and identification of the risk factor model in the training dataset and validation dataset. (A) The risk factor model of the risk factors in the training dataset. (Upper) risk score distribution of 169 LARC patients. (Middle) Status of every patient in the external dataset (N=169). (Lower) Expression heatmap of the risk factors corresponding to each sample above. Red: high expression; Blue: low expression. (B) The risk factor model of the risk factors in the validation dataset. (Upper) risk score distribution of 87 LARC patients. (Middle) Status of every patient in the external dataset (N=87). (Lower) Expression heatmap of the risk factors corresponding to each sample above. Red: high expression; Blue: low expression. |
Identification and Validation of the Risk Score in the Training Dataset and the Validation Dataset and Construction of a Decision Curve Analysis for pCR
To further explore the risk score efficiency and accuracy in the LARC patients, Kaplan-Meier and ROC analyses were performed to identify and validate the risk score in the training and validation datasets. The results demonstrated that risk scores were lower in the pCR group compared with the non-pCR group in both training and validation datasets (training dataset: 3.93±0.11 vs. 2.78±0.04, respectively, P<0.01; validation dataset: 4.00±0.14 vs. 3.17±0.21, respectively, P=0.01; Figure 7A and B). Moreover, ROC analysis was performed to analyze the predictive ability of the risk score. The results demonstrated that risk score had a powerful ability to predict pCR in both training and validation datasets (training dataset: AUC=0.78, P<0.01; validation dataset: AUC=0.71, P=0.01; Figure 7E and F).
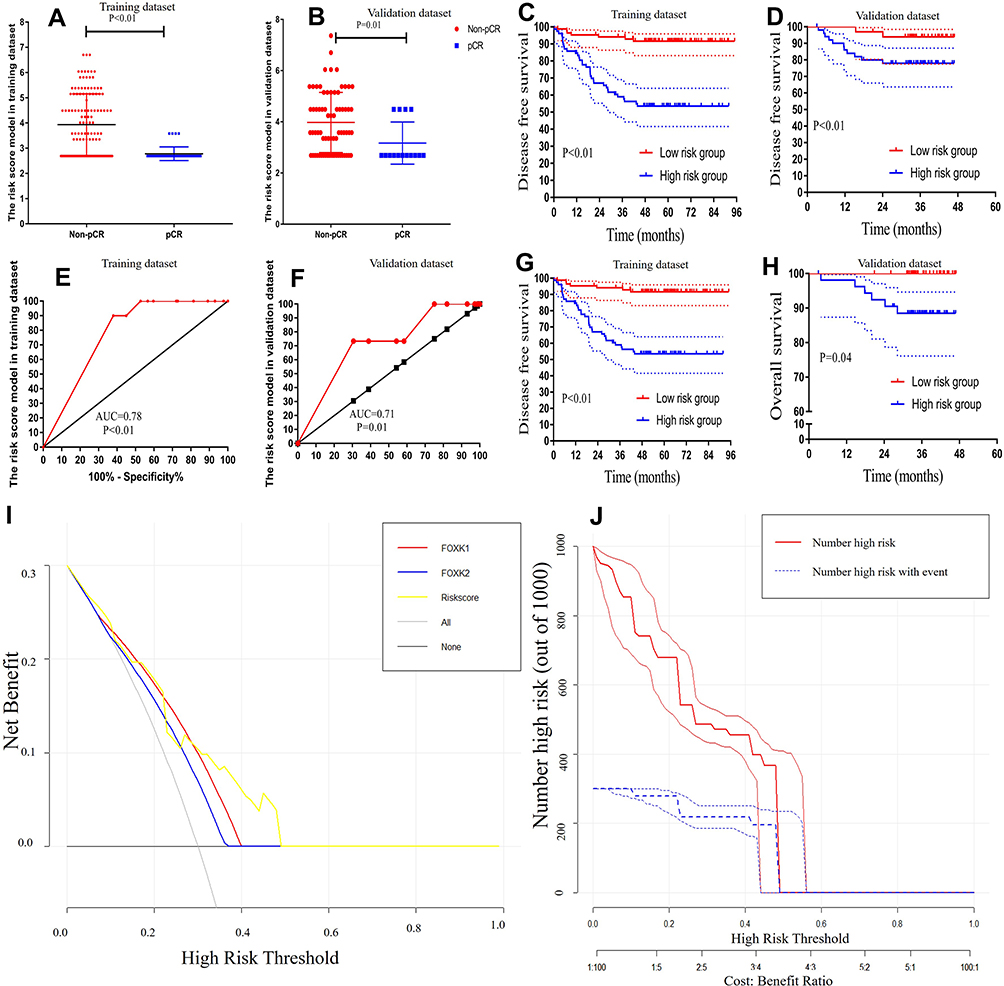 |
Figure 7 Validation the risk score model. (A and B) the expression of risk score were lower in the pCR group compared with the non-pCR group in the training dataset and validation dataset (training dataset, 4.33±0.10 vs. 2.47±0.03, P<0.01; validation dataset, 4.37±0.13 vs. 2.85±0.20, P<0.01) (C and D) Kaplan-Meier analysis of risk score models for Disease-free survival. (E and F) ROC analysis demonstrated that risk score has a powerful ability to predict pCR in the training dataset and the training dataset (training dataset, AUC=0.98, P<0.01; validation dataset, AUC=0.88, P<0.01). (G and H) Kaplan-Meier analysis of risk score model for overall survival. (I) Decision curve analysis for pCR (J) Clinical impact curve for the risk model. Of 1000 patients, the red solid line shows the total number of patients deemed to be at high risk for each risk threshold. The blue dashed line shows how many of those would be true positives. |
Kaplan-Meier analysis revealed that 3-year OS rates for the low-risk score group were 96.4% and 100.0%, respectively, which was significantly higher than those for the high-risk score group (67.2% and 88.5%, respectively) in both training and validation datasets (P<0.01 and P=0.04, respectively; Figure 7G, and H). Notably, a lower risk score was correlated with improved DFS, and the 3-year DFS rates for the low-risk score group were 94.1% and 93.8%, significantly higher than 59.0% and 77.9% in high-risk score group in both training and validation datasets (all P<0.01), as shown in Figure 7C and D.
Decision curve analysis (DCA) was used to evaluate the performance of the risk score in the pCR. As shown in Figure 7I, the risk score provided more benefit than either FOXK1 or FOXK2 in the pCR scheme. The clinical impact curve (Figure 7J) showed the prediction of risk stratification of 1000 patients using a resampling bootstrap method. “Number high risk” indicated the number of patients classified as positive (high risk) by the risk score according to various threshold probabilities. “Number high risk with the event” was the true positive patient number according to various threshold probabilities.
Association of Risk Score with Patient Characteristics in the Training Dataset and Validation Dataset
From the training dataset, 85 (50.3%) patients were classified into the low-risk score group and 84 (49.7%) patients in the high-risk score group. Meanwhile, from the validation dataset, 33 (37.9%) patients were classified into the low-risk score group and 54 (62.1%) patients in the high-risk score group. A higher pre-NCRT CEA level was found in the high-risk score group in the validation dataset (P<0.05). No statistical differences were observed between the two risk groups in terms of gender, age, American Society of Anesthesiologists (ASA) grade, interval time between NCRT and surgery, distance from the anal verge, clinical T stage, clinical N stage, and post-surgery CEA level in both training and validation datasets, as shown in Table 3.
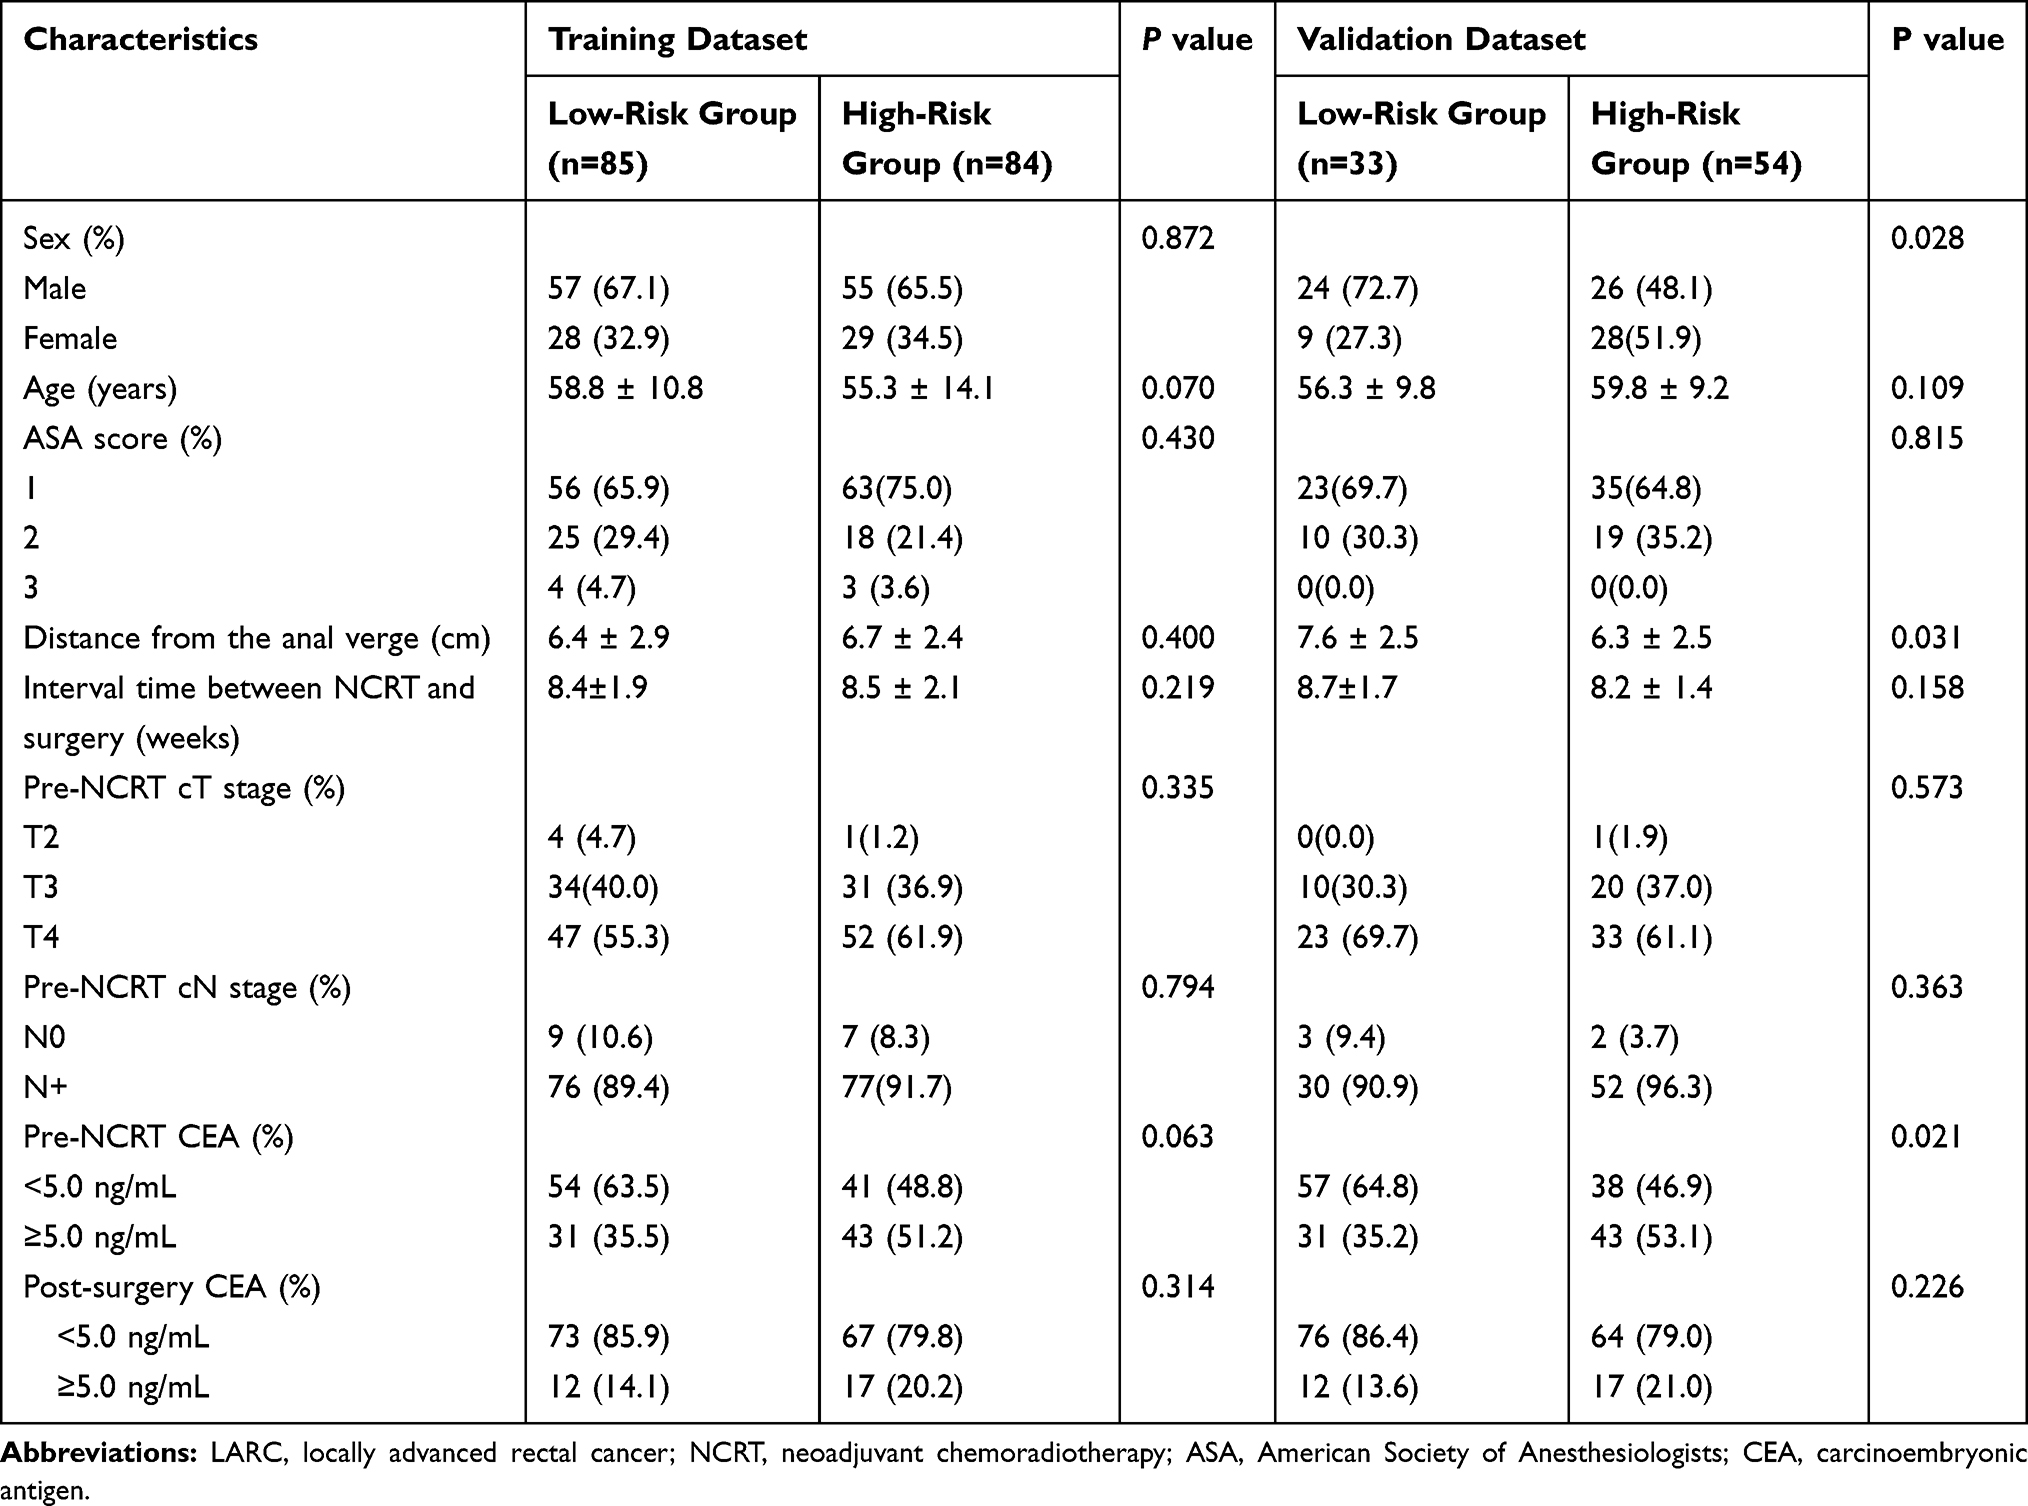 |
Table 3 Baseline Characteristics in Patients with LARC Following NCRT Stratified by Risk Group in Training and Validation Dataset |
Association of Risk Score with Perioperative Clinicopathological Parameters in the Training Dataset and Validation Dataset
No significant differences were observed between risk groups in terms of pathological type, postoperative complication, histopathology, circumferential resection margin (CRM) involvement, distal resection margin (DRM) involvement, perineural invasion, vascular invasion, and organ preservation procedure in both training and validation datasets (Table 4). Compared to the low-risk score group, the high-risk score group was associated with an increased metastasis to the lymph nodes (training dataset, 0 vs 2.4±5.2, P<0.01; validation dataset, 0 vs 0.7±1.1, P<0.01), advanced pathological T stage, pathological N stage (all in the training dataset, P<0.01; validation dataset, P<0.01), and poorer TRG grade (training dataset, P<0.01; validation dataset, P=0.021). In the training dataset, in the high-risk score group a larger tumor size was seen (2.5±1.3 vs 3.5±1.5, P<0.01), more lymph nodes were retrieved (10.4±5.2 vs 15.4±12.6, P<0.01), and poorer tumor differentiation was observed (P<0.01) compared with low-risk score group. However, there was no significant difference between the high-risk and low-risk score groups in the validation dataset in terms of tumor size, lymph nodes retrieved, and tumor differentiation (P=1.000, P=0.522, P=0.393)
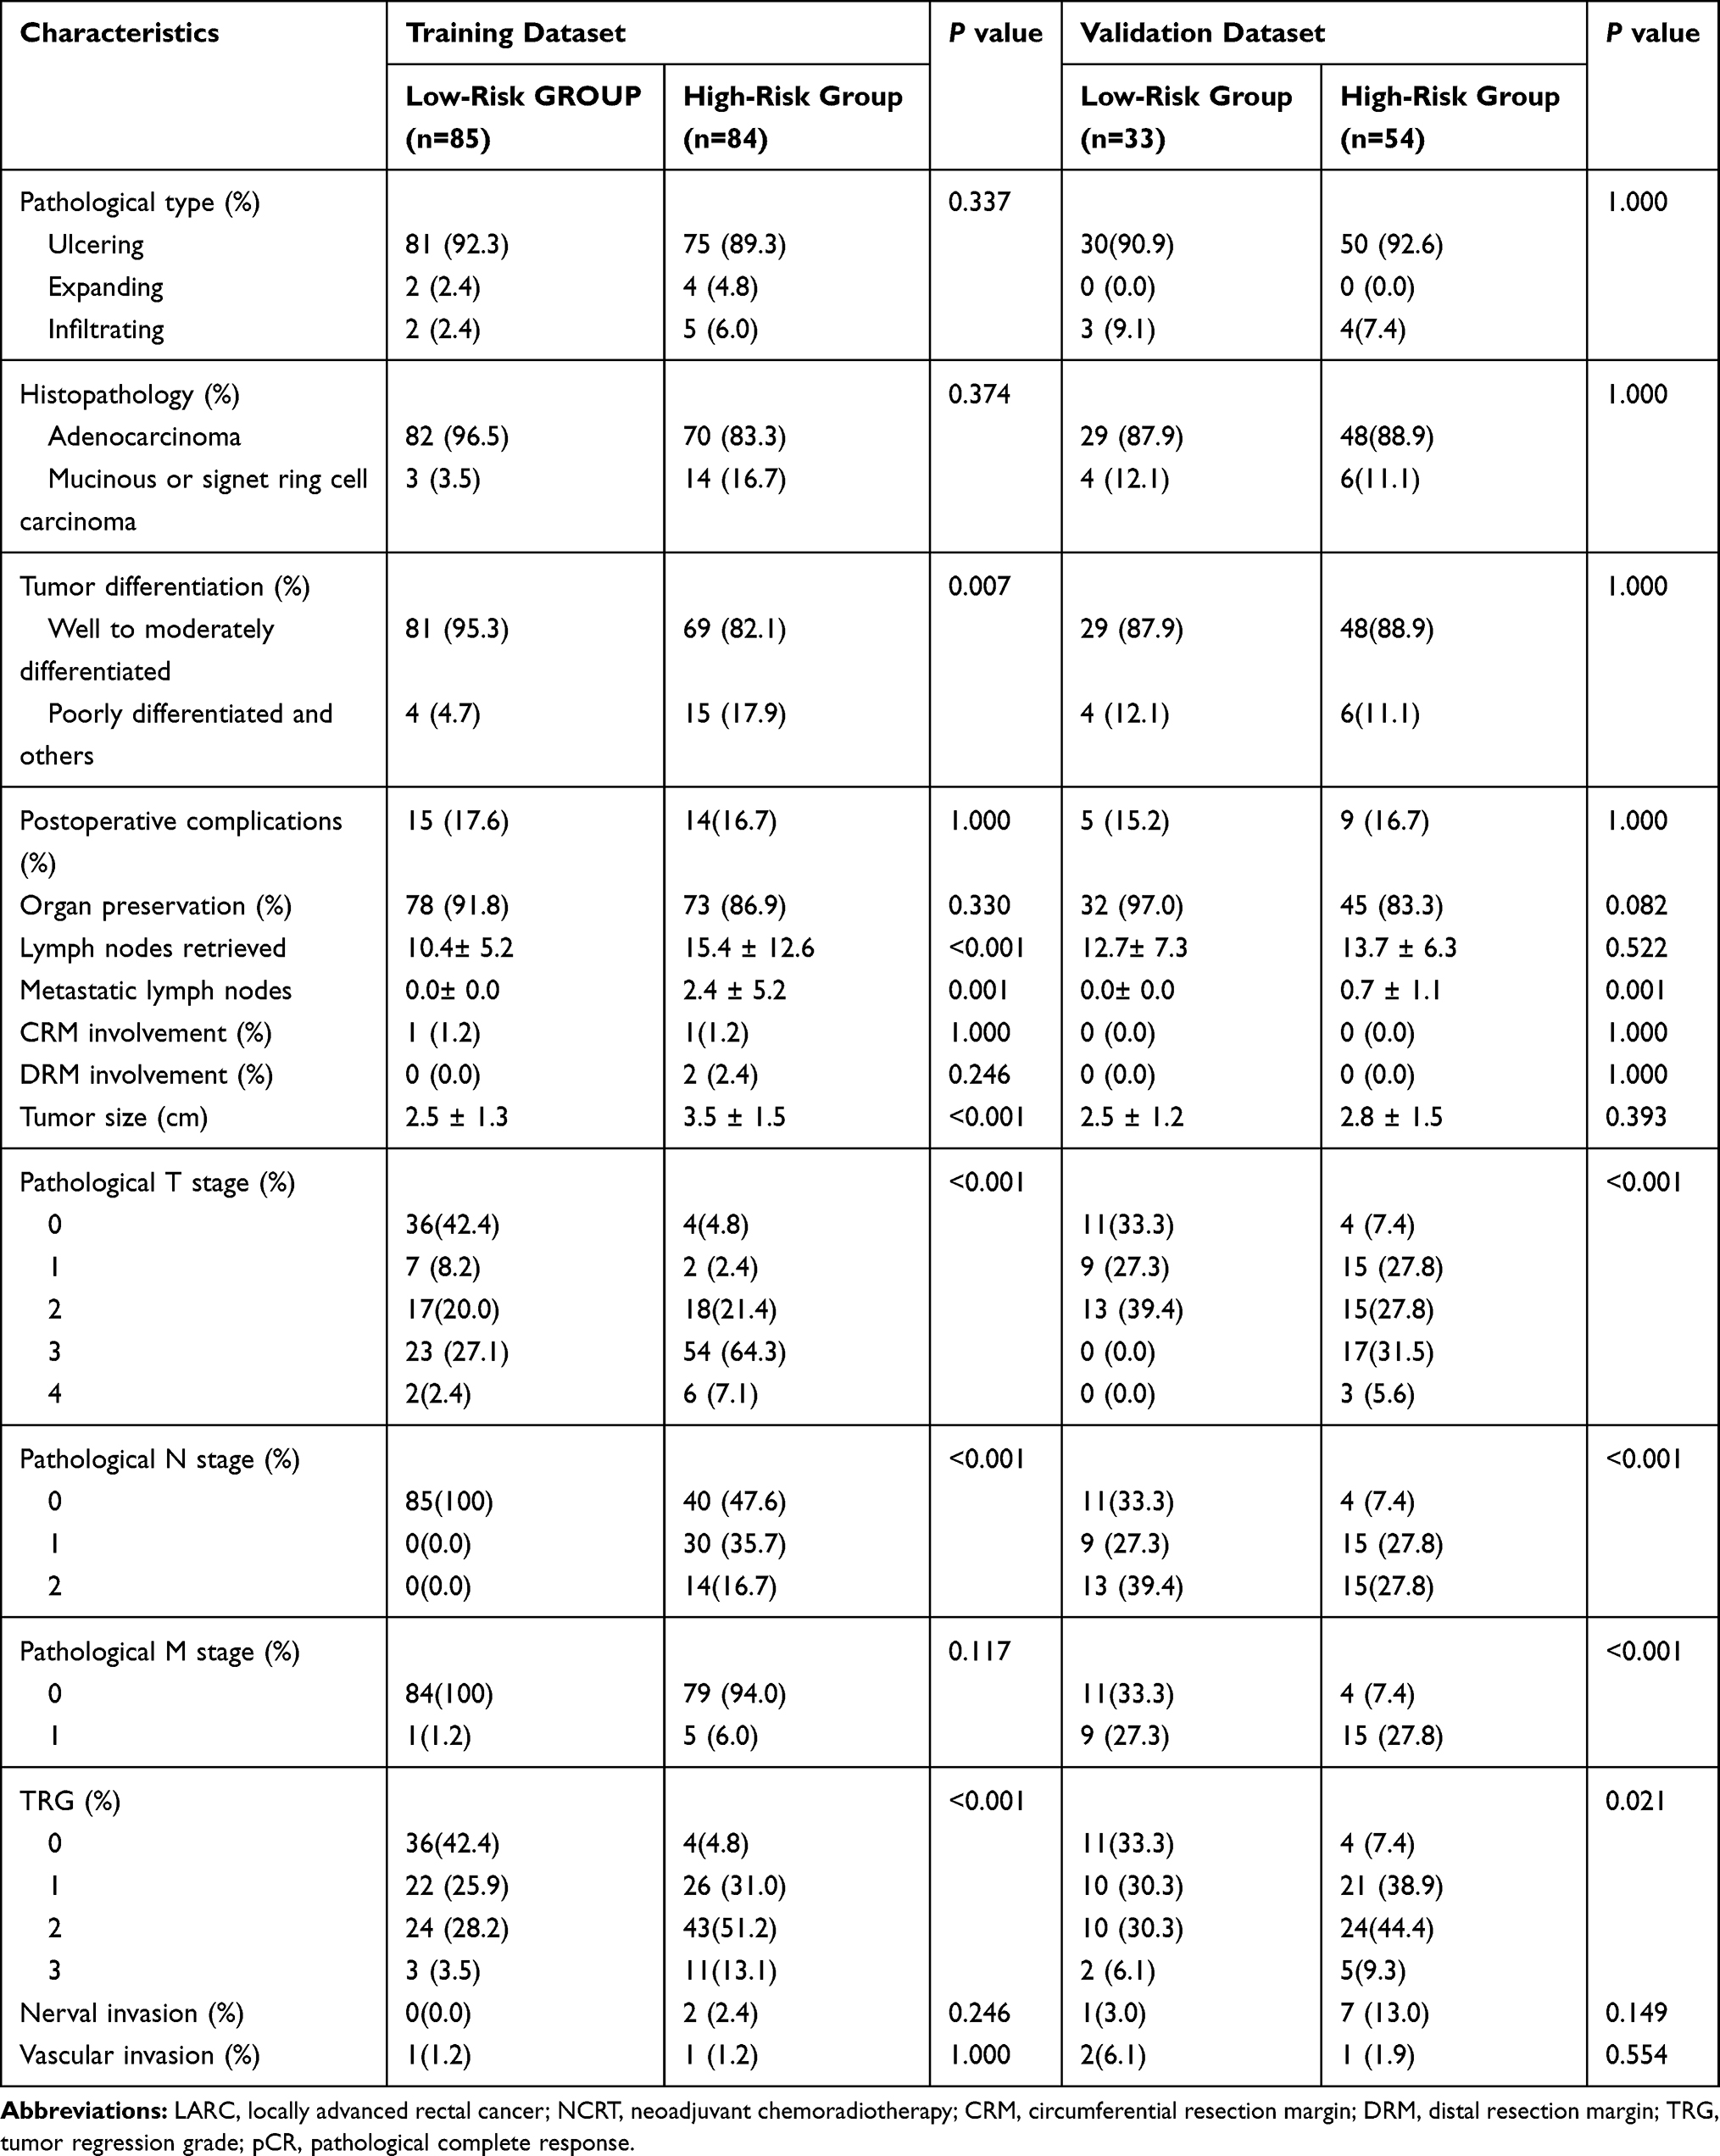 |
Table 4 Operative and Postoperative Outcomes in Patients with LARC Following NCRT Stratified by Risk Groups in the Training and Validation Dataset |
Discussion
Resistance to NCRT has been a major clinical problem for treatment efficacy in LARC patients. The FOXK family, an important subgroup of the FOX family, has attracted attention as a potential biomarker in several cancers. To the best of our knowledge, few studies have evaluated the relationship between the expression of the FOXK family members and the efficiency of NCRT in LARC patients. In the present study, we demonstrated that the pre-NCRT expression of FOXK family members could effectively predict NCRT response and prognosis of LARC patients in both the training and validation datasets. Based on the Cox regression analysis, a risk score model was built that served as a biomarker to predict NCRT response and prognosis of LARC patient survival.
The FOXK family comprises two members, FOXK1 and FOXK2, which have been implicated in several cancers. However, the exact role of the FOXK1 and FOXK2 in cancer is still controversial. In breast cancer, Sun et al20 reported that FOXK1 expression is lower in cancer tissue and cell lines; on the contrary, In contrast, Li et al19 showed that the expression of FOXK1 was higher in cancer tissue. Moreover, high FOXK1 expression has been reported in the tumor tissue compared with normal tissue in several cancers, including gastric, hepatoma, ovarian, esophagus, and colorectal cancers. Conflicting results on the expression levels of FOXK2 in cancer tissue have been obtained. Low expression of FOXK2 in cancerous tissue compared with normal tissue was identified in breast cancer, clear-cell renal, gastric cancer, glioma, non-small cell lung cancer.21–25 On the other hand, the expression of FOXK2 was high in colorectal cancer and hepatocellular cancer.26,27 In the present study, we analyzed the expression of FOXK1 and FOXK2 in the Oncomine database which contains multiple datasets. Our results indicated that the FOXK family members were overexpressed in most cancers and may act as oncogenes. Moreover, the expression of both FOXK1 and FOXK2 was higher in colorectal cancer tissue compared with normal tissue based on a meta-analysis using multiple datasets from different sources. Collectively, these data suggested that the expression of both FOXK1 and FOXK2 was higher in the colorectal cancer tissues compared with normal tissues and may act as the oncogene.
pCR is the important endpoint of response to NCRT in LARC patients following NCRT. LARC patients who developed pCR following NCRT have a better prognosis compared with non-pCR patients.37,38 Further exploration of the relationship between pre-NCRT FOXK family expression levels and pCR could illuminate the role of the FOXK family in LARC following NCRT. In the present study, the results indicated that pre-NCRT expression levels of FOXK1 and FOXK2 were lower in the pCR group, suggesting that FOXK1 and FOXK2 act as oncogenes in LARC patients. Moreover, the results of the ROC analysis indicated that the pre-NCRT FOXK1 and FOXK2 expression can act as efficient biomarkers to predict pCR in LARC patients following NCRT.
NCRT, the standard treatment for LARC patients combined with TME surgery, could effectively eradicate tumor cells. Meanwhile, the gene expression was deregulated in the residual tumor cells that survived NCRT. Thus, to explore the efficiency of the pre-NCRT/post-surgery FOXK family in predicting the LARC patients’ prognosis, we analyzed the FOXK1 and FOXK2 expression both before NCRT and after surgery. We did not detect the FOXK1 and FOXK2 expression in resected tumors from LARC patients with pCR, given that those patients had no residual tumor cells in the surgery tissues. We are not aware of any studies comparing FOXK1 and FOXK2 expression before and after NCRT in LARC. In the present study, the results demonstrated that the low pre-NCRT expression of FOXK1 and FOXK2 was associated with better OS and DFS compared with high pre-NCRT expression in both training and validation datasets, in contrast to the post-surgery FOXK1 and FOXK2 expression. The above results demonstrated that high pre-NCRT expression of FOXK1 and FOXK2 is associated with poor prognosis in LARC patients. A number of studies have previously indicated that the overexpression of FOXK1 and FOXK2 is associated with worse prognosis in several cancers.19,26,27,39,40 Meanwhile, the result that the post-surgery expression levels FOXK1 and FOXK2 could not effectively distinguish LARC patient prognosis, indicated that FOXK1 and FOXK2 expression had changed in tumor cells that survived NCRT. The altered expression of FOXK1 and FOXK2 in the post-surgery tumor tissues of LARC patients lacked prognostic power.
Previous studies have identified multi-gene signatures to predict patients who would benefit from chemotherapy and/or radiotherapy.41–43 Moreover, the risk factor model has been utilized for prognostication in several tumors, such as liver, lung, and colon cancers.44–46 Most previously reported risk score models were based on genetic expression, while few studies have constructed a risk factor model combining gene expression and clinical parameters. The patient’s prognosis is usually influenced by a variety of clinical factors. In the present study, we successfully constructed a risk factor model based on the results of multivariate Cox regression analysis, which represented the optimal factors for the LACR patient prognosis in the training dataset. The above risk score model has also been independently verified in the validation dataset. The results indicated that the risk score model could effectively predict the pCR rate and the prognosis in both training and validation datasets. Additionally, to further explore the improved efficiency in predicting pCR between risk score and FOXK family member expression in LARC patients, we performed DCA analysis, a useful tool that can assist the clinical decision making.47,48 In the present study, we found that the risk score was superior in predicting pCR than FOXK family member expression levels. Taken together, our results show that the risk factor model had a powerful ability to predict NCRT response in LARC patients in addition to being a prognostic marker for patient prognosis.
There are several limitations to the present study that warrant discussion. First, our study was subjected to potential selection bias due to the retrospective design. Second, there were no experimental data about the expression and mechanisms of the FOXK family; thus, in vivo/in vitro experimental validations are needed to illuminate the potential mechanisms for clinical applications. In spite of these limitations, we believe this study adds to our understanding of the impact of FOXK1 and FOXK2 expression on the oncological outcomes in patients with LARC following NCRT.
In conclusion, high pre-NCRT FOXK1 and FOXK2 expression rather than post-surgery FOXK1 and FOXK2 expression was associated with poorer DFS and OS in LARC patients. In addition, pre-NCRT FOXK1 and FOXK2 can act as effective biomarkers to predict NCRT response in LARC patients. Finally, a predictive risk factor score model was constructed to help in the prediction of survival outcomes. More intense adjuvant treatment could be considered for LARC patients with higher risk factor scores following NCRT.
Abbreviations
NCRT, neoadjuvant chemoradiotherapy; LARC, locally advanced rectal cancer; CRC, colorectal cancer; SII, systemic immune-inflammation index; ROC, receiver operating characteristic curve; AUC, area under the curves; TME, total mesorectal excision; CEA, carcinoembryonic antigen; MRI, magnetic resonance imaging; TRG, tumor regression grade; pCR, pathological complete response; ASA, American Society of Anesthesiology; CRM, circumferential resection margin; HR, hazard ratio; DFS, disease-free survival.
Data Sharing Statement
The data generated or analyzed during this study are available from the corresponding author Guoxian Guan upon reasonable request.
Ethics Approval and Consent to Participate
All subjects gave their informed consent for inclusion before they participated in the study. The study was conducted in accordance with the Declaration of Helsinki, and the protocol was approved by the Ethics Committee of Fujian Medical University Union Hospital.
Acknowledgment
The authors thank all the staff in Department of colorectal surgery, Fujian Medical University Union Hospital, Fuzhou, Fujian Province, People’s Republic of China.
Author Contributions
YYZ and GXG participated in all experimental work and drafted the paper. XL, JHC and MFX collected the data. KC, JFZ and YFY analyzed the data. All the authors have read and approved the final manuscript. All authors contributed toward data analysis, drafting and revising the paper and agree to be accountable for all aspects of the work.
Disclosure
The authors declare that they have no conflicts of interest for this work.
References
1. Shimeld SM, Degnan B, Luke GN. Evolutionary genomics of the Fox genes: origin of gene families and the ancestry of gene clusters. Genomics. 2010;95(5):256–260. doi:10.1016/j.ygeno.2009.08.002
2. Lam EW, Brosens JJ, Gomes AR, Koo CY. Forkhead box proteins: tuning forks for transcriptional harmony. Nat Rev Cancer. 2013;13(7):482–495.
3. Wang F, Marshall CB, Yamamoto K, et al. Biochemical and structural characterization of an intramolecular interaction in FOXO3a and its binding with p53. J Mol Biol. 2008;384(3):590–603. doi:10.1016/j.jmb.2008.09.025
4. van der Heide LP, Wijchers PJEC, von OL, Burbach JP, Hoekman MFM, Smidt MP. FoxK2 is required for cellular proliferation and survival. J Cell Physiol. 2015;230(5):1013–1023. doi:10.1002/jcp.24828
5. Bowman CJ, Ayer DE, Dynlacht BD. Foxk proteins repress the initiation of starvation-induced atrophy and autophagy programs. Nat Cell Biol. 2014;16(12):1202–1214. doi:10.1038/ncb3062
6. Wu Y, Xie R, Liu X, et al. Knockdown of FOXK1 alone or in combination with apoptosis-inducing 5-FU inhibits cell growth in colorectal cancer. Oncol Rep. 2016;36(4):2151–2159. doi:10.3892/or.2016.5041
7. Meeson AP, Shi X, Alexander MS, et al. Sox15 and Fhl3 transcriptionally coactivate Foxk1 and regulate myogenic progenitor cells. EMBO J. 2007;26(7):1902–1912. doi:10.1038/sj.emboj.7601635
8. Chen X, Müller GA, Quaas M, et al. The forkhead transcription factor FOXM1 controls cell cycle-dependent gene expression through an atypical chromatin binding mechanism. Mol Cell Biol. 2013;33(2):227–236. doi:10.1128/MCB.00881-12
9. Lin F, Fu YH, Han J, et al. Changes in the expression of Fox O1 and death ligand genes during follicular atresia in porcine ovary. Genet Mol Res. 2014;13(3):6638–6645. doi:10.4238/2014.August.28.8
10. Everson JL, Fink DM, Yoon JW, et al. Sonic hedgehog regulation of Foxf2 promotes cranial neural crest mesenchyme proliferation and is disrupted in cleft lip morphogenesis. Development. 2017;144(11):2082–2091. doi:10.1242/dev.149930
11. Milan G, Romanello V, Pescatore F, et al. Regulation of autophagy and the ubiquitin-proteasome system by the FoxO transcriptional network during muscle atrophy. Nat Commun. 2015;6:6670. doi:10.1038/ncomms7670
12. Rodríguez-Colman MJ, Sorolla MA, Vall-Llaura N, Tamarit J, Ros J, Cabiscol E. The FOX transcription factor Hcm1 regulates oxidative metabolism in response to early nutrient limitation in yeast. Role of Snf1 and Tor1/Sch9 kinases. Biochim Biophys Acta. 2013;1833(8):2004–2015. doi:10.1016/j.bbamcr.2013.02.015
13. Zhu H. Forkhead box transcription factors in embryonic heart development and congenital heart disease. Life Sci. 2016;144:194–201. doi:10.1016/j.lfs.2015.12.001
14. Dong L, Hong H, Chen X, Huang Z, Wu W, Wu F. LINC02163 regulates growth and epithelial-to-mesenchymal transition phenotype via miR-593-3p/FOXK1 axis in gastric cancer cells. Artif Cells Nanomed Biotechnol. 2018;46(sup2):607–615. doi:10.1080/21691401.2018.1464462
15. Ma X, Yang X, Bao W, et al. Circular RNA circMAN2B2 facilitates lung cancer cell proliferation and invasion via miR-1275/FOXK1 axis. Biochem Biophys Res Commun. 2018;498(4):1009–1015. doi:10.1016/j.bbrc.2018.03.105
16. Chen D, Wang K, Li X, et al. FOXK1 plays an oncogenic role in the development of esophageal cancer. Biochem Biophys Res Commun. 2017;494(1–2):88–94. doi:10.1016/j.bbrc.2017.10.080
17. Peng Y, Zhang P, Huang X, et al. Direct regulation of FOXK1 by C-jun promotes proliferation, invasion and metastasis in gastric cancer cells. Cell Death Dis. 2016;7(11):e2480. doi:10.1038/cddis.2016.225
18. Huang X, Xiang L, Li Y, et al. Snail/FOXK1/Cyr61 signaling axis regulates the epithelial-mesenchymal transition and metastasis in colorectal cancer. Cell Physiol Biochem. 2018;47(2):590–603. doi:10.1159/000490015
19. Li ZQ, Qu M, Wan HX, Wang H, Deng Q, Zhang Y. FOXK1 promotes malignant progression of breast cancer by activating PI3K/AKT/mTOR signaling pathway. Eur Rev Med Pharmacol Sci. 2019;23(22):9978–9987. doi:10.26355/eurrev_201911_19564
20. Sun T, Wang H, Li Q, Qian Z, Shen C. Forkhead box protein k1 recruits TET1 to act as a tumor suppressor and is associated with MRI detection. Jpn J Clin Oncol. 2016;46(3):209–221. doi:10.1093/jjco/hyv185
21. de Moraes GN, Khongkow P, Gong C, et al. Forkhead box K2 modulates epirubicin and paclitaxel sensitivity through FOXO3a in breast cancer. Oncogenesis. 2015;4:e167. doi:10.1038/oncsis.2015.26
22. Liu X, Wei X, Niu W, Wang D, Wang B, Zhuang H. Downregulation of FOXK2 is associated with poor prognosis in patients with gastric cancer. Mol Med Rep. 2018;18(5):4356–4364. doi:10.3892/mmr.2018.9466
23. Zhang F, Ma X, Li H, et al. FOXK2 suppresses the malignant phenotype and induces apoptosis through inhibition of EGFR in clear-cell renal cell carcinoma. Int J Cancer. 2018;142(12):2543–2557. doi:10.1002/ijc.31278
24. Wang B, Zhang X, Wang W, et al. Forkhead box K2 inhibits the proliferation, migration, and invasion of human glioma cells and predicts a favorable prognosis. Onco Targets Ther. 2018;11:1067–1075. doi:10.2147/OTT.S157126
25. Chen S, Jiang S, Hu F, Xu Y, Wang T, Mei Q. Foxk2 inhibits non-small cell lung cancer epithelial-mesenchymal transition and proliferation through the repression of different key target genes. Oncol Rep. 2017;37(4):2335–2347. doi:10.3892/or.2017.5461
26. Qian Y, Xia S, Feng Z. Sox9 mediated transcriptional activation of FOXK2 is critical for colorectal cancer cells proliferation. Biochem Biophys Res Commun. 2017;483(1):475–481. doi:10.1016/j.bbrc.2016.12.119
27. Lin MF, Yang YF, Peng ZP, et al. FOXK2, regulted by miR-1271-5p, promotes cell growth and indicates unfavorable prognosis in hepatocellular carcinoma. Int J Biochem Cell Biol. 2017;88:155–161. doi:10.1016/j.biocel.2017.05.019
28. Roh MS, Colangelo LH, O’Connell MJ, et al. Preoperative multimodality therapy improves disease-free survival in patients with carcinoma of the rectum: NSABP R-03. J Clin Oncol. 2009;27(31):5124–5130. doi:10.1200/JCO.2009.22.0467
29. Sauer R, Liersch T, Merkel S, et al. Preoperative versus postoperative chemoradiotherapy for locally advanced rectal cancer: results of the German CAO/ARO/AIO-94 randomized Phase III trial after a median follow-up of 11 years. J Clin Oncol. 2012;30(16):1926–1933. doi:10.1200/JCO.2011.40.1836
30. van Gijn W, Marijnen CA, Nagtegaal ID, et al. Preoperative radiotherapy combined with total mesorectal excision for resectable rectal cancer: 12-year follow-up of the multicentre, randomised controlled TME trial. Lancet Oncol. 2011;12(6):575–582. doi:10.1016/S1470-2045(11)70097-3
31. Ha YJ, Tak KH, Kim CW, et al. PSMB8 as a candidate marker of responsiveness to preoperative radiation therapy in rectal cancer patients. Int J Radiat Oncol Biol Phys. 2017;98(5):1164–1173. doi:10.1016/j.ijrobp.2017.03.023
32. de Moraes GN, Ji Z, Fan LY, et al. SUMOylation modulates FOXK2-mediated paclitaxel sensitivity in breast cancer cells. Oncogenesis. 2018;7(3):29. doi:10.1038/s41389-018-0038-6
33. Benson AB, Venook AP, Al-Hawary MM, et al. Rectal cancer, version 2.2018, NCCN clinical practice guidelines in oncology. J Natl Compr Canc Netw. 2018;16(7):874–901. doi:10.6004/jnccn.2018.0061
34. Amin MB, Edge S, Greene F, et al. AJCC Cancer Staging Manual.
35. Zhang Y, Xu Z, Sun Y, Chi P, Lu X. Knockdown of KLK11 reverses oxaliplatin resistance by inhibiting proliferation and activating apoptosis via suppressing the PI3K/AKT signal pathway in colorectal cancer cell. Onco Targets Ther. 2018;11:809–821. doi:10.2147/OTT.S151867
36. Camp RL, Dolled-Filhart M, Rimm DL. X-tile: a new bio-informatics tool for biomarker assessment and outcome-based cut-point optimization. Clin Cancer Res. 2004;10(21):7252–7259. doi:10.1158/1078-0432.CCR-04-0713
37. Zhang Y, Sun Y, Xu Z, Chi P, Lu X. Is neoadjuvant chemoradiotherapy always necessary for mid/high local advanced rectal cancer: a comparative analysis after propensity score matching. Eur J Surg Oncol. 2017;43(8):1440–1446. doi:10.1016/j.ejso.2017.04.007
38. Wang XJ, Chi P, Lin HM, et al. A scoring system basing pathological parameters to predict regional lymph node metastasis after preoperative chemoradiotherapy for locally advanced rectal cancer: implication for local excision. Oncotarget. 2016;7(48):78487–78498. doi:10.18632/oncotarget.10965
39. Cao H, Chu X, Wang Z, et al. High FOXK1 expression correlates with poor outcomes in hepatocellular carcinoma and regulates stemness of hepatocellular carcinoma cells. Life Sci. 2019;228:128–134. doi:10.1016/j.lfs.2019.04.068
40. Zhang H, Wu X, Xiao Y, et al. Coexpression of FOXK1 and vimentin promotes EMT, migration, and invasion in gastric cancer cells. J Mol Med (Berl). 2019;97(2):163–176. doi:10.1007/s00109-018-1720-z
41. Shahid M, Cho KM, Nguyen MN, et al. Prognostic value and their clinical implication of 89-gene signature in glioma. Oncotarget. 2016;7(32):51237–51250. doi:10.18632/oncotarget.9983
42. Dayde D, Tanaka I, Jain R, Tai MC, Taguchi A. Predictive and prognostic molecular biomarkers for response to neoadjuvant chemoradiation in rectal cancer. Int J Mol Sci. 2017;18(3):573. doi:10.3390/ijms18030573
43. Anitei MG, Zeitoun G, Mlecnik B, et al. Prognostic and predictive values of the immunoscore in patients with rectal cancer. Clin Cancer Res. 2014;20(7):1891–1899. doi:10.1158/1078-0432.CCR-13-2830
44. Dai W, Feng Y, Mo S, et al. Transcriptome profiling reveals an integrated mRNA-lncRNA signature with predictive value of early relapse in colon cancer. Carcinogenesis. 2018;39(10):1235–1244. doi:10.1093/carcin/bgy087
45. Gu J, Zhang X, Miao R, et al. A three-long non-coding RNA-expression-based risk score system can better predict both overall and recurrence-free survival in patients with small hepatocellular carcinoma. Aging (Albany NY). 2018;10(7):1627–1639. doi:10.18632/aging.101497
46. Liao M, Liu Q, Li B, Liao W, Xie W, Zhang Y. A group of long noncoding RNAs identified by data mining can predict the prognosis of lung adenocarcinoma. Cancer Sci. 2018;109(12):4033–4044. doi:10.1111/cas.13822
47. Rousson V, Zumbrunn T. Decision curve analysis revisited: overall net benefit, relationships to ROC curve analysis, and application to case-control studies. BMC Med Inform Decis Mak. 2011;11:45. doi:10.1186/1472-6947-11-45
48. Vickers AJ, Elkin EB. Decision curve analysis: a novel method for evaluating prediction models. Med Decis Making. 2006;26(6):565–574. doi:10.1177/0272989X06295361
 © 2020 The Author(s). This work is published and licensed by Dove Medical Press Limited. The full terms of this license are available at https://www.dovepress.com/terms.php and incorporate the Creative Commons Attribution - Non Commercial (unported, v3.0) License.
By accessing the work you hereby accept the Terms. Non-commercial uses of the work are permitted without any further permission from Dove Medical Press Limited, provided the work is properly attributed. For permission for commercial use of this work, please see paragraphs 4.2 and 5 of our Terms.
© 2020 The Author(s). This work is published and licensed by Dove Medical Press Limited. The full terms of this license are available at https://www.dovepress.com/terms.php and incorporate the Creative Commons Attribution - Non Commercial (unported, v3.0) License.
By accessing the work you hereby accept the Terms. Non-commercial uses of the work are permitted without any further permission from Dove Medical Press Limited, provided the work is properly attributed. For permission for commercial use of this work, please see paragraphs 4.2 and 5 of our Terms.