")
Back to Journals » Clinical Interventions in Aging » Volume 9
Prognostic value of severity indicators of nursing-home-acquired pneumonia versus community-acquired pneumonia in elderly patients
Authors Ugajin M, Yamaki K, Hirasawa N, Kobayashi T, Yagi T
Received 3 December 2013
Accepted for publication 4 January 2014
Published 11 February 2014 Volume 2014:9 Pages 267—274
DOI https://doi.org/10.2147/CIA.S58682
Checked for plagiarism Yes
Review by Single anonymous peer review
Peer reviewer comments 3
Motoi Ugajin, Kenichi Yamaki, Natsuko Hirasawa, Takanori Kobayashi, Takeo Yagi
Department of Respiratory Medicine, Ichinomiya-Nishi Hospital, Ichinomiya City, Japan
Background: The credibility of prognostic indicators in nursing-home-acquired pneumonia (NHAP) is not clear. We previously reported a simple prognostic indicator in community-acquired pneumonia (CAP): blood urea nitrogen to serum albumin (B/A) ratio. This retrospective study investigated the prognostic value of severity indicators in NHAP versus CAP in elderly patients.
Methods: Patients aged ≥65 years and hospitalized because of NHAP or CAP within the previous 3 years were enrolled. Demographics, coexisting illnesses, laboratory and microbiological findings, and severity scores (confusion, urea, respiratory rate, blood pressure, and age ≥65 [CURB-65] scale; age, dehydration, respiratory failure, orientation disturbance, and pressure [A-DROP] scale; and pneumonia severity index [PSI]) were retrieved from medical records. The primary outcome was mortality within 28 days of admission.
Results: In total, 138 NHAP and 307 CAP patients were enrolled. Mortality was higher in NHAP (18.1%) than in CAP (4.6%) (P<0.001). Patients with NHAP were older and had lower functional status and a higher rate of do-not-resuscitate orders, heart failure, and cerebrovascular diseases. The NHAP patients more frequently had typical bacterial pathogens. Using the receiver-operating characteristics curve for predicting mortality, the area under the curve in NHAP was 0.70 for the A-DROP scale, 0.69 for the CURB-65 scale, 0.67 for the PSI class, and 0.65 for the B/A ratio. The area under the curve in CAP was 0.73 for the A-DROP scale, 0.76 for the CURB-65 scale, 0.81 for the PSI class, and 0.83 for the B/A ratio.
Conclusion: Patient mortality was greater in NHAP than in CAP. Patient characteristics, coexisting illnesses, and detected pathogens differed greatly between NHAP and CAP. The existing severity indicators had less prognostic value for NHAP than for CAP.
Keywords: albumin, blood urea nitrogen, community-acquired pneumonia, mortality, nursing-home-acquired pneumonia, severity score
Introduction
With the expansion of the aging population, the number of nursing home residents is increasing globally. In Japan, the number of nursing home residents increased from 300,000 residents in 1995 to 600,000 residents in 2006. Among nursing home residents, the most common cause of hospital admission is pneumonia.1,2 Therefore, nursing-home-acquired pneumonia (NHAP) is an important topic in public health.
NHAP is included under the concept of health-care-associated pneumonia (HCAP) that has been proposed by the American Thoracic Society (ATS)/Infectious Diseases Society of America (IDSA).3 However, it is controversial whether NHAP should be managed as HCAP because several former reports showed that the influence of drug-resistant pathogens was not different between NHAP and community-acquired pneumonia (CAP).4,5
Throughout the world, several severity indicators have been introduced for CAP. The ATS/IDSA recommends the pneumonia severity index (PSI);6 the British Thoracic Society recommends the confusion, urea, respiratory rate, blood pressure, and age ≥65 (CURB-65) scale;7 and the Japanese Respiratory Society recommends the age, dehydration, respiratory failure, orientation disturbance, and pressure (A-DROP) scale.8 Moreover, we previously reported that the ratio of blood urea nitrogen to serum albumin (B/A) is a simple severity indicator for CAP.9,10 However, the credibility of these severity indicators in NHAP has not been confirmed. In this retrospective study of an elderly population, we investigated the prognostic values of these severity indicators for NHAP versus CAP.
Materials and methods
Study population
Consecutive patients hospitalized for pneumonia from August 2010 through July 2013 in Ichinomiya-Nishi Hospital (a 400-bed teaching hospital; Ichinomiya City, Aichi, Japan) were enrolled in this study. Pneumonia was diagnosed in patients who presented with a new radiographic infiltrate, exhibited at least two compatible clinical symptoms (body temperature >38°C, productive cough, chest pain, shortness of breath, and crackles on auscultation), had not been exposed to intravenous antibiotics during the 14 days before enrollment, and had not been hospitalized in the last 90 days. The patients admitted from a nursing home were defined as having NHAP, and patients admitted from the community were defined as having CAP.
Patients were excluded if they were younger than 65 years, chronically immunosuppressed (chemotherapy, therapy with systemic corticosteroids or other immunosuppressive agents, or infection with human immunodeficiency virus), had advanced liver disease, or had received hemodialysis or had a serum creatinine level ≥1.5 mg/dL because of chronic kidney disease.
This study protocol was approved by the ethics committee of our hospital, called the Research Ethics Review Committee of Ichinomiya-Nishi Hospital (Study Number 25016).
Study design
The following variables were retrieved from the patients’ medical charts: demographic characteristics (age and sex); performance status; coexisting illnesses; clinical data at the time of admission (body temperature, respiratory rate, percutaneous oxygen saturation, blood pressure, cardiac frequency, and mental status); laboratory and radiographic findings on admission; the scores of PSI, CURB-65, and A-DROP scales on admission; typical bacterial pathogens; intravenous initial antibiotic regimens; do-not-resuscitate order; and the clinical outcome.
Patient performance status before admission was evaluated in accordance with the European Cooperative Oncology Group score.11 The grades are defined as follows: Grade 0, fully active and able to perform all pre-disease performance without restriction; Grade 1, restricted in performing physically strenuous activity but ambulatory and able to perform light or sedentary work; Grade 2, ambulatory and capable of all self-care but unable to perform any work activity, up and approximately more than 50% of working hours; Grade 3, capable of only limited self-care, confined to a bed or chair more than 50% of working hours; Grade 4, completely disabled, cannot perform any self-care, and totally confined to a bed or chair.
The A-DROP scale is a 5-point scoring system, similar to the CURB-65 scale, and includes confusion, blood urea nitrogen >20 mg/dL, percutaneous oxygen saturation <90%, systolic blood pressure <90 mmHg, and age ≥70 years for men or ≥75 years for women.
Detected typical bacterial pathogens were defined by the following criteria: for Streptococcus pneumoniae, 3+ growth of sputum culture or the presence of antigen in the urine; for Legionella pneumophila, the presence of the antigen in the urine; and for other bacteria, 3+ growth of sputum culture.
A patient was considered to have a do-not-resuscitate order in cases where such an order was mentioned in the medical charts. The clinical outcome was defined as death or survival of a patient within 28 days from his or her admission. The aim of this study was to evaluate the prognostic value of each potential severity indicator in accordance with the guideline of Standards for Reporting of Diagnostic Accuracy.12
Methods
Blood urea nitrogen was measured by the enzymatic method with urease and glutamate dehydrogenase (Shino-Test Corporation, Tokyo, Japan). The serum C-reactive protein (CRP) level was measured by the latex agglutination assay (Nittobo Medical, Tokyo, Japan). The serum albumin level was measured by the bromocresol green method (Shino-Test Corporation) from August 2010 through December 2011 and by the bromocresol purple method (Kainos Laboratories, Tokyo, Japan) from January 2012 through July 2013. The normal range of the serum albumin level was the same for both methods. Other biochemical markers were assayed by using standard methods. To detect the causative pathogens, routine sampling included sputum and urinary antigen tests for S. pneumoniae (Binax Inc., Portland, ME, USA) and L. pneumophila serogroup 1 (Binax Inc.).
Statistical analysis
The data are expressed as the number or as the median (25th–75th percentile range). Differences between the two groups were tested by using the nonparametric Mann–Whitney U-test for continuous variables and the Fisher’s exact test for categorical variables. Receiver-operating characteristic (ROC) curve analysis and area under the curve (AUC) measurements were performed to assess the diagnostic ability of each potential indicator for predicting mortality. A two-tailed probability value of <0.05 was considered significant.
Results
Patient population
During the study period, 535 patients were admitted because of pneumonia. Of these patients, 149 were defined as having NHAP and the remaining 386 were defined as having CAP.
Eleven of the NHAP patients were excluded because of being younger than 65 years (n=3) or because of having chronic kidney disease (n=7) or immunosuppression (n=1). Seventy-nine CAP patients were similarly excluded because of being younger than 65 years (n=44) or because of having chronic kidney disease (n=26), immunosuppression (n=6), or advanced liver disease (n=3). In this study, 138 NHAP patients and 307 CAP patients were ultimately enrolled (Figure 1).
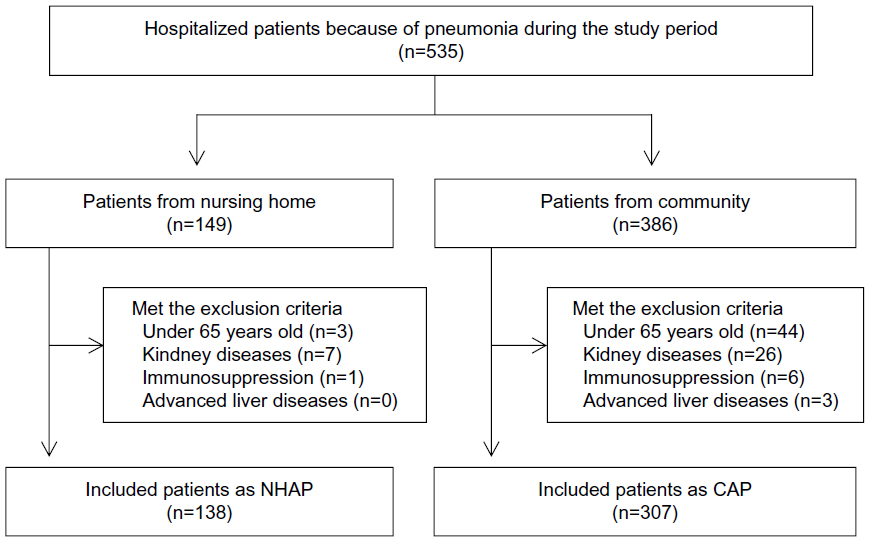 | Figure 1 Flow diagram of the recruitment of study population. |
Patient characteristics in NHAP and CAP
Table 1 lists the characteristics of the NHAP and CAP patients. Compared to CAP patients, NHAP patients were older (P<0.001) and had a higher 28-day mortality (18.1% for NHAP versus 4.6% for CAP) (P<0.001). The proportion of males was less among the NHAP patients (45.7%) than among the CAP patients (67.8%) (P<0.001). The performance status was worse in the NHAP patients than in the CAP patients (P<0.001). A do-not-resuscitate order was more frequent among the NHAP patients (49.3%) than among the CAP patients (14.3%) (P<0.001).
 | Table 1 Characteristics between NHAP and CAP patients |
Heart failure and cerebrovascular diseases were more frequently observed as a coexisting illness in NHAP patients than in CAP patients (P=0.035 and P<0.001, respectively). In contrast, chronic lung diseases were less frequently observed in NHAP patients than in CAP patients (P=0.012).
The laboratory findings on admission showed that the values of the hematocrit and the glucose, creatinine, and albumin levels were lower for the NHAP patients than for the CAP patients (P<0.001, P=0.024, P<0.001, and P<0.001, respectively). By contrast, the NHAP patients had a higher B/A ratio value, compared to the CAP patients (P<0.001).
The NHAP patients had higher severity scores on the PSI, the CURB-65 scale, and the A-DROP scale, compared to the CAP patients (P<0.001).
For the initial antibiotic regimens, clindamycin was more frequently administered to NHAP patients (12.3%) than to CAP patients (6.2%) (P=0.038). Fluoroquinolones were less frequently administered to NHAP patients (4.3%) than to CAP patients (12.4%) (P=0.009).
Detected pathogens in NHAP and CAP
Table 2 lists the detected typical bacterial pathogens in NHAP and CAP patients. The typical bacterial pathogens were more frequently detected in the NHAP patients (56.5%) than in the CAP patients (37.1%) (P<0.001). In particular, methicillin-resistant Staphylococcus aureus, Klebsiella pneumoniae, and Proteus mirabilis were more frequently detected in the NHAP patients than in the CAP patients (P=0.004, P=0.005, and P=0.009, respectively).
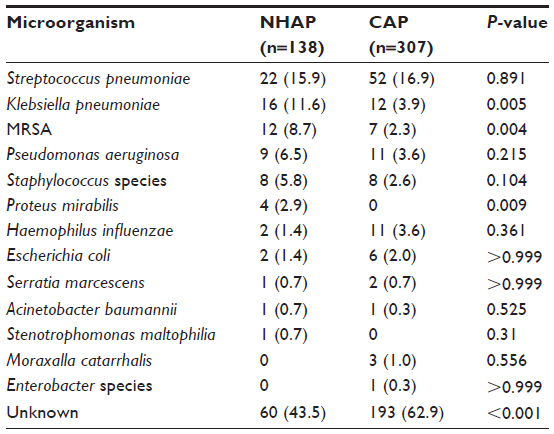 | Table 2 Detected typical bacterial pathogens |
Prognostic accuracy of severity indicators in NHAP and CAP
Figure 2 shows the ROC curves for predicting mortality within 28 days of admission. For the NHAP patients, the AUC was 0.70 for the A-DROP scale (95% confidence interval [CI] 0.61–0.80), 0.69 for the CURB-65 scale (95% CI 0.60–0.79), 0.67 for the PSI class (95% CI 0.57–0.77), 0.65 for the B/A ratio (95% CI 0.52–0.78), and 0.58 for the CRP level (95% CI 0.46–0.70) (Figure 2A).
 | Figure 2 Analysis of the receiver-operating characteristics curve for predicting mortality. |
For the CAP patients, the AUC was 0.73 for the A-DROP scale (95% CI 0.61–0.85), 0.76 for the CURB-65 scale (95% CI 0.66–0.86), 0.81 for the PSI class (95% CI 0.68–0.93), 0.83 for the B/A ratio (95% CI 0.72–0.95), and 0.64 for the CRP level (95% CI 0.47–0.80) (Figure 2B).
Table 3 presents the sensitivity, specificity, positive predictive value (PPV), and negative predictive value (NPV) of the severity scales for mortality in the NHAP patients. At the cutoff value of ≥10 mg/g, the B/A ratio had a sensitivity of 36.0%, specificity of 83.2%, PPV of 32.1%, and NPV of 85.5%. At the cutoff value of class ≥4, the PSI had a sensitivity of 100%, specificity of 3.5%, PPV of 18.7%, and NPV of 100%. At the cutoff value of ≥3 points, the CURB-65 scale had a sensitivity of 84.0%, specificity of 44.2%, PPV of 25.0%, and NPV of 92.6%.
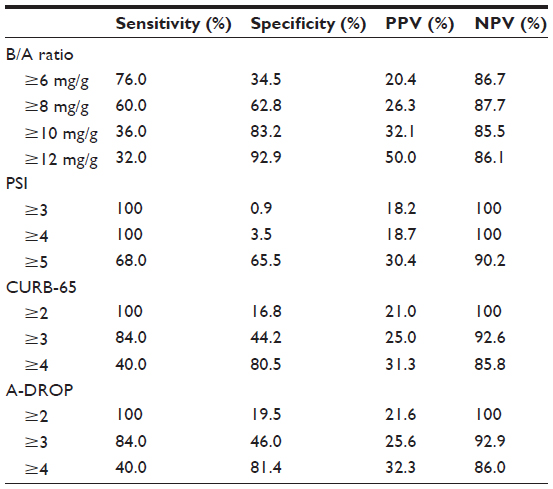 | Table 3 Prognostic validity of different cutoff values of each severity indicator in NHAP |
Table 4 presents the sensitivity, specificity, PPV, and NPV of the severity scales for mortality in the CAP patients. At the cutoff value of ≥10 mg/g, the B/A ratio had a sensitivity of 64.3%, specificity of 88.7%, PPV of 21.4%, and NPV of 98.1%. At the cutoff value of class ≥4, the PSI had a sensitivity of 85.7%, specificity of 47.4%, PPV of 7.2%, and NPV of 98.6%. At the cutoff value of ≥3 points, the CURB-65 scale had a sensitivity of 71.4%, specificity of 66.9%, PPV of 9.3%, and NPV of 98.0%.
 | Table 4 Prognostic validity of different cutoff values of each severity indicator in CAP |
Discussion
The important findings of the present study in the elderly population were as follows: 1) the 28-day mortality was significantly higher in the NHAP patients than in the CAP patients; 2) the patient characteristics and the detected pathogens differed greatly between the NHAP patients and the CAP patients; 3) the B/A ratio and PSI were good prognostic indicators in the CAP patients, but the existing severity indicators had a poor prognostic value in the NHAP patients.
It is an important clinical issue to extract pneumonia patients who are likely to have poor prognosis. In 1997, the PSI was introduced through a study that included more than 50,000 pneumonia patients.6 Consistent with the finding of the present study, several previous studies showed that the PSI was a reliable predictor of mortality in CAP patients.13–15 However, calculating the PSI may be complex and difficult to implement in routine clinical practice.16 Therefore, more simple severity indicators such as the CURB-65 scale and the A-DROP scale have been advocated and widely used.7,8 As a simple and objective severity indicator for CAP patients, we introduced the B/A ratio through our previous studies.9,10 The present study also showed that the B/A ratio was a good prognostic indicator for CAP patients through the ROC curve analysis.
However, the present study showed that the PSI, the CURB-65 scale, the A-DROP scale, and the B/A ratio had less prognostic values in NHAP patients than in CAP patients. Lee et al reported that the PSI had good predictive power for 30-day mortality in NHAP patients, but its AUC value was only 0.73.17 Porfyridis et al similarly reported that, among several pneumonia severity indicators, the CURB-65 scale had the highest accuracy for predicting the mortality of NHAP patients, but its AUC value was only 0.67.18 In short, these existing severity indicators have only an insufficient ability to predict the mortality of NHAP patients.
Nursing home residents often have an advanced age and low functional status.19 The present study similarly showed that the NHAP patients had a greater advanced age and lower functional status than CAP patients. The increased frequency of confusion in patients with acute illnesses has been reported to be strongly associated with an advanced age and low functional status.20,21 In regard to coexisting illnesses, cerebrovascular diseases and heart failure were more frequently observed in the NHAP patients than in the CAP patients. Moreover, malnutrition is frequently observed in nursing home residents because of their insufficient ability to eat.22,23 The present study also showed that the value of the serum albumin level was lower in NHAP patients than in CAP patients. These characteristics in NHAP patients raise the scores of the existing severity indicators. In fact, the present study showed that the NHAP patients had higher severity scores on the PSI, the CURB-65 scale, the A-DROP scale, and the B/A ratio compared to the CAP patients. Because most NHAP patients become categorized into the high risk class of the existing severity indicators, the discriminatory power of the indicators for predicting mortality may become lower.
It has been reported that most long-term nursing home residents changed their code status to do-not-resuscitate orders during their stay.24 A former study showed that approximately one-half of nursing home residents had a do-not-resuscitate order.25 Similarly, in the present study, approximately one-half of NHAP patients had do-not-resuscitate orders. The rate was significantly higher in NHAP patients than in CAP patients. The do-not-resuscitate order has been reported to be an independent risk factor in mortality of patients with pneumonia because the code status is strongly correlated with the regulation of life-saving medical acts under a critically ill condition.26 The difference in mortality between NHAP and CAP patients could be influenced by the difference of their code status.
The difference in causative pathogens between the NHAP and CAP patients is a controversial issue. Several recent studies showed no significant differences between the NHAP and CAP patients in etiology.4,5 However, the ATS/IDSA classifies NHAP under the concept of HCAP but not CAP because drug-resistant pathogens are frequently detected in patients with NHAP.27 Residency in a nursing home is reportedly an independent risk factor for infection by drug-resistant pathogens.28,29 In the present study, methicillin-resistant S. aureus and K. pneumoniae, which are potential multidrug-resistant pathogens,30,31 were more frequently detected in NHAP patients than in CAP patients. P. mirabilis, which was more frequently detected in NHAP patients in this study, is reportedly developing a metallo-beta-lactamase gene.32 The present study showed that NHAP was often caused by the potential multidrug-resistant pathogens. Although further investigations are necessary, the empirical therapy including these multidrug-resistant pathogens may improve the clinical outcomes of NHAP patients.
We must discuss several limitations of the present study. First, the study cohort involved a limited number of patients because it was a single-center study. A large-scale multicenter study is necessary to determine the differences between NHAP patients and CAP patients. Second, to assess the prognostic value of serum biomarkers, especially the B/A ratio, this study excluded patients who had chronic kidney diseases and advanced liver diseases. Therefore, it is uncertain whether the results of the present study are applicable to all NHAP and CAP patients. Third, the information concerning antibiotic administration based on the national guidelines was lacking. Fluoroquinolones were less frequently administered to NHAP patients than to CAP patients as the initial antibiotic regimen in the present study; a similar tendency has been observed in former prospective studies.5,33
In conclusion, NHAP should be managed as a category of pneumonia that is unlike CAP in terms of patient characteristics, code status, and causative pathogens. Clinicians should be careful in evaluating the severity of illness in patients with NHAP because existing severity indicators are not useful for predicting mortality in these patients, as compared to patients with CAP.
Disclosure
The authors report no conflicts of interest in this work.
References
Gruneir A, Bell CM, Bronskill SE, Schull M, Anderson GM, Rochon PA. Frequency and pattern of emergency department visits by long-term care residents – a population-based study. J Am Geriatr Soc. 2010;58(3):510–517. | |
Graverholt B, Riise T, Jamtvedt G, Ranhoff AH, Krüger K, Nortvedt MW. Acute hospital admissions among nursing home residents: a population-based observational study. BMC Health Serv Res. 2011;11:126. | |
American Thoracic Society; Infectious Diseases Society of America. Guidelines for the management of adults with hospital-acquired, ventilator-associated, and healthcare-associated pneumonia. Am J Respir Crit Care Med. 2005;171(4):388–416. | |
Ma HM, Wah JL, Woo J. Should nursing home-acquired pneumonia be treated as nosocomial pneumonia? J Am Med Dir Assoc. 2012;13(8):727–731. | |
Ewig S, Klapdor B, Pletz MW, et al; CAPNETZ study group. Nursing-home-acquired pneumonia in Germany: an 8-year prospective multicentre study. Thorax. 2012;67(2):132–138. | |
Fine MJ, Auble TE, Yealy DM, et al. A prediction rule to identify low-risk patients with community-acquired pneumonia. N Engl J Med. 1997;336(4):243–250. | |
Lim WS, van der Eerden MM, Laing R, et al. Defining community acquired pneumonia severity on presentation to hospital: an international derivation and validation study. Thorax. 2003;58(5):377–382. | |
Yanagihara K, Kohno S, Matsusima T. Japanese guidelines for the management of community-acquired pneumonia. Int J Antimicrob Agents. 2001;18 Suppl 1:S45–S48. | |
Ugajin M, Yamaki K, Iwamura N, Yagi T, Asano T. Blood urea nitrogen to serum albumin ratio independently predicts mortality and severity of community-acquired pneumonia. Int J Gen Med. 2012;5:583–589. | |
Ugajin M, Yamaki K, Hirasawa N, Yagi T. Predictive values of semi-quantitative procalcitonin test and common biomarkers for the clinical outcomes of community-acquired pneumonia. Respir Care. Epub October 29, 2013. | |
Oken MM, Creech RH, Tormey DC, et al. Toxicity and response criteria of the Eastern Cooperative Oncology Group. Am J Clin Oncol. 1982;5(6):649–655. | |
Bossuyt PM, Reitsma JB, Bruns DE, et al; Standards for Reporting of Diagnostic Accuracy. Towards complete and accurate reporting of studies of diagnostic accuracy: The STARD Initiative. Ann Intern Med. 2003;138(1):40–44. | |
van der Eerden MM, de Graaff CS, Bronsveld W, Jansen HM, Boersma WG. Prospective evaluation of pneumonia severity index in hospitalised patients with community-acquired pneumonia. Respir Med. 2004;98(9):872–878. | |
Spindler C, Ortqvist A. Prognostic score systems and community-acquired bacteraemic pneumococcal pneumonia. Eur Respir J. 2006;28(4):816–823. | |
Renaud B, Coma E, Hayon J, et al; PNEUMOCOM study investigators. Investigation of the ability of the Pneumonia Severity Index to accurately predict clinically relevant outcomes: a European study. Clin Microbiol Infect. 2007;13(9):923–931. | |
Singanayagam A, Chalmers JD, Hill AT. Severity assessment in community acquired pneumonia: a review. QJM. 2009;102(6):379–388. | |
Lee JC, Hwang HJ, Park YH, Joe JH, Chung JH, Kim SH. Comparison of severity predictive rules for hospitalised nursing home-acquired pneumonia in Korea: a retrospective observational study. Prim Care Respir J. 2013;22(2):149–154. | |
Porfyridis I, Georgiadis G, Vogazianos P, Mitis G, Georgiou A. CRP, PCT, CPIS and pneumonia severity scores in nursing home acquired pneumonia. Respir Care. Epub October 8, 2013. | |
Onder G, Carpenter I, Finne-Soveri H, et al; SHELTER project. Assessment of nursing home residents in Europe: the Services and Health for Elderly in Long TERm care (SHELTER) study. BMC Health Serv Res. 2012;12:5. | |
Johnson JC, Jayadevappa R, Baccash PD, Taylor L. Nonspecific presentation of pneumonia in hospitalized older people: age effect or dementia? J Am Geriatr Soc. 2000;48(10):1316–1320. | |
Voyer P, McCusker J, Cole MG, St-Jacques S, Khomenko L. Factors associated with delirium severity among older patients. J Clin Nurs. 2007;16(5):819–831. | |
Verbrugghe M, Beeckman D, Van Hecke A, et al. Malnutrition and associated factors in nursing home residents: a cross-sectional, multi-centre study. Clin Nutr. 2013;32(3):438–443. | |
Stange I, Poeschl K, Stehle P, et al. Screening for malnutrition in nursing home residents: comparison of different risk markers and their association to functional impairment. J Nutr Health Aging. 2013;17(4):357–363. | |
Mukamel DB, Ladd H, Temkin-Greener H. Stability of cardiopulmonary resuscitation and do-not-resuscitate orders among long-term nursing home residents. Med Care. 2013;51(8):666–672. | |
Messinger-Rapport BJ, Kamel HK. Predictors of do not resuscitate orders in the nursing home. J Am Med Dir Assoc. 2005;6(1):18–21. | |
Bardach N, Zhao S, Pantilat S, Jhonston SC. Adjustment for do-not-resuscitate orders reverses the apparent in-hospital mortality advantage for minorities. Am J Med. 2005;118(4):400–408. | |
Xie C, Taylor DM, Howden BP, Charles PG. Comparison of the bacterial isolates and antibiotic resistance patterns of elderly nursing home and general community patients. Intern Med J. 2012;42(7):e157–e164. | |
Shorr AF, Zilberberg MD, Micek ST, Kollef MH. Prediction of infection due to antibiotic-resistant bacteria by select risk factors for health care-associated pneumonia. Arch Intern Med. 2008;168(20):2205–2210. | |
Aliberti S, Di Pasquale M, Zanaboni AM, et al. Stratifying risk factors for multidrug-resistant pathogens in hospitalized patients coming from the community with pneumonia. Clin Infect Dis. 2012;54(4):470–478. | |
Bouza E, Cercenado E. Klebsiella and enterobacter: antibiotic resistance and treatment implications. Semin Respir Infect. 2002;17(3):215–230. | |
Sisto A, D’Ancona F, Meledandri M, et al; Micronet network participants. Carbapenem non-susceptible Klebsiella pneumoniae from Micronet network hospitals, Italy, 2009 to 2012. Euro Surveill. 2012;17(33):20247. | |
Tsakris A, Ikonomidis A, Poulou A, Spanakis N, Pournaras S, Markou F. Transmission in the community of clonal Proteus mirabilis carrying VIM-1 metallo-beta-lactamase. J Antimicrob Chemother. 2007;60(1):136–139. | |
Fukuyama H, Yamashiro S, Tamaki H, Kishaba T. A prospective comparison of nursing- and healthcare-associated pneumonia (NHCAP) with community-acquired pneumonia (CAP). J Infect Chemother. 2013;19(4):719–726. |
 © 2014 The Author(s). This work is published and licensed by Dove Medical Press Limited. The full terms of this license are available at https://www.dovepress.com/terms.php and incorporate the Creative Commons Attribution - Non Commercial (unported, v3.0) License.
By accessing the work you hereby accept the Terms. Non-commercial uses of the work are permitted without any further permission from Dove Medical Press Limited, provided the work is properly attributed. For permission for commercial use of this work, please see paragraphs 4.2 and 5 of our Terms.
© 2014 The Author(s). This work is published and licensed by Dove Medical Press Limited. The full terms of this license are available at https://www.dovepress.com/terms.php and incorporate the Creative Commons Attribution - Non Commercial (unported, v3.0) License.
By accessing the work you hereby accept the Terms. Non-commercial uses of the work are permitted without any further permission from Dove Medical Press Limited, provided the work is properly attributed. For permission for commercial use of this work, please see paragraphs 4.2 and 5 of our Terms.