")
Back to Journals » Cancer Management and Research » Volume 13
Prognostic Value of Sarcopenia and Systemic Inflammation Markers in Patients Undergoing Definitive Radiotherapy for Esophageal Cancer
Authors Liang H, Peng H, Chen L
Received 29 October 2020
Accepted for publication 18 December 2020
Published 11 January 2021 Volume 2021:13 Pages 181—192
DOI https://doi.org/10.2147/CMAR.S288522
Checked for plagiarism Yes
Review by Single anonymous peer review
Peer reviewer comments 2
Editor who approved publication: Dr Eileen O'Reilly
Huanwei Liang,1,* Huajian Peng,2,* Long Chen1
1Department of Radiotherapy, Guangxi Medical University Cancer Hospital, Nanning 530021, Guangxi Zhuang Autonomous Region, People’s Republic of China; 2Department of Thoracic Surgery, The First Affiliated Hospital of Guangxi Medical University, Nanning 530021, Guangxi Zhuang Autonomous Region, People’s Republic of China
*These authors contributed equally to this work
Correspondence: Long Chen
Department of Radiotherapy, Guangxi Medical University Cancer Hospital, He Di Road 71, Nanning, 530021 Guangxi Zhuang Autonomous Region, People’s Republic of China
Tel +86-771- 5330700
Fax +86 771- 5312000
Email [email protected]
Objective: To determine the independent and combined prognostic value of sarcopenia and systemic inflammatory markers in esophageal cancer patients undergoing definitive radiotherapy.
Methods: Sarcopenia was diagnosed on the basis of the skeletal muscle index (SMI) as determined by the skeletal muscle area at the third lumbar (L3) region and body height. The optimal cutoff value of systemic inflammatory markers was determined by the receiver-operating curve (ROC). Logistic regression was used to analyze the correlation among different variables. Cox proportional hazards model was used to identify the factors significantly correlated to overall survival (OS). Based on the results of multivariate survival analysis, a nomogram was established to predict the survival rate. The accuracy of the nomogram was evaluated by the coordination index and the calibration curve.
Results: A total of 100 esophageal cancer patients were included, of which 77 exhibited sarcopenia. The lymphocyte–monocyte ratio (LMR) was significantly correlated to the risk of sarcopenia (OR = 0.637, 95% CI, 0.452– 0.898, P = 0.010). In addition, sarcopenia (P = 0.002, HR = 3.991, 95% CI: 1.653– 9.638) and LMR < 2.67 (P < 0.001, HR = 2.665, 95% CI: 1.563– 4.543) were independent predictors of OS. Two nomograms with good predictive accuracy were established.
Conclusion: Sarcopenia and LMR can independently predict the survival of patients with esophageal cancer receiving definitive radiotherapy and have good combined prognostic value.
Keywords: esophageal cancer, definitive radiotherapy, sarcopenia, lymphocyte-monocyte ratio, survival
Introduction
Esophageal cancer is a highly aggressive malignancy with poor prognosis and a meagre five-year survival rate of 18%.1 It is a prevalent cancer and ranks ninth and sixth worldwide in terms of the incidence rate and mortality rate, respectively.2 Most patients initially present with dysphagia due to the mechanical obstruction caused by tumor growth, which significantly reduces food intake. The resulting deterioration in nutritional status leads to cachexia, which manifests as weight loss and reduced skeletal muscle mass.3 Sarcopenia is a major indicator of cachexia4 and is characterized by a progressive, systemic reduction in skeletal muscle mass and strength, which lowers the quality of life and increases mortality risk.5,6 It is routinely diagnosed by measuring the skeletal muscle mass at the level of the third lumbar vertebra (L3) by computed tomography (CT).7 However, given the lack of standardized diagnostic criteria for sarcopenia, there is considerable variation in its reported incidence rates in digestive tract cancers and ranges from 25.4% to 57.4%.8–11 Nevertheless, it is an established prognostic factor in esophageal cancer, pancreatic cancer and colorectal cancer.12 In fact, preoperative sarcopenia has a better predictive value in patients with gastrointestinal tumors compared to body mass index (BMI) and obesity.8,13
Systemic inflammation has long been identified as a contributing factor in tumorigenesis,14 and immune cells including neutrophils, monocytes and lymphocytes play an important role in tumor development.15,16 The monocyte–lymphocyte ratio (LMR), platelet–lymphocyte ratio (PLR) and neutrophil–lymphocyte ratio (NLR) are reliable indicators of systemic inflammation and have prognostic significance in various solid tumors, including esophageal cancer, lung cancer, pancreatic cancer, etc.17–19 Furthermore, the factors secreted by tumor cause muscle and adipose tissue wasting through central and peripheral pathways, thus promoting the development of cachexia.20 Two studies on gastrointestinal cancer patients have shown that sarcopenia is significantly associated with the infiltration of neutrophils, monocytes and lymphocytes.21,22
Due to the absence of discernible symptoms in the early stage of esophageal cancer, most patients had lost indications for surgery at diagnosis.23 Currently, definitive radiotherapy is a common approach for inoperable esophageal cancer without distant metastasis. The aim of this study was to determine the correlation between pre-treatment sarcopenia and systemic inflammation in patients with esophageal cancer receiving definitive radiotherapy, and assess their prognostic relevance.
Materials and Methods
Patients and Treatment
Data of esophageal cancer patients who received definitive radiotherapy from December 2016 to December 2019 at the Department of Radiotherapy, Guangxi Medical University Cancer Hospital, China was retrospectively analyzed. The inclusion criteria were as follows: (a) histologically proven esophageal squamous cell carcinoma or adenocarcinoma, (b) no option for surgical resection or refuse surgery, (c) definitive radiotherapy with or without concurrent chemotherapy as the first-line treatment, and (d) availability of complete medical records, pre-treatment imaging data and laboratory data. The exclusion criteria were: (a) underwent esophageal tumor resection, (b) stage M1 tumors, (c) incomplete radiotherapy, and (d) co-existence of more than one cancer type. The study was conducted in accordance with the Declaration of Helsinki. The study was also approved by the Ethical Review Committee of Guangxi Medical University Cancer Hospital (ethics approval number: LW2020069), and all patients provided written informed consent.
Clinical and tumor characteristics of patients were obtained by retrieving medical records. Patients’ general condition was assessed according to the Eastern Cooperative Oncology Group performance status, and smoking history and alcohol consumption were defined according to previous studies.24,25 Patients were clinically staged according to the 2017 UICC/AJCC 8th edition esophageal cancer staging criteria, which were mainly performed by CT scan and endoscopy.
All patients received definitive radiotherapy with 6MV-X-ray intensity-modulated conformal radiotherapy (IMRT) at a total dose of 54–60 Gy/30f. IMRT was performed using an Elekta linear accelerator (Elekta, Stockholm, Sweden) or a Varian linear accelerator (Varian, California, USA). Concurrent chemotherapy regimens consisted of 5-fluorouracil and platinum, or paclitaxel and platinum. All treatments were completed at our hospital. Common Terminology Criteria for Adverse Events (CTCAE) version 5.0 was used to collect and evaluate adverse events during treatment.
Body Composition
BMI was calculated as weight (kg)/square of the height (m2). Abdominal enhanced CT scan was performed within a month before treatment, and two consecutive axial images were taken of the L3 muscle area, a standard skeletal landmark for whole body skeletal muscle volume.10 The area of all the skeletal muscles in the L3 region, including rectus abdominis, oblique externus abdominis, internal oblique abdominis, transversus abdominis, psoas major, quadratus psoas and erector spinalis, were measured in each image using ImageJ. The average of the measured areas of two consecutive slices were calculated. Skeletal muscle index (SMI) was then calculated as the skeletal muscle area (cm2)/square of the height (m2). Sarcopenia was defined as L3 SMI ≤ 52.4cm2/m2 for males and ≤38.5 cm2/m2 for females.26 The images were analyzed by one researcher in a blinded fashion.
Markers of Systemic Inflammation
Complete blood count (CBC) analysis was performed within 1 week before the start of treatment using Mindray BC-6900 automatic blood cell analyzer (Mindray, Shenzhen, China), and the platelet, neutrophil, monocyte and lymphocyte counts were recorded. NLR was calculated as the absolute neutrophil count/lymphocyte count, PLR as platelet count/lymphocyte count, and LMR as monocyte count/lymphocyte count. Receiver operating curve (ROC) was plotted, and the optimum sensitivity, specificity and area under the curve (AUC) were calculated in order to establish the best cut-off points for distinguishing between low and high LMR, NLR and PLR.
Follow-Up
The patients were followed up every 3 months after the end of radiotherapy through the retrieval of medical records, telephone calls, letters and outpatient interviews. The median follow-up duration was 12 months. The primary end point was overall survival (OS), defined as the time from the diagnosis of esophageal cancer to death from any cause.
Statistics Analysis
Chi-square test or Fisher exact test was used to compare categorical variables between groups. Univariate and multivariate logistic regression analyses were performed to evaluate the relationship between sarcopenia and systemic inflammation markers. The Kaplan-Meier survival curve was plotted, and the Log rank test was used to analyze the differences between groups. Univariate and multivariate Cox proportional hazards analysis was used to identify the prognostic factors of OS, and the statistically significant factors were used to construct a nomogram. Coordination index (C index) and calibration curve were used to evaluate the predictive accuracy of the nomogram. Statistical analysis was performed using SPSS version 23.0 and R version 4.0.2, and the graphs were drawn using R version 4.0.2. All tests were two-sided, and P values less than 0.05 were considered statistically significant.
Results
Patients and Treatment
Data of 100 esophageal cancer patients, including 77 with sarcopenia, were collected. The mean age of the patients was 59.01±1.76 years (range 41–84), and 93% of the patients were male. Most patients had a history of smoking (73%) and alcohol consumption (77%). Forty-eight patients scored 0 and 52 patients scored 1 on the ECOG PS. In addition, 45 patients had cervical and upper thoracic esophageal cancer, whereas and 34 and 21 patients were, respectively, diagnosed with middle and lower thoracic esophageal cancer. The majority of the cases (97%) were squamous cell carcinomas. The clinical tumors (cT) stage and clinical lymph node (cN) stage was similar in both groups. There were no patients with clinical stage I among the included patients, and there was a significant difference in clinical stage between the two groups (P=0.030). Furthermore, 75% of patients received definitive concurrent chemoradiotherapy (CCRT). The overall incidence of grade 3–4 adverse reactions to radiotherapy or chemotherapy was 64% (Supplementary Table S1). Hematological adverse effects were predominant (46%), especially leukopenia and neutropenia. In addition, 11 patients had radiation esophagitis and consequent esophageal fistula or stricture, and 1 patient had unexplained upper gastrointestinal bleeding. Three patients developed radiation pneumonia. In the sarcopenia group, the incidence of grade 3–4 adverse reactions was significantly higher (70.13% vs 43.48%, P=0.019). The clinical and pathological characteristics of all patients are summarized in Table 1.
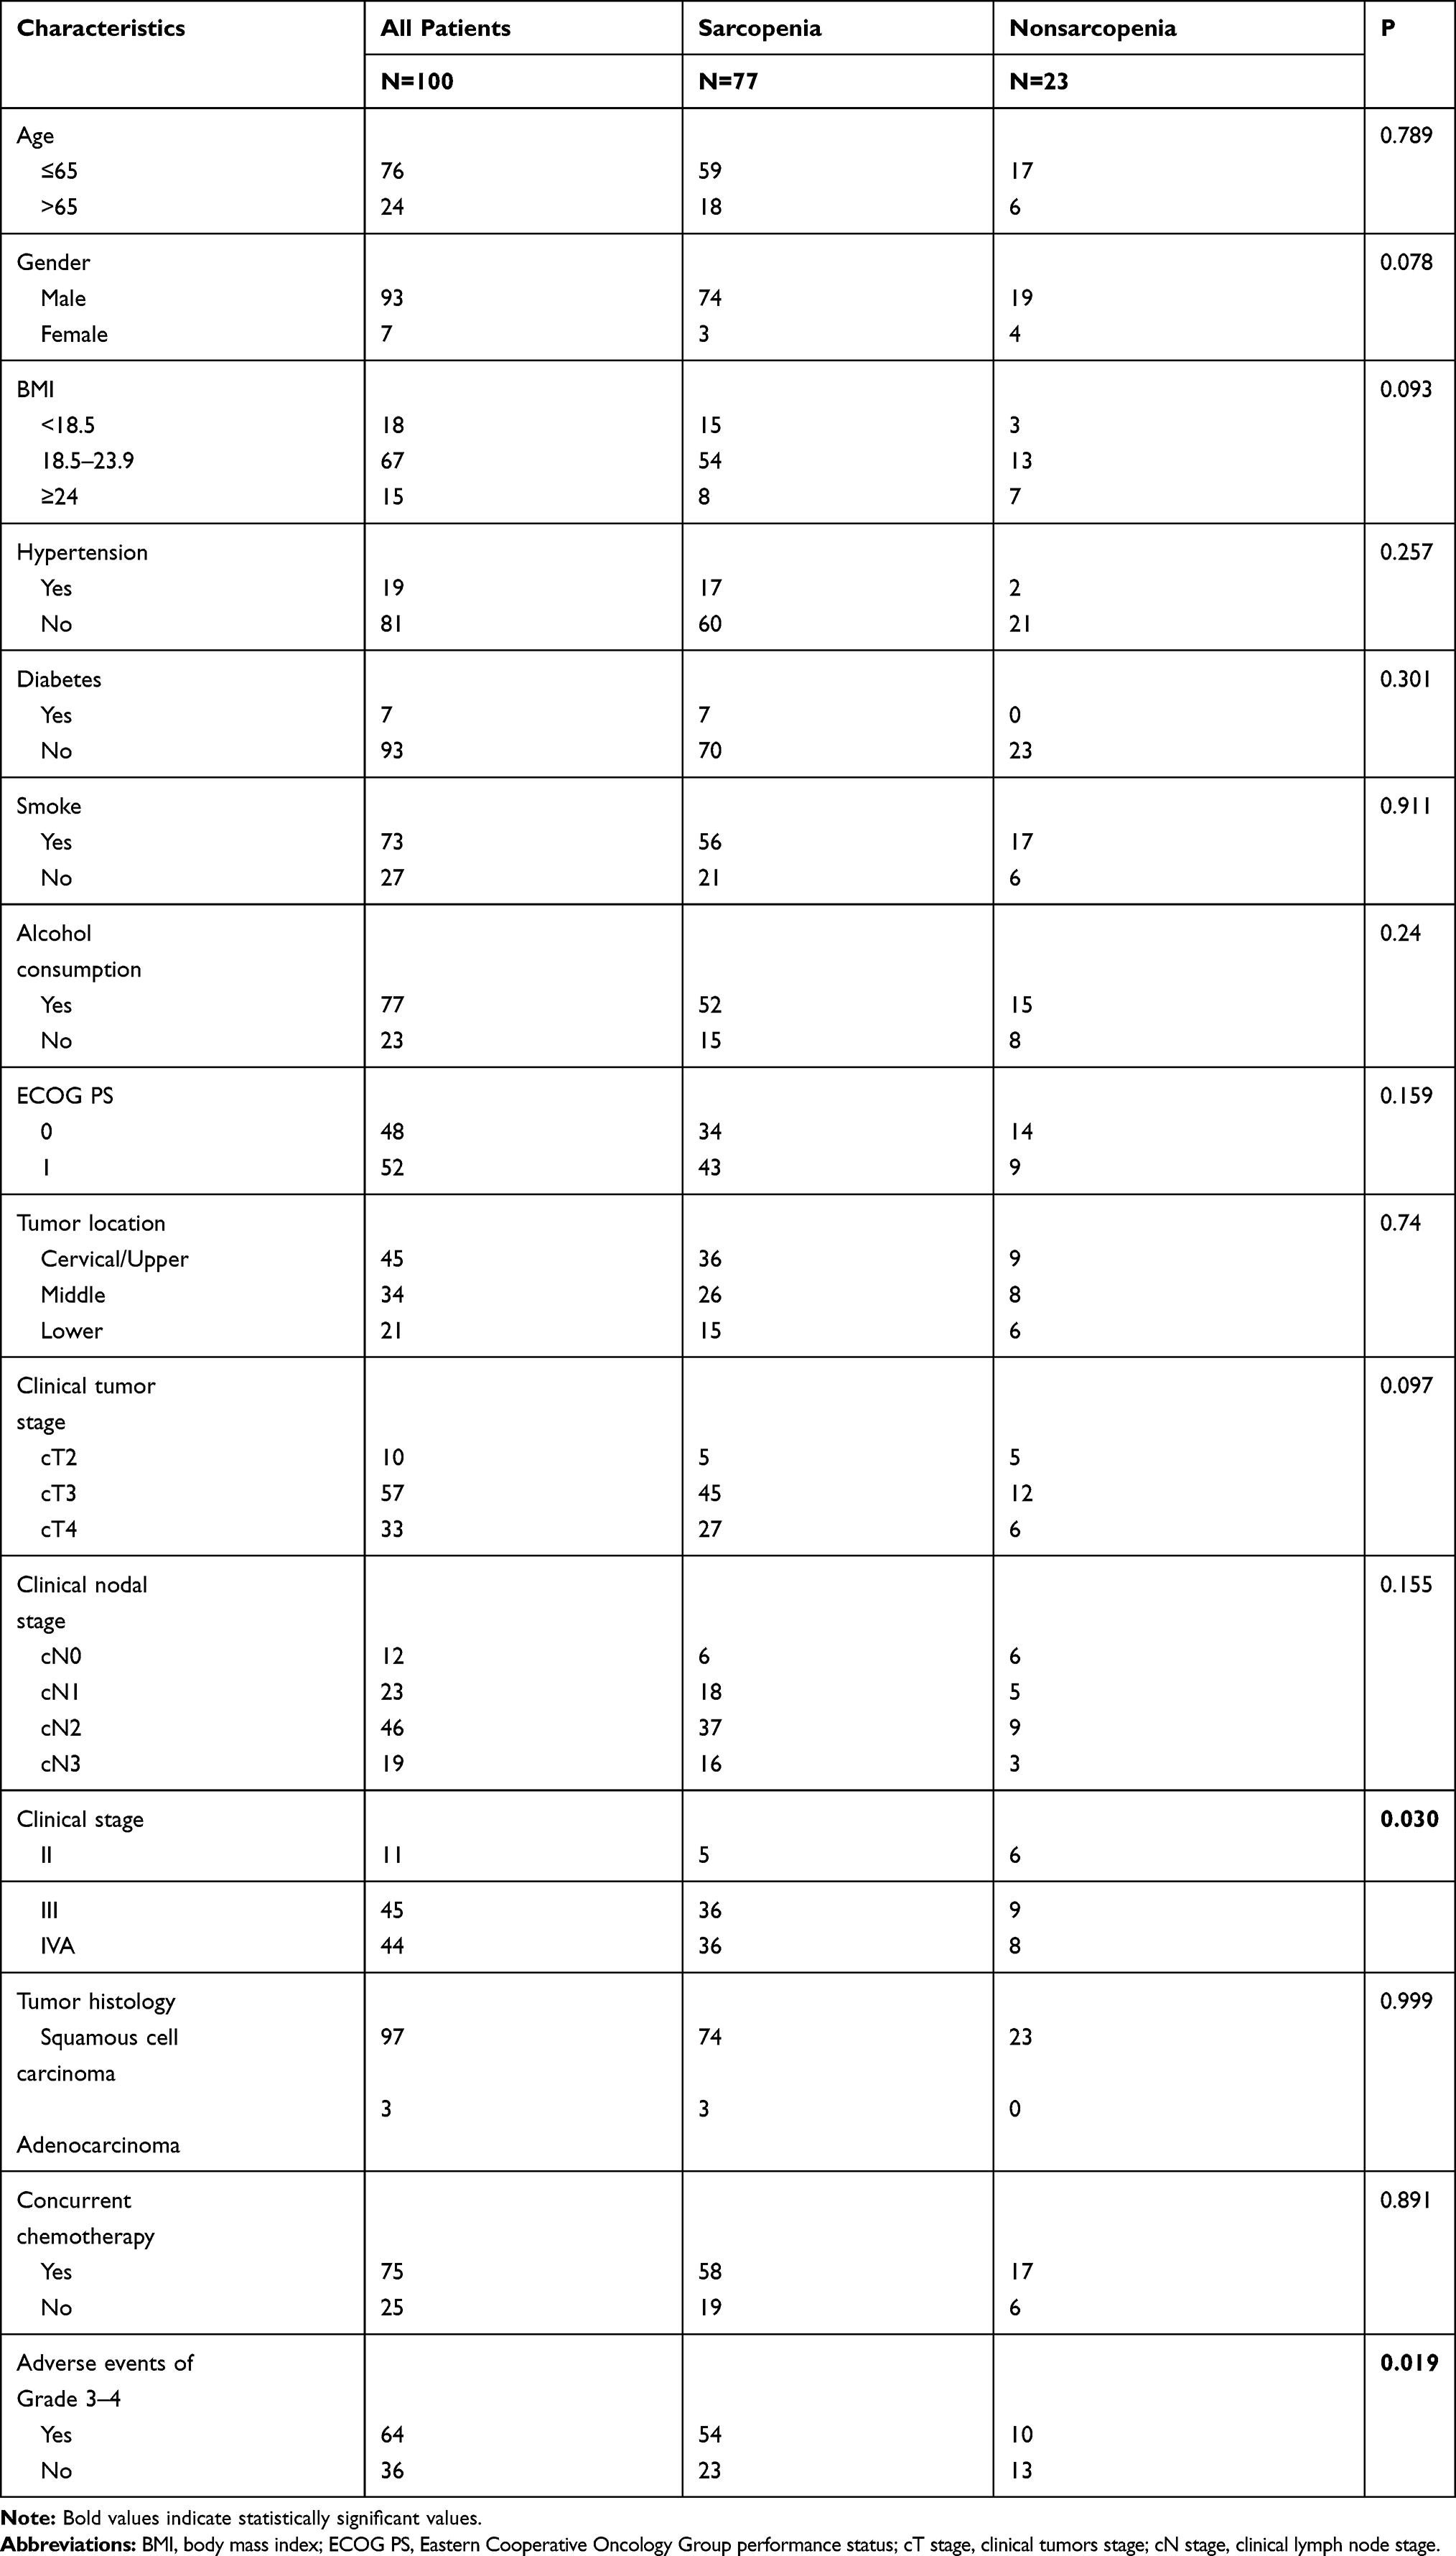 |
Table 1 Baseline Characteristics of Patients and Tumors |
Systemic Inflammation Markers
The mean LMR was 3.44±0.30 (range 0.93–10.05), and the cut-off value, sensitivity, specificity and AUC value were 2.67, 44.8%, 85.7% and 0.669 (95% CI: 0.561–0.777) respectively. The mean NLR was 2.85±0.31 (range 0.58–10.57), and the cut-off value, sensitivity, specificity and AUC were 3.07, 43.1%, 83.3% and 0.636 (95% CI: 0.526–0.746) respectively. The mean PLR was 172.09±15.21 (range 35.23–464.29), and the cut-off value, sensitivity, specificity and AUC were 161.35, 63.8%, 64.3% and 0.605 (95% CI: 0.491–0.718) respectively. The ROC curves are shown in Figure 1.
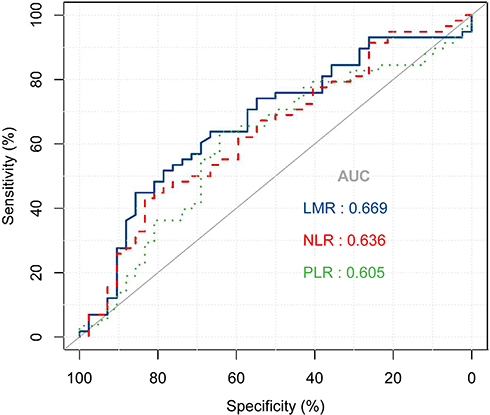 |
Figure 1 The receiver-operating characteristic (ROC) curves for inflammation index. Abbreviations: AUC, area under the curve; LMR, lymphocyte–monocyte ratio; NLR, neutrophil-lymphocyte ratio; PLR, platelet–lymphocyte ratio. |
Correlation Between Sarcopenia and Systemic Inflammation Markers
The results of logistical regression analysis between sarcopenia and systemic inflammation markers, as well as various clinical and tumor characteristics, are summarized in Table 2. Univariate analysis showed that female sex (OR=0.193, 95% CI, 0.040–0.934, P=0.041), cT stage ≥3 (OR=4.000, 95% CI, 1.044–15.320, P=0.043), cN stage ≥1 (OR=4.176, 95% CI, 1.198–14.566, P=0.025) and LMR (OR=0.647, 95% CI, 0.470–0.890, P=0.007) were significantly correlated to sarcopenia. Multivariate analysis identified cT staging ≥T3 (OR=5.745, 95% CI, 1.270–25.993, P=0.023) and LMR (OR=0.637, 95% CI, 0.452–0.898, P=0.010) as independent risk factors of sarcopenia.
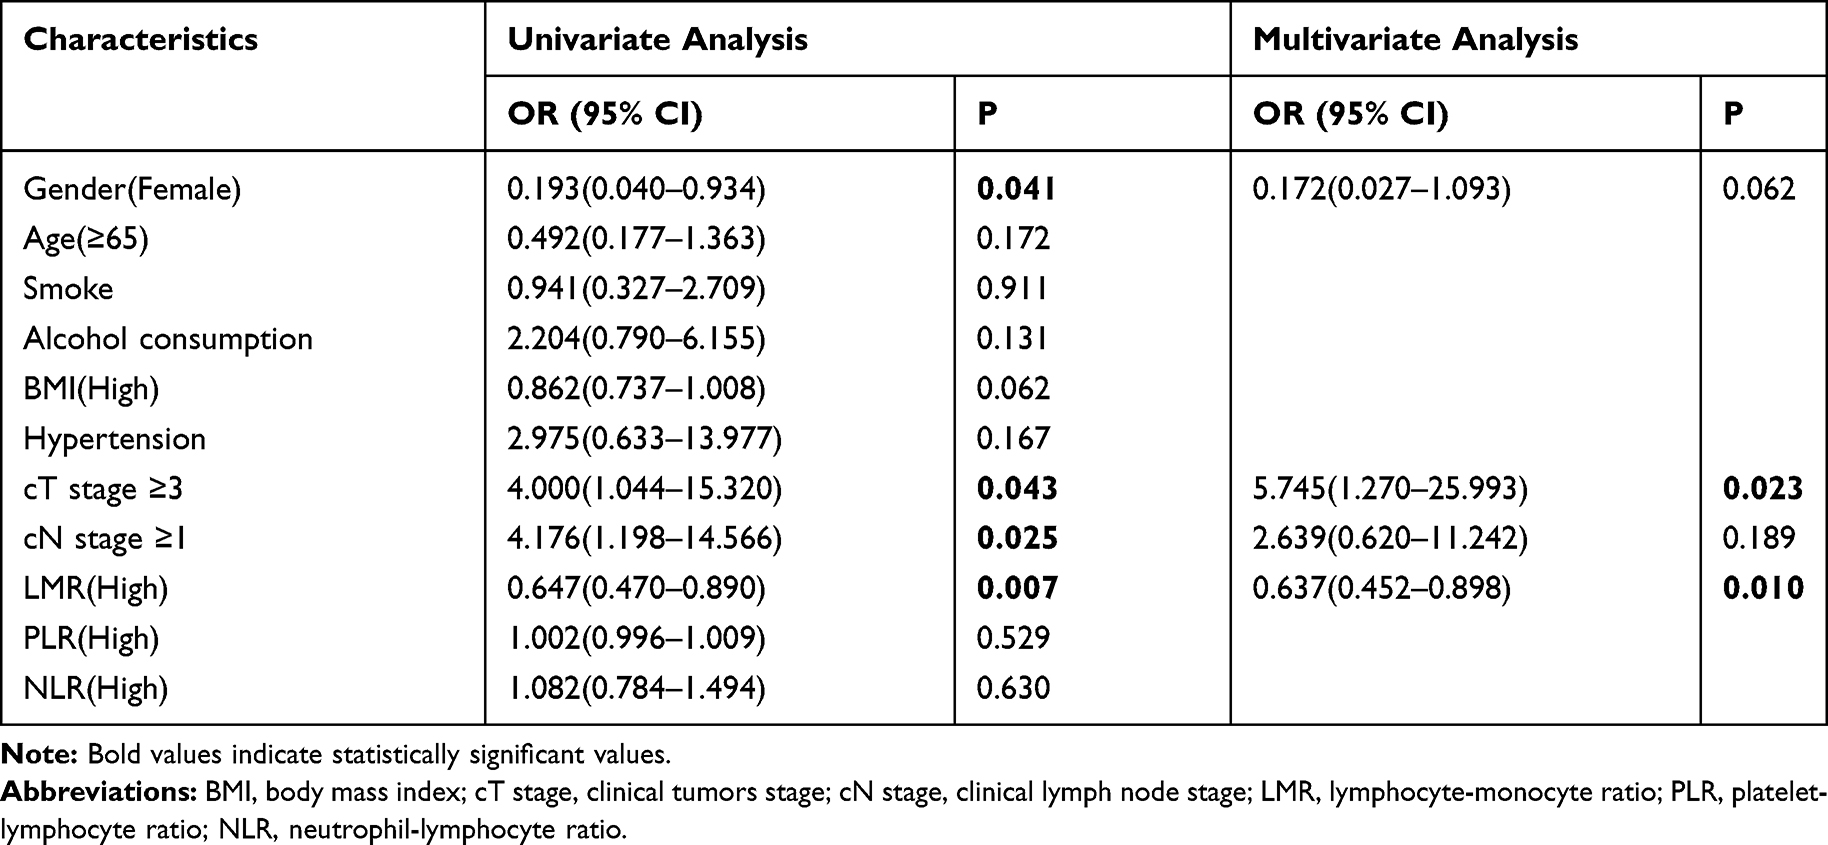 |
Table 2 Univariate and Multivariate Logistic Regression Analysis of Factors Associated with Sarcopenia |
Survival Outcomes
The median OS of the entire patient cohort was 15 months (95% CI: 12.29–17.70). Patients without sarcopenia survived for a significantly longer duration compared to those with sarcopenia (median OS 36 months vs 13 months, P<0.001, Figure 2A). In the sarcopenia group, patients with LMR≥2.67 had significantly longer median OS compared to those with LMR<2.67 (19 months vs 9 months, P<0.001, Figure 2B). To assess the combined prognostic value of sarcopenia and LMR, we stratified the patients based on the SLMR score as defined by Lin et al: 0 – no sarcopenia and LMR <2.67 (N=17), 1 – sarcopenia or LMR <2.67 (N=57), 2 – sarcopenia and LMR <2.67 (N=26).22 The median OS of patients with SLMR score 0 (36 months) was significantly longer than that of patients scoring 1 (16 months) and 2 (8 months) (P<0.001, Figure 2C). In addition, CCRT significantly prolonged the median OS of patients with sarcopenia (14 months vs 8 months, P=0.025, Figure 3).
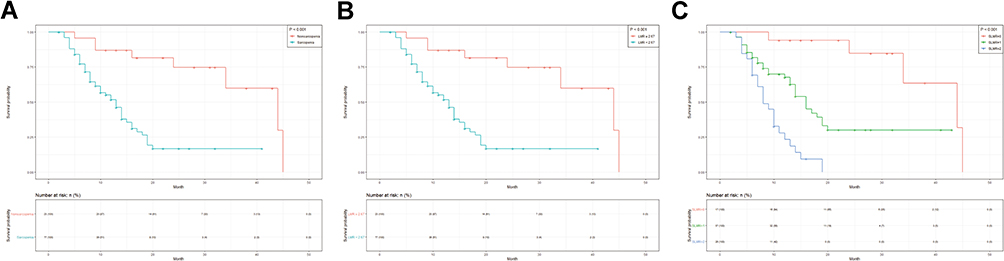 |
Figure 2 Kaplan–Meier survival curve of overall survival in patients: (A) Sarcopenia; (B) LMR; (C) SLMR. Abbreviations: LMR, lymphocyte–monocyte ratio; SLMR, sarcopenia and the lymphocyte–monocyte ratio. |
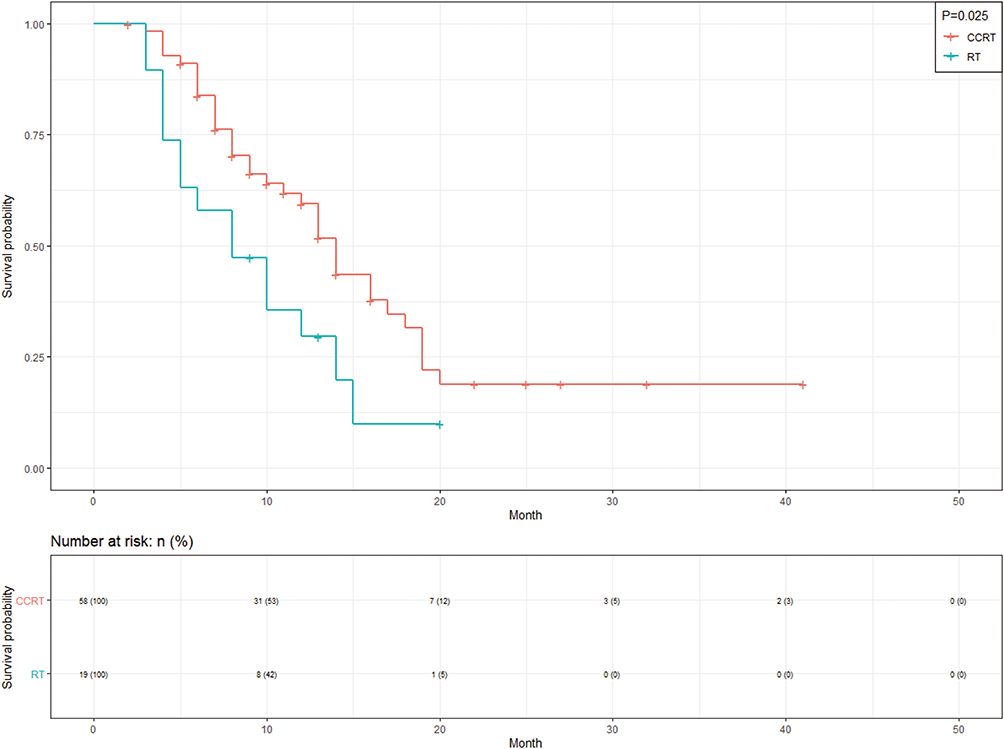 |
Figure 3 Kaplan–Meier survival curve for overall survival according to CCRT and RT in patients with sarcopenia. Abbreviations: CCRT, concurrent chemoradiotherapy; RT, radiotherapy. |
Univariate analysis showed that sarcopenia (P<0.001, HR=5.249, 95% CI: 2.213–12.452), LMR<2.67 (P<0.001, HR=2.665, 95% CI: 1.563–4.543), alcohol consumption (P=0.046, HR=2.067, 95% CI: 1.012–4.221), cT stage ≥3 (P=0.043, HR=7.681, 95% CI: 1.062–55.541) and cN stage ≥1 (P=0.009, HR=6.564, 95% CI: 1.591–27.085) were significantly correlated with OS. Multivariate analysis showed that sarcopenia (P=0.002, HR=3.991, 95% CI: 1.653–9.638), LMR<2.67 (P<0.001, HR=2.665, 95% CI: 1.563–4.543), cT stage ≥3 (P=0.040, HR=8.183, 95% CI: 1.098–60.962) and cN stage ≥1 (P=0.031, HR=4.768, 95% CI: 1.150–19.776) were independent predictors of OS (Table 3).
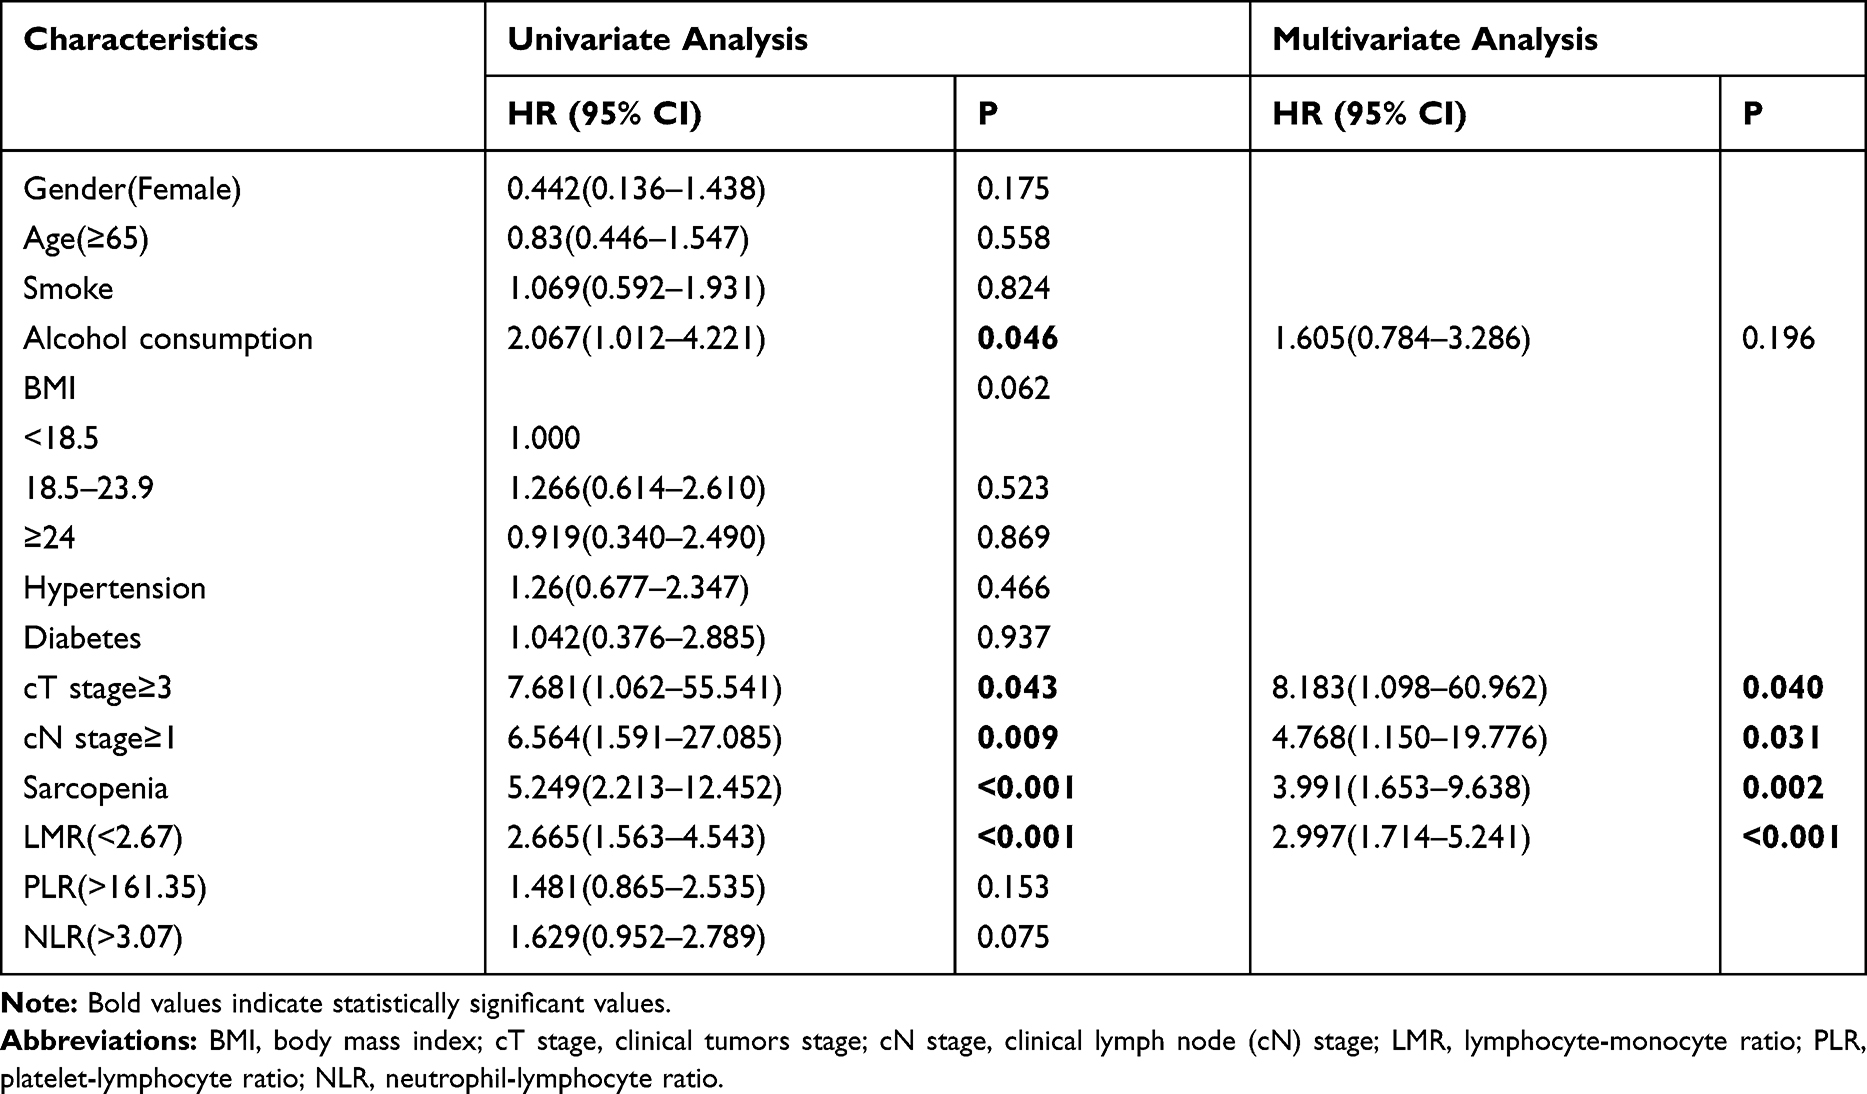 |
Table 3 Univariate and Multivariate Analyses of Overall Survival in the Eligible Patients |
Survival Predictive Nomogram
Based on the results of multivariate survival analysis, we constructed a nomogram to predict OS based on sarcopenia, LMR, cT staging and cN staging (Figure 4A). cT staging was the most significant prognostic factor, followed by cN staging, sarcopenia and LMR. To evaluate the combined prognostic value of sarcopenia and LMR, we constructed a nomogram based on SLMR, cT staging and cN staging (Figure 4B). SLMR was the most significant factor affecting patient prognosis, followed by cT stage and cN stage. The predictive accuracy of each nomogram for 1-year and 3-year survival rates were compared, and the C index of the non-SLMR and SLMR nomograms were 0.7378 and 0.7387, respectively. We also established 3-year OS for the two nomograms, and the calibration curve (Figure 5) showed consistency between the predicted and actual survival probability.
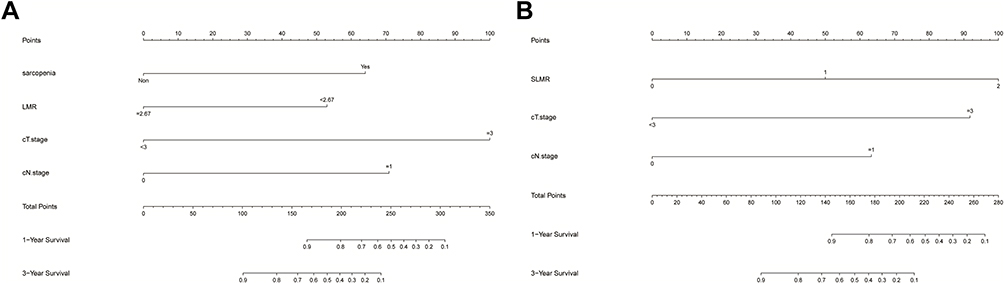 |
Figure 4 Nomogram for predicting the 1- and 3-year overall survival of esophageal cancer patients. (A) non-SLMR-based nomogram of overall survival. (B) SLMR-based nomogram of overall survival. Abbreviations: SLMR, sarcopenia and the lymphocyte–monocyte ratio; cT stage, clinical tumors stage; cN stage, clinical lymph node stage. |
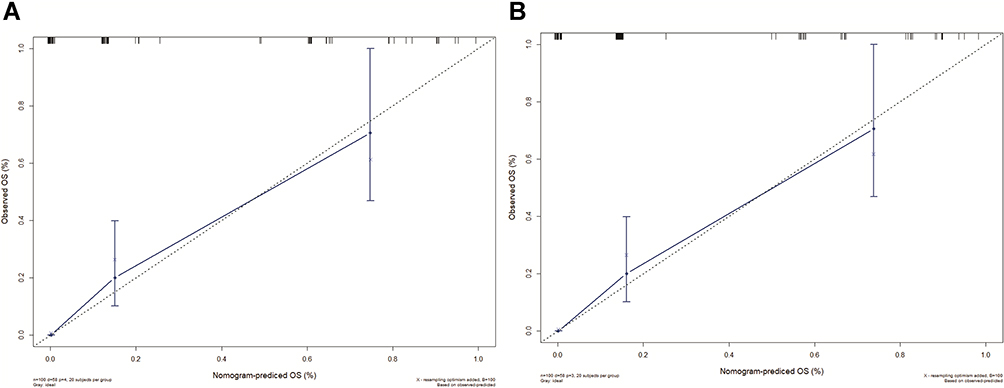 |
Figure 5 The calibration plot for 3-year survival of (A) non-SLMR and (B) SLMR. The X-axis presents the predicted probability and the Y-axis shows the actual probability. |
Discussion
We found that sarcopenia and LMR are independent prognostic factors for esophageal cancer patients undergoing definitive radiotherapy, and lower LMR indicates a higher risk of pre-treatment sarcopenia. Furthermore, the presence of both sarcopenia and reduced LMR (SLMR) before treatment correlated significantly with shorter survival post-radiotherapy, and the predictive value of SLMR for OS was greater than that of cT stage and cN stage. In addition, although CCRT is a standard treatment for esophageal cancer, there are concerns regarding its administration in malnourished patients. Our study showed that concurrent chemotherapy significantly improved the prognosis of sarcopenia patients with ECOG score 0–1, although the incidence of grade 3–4 adverse reactions was higher.
At present, there is no consensus on the prognostic value of sarcopenia in patients with esophageal cancer. Some studies have not found any correlation between pre-treatment sarcopenia and OS in patients undergoing neoadjuvant chemoradiotherapy and esophagectomy.27–29 However, Tamandl et al reported a significantly worse prognosis of esophageal cancer patients with pre-operative sarcopenia compared to the non-sarcopenia patients (median OS 31.5 months vs 76.5 months, P=0.011).30 Likewise, Paireder et al showed that esophageal cancer patients with sarcopenia had shorter survival duration after neoadjuvant therapy.31 In addition, an East Asian study on esophageal cancer patients also reported a worse prognosis in the sarcopenia versus non-sarcopenia group after definitive CCRT.32 These findings consistent with ours suggest that sarcopenia is a promising prognostic factor in patients with esophageal cancer.
Sarcopenia leads to a considerable socio-economic burden on patients,33 a severe decline in the ability to live independently,34 and an increased risk of accidental falls and fractures.35 It is a manifestation of cachexia, which is significantly associated with reduced survival in cancer patients, most likely due to a significant decrease in patient tolerance to anticancer therapy and increased susceptibility to infections and other complications.36 Consistent with this, sarcopenia significantly increased the risk of grade 3–4 adverse reactions in our cohort. The direct consequence of sarcopenia is the loss of skeletal muscles, which are not only an integral part of the motor system but also modulate immune and inflammatory processes by secreting multiple cytokines.37 For instance, skeletal muscle tissue is the main secretory site of interleukin (IL)-15,38 which ensures normal development and survival of natural killer (NK) cells by upregulating the anti-apoptotic factor bcl-2.39 Therefore, sarcopenia may lower NK cell count in cancer patients, thereby weakening the anti-tumor immune response and worsening patient prognosis. This further underscores the prognostic relevance of sarcopenia and its predictive value for the final survival outcome.
Given the mechanical obstruction caused by growing esophageal tumor mass, poor food intake and malnutrition is very common (79% incidence rate) in esophageal cancer patients.40 In addition, vomiting, anorexia, radiation esophagitis41 and muscle atrophy36 caused by radiation and chemotherapy drugs may aggravate sarcopenia. Ma et al showed that the SMI of esophageal cancer patients decreased significantly after CCRT, corresponding to an increase in the proportion of patients with sarcopenia, indicating significant skeletal muscle loss during CCRT.32 However, due to insufficient post-treatment imaging data, we were unable to analyze the CCRT-induced changes in skeletal muscle mass in our patient cohort. Nevertheless, a protein/calorie-rich diet or oral nutritional supplements is vital for sarcopenia patients prior to radiotherapy. If sufficient nutritional intake cannot be ensured, enteral nutrition through gastrostomy or nasogastric tube is an effective measure.40 Furthermore, eicosapentaenoic acid (EPA) supplements are recommended for cancer patients with elevated systemic inflammation markers. EPA is an n-3 polyunsaturated fatty acid that can effectively improve the nutritional and functional status of esophageal cancer patients receiving CCRT,42 and mitigate the systemic inflammatory response induced by IL-6 and C-reactive protein (CRP).43 However, it remains to be elucidated whether nutritional therapy during the perioperative period or CCRT can improve the long-term survival outcomes of patients with esophageal cancer.
Systemic inflammation is a hallmark of cancer and is triggered by tumor tissue hypoxia or necrosis that impairs the balance between the inflammatory cells (neutrophils and monocytes) and tumor-specific lymphocytes.44,45 Cytotoxic T cells (CTL) can directly kill tumor cells, and the helper T cells and B cells play auxiliary roles by promoting CTL persistence and antigen presentation, respectively.46 In contrast, monocytes secrete pro-inflammatory factors such as tumor necrosis factor (TNF), IL-1, IL-6 that may stimulate the growth of cancer cells.47 Thus, a higher proportion of lymphocytes relative to monocytes, ie a higher LMR in the tumor microenvironment, is indicative of slow tumor growth. In fact, LMR is a favorable prognostic factor for head and neck cancer,48 lymphoma49 and colorectal cancer.50 Liu et al further reported better prognostic performance of LMR compared to NLR and PLR in patients with esophageal squamous cell carcinoma, and identified high LMR as an independent factor of longer survival.51 Another study showed that high LMR was predictive of better clinical response and prognosis for patients with locally advanced esophageal cancer receiving definitive CCRT. Therefore, the LMR may help clinicians stratify the responsive and non-responsive patients.52
Skeletal muscle tissues are known to secrete TNF-α and IL-6 to promote systemic inflammation.39 On the other hand, the pro-inflammatory factors released by both immune cells and tumor cells promote muscle tissue decomposition and inhibit skeletal muscle cell differentiation, eventually leading to muscle atrophy.22 Furthermore, TNF-α can directly induce muscle atrophy via the ubiquitin-proteasome system (UPS).53 The increased number of circulating monocytes releases copious amounts of TNFα and IL-6, which may lead to insulin resistance through phosphorylation of serine 307 of IRS-1. This in turn activates the caspase-3 and ubiquitin-proteasome proteolysis pathways via inhibiting PI3K/Akt inhibition, eventually leading to muscle protein degradation and sarcopenia.54 Therefore, we hypothesize that the reciprocal relationship between systemic inflammation and skeletal muscle atrophy reduction promotes tumor development and increases patient mortality.
There are several limitations in this retrospective study that ought to be considered. First, we diagnosed sarcopenia in a Chinese cohort according to the standards established by Prado et al, which in turn is based on the data of Caucasian patients.26 Therefore, the proportion of patients with muscle loss in our cohort (77%) was relatively higher than that reported in other studies.10,22,28 Second, since detailed follow-up imaging and laboratory data were not available for some patients, the incidence of adverse reactions such as radiation pneumonia may not have been accurate. In addition, we did not deeply explore the possible impact of chemotherapy on the nutritional/functional status of patients due to the inconsistent chemotherapy regimens. Although we have analyzed the skeletal muscle area and BMI of patients at the time of inclusion, we lack a systematic assessment of the nutritional status of patients. Finally, our sample size was small, and our results will have to be verified on a larger cohort.
Conclusion
Sarcopenia and LMR are both independent predictors of OS for patients with esophageal cancer undergoing definitive radiotherapy and show good combined prognostic value. Detection of sarcopenia and LMR can be easily incorporated into clinical practice.
Acknowledgments
The authors thank Dr. Xinbin Pan, who is work in the Department of Radiotherapy, Guangxi Medical University Cancer Hospital, for his contributions to manuscript revision.
Funding
There is no funding to report.
Disclosure
None of the authors have conflicts of interest to disclose for this work.
References
1. Peery AF, Crockett SD, Barritt AS, et al. Burden of gastrointestinal, liver, and pancreatic diseases in the United States. Gastroenterology. 2015;149(7):1731–1741 e1733. doi:10.1053/j.gastro.2015.08.045
2. Bray F, Ferlay J, Soerjomataram I, Siegel RL, Torre LA, Jemal A. Global cancer statistics 2018: GLOBOCAN estimates of incidence and mortality worldwide for 36 cancers in 185 countries. CA Cancer J Clin. 2018;68(6):394–424. doi:10.3322/caac.21492
3. Anandavadivelan P, Lagergren P. Cachexia in patients with oesophageal cancer. Nat Rev Clin Oncol. 2016;13(3):185–198. doi:10.1038/nrclinonc.2015.200
4. Fearon K, Strasser F, Anker SD, et al. Definition and classification of cancer cachexia: an international consensus. Lancet Oncol. 2011;12(5):489–495. doi:10.1016/S1470-2045(10)70218-7
5. Goodpaster BH, Park SW, Harris TB, et al. The loss of skeletal muscle strength, mass, and quality in older adults: the health, aging and body composition study. J Gerontol a Biol Sci Med Sci. 2006;61(10):1059–1064. doi:10.1093/gerona/61.10.1059
6. Delmonico MJ, Harris TB, Lee J-S, et al. Alternative definitions of sarcopenia, lower extremity performance, and functional impairment with aging in older men and women. J Am Geriatr Soc. 2006;61(10):769–774. doi:10.1111/j.1532-5415.2007.01140.x
7. Kazemi-Bajestani SM, Mazurak VC, Baracos V. Computed tomography-defined muscle and fat wasting are associated with cancer clinical outcomes. Semin Cell Dev Biol. 2016;54:2–10. doi:10.1016/j.semcdb.2015.09.001
8. Zhang S, Tan S, Jiang Y, et al. Sarcopenia as a predictor of poor surgical and oncologic outcomes after abdominal surgery for digestive tract cancer: a prospective cohort study. Clin Nutr. 2019;38(6):2881–2888. doi:10.1016/j.clnu.2018.12.025
9. Onishi S, Shiraki M, Nishimura K, Hanai T, Moriwaki H, Shimizu M. Prevalence of sarcopenia and its relationship with nutritional state and quality of life in patients with digestive diseases. J Nutr Sci Vitaminol (Tokyo). 2018;64(6):445–453. doi:10.3177/jnsv.64.445
10. Onishi S, Tajika M, Tanaka T, et al. Prognostic significance of sarcopenia in patients with unresectable advanced esophageal cancer. J Clin Med. 2019;8(10):1647. doi:10.3390/jcm8101647
11. Lidoriki I, Schizas D, Mpaili E, et al. Associations between skeletal muscle mass index, nutritional and functional status of patients with oesophago-gastric cancer. Clin Nutr ESPEN. 2019;34:61–67. doi:10.1016/j.clnesp.2019.08.012
12. Shachar SS, Williams GR, Muss HB, Nishijima TF. Prognostic value of sarcopenia in adults with solid tumours: a meta-analysis and systematic review. Eur J Cancer. 2016;57:58–67. doi:10.1016/j.ejca.2015.12.030
13. Jochum SB, Kistner M, Wood EH, et al. Is sarcopenia a better predictor of complications than body mass index? Sarcopenia and surgical outcomes in patients with rectal cancer. Colorectal Dis. 2019;21(12):1372–1378. doi:10.1111/codi.14751
14. Mantovani A, Allavena P, Sica A, Balkwill F. Cancer-related inflammation. Nature. 2008;454(7203):436–444. doi:10.1038/nature07205
15. Hanahan D, Weinberg RA. Hallmarks of cancer: the next generation. Cell. 2011;144(5):646–674. doi:10.1016/j.cell.2011.02.013
16. De Palma M, Murdoch C, Venneri MA, Naldini L, Lewis CE. Tie2-expressing monocytes: regulation of tumor angiogenesis and therapeutic implications. Trends Immunol. 2007;28(12):519–524. doi:10.1016/j.it.2007.09.004
17. Sun Y, Zhang L. The clinical use of pretreatment NLR, PLR, and LMR in patients with esophageal squamous cell carcinoma: evidence from a meta-analysis. Cancer Manag Res. 2018;10:6167–6179. doi:10.2147/CMAR.S171035
18. Mandaliya H, Jones M, Oldmeadow C, Nordman IIC. Prognostic biomarkers in stage IV non-small cell lung cancer (NSCLC): neutrophil to lymphocyte ratio (NLR), lymphocyte to monocyte ratio (LMR), platelet to lymphocyte ratio (PLR) and advanced lung cancer inflammation index (ALI). Transl Lung Cancer Res. 2019;8(6):886–894. doi:10.21037/tlcr.2019.11.16
19. Hu R-J, Ma J-Y, Hu G. Lymphocyte-to-monocyte ratio in pancreatic cancer: prognostic significance and meta-analysis. Clin Chim Acta. 2018;481:142–146. doi:10.1016/j.cca.2018.03.008
20. Mendes MC, Pimentel GD, Costa FO, Carvalheira JB. Molecular and neuroendocrine mechanisms of cancer cachexia. J Endocrinol. 2015;226(3):R29–R43. doi:10.1530/JOE-15-0170
21. Feliciano EMC, Kroenke CH, Meyerhardt JA, et al. Association of systemic inflammation and sarcopenia with survival in nonmetastatic colorectal cancer: results from the C SCANS Study. JAMA Oncol. 2017;3(12):e172319. doi:10.1001/jamaoncol.2017.2319
22. Lin JX, Lin JP, Xie JW, et al. Prognostic value and association of sarcopenia and systemic inflammation for patients with gastric cancer following radical gastrectomy. Oncologist. 2019;24(11):e1091–e1101. doi:10.1634/theoncologist.2018-0651
23. Enzinger PC, Mayer RJ. Esophageal cancer. N Engl J Med. 2003;349(23):2241–2252. doi:10.1056/NEJMra035010
24. Organization WH. Guidelines for Controlling and Monitoring the Tobacco Epidemic. World Health Organization; 1998.
25. Engel LS, Chow WH, Vaughan TL, et al. Population attributable risks of esophageal and gastric cancers. J Natl Cancer Inst. 2003;95(18):1404–1413. doi:10.1093/jnci/djg047
26. Prado CM, Lieffers JR, McCargar LJ, et al. Prevalence and clinical implications of sarcopenic obesity in patients with solid tumours of the respiratory and gastrointestinal tracts: a population-based study. Lancet Oncol. 2008;9(7):629–635. doi:10.1016/S1470-2045(08)70153-0
27. Yip C, Goh V, Davies A, et al. Assessment of sarcopenia and changes in body composition after neoadjuvant chemotherapy and associations with clinical outcomes in oesophageal cancer. Eur Radiol. 2014;24(5):998–1005. doi:10.1007/s00330-014-3110-4
28. Matsunaga T, Miyata H, Sugimura K, et al. Prognostic significance of sarcopenia and systemic inflammatory response in patients with esophageal cancer. Anticancer Res. 2019;39(1):449–458. doi:10.21873/anticanres.13133
29. Grotenhuis BA, Shapiro J, van Adrichem S, et al. Sarcopenia/muscle mass is not a prognostic factor for short- and long-term outcome after esophagectomy for cancer. World J Surg. 2016;40(11):2698–2704. doi:10.1007/s00268-016-3603-1
30. Tamandl D, Paireder M, Asari R, Baltzer PA, Schoppmann SF, Ba-Ssalamah A. Markers of sarcopenia quantified by computed tomography predict adverse long-term outcome in patients with resected oesophageal or gastro-oesophageal junction cancer. Eur Radiol. 2016;26(5):1359–1367. doi:10.1007/s00330-015-3963-1
31. Paireder M, Asari R, Kristo I, et al. Impact of sarcopenia on outcome in patients with esophageal resection following neoadjuvant chemotherapy for esophageal cancer. Eur J Surg Oncol. 2017;43(2):478–484. doi:10.1016/j.ejso.2016.11.015
32. Ma DW, Cho Y, Jeon M-J, et al. Relationship between sarcopenia and prognosis in patient with concurrent chemo-radiation therapy for esophageal cancer. Front Oncol. 2019;9:366. doi:10.3389/fonc.2019.00366
33. Mijnarends DM, Luiking YC, Halfens RJG, et al. Muscle, health and costs: a glance at their relationship. J Nutr Health Aging. 2018;22(7):766–773. doi:10.1007/s12603-018-1058-9
34. Dos Santos L, Cyrino ES, Antunes M, Santos DA, Sardinha LB. Sarcopenia and physical independence in older adults: the independent and synergic role of muscle mass and muscle function. J Cachexia Sarcopenia Muscle. 2017;8(2):245–250. doi:10.1002/jcsm.12160
35. Schaap LA, van Schoor NM, Lips P, Visser M. Associations of sarcopenia definitions, and their components, with the incidence of recurrent falling and fractures: the Longitudinal Aging Study Amsterdam. J Gerontol a Biol Sci Med Sci. 2018;73(9):1199–1204. doi:10.1093/gerona/glx245
36. Fearon K, Arends J, Baracos V. Understanding the mechanisms and treatment options in cancer cachexia. Nat Rev Clin Oncol. 2013;10(2):90–99. doi:10.1038/nrclinonc.2012.209
37. Pedersen BK, Febbraio MA. Muscles, exercise and obesity: skeletal muscle as a secretory organ. Nat Rev Endocrinol. 2012;8(8):457–465. doi:10.1038/nrendo.2012.49
38. Quinn LS. Interleukin-15: a muscle-derived cytokine regulating fat-to-lean body composition. J Anim Sci. 2008;86(14 Suppl):E75–E83. doi:10.2527/jas.2007-0458
39. Lutz CT, Quinn LS. Sarcopenia, obesity, and natural killer cell immune senescence in aging: altered cytokine levels as a common mechanism. Aging (Albany NY). 2012;4(8):535–546. doi:10.18632/aging.100482
40. Jordan T, Mastnak DM, Palamar N, Kozjek NR. Nutritional therapy for patients with esophageal cancer. Nutr Cancer. 2018;70(1):23–29. doi:10.1080/01635581.2017.1374417
41. Chowhan NM. Injurious effects of radiation on the esophagus. Am J Gastroenterol. 1990;85(2):115–120.
42. Fietkau R, Lewitzki V, Kuhnt T, et al. A disease-specific enteral nutrition formula improves nutritional status and functional performance in patients with head and neck and esophageal cancer undergoing chemoradiotherapy: results of a randomized, controlled, multicenter trial. Cancer. 2013;119(18):3343–3353. doi:10.1002/cncr.28197
43. Wigmore SJ, Fearon KC, Maingay JP, Ross JA. Down-regulation of the acute-phase response in patients with pancreatic cancer cachexia receiving oral eicosapentaenoic acid is mediated via suppression of interleukin-6. Clin Sci (Lond). 1997;92(2):215–221. doi:10.1042/cs0920215
44. Roxburgh CS, McMillan DC. Role of systemic inflammatory response in predicting survival in patients with primary operable cancer. Future Oncol. 2010;6(1):149–163. doi:10.2217/fon.09.136
45. Mallappa S, Sinha A, Gupta S, Chadwick SJ. Preoperative neutrophil to lymphocyte ratio >5 is a prognostic factor for recurrent colorectal cancer. Colorectal Dis. 2013;15(3):323–328. doi:10.1111/codi.12008
46. Knutson KL, Disis ML. Tumor antigen-specific T helper cells in cancer immunity and immunotherapy. Cancer Immunol Immunother. 2005;54(8):721–728. doi:10.1007/s00262-004-0653-2
47. Sasaki A, Kai S, Endo Y, et al. Prognostic value of preoperative peripheral blood monocyte count in patients with colorectal liver metastasis after liver resection. J Gastrointest Surg. 2007;11(5):596–602. doi:10.1007/s11605-007-0140-0
48. Tham T, Olson C, Khaymovich J, Herman SW, Costantino PD. The lymphocyte-to-monocyte ratio as a prognostic indicator in head and neck cancer: a systematic review and meta-analysis. Eur Arch Otorhinolaryngol. 2018;275(7):1663–1670. doi:10.1007/s00405-018-4972-x
49. Lee SF, Ng TY, Spika D. Prognostic value of lymphocyte-monocyte ratio at diagnosis in hodgkin lymphoma: a meta-analysis. BMC Cancer. 2019;19(1):338. doi:10.1186/s12885-019-5552-1
50. Song W, Wang K, Zhang RJ, Zou SB. Prognostic value of the lymphocyte monocyte ratio in patients with colorectal cancer: a meta-analysis. Medicine (Baltimore). 2016;95(49):e5540. doi:10.1097/MD.0000000000005540
51. Liu JS, Huang Y, Yang X, Feng JF. A nomogram to predict prognostic values of various inflammatory biomarkers in patients with esophageal squamous cell carcinoma. Am J Cancer Res. 2015;5(7):2180–2189.
52. Liu X, Li M, Zhao F, et al. The lymphocyte–monocyte ratio predicts tumor response and survival in patients with locally advanced esophageal cancer who received definitive chemoradiotherapy. Onco Targets Ther. 2015;226:871–877. doi:10.2147/OTT.S124915
53. Patel HJ, Patel BM. TNF-alpha and cancer cachexia: molecular insights and clinical implications. Life Sci. 2017;170:56–63.
54. Wang X, Hu Z, Hu J, Du J, Mitch WE. Insulin resistance accelerates muscle protein degradation: activation of the ubiquitin-proteasome pathway by defects in muscle cell signaling. Endocrinology. 2006;147(9):4160–4168. doi:10.1210/en.2006-0251
 © 2021 The Author(s). This work is published and licensed by Dove Medical Press Limited. The full terms of this license are available at https://www.dovepress.com/terms.php and incorporate the Creative Commons Attribution - Non Commercial (unported, v3.0) License.
By accessing the work you hereby accept the Terms. Non-commercial uses of the work are permitted without any further permission from Dove Medical Press Limited, provided the work is properly attributed. For permission for commercial use of this work, please see paragraphs 4.2 and 5 of our Terms.
© 2021 The Author(s). This work is published and licensed by Dove Medical Press Limited. The full terms of this license are available at https://www.dovepress.com/terms.php and incorporate the Creative Commons Attribution - Non Commercial (unported, v3.0) License.
By accessing the work you hereby accept the Terms. Non-commercial uses of the work are permitted without any further permission from Dove Medical Press Limited, provided the work is properly attributed. For permission for commercial use of this work, please see paragraphs 4.2 and 5 of our Terms.