")
Back to Journals » OncoTargets and Therapy » Volume 11
Prognostic value of nutritional markers in nasopharyngeal carcinoma patients receiving intensity-modulated radiotherapy: a propensity score matching study
Authors Oei RW, Ye L, Huang J, Kong F, Xu T, Shen C, Wang X, He X , Kong L, Hu C, Ying H
Received 9 February 2018
Accepted for publication 26 May 2018
Published 14 August 2018 Volume 2018:11 Pages 4857—4868
DOI https://doi.org/10.2147/OTT.S165133
Checked for plagiarism Yes
Review by Single anonymous peer review
Peer reviewer comments 3
Editor who approved publication: Dr Samir Farghaly
Ronald Wihal Oei,1,2,* Lulu Ye,1,2,* Juan Huang,1,2 Fangfang Kong,1,2 Tingting Xu,1,2 Chunying Shen,1,2 Xiaoshen Wang,1,2 Xiayun He,1,2 Lin Kong,1,2 Chaosu Hu,1,2 Hongmei Ying1,2
1Department of Radiation Oncology, Fudan University Shanghai Cancer Center, Shanghai 200032, People’s Republic of China; 2Department of Oncology, Shanghai Medical College, Fudan University, Shanghai 200032, People’s Republic of China
*These authors contributed equally to this work
Purpose: To investigate the prognostic value of nutritional markers for survival in nasopharyngeal carcinoma (NPC) patients receiving intensity-modulated radiotherapy (IMRT), with or without chemotherapy.
Patients and methods: This retrospective study included 412 NPC patients who received IMRT-based treatment. Weight loss (WL) during treatment, hemoglobin level (Hb) and serum albumin level (Alb) before treatment were measured. The prognostic values of these markers for overall survival (OS), locoregional recurrence-free survival (LRFS) and distant metastasis-free survival (DMFS) were analyzed using Kaplan–Meier method and Cox proportional hazards regression analysis. Propensity score matching was performed to reduce the effect of confounders.
Results: WL, Hb and Alb were significantly correlated with each other and inflammatory markers. Adjusted Cox regression analysis showed that critical weight loss (CWL) (WL≥5%) was an independent prognostic factor for OS (HR: 2.399, 95% CI: 1.267–4.540, P=0.007) and LRFS (HR: 2.041, 95% CI: 1.052–3.960, P=0.035), while low pretreatment Hb was independently associated with poor DMFS (HR: 2.031, 95% CI: 1.144–3.606, P=0.016). However, no significant correlation was found between Alb and survival in our study cohort. The prognostic value of these markers was further confirmed in the propensity-matched analysis.
Conclusion: CWL, Hb and Alb have a significant impact on survival in NPC patients undergoing IMRT. They can be utilized in combination with conventional staging system to predict the prognosis of NPC patients treated with IMRT.
Keywords: weight loss, hemoglobin, albumin, nasopharyngeal carcinoma, intensity-modulated radiotherapy, survival
Introduction
Despite having a low incidence rate globally, nasopharyngeal carcinoma (NPC) is common in China, with incidence rates of 2.8/100,000 person-years in men and 1.9/100,000 person-years in women, and in South-Eastern Asia, with incidence rates of 6.4/100,000 person-years in men and 2.4/100,000 person-years in women.1,2 Compared to other head and neck squamous cell carcinoma (HNSCC), it has strong association with Epstein-Barr virus infection, which is considered as one of the etiologies of NPC, high chemo and radiosensitivity.3,4 Therefore, radiotherapy (RT), with or without chemotherapy, is regarded as the first-line treatment for primary locoregional NPC.5,6
Malnutrition, either at the time of diagnosis or during treatment, is frequently observed among patients with HNSCC.7 Several studies have reported that it is due to complex factors, including tumor- and treatment-related symptoms such as dysphagia, anorexia, odynophagia and compression or obstruction of the food passage.8 Poor nutritional status in cancer patients has been associated with serious clinical consequences such as deteriorated quality of life, treatment toxicity and even a poor prognosis.9 Therefore, nutrition monitoring is crucial, especially for HNSCC patients receiving RT, in order to improve nutritional levels and subsequent treatment outcomes.10,11
Several studies have reported that poor nutritional status is significantly associated with worse survival rates in NPC patients.12–14 However, the patients included were treated with diverse RT techniques. Due to significant differences between RT techniques, we believed that it was necessary to reevaluate certain factors with one specific radiation technique. We wanted to evaluate the prognostic value of nutritional markers in NPC patients treated with intensity-modulated radiotherapy (IMRT)-based therapy, which is considered superior to conventional RT.6,15 In this study, we measured the pretreatment hemoglobin level (pre-Hb), pretreatment serum albumin level (pre-Alb) and the degree of weight loss (WL) during treatment. We then analyzed their impact on treatment outcomes. In addition, propensity score matching (PSM) was performed to reduce the effect of confounders.
Materials and methods
Patients
Between January 2010 and March 2013, a consecutive cohort of primary NPC patients, treated with definitive IMRT-based therapy at Fudan University Shanghai Cancer Center, was enrolled in this study. The main inclusion criteria were: 1) 16 years old or above; 2) histologically proven NPC; 3) Karnofsky performance status (KPS) score ≥80; 4) no evidence of distant metastasis; 5) completion of prescribed treatment; 6) complete data of nutritional parameters including pre- and posttreatment body weight, pre-Hb and pre-Alb. The final study cohort was composed of 412 patients. All patients underwent several pretreatment workup, including complete medical history, physical examination, magnetic resonance imaging (MRI) or computed tomography (CT) scan of the nasopharynx and neck, chest CT, abdominal sonography and when necessary, a whole-body bone scan by single-photon emission CT.
This study was approved by the Institutional Review Board of Fudan University Shanghai Cancer Center and written informed consent was obtained from each patient. For patients who were under the age of 18, the written informed consent was signed by the parents or legal guardians. The study was run in accordance with our institutional policy and also the 1964 Declaration of Helsinki and its later amendments.
Data collection
Clinical data including age, sex, the 7th edition of American Joint Committee on Cancer (AJCC) staging, RT dosage and treatment group (RT alone or combined chemoradiotherapy [CRT]), were obtained from the medical history. Pretreatment body weight was measured within 7 days before treatment and posttreatment body weight was measured within 7 days after the prescribed treatment was completed, using the same scale consistently for all patients. WL was calculated as (posttreatment body weight–pretreatment body weight)/pretreatment body weight×100%. As defined by the International Consensus of Cancer Cachexia,16 a cutoff value of 5% was used to categorize WL during treatment into two subgroups: critical weight loss (CWL) (WL≥5%) and non-CWL (WL <5%). All clinical details were collected by a radiation oncologist who was blind to the treatment outcomes.
Pre-Hb and pre-Alb were obtained within 2 weeks before treatment given. The pre-Hb was measured using an automated hematology analyzer, Sysmex XT-4000i (Sysmex, Kobe, Japan), while the pre-Alb was measured using a chemistry analyzer, cobas 8000 (Roche, Basel, Switzerland). Both the parameters were dichotomized by their median value. In addition, posttreatment hemoglobin level (Hb) and serum albumin level (Alb) were also collected for comparison within 2 weeks after the completion of treatment.
Radiotherapy
All patients were treated using IMRT. CT simulation was performed by following the standard operating procedure. The prescribed dose was: 66–70.4 Gy to the gross tumor volume of nasopharynx in 30–35 fractions (2–2.2 Gy per fraction), 66–70 Gy to the gross tumor volume of metastatic neck lymph nodes, 60 Gy to the high-risk region (clinical target volume [CTV1]) and 54 Gy to the low-risk region (CTV2). The prescribed dose was 66 Gy in 30 fractions (biologically effective dose [BED]: 80.5 Gy) for patients with T1–T2 tumors and 70.4 Gy in 32 fractions (BED: 85.9 Gy) for patients with T3–T4 tumors. Only a small proportion of patients received 70 Gy in 35 fractions (BED: 84 Gy).
Chemotherapy
The chemotherapy methods involved were: induction chemotherapy, concurrent chemoradiotherapy (CCRT) and adjuvant chemotherapy. We recommended RT alone for patients with stage I, CCRT for patients with stage II and either CCRT or induction+adjuvant chemotherapy for patients with stages III–IV.
The most common regimens prescribed for induction and adjuvant chemotherapy were as follows: 1) TPF regimen including docetaxel 60 mg/m2/day, day 1+cisplatin 25 mg/m2/day, days 1–3+5-fluorouracil 0.5 g/m2/day, days 1–3; 2) TP regimen including docetaxel 60 mg/m2/day, day 1+cisplatin 25 mg/m2/day, days 1–3; and 3) GP regimen including gemcitabine 1 g/m2/day, days 1 and 8+cisplatin 25 mg/m2/day, days 1–3. TPF and TP regimen were the first-line chemotherapy regimens. GP regimen was administered in patients with the following clinical conditions: clinical history of peptic ulcer, gastrointestinal bleeding, diabetes, cardiac disease, drugs or food allergy. All regimens were administered intravenously every 3 weeks for 2–3 cycles. CCRT consisted of cisplatin alone with cisplatin 80 mg/m2 given intravenously every 3 weeks for 2–3 cycles.
Follow-up and clinical end points
During treatment, patients were examined in the clinic once a week. Intravenous nutritional support or oral nutritional supplements were administered for patients with poor oral intake and/or treatment-induced oral mucositis grade ≥II, according to the National Cancer Institute Common Terminology Criteria for Adverse Events version 4.0. No gastrostomy was performed on any patients during the treatment period.
After completion of the initial treatment, all patients were followed up every 3 months in the first and second year, every 6–9 months in the third to fifth year and annually thereafter. Patients underwent physical examination, including indirect nasopharyngoscopy and palpation of neck lymph nodes. In addition, MRI of nasopharynx, chest CT scan and abdominal ultrasonography were carried out in the third month and every 6 months afterward. Additional workup was performed in case of any suspicion of locoregional recurrence or distant metastasis. Patients with confirmed locoregional recurrence or distant metastasis were scheduled for further treatment.
The primary end point was overall survival (OS), whereas the secondary end points were locoregional recurrence-free survival (LRFS) and distant metastasis-free survival (DMFS). OS was defined as the time elapsed between the initiation of treatment and death from any cause. LRFS was defined as the length of time between the start of treatment and the first recurrence in nasopharyngeal and/or cervical region. DMFS was defined as the time interval between the beginning of treatment and the first occurrence of distant metastasis.
Statistical analysis
Data analysis was performed using the SPSS version 21.0 (IBM, Armonk, NY, USA). Paired t-test with Bonferroni correction was performed to compare the body weight, Hb and Alb pre- and posttreatment. Chi-squared test (or Fischer’s exact test, if indicated) was used for categorical variables. Survival curves for OS, LRFS and DMFS were obtained using Kaplan–Meier method. Log-rank test and Cox proportional hazards model were performed to explore the significance of tested variables on survival outcomes. Cox proportional hazards model was also used to estimate the HR and 95% CI. Proportional hazard assumption was evaluated graphically using log-minus-log plots. Any result with two-sided P-value <0.05 was considered to be statistically significant.
Furthermore, PSM was done and correlogram created using R version 3.4.0 (The R Foundation of Statistical Computing, Vienna, Austria) to adjust possible bias and confounders. Variables that were used to calculate the propensity score (PS) index were age, sex, tumor classification, nodal classification, the 7th edition of AJCC tumor–node–metastasis (TNM) stage and the radiation dose. This was carried out using the nearest neighbor 1:1 matching in MatchIt package. Also, a correlogram illustrating the correlation between variables was created under the corrplot package.
Results
Patient characteristics
The summary of clinical characteristics of 412 patients is provided in Table 1. The median age was 48 years and the age ranged from 17 to 82 years. The majority of patients (71.1%) were male and the ratio of male to female patients was 2.5:1. According to the 7th edition of AJCC staging system, there were eight patients (2.0%) with stage I, 80 patients (19.4%) with stage II, 199 patients (48.3%) with stage III and 125 patients (30.3%) with stage IV. Overall, 56 patients (13.6%) received RT alone and 356 patients (86.4%) received CRT. In addition, the RT duration ranged from 33 to 61 days, with a median of 44 days.
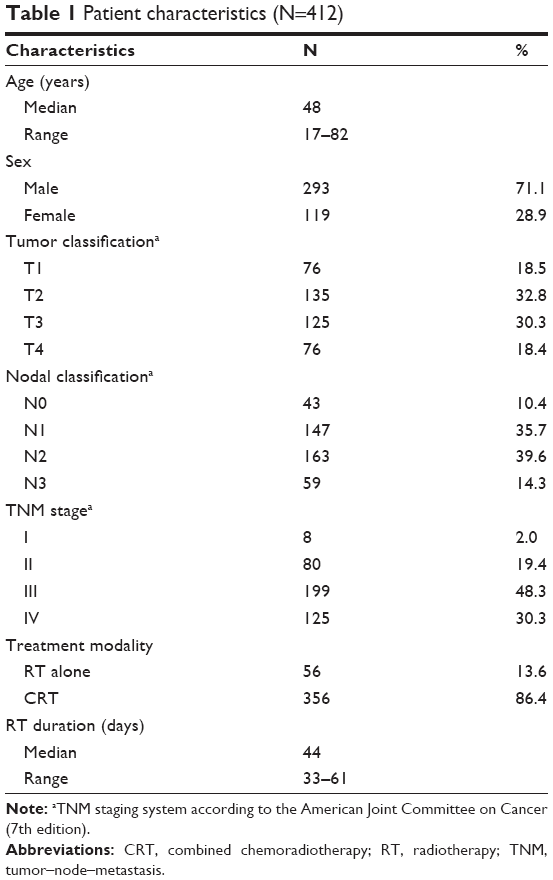 | Table 1 Patient characteristics (N=412) |
The median values of WL and Alb were 8.0% (range: −2.9% to 26.0%) and 42.6 g/L (range: 13.9–53.3 g/L), respectively. The median values of pre-Hb were 134 g/L (range: 74–176 g/L) for men and 121 g/L (range: 91–150 g/L) for women. Based on the median values, we classified pre-Hb and pre-Alb groups into different subgroups: high pre-Hb (≥129.0 g/L) vs low pre-Hb (<129.0 g/L) and high pre-Alb (≥42.6 g/L) vs low pre-Alb (<42.6 g/L).
The median follow-up time was 67.8 months, with the time ranging from 4.8 to 85.5 months. In the entire cohort, the 5-year OS, LRFS and DMFS were 86.0%, 87.1% and 85.3%, respectively.
Association between nutritional markers and other variables
As shown in Table 2, significant differences were observed in terms of age, sex, tumor classification, TNM stage, RT dose and treatment modality between WL subgroups. A higher proportion of patients who received neoadjuvant and/or CCRT showed CWL. There were also a significantly higher proportion of patients of older age and advanced TNM stage in the low pre-Alb subgroup compared with high pre-Alb subgroup. Significant differences in terms of sex, tumor classification, nodal classification and TNM stage were found between the pre-Hb subgroups.
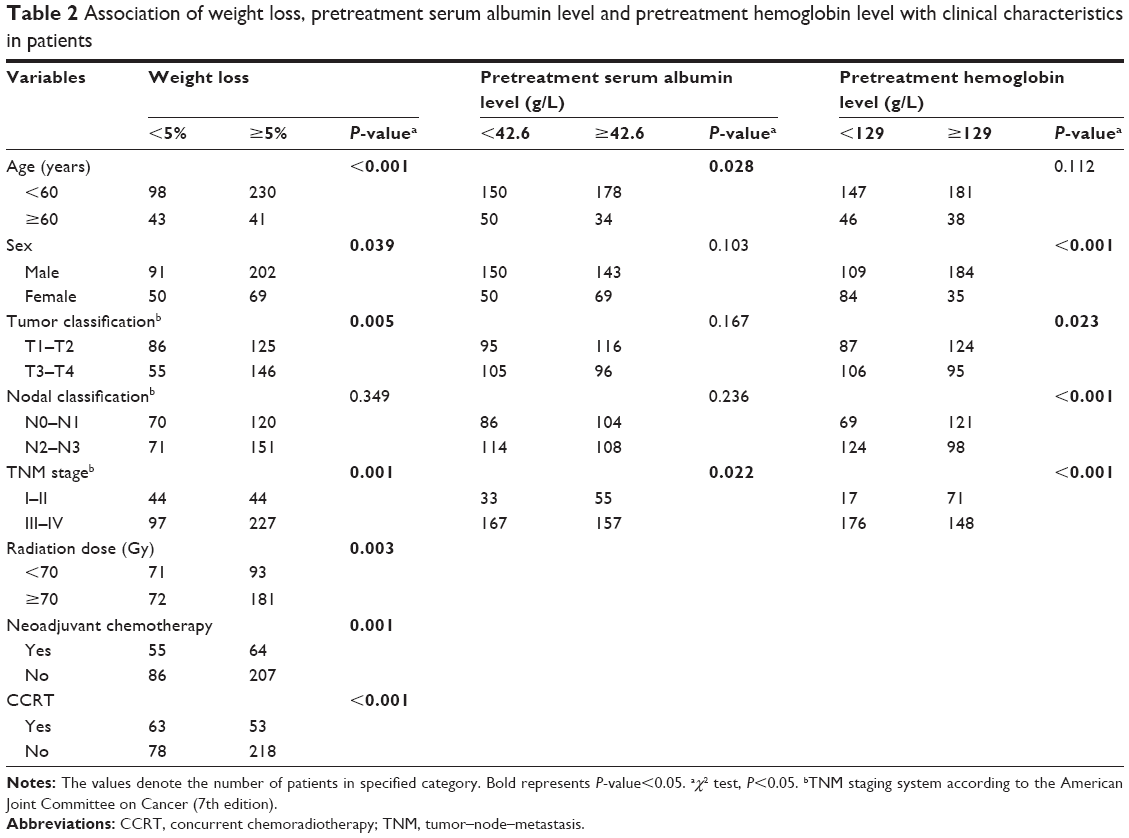 | Table 2 Association of weight loss, pretreatment serum albumin level and pretreatment hemoglobin level with clinical characteristics in patients |
A correlogram shown in Figure 1 further illustrates the correlations between nutritional markers and inflammatory markers, including WL, pre-Alb and pre-Hb, together with pretreatment neutrophil and lymphocyte count. Although the correlation levels were weak to moderate, positive correlation between the markers was observed.
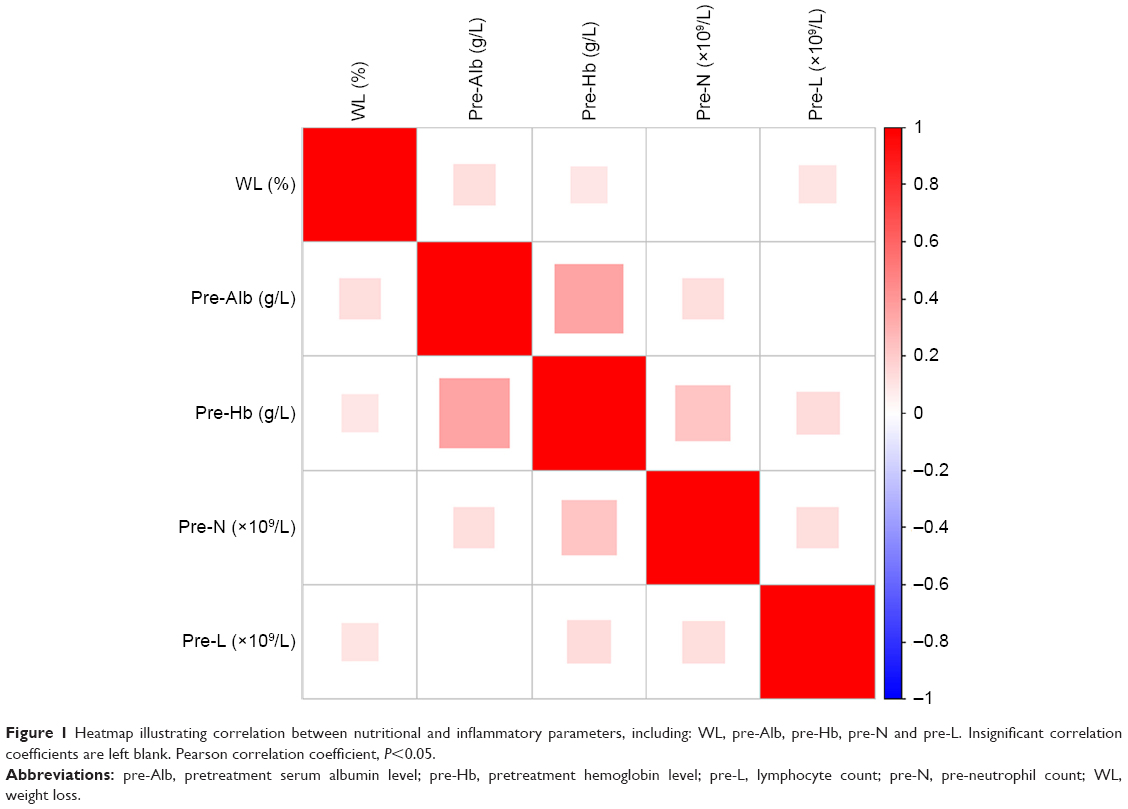 | Figure 1 Heatmap illustrating correlation between nutritional and inflammatory parameters, including: WL, pre-Alb, pre-Hb, pre-N and pre-L. Insignificant correlation coefficients are left blank. Pearson correlation coefficient, P<0.05. |
Posttreatment changes in nutritional markers
Details of pretreatment nutritional markers and their changes at the completion of treatment are provided in Table 3. Body weight, Alb and Hb significantly decreased posttreatment with P-values of <0.001 each. When the data were analyzed separately for male and female patients, similar results were observed in the male group. In the female group, however, only body weight and Alb were found to be significantly decreased at the completion of treatment, but not the Hb.
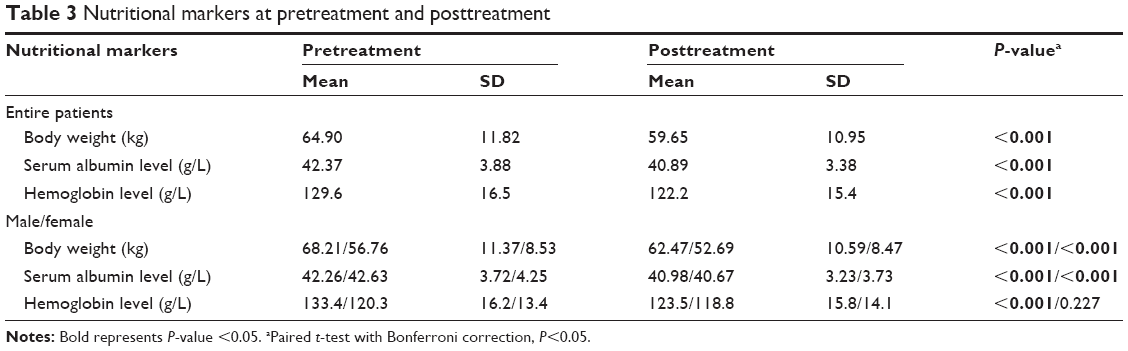 | Table 3 Nutritional markers at pretreatment and posttreatment |
Impact of nutritional markers on survival
Kaplan–Meier method showed that compared with non-CWL group, CWL group had significant decrease in terms of OS (5-year OS: 83.1% vs 91.8%, P=0.023) and LRFS (5-year LRFS: 84.0% vs 93.0%, P=0.027), but not DMFS (5-year DMFS: 83.5% vs 88.8%, P=0.099) (Figure 2). Compared with low pre-Hb group, high pre-Hb group showed superior OS (5-year OS: 88.9% vs 82.9%, P=0.024) and DMFS (5-year DMFS: 90.4% vs 79.4%, P=0.001) (Figure 3). In contrast, statistically significant differences were not observed between pre-Alb subgroups (Figure 4). However, it is worth noting that trends were noticed regarding negative impact of low pre-Alb on survival.
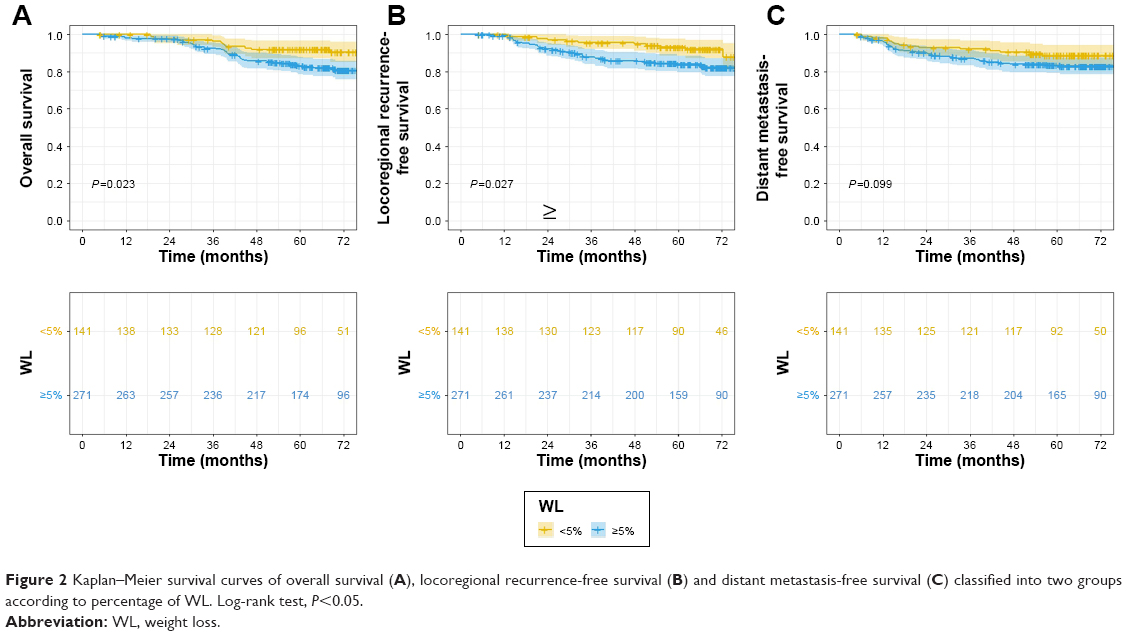 | Figure 2 Kaplan–Meier survival curves of overall survival (A), locoregional recurrence-free survival (B) and distant metastasis-free survival (C) classified into two groups according to percentage of WL. Log-rank test, P<0.05. |
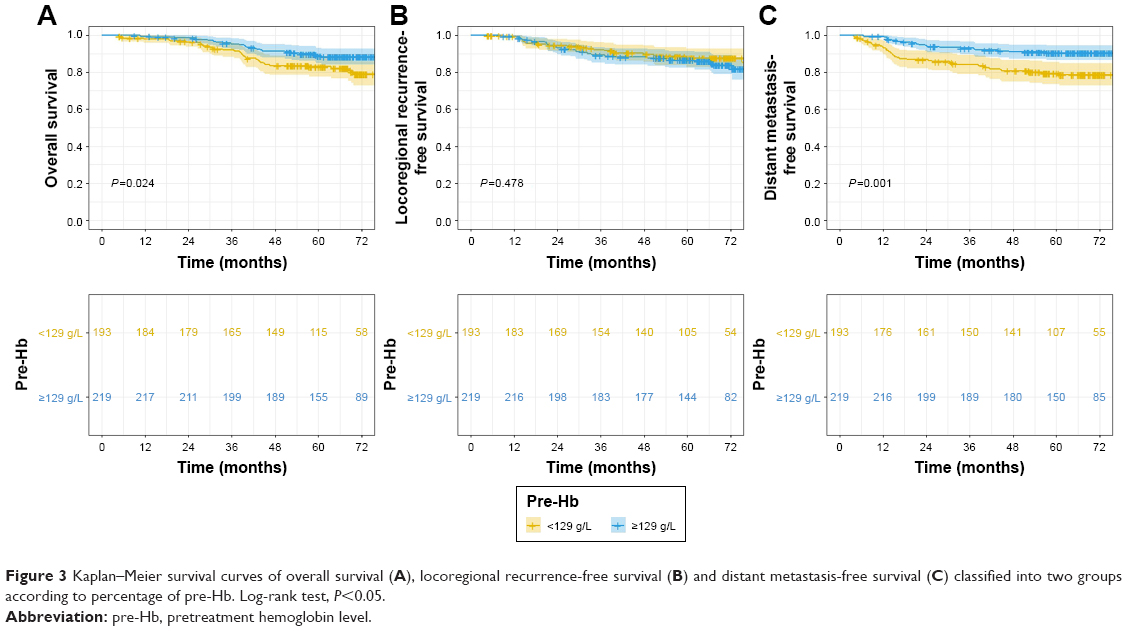 | Figure 3 Kaplan–Meier survival curves of overall survival (A), locoregional recurrence-free survival (B) and distant metastasis-free survival (C) classified into two groups according to percentage of pre-Hb. Log-rank test, P<0.05. |
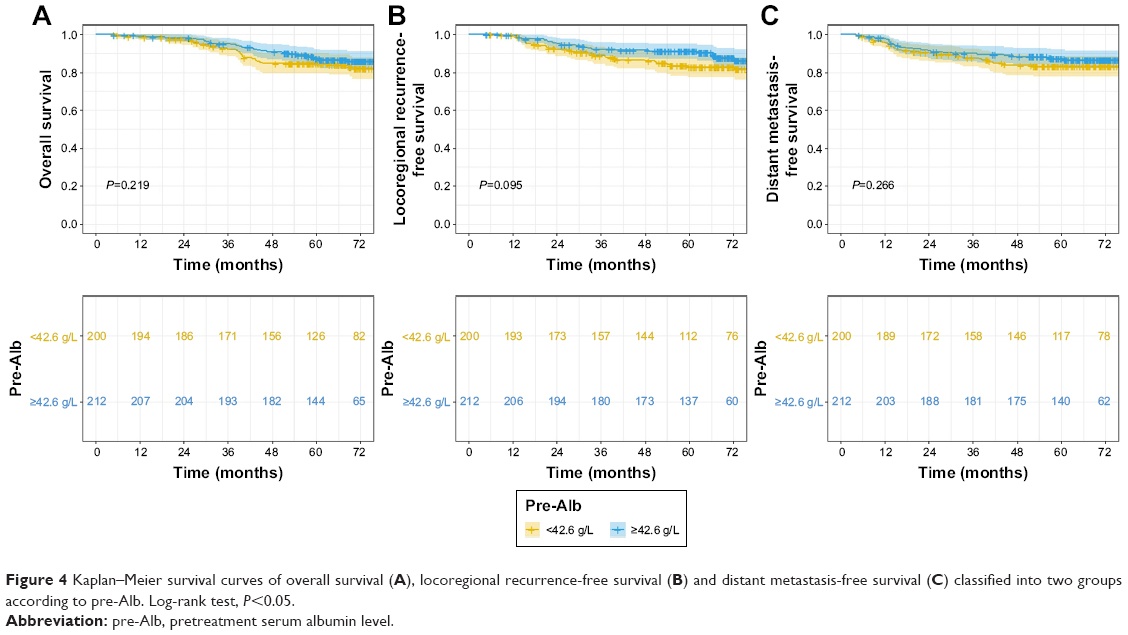 | Figure 4 Kaplan–Meier survival curves of overall survival (A), locoregional recurrence-free survival (B) and distant metastasis-free survival (C) classified into two groups according to pre-Alb. Log-rank test, P<0.05. |
Unadjusted Cox regression analysis revealed that CWL was associated with poor OS (HR: 2.009, 95% CI: 1.088–3.710, P=0.026) and LRFS (HR: 2.026, 95% CI: 1.070–3.836, P=0.030) (Table 4). The pre-Hb was correlated with worse OS (HR: 1.786, 95% CI: 1.072–2.976, P=0.026) and DMFS (HR: 2.311, 95% CI: 1.359–3.928, P=0.002) (Table 4). However, no significant correlation was found between the pre-Alb and survival outcomes (Table 4).
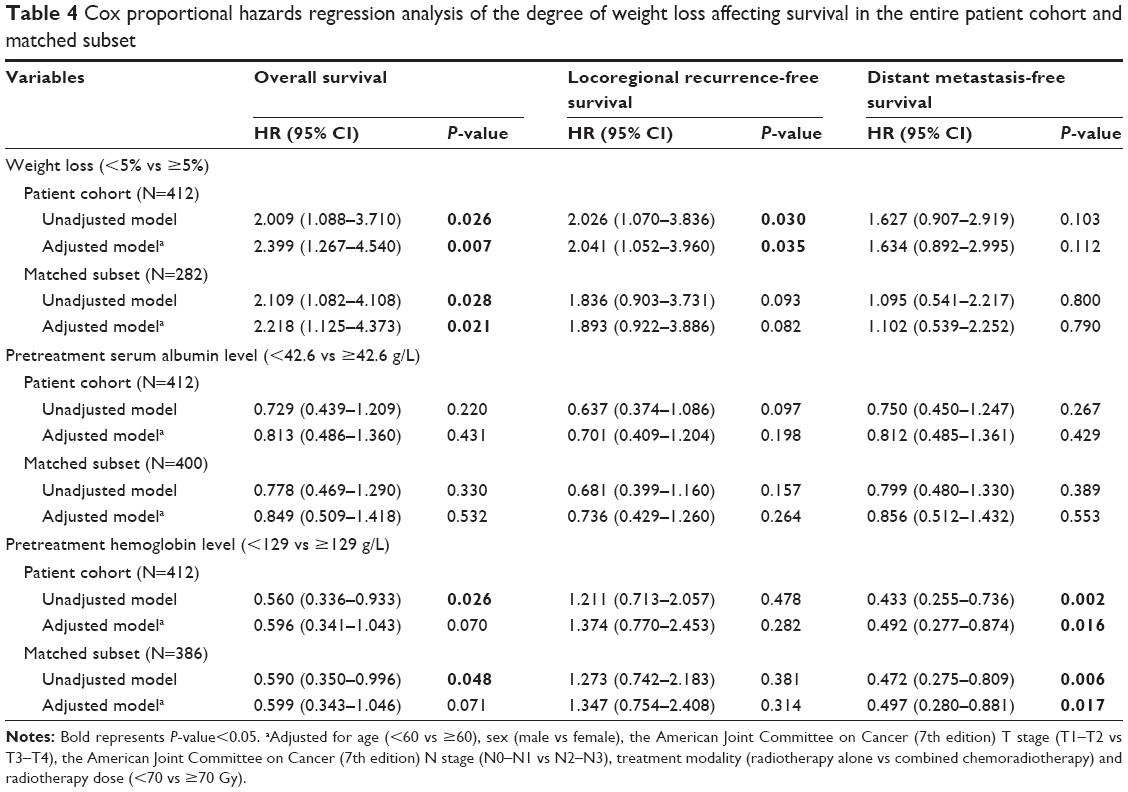 | Table 4 Cox proportional hazards regression analysis of the degree of weight loss affecting survival in the entire patient cohort and matched subset |
In adjusted Cox proportional hazards regression analysis, the following variables were included: age (<60 vs ≥60), sex (male vs female), the AJCC (7th edition) T stage (T1–T2 vs T3–T4), the AJCC (7th edition) N stage (N0–1 vs N2–3), treatment modality (RT alone vs CRT) and RT dose (<70 vs ≥70 Gy). CWL remained correlated with poor OS (HR: 2.399, 95% CI: 1.267–4.540, P=0.007) and LRFS (HR: 2.041, 95% CI: 1.052–3.960, P=0.035) (Table 4). Furthermore, pre-Hb was found to be an independent prognosticator of DMFS (HR: 2.031, 95% CI: 1.144–3.606, P=0.016) (Table 4). Again, no significant correlation was observed between pre-Alb and survival outcomes (Table 4).
Propensity-matched analysis
Given that there were significant differences in the clinical features between subgroups, PSM was performed by matching following parameters: age, sex, tumor classification, nodal classification, TNM stage and radiation dose. After matching, the new patient cohorts consisted of 141 pairs for WL group, 200 pairs for pre-Alb group and 193 pairs for pre-Hb group. Distribution of the PS of the three groups before and after PSM is provided in Figure 5. There were significant discrepancies in the distribution of PS between subgroups before PSM, but the distributions then became similar after PSM.
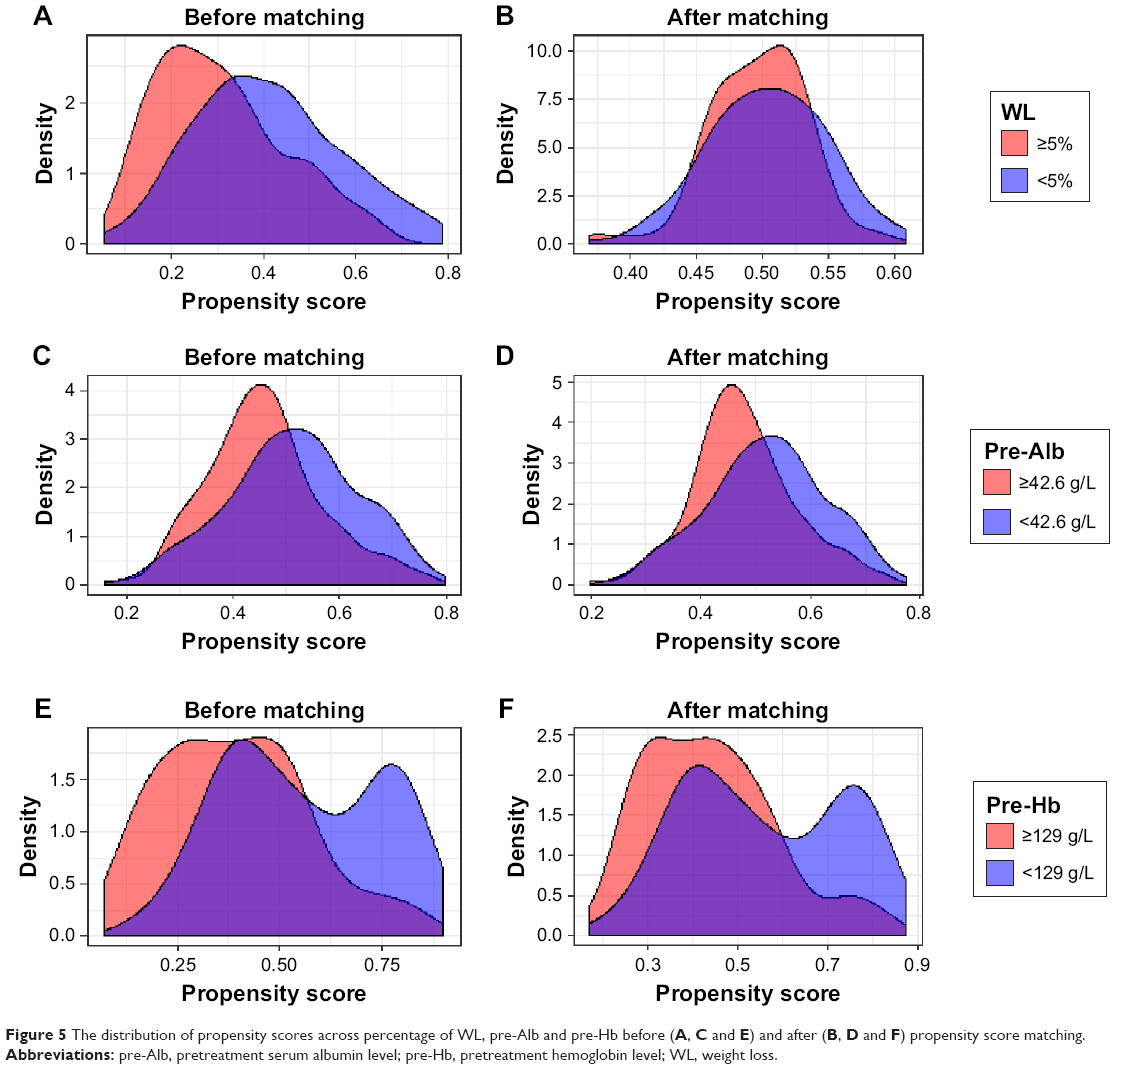 | Figure 5 The distribution of propensity scores across percentage of WL, pre-Alb and pre-Hb before (A, C and E) and after (B, D and F) propensity score matching. |
In the unadjusted Cox regression analysis, CWL was still significantly correlated with OS (HR: 2.109, 95% CI: 1.082–4.108, P=0.028) (Table 4). However, the correlation level between CWL and LRFS was no more significant and was nearly below the significance level. Furthermore, pre-Hb was still a prognosticator of OS (HR: 1.694, 95% CI: 1.004–2.859, P=0.048) and DMFS (HR: 2.120, 95% CI: 1.236–3.634, P=0.006) (Table 4). After adjustment for age (<60 vs ≥60), sex (male vs female), the AJCC (7th edition) T stage (T1–T2 vs T3–T4), the AJCC (7th edition), N stage (N0–1 vs N2–N3), treatment modality (RT alone vs CRT) and RT dose (<70 vs ≥70 Gy), CWL remained an independent prognosticator of poor OS (HR: 2.218, 95% CI: 1.125–4.373, P=0.021), while low pre-Hb was still an independent prognostic factor of worse DMFS (HR: 2.014, 95% CI: 1.136–3.571, P=0.017) (Table 4).
Discussion
In our study cohort, we found that CWL and low pre-Hb were prognosticators of survival in NPC patients. In addition, significant decrease in our variables of interest, body weight, Alb and Hb were observed posttreatment. This could have been caused by many factors that could be simply divided into tumor-related and treatment-related reasons. NPC, with advanced tumor classification, may lead to poor oral intake as the primary tumor often involves the anatomical structure of the masticatory system.17 During IMRT, HNSCC patients are prone to suffer from mucositis, dysphagia and xerostomia,18 which often result in impaired food intake. Kong et al6 reported that mucositis and xerostomia were the most common cause of acute toxicity in NPC patients treated with IMRT. The study revealed that the incidence of mucositis and xerostomia with grade II and above were 81.4% and 30.8%, respectively. Moreover, nutritional markers undergo alteration caused by the treatment due to increase in energy consumption and boosting of protein metabolism.19,20
Previous studies have revealed that malnutrition is correlated with poor treatment outcomes.12,14,21–23 Our present findings show that nutritional markers are independently predictive of NPC survival. CWL was an independent prognostic factor for decreased OS and LRFS. However, no significant association was found between CWL and DMFS status. Similarly, Zeng et al13 analyzed the impact of CWL on NPC survival and reported that CWL was significantly associated with OS and LRFS. We also found that low pre-Hb independently predicted poor DMFS, but no such correlation was found with OS and LRFS, which was in line with the work conducted by Guo et al.23 In contrast, pre-Alb was not found to be correlated with NPC survival. This result was contradictive to a previous study conducted by Li et al,14 which reported that low Alb (≤43.0 g/L) was an independent prognostic factor for OS. We hypothesize that the differences were due to two main causes. First, the selection method used in determining the cutoff value was different. Instead of using receiver operating characteristics curve analysis, we used the median value in order to obtain a more ideal ratio between low and high pre-Alb. Second, most patients were treated with the conventional fractionation RT technique in the previous work, whereas we analyzed only patients treated with the IMRT technique. It is well known that the IMRT technique has significantly improved locoregional control and OS for NPC.6,24 Therefore, we surmised that the pre-Alb does not have significant impact on NPC survival.
Apart from being secondary to decreased intake and loss of nutrients which lead to starvation, the rationale behind malnutrition and its impact on survival in cancer patients may mainly involve systemic inflammation.25 The reason for this phenomenon may be that the human body has several compensative biochemical pathways to reduce the impact of insufficient food ingestion on metabolism,26 while systemic inflammation prevents the activation of such mechanisms, resulting in accelerated energy expenditure and protein metabolism.27 Systemic inflammation is an important part of malignancy.28,29 Recent studies have reported that the TGF-β and PTEN/PI3K/Akt/mTOR pathways, resulting in the activation of transcription factors such as NF-κB and subsequent inflammation responses, have central roles in the progression of HNSCC.30
There are several mechanisms by which systemic inflammation causes poor nutritional status. First, it causes accelerated resting energy expenditure.31 Second, systemic inflammation triggers a cascade of molecular mechanisms, such as increased protein metabolism and functional impairment of the hypothalamus which regulates appetite and satiety.27,32 Furthermore, some proinflammatory cytokines, such as IL-6 and tumor necrosis factor-α, have been reported to induce muscle wasting.33 IL-6 can also invigorate hepcidin, a hormone that modulates intestinal iron absorption, and potentially contribute to low Hb. The above clinical conditions are factors that can lead to unintentional treatment interruptions,34 prolonged hospital stay,35 severe RT-induced late toxicities36 and higher mortality.13,19,23
In addition, a number of studies have reported that Hb is closely associated with tumor oxygenation in locally advanced solid tumors.37,38 The decreased oxygen transport capacity of the circulating blood due to tumor-associated or therapy-induced low Hb may cause tumor hypoxia,39 which is widely known for its role in tumor progression and resistance to treatment.40,41 Previous studies have shown that hypoxic and/or anoxic tissue areas could be seen in up to 60% of solid tumors.38 In normal tissues, this kind of hypoxia can be minimized by increased local blood flow. However, such a compensatory mechanism does not exist in malignant tumors.38 Therefore, low Hb may enhance hypoxia, which results in subsequent poor prognosis.
In the present study, we found that CWL during treatment and pre-Hb were independent prognostic factors of survival in NPC patients undergoing IMRT. Therefore, immunonutritional support to prevent malnourishment is critical. In 2011, Deutz et al42 investigated the impact of specially formulated nutritional supplement, consisting of 40 g of casein- and whey-based protein, 10% free leucine and other essential nutrients in 25 patients with radiographic evidence of malignancy. Increased muscle protein was observed in the experimental group. The conclusion was that the experimental nutritional supplement was able to stimulate muscle protein synthesis. Later, Vasson et al43 analyzed the effect of oral supplementation, which contained arginine, ω-3 fatty acids and nucleotides, in head and neck and esophageal cancer patients treated with CRT. A significant improvement in body weight and plasma antioxidant capacity was noted in the experimental group. The authors concluded that immunonutritional intervention could enhance the nutritional status of head and neck and esophageal cancer patients receiving CRT.
There are several strengths in our current study. We performed PSM analysis in order to make adjustments for possible confounding factors, whereas many earlier studies had analyzed the data without sufficient adjustments for confounders. Thus, their results were prone to misinterpretations due to confounding. Austin44 stated that PSM allows one to design and analyze observational study to mimic randomized controlled trial. We performed PSM in addition to adjusted Cox regression analysis due to different key limitations in both methods.45 Moreover, some authors have suggested that PSM actually outperforms standard multivariable methods.46 However, we believe that neither method was better in this context, and therefore we conducted both in our study. To our knowledge, this is the largest sample size analyzing the impact of CWL on survival in patients treated with IMRT. Moreover, with regard to pre-Hb and Alb, we used the median value as the cutoff point and divided the group into two subgroups. This approach was different from that of previous studies which simply divided the study cohort into anemia and nonanemia groups and hypoalbuminemia and nonhypoalbuminemia groups. We doubt this was an appropriate approach since the reference ranges of these variables were determined based on healthy population. Therefore, a different approach was taken in our study.
However, several limitations in our study should be acknowledged. First, this study was performed in one single institution, which may impact the generalization of our study. Second, weight measurement was not standardized in terms of the time points of measurement, as body weight fluctuates throughout the day. However, the effect of this was considered minor and no such problem found in hematological examinations due to standardized procedures. Due to the above limitations, the relation between nutritional status and survival in patients undergoing IMRT needs to be explored through prospective multi-institutional study. Furthermore, the impact of immunonutritional intervention in this patient cohort also needs further investigation.
Conclusion
To summarize, significant correlation was found between nutritional markers and inflammatory markers. Furthermore, nutritional markers significantly decreased after treatment in NPC patients receiving IMRT. CWL is independently associated with poor OS and LRFS, while low pre-Hb predicts inferior DMFS, independent of other confounding variables. However, pre-Alb is not a prognostic factor for survival in our patient cohort. These results were further confirmed through PSM analysis. Since weight and Hb are routinely and easily measured in many institutions, these can be used to complement the conventional TNM staging system in determining treatment strategies for individual patients and for further enhancing the accuracy of prognosis. Our study suggests that for patients with poor nutritional status, appropriate nutritional support and more frequent posttreatment follow-up should be considered.
Disclosure
The authors report no conflicts of interest in this work.
References
Ferlay J, Soerjomataram I, Dikshit R, et al. Cancer incidence and mortality worldwide: sources, methods and major patterns in GLOBOCAN 2012. Int J Cancer. 2015;136(5):E359–E386. | ||
Cao SM, Simons MJ, Qian CN. The prevalence and prevention of nasopharyngeal carcinoma in China. Chin J Cancer. 2011;30(2):114–119. | ||
Chua MLK, Wee JTS, Hui EP, Chan ATC. Nasopharyngeal carcinoma. Lancet. 2016;387(10022):1012–1024. | ||
zur Hausen H, Schulte-Holthausen H, Klein G, et al. EBV DNA in biopsies of Burkitt tumours and anaplastic carcinomas of the nasopharynx. Nature. 1970;228(5276):1056–1058. | ||
Blanchard P, Lee A, Marguet S, et al. Chemotherapy and radiotherapy in nasopharyngeal carcinoma: an update of the MAC-NPC meta-analysis. Lancet Oncol. 2015;16(6):645–655. | ||
Kong F, Ying H, Huang S, Du C, Zhou J, Hu C. Preliminary results of nasopharyngeal carcinoma treated with intensity-modulated radiotherapy: a retrospective study of 364 patients. Eur Arch Otorhinolaryngol. 2014;271(12):3283–3290. | ||
Capuano G, Gentile PC, Bianciardi F, Tosti M, Palladino A, Di Palma M. Prevalence and influence of malnutrition on quality of life and performance status in patients with locally advanced head and neck cancer before treatment. Support Care Cancer. 2010;18(4):433–437. | ||
Ravasco P, Monteiro-Grillo I, Vidal PM, Camilo ME. Nutritional deterioration in cancer: the role of disease and diet. Clin Oncol. 2003;15(8):443–450. | ||
Ravasco P, Monteiro-Grillo I, Vidal PM, Camilo ME. Cancer: disease and nutrition are key determinants of patients’ quality of life. Support Care Cancer. 2004;12(4):246–252. | ||
Valentini V, Marazzi F, Bossola M, et al. Nutritional counselling and oral nutritional supplements in head and neck cancer patients undergoing chemo-radiotherapy. J Hum Nutr Diet. 2012;25(3):201–208. | ||
Dobrila-Dintinjana R, Trivanovic D, Zelić M, et al. Nutritional support in patients with colorectal cancer during chemotherapy: does it work? Hepato-gastroenterology. 2013;60(123):475–480. | ||
Shen L-J, Chen C, Li B-F, Gao J, Xia Y-F. High weight loss during radiation treatment changes the prognosis in under-normal weight nasopharyngeal carcinoma patients for the worse: a retrospective analysis of 2433 cases. PLoS One. 2013;8(7):e68660. | ||
Zeng Q, Shen LJ, Guo X, Guo XM, Qian CN, Wu PH. Critical weight loss predicts poor prognosis in nasopharyngeal carcinoma. BMC Cancer. 2016;16:169. | ||
Li G, Gao J, Liu ZG, et al. Influence of pretreatment ideal body weight percentile and albumin on prognosis of nasopharyngeal carcinoma: long-term outcomes of 512 patients from a single institution. Head Neck. 2014;36(5):660–666. | ||
Kong F-f, Ying H, Du C-R, Huang S, Zhou J-J, Hu C-S. Effectiveness and toxicities of intensity-modulated radiation therapy for patients with T4 nasopharyngeal carcinoma. PLoS One. 2014;9(3):e91362. | ||
Fearon K, Strasser F, Anker SD, et al. Definition and classification of cancer cachexia: an international consensus. Lancet Oncol. 2011;12(5):489–495. | ||
Xiao Y, Pan J, Chen Y, et al. Prognostic value of MRI-derived masticator space involvement in IMRT-treated nasopharyngeal carcinoma patients. Radiat Oncol. 2015;10:204. | ||
Refaat T, Choi M, Thomas TO, et al. Whole-field sequential intensity-modulated radiotherapy for local-regional advanced head-and-neck squamous cell carcinoma. Am J Clin Oncol. 2015;38(6):588–594. | ||
Moon H, Roh JL, Lee SW, et al. Prognostic value of nutritional and hematologic markers in head and neck squamous cell carcinoma treated by chemoradiotherapy. Radiother Oncol. 2016;118(2):330–334. | ||
Kozak MM, von Eyben R, Pai JS, et al. The prognostic significance of pretreatment hematologic parameters in patients undergoing resection for colorectal cancer. Am J Clin Oncol. 2017;40(4):405–412. | ||
Langius JAE, Bakker S, Rietveld DHF, et al. Critical weight loss is a major prognostic indicator for disease-specific survival in patients with head and neck cancer receiving radiotherapy. Br J Cancer. 2013;109(5):1093–1099. | ||
Fortin A, Wang CS, Vigneault E. Effect of pretreatment anemia on treatment outcome of concurrent radiochemotherapy in patients with head and neck cancer. Int J Radiat Oncol Biol Phys. 2008;72(1):255–260. | ||
Guo S-S, Tang L-Q, Chen Q-Y, et al. Is hemoglobin level in patients with nasopharyngeal carcinoma still a significant prognostic factor in the era of intensity-modulated radiotherapy technology? PLoS One. 2015;10(8):e0136033. | ||
Moon SH, Cho KH, Lee C-G, et al. IMRT vs. 2D-radiotherapy or 3D-conformal radiotherapy of nasopharyngeal carcinoma. Strahlenther Onkol. 2016;192(6):377–385. | ||
Laviano A, Koverech A, Mari A. Cachexia: clinical features when inflammation drives malnutrition. Proc Nutr Soc. 2015;74(4):348–354. | ||
Higginson AD, McNamara JM, Houston AI. The starvation–predation trade-off shapes the strategic use of protein for energy during fasting. J Theor Biol. 2014;359:208–219. | ||
Argiles JM, Busquets S, Stemmler B, Lopez-Soriano FJ. Cancer cachexia: understanding the molecular basis. Nat Rev Cancer. 2014;14(11):754–762. | ||
Mantovani A, Allavena P, Sica A, Balkwill F. Cancer-related inflammation. Nature. 2008;454(7203):436–444. | ||
Candido J, Hagemann T. Cancer-related inflammation. J Clin Immunol. 2013;33 Suppl 1:S79–S84. | ||
Molinolo AA, Amornphimoltham P, Squarize CH, Castilho RM, Patel V, Gutkind JS. Dysregulated molecular networks in head and neck carcinogenesis. Oral Oncol. 2009;45(4–5):324–334. | ||
Falconer JS, Fearon KC, Plester CE, Ross JA, Carter DC. Cytokines, the acute-phase response, and resting energy expenditure in cachectic patients with pancreatic cancer. Ann Surg. 1994;219(4):325–331. | ||
Cohen S, Nathan JA, Goldberg AL. Muscle wasting in disease: molecular mechanisms and promising therapies. Nat Rev Drug Discov. 2015;14(1):58–74. | ||
Argiles JM, Busquets S, Lopez-Soriano FJ. The pivotal role of cytokines in muscle wasting during cancer. Int J Biochem Cell Biol. 2005;37(8):1609–1619. | ||
Kwong DL, Sham JS, Chua DT, Choy DT, Au GK, Wu PM. The effect of interruptions and prolonged treatment time in radiotherapy for nasopharyngeal carcinoma. Int J Radiat Oncol Biol Phys. 1997;39(3):703–710. | ||
Agarwal E, Ferguson M, Banks M, et al. Malnutrition and poor food intake are associated with prolonged hospital stay, frequent readmissions, and greater in-hospital mortality: results from the Nutrition Care Day Survey 2010. Clin Nutr. 2013;32(5):737–745. | ||
Meyer F, Fortin A, Wang CS, Liu G, Bairati I. Predictors of severe acute and late toxicities in patients with localized head-and-neck cancer treated with radiation therapy. Int J Radiat Oncol Biol Phys. 2012;82(4):1454–1462. | ||
Hoff CM. Importance of hemoglobin concentration and its modification for the outcome of head and neck cancer patients treated with radiotherapy. Acta Oncol. 2012;51(4):419–432. | ||
Vaupel P, Mayer A, Hockel M. Impact of hemoglobin levels on tumor oxygenation: the higher, the better? Strahlenther Onkol. 2006;182(2):63–71. | ||
Vaupel P, Mayer A. Hypoxia and anemia: effects on tumor biology and treatment resistance. Transfus Clin Biol. 2005;12(1):5–10. | ||
Henke M, Bechtold C, Momm F, Dörr W, Guttenberger R. Blood hemoglobin level may affect radiosensitivity-preliminary results on acutely reacting normal tissues. Int J Radiat Oncol Biol Phys. 2000;48(2):339–345. | ||
Vaupel P, Thews O, Hoeckel M. Treatment resistance of solid tumors: role of hypoxia and anemia. Med Oncol. 2001;18(4):243–259. | ||
Deutz NEP, Safar A, Schutzler S, et al. Muscle protein synthesis in cancer patients can be stimulated with a specially formulated medical food. Clin Nutr. 2011;30(6):759–768. | ||
Vasson MP, Talvas J, Perche O, et al. Immunonutrition improves functional capacities in head and neck and esophageal cancer patients undergoing radiochemotherapy: a randomized clinical trial. Clin Nutr. 2014;33(2):204–210. | ||
Austin PC. An introduction to propensity score methods for reducing the effects of confounding in observational studies. Multivariate Behav Res. 2011;46(3):399–424. | ||
Biondi-Zoccai G, Romagnoli E, Agostoni P, et al. Are propensity scores really superior to standard multivariable analysis? Contemp Clin Trials. 2011;32(5):731–740. | ||
Martens EP, Pestman WR, de Boer A, Belitser SV, Klungel OH. Systematic differences in treatment effect estimates between propensity score methods and logistic regression. Int J Epidemiol. 2008;37(5):1142–1147. |
 © 2018 The Author(s). This work is published and licensed by Dove Medical Press Limited. The full terms of this license are available at https://www.dovepress.com/terms.php and incorporate the Creative Commons Attribution - Non Commercial (unported, v3.0) License.
By accessing the work you hereby accept the Terms. Non-commercial uses of the work are permitted without any further permission from Dove Medical Press Limited, provided the work is properly attributed. For permission for commercial use of this work, please see paragraphs 4.2 and 5 of our Terms.
© 2018 The Author(s). This work is published and licensed by Dove Medical Press Limited. The full terms of this license are available at https://www.dovepress.com/terms.php and incorporate the Creative Commons Attribution - Non Commercial (unported, v3.0) License.
By accessing the work you hereby accept the Terms. Non-commercial uses of the work are permitted without any further permission from Dove Medical Press Limited, provided the work is properly attributed. For permission for commercial use of this work, please see paragraphs 4.2 and 5 of our Terms.