")
Back to Journals » International Journal of General Medicine » Volume 14
Prognostic Value of Metabolism-Related Genes and Immune Infiltration in Clear Cell Renal Cell Carcinoma
Received 6 July 2021
Accepted for publication 5 October 2021
Published 18 October 2021 Volume 2021:14 Pages 6885—6898
DOI https://doi.org/10.2147/IJGM.S328109
Checked for plagiarism Yes
Review by Single anonymous peer review
Peer reviewer comments 3
Editor who approved publication: Dr Scott Fraser
Hanwen Li,1– 4 Zengnan Mo1– 4
1Department of Urology, The First Affiliated Hospital of Guangxi Medical University, Nanning, 530021, Guangxi, People’s Republic of China; 2Center for Genomic and Personalized Medicine, Guangxi Medical University, Nanning, 530021, Guangxi, People’s Republic of China; 3Guangxi Collaborative Innovation Center for Genomic and Personalized Medicine, Nanning, 530021, Guangxi, People’s Republic of China; 4Guangxi Key Laboratory for Genomic and Personalized Medicine, Guangxi Key Laboratory of Colleges and Universities, Nanning, 530021, Guangxi, People’s Republic of China
Correspondence: Zengnan Mo
Center for Genomic and Personalized Medicine, Guangxi Medical University, Nanning, 530021, Guangxi, People’s Republic of China
Tel +86-13878893666
Email [email protected]
Background: Clear cell renal cell carcinoma (ccRCC) is one of the most prevalent cancers. Thus, it is warranted to detect the status of metabolism-related genes (MRGs) and infiltrating immune cells in ccRCC progression for the prognosis of ccRCC. This research was designed to establish and verify the prognostic signature of ccRCC using MRGs. In addition, we investigated the potential link between the relative proportion of tumor infiltrated immune cells (TIICs) and ccRCC prognosis.
Methods: Sequencing data of metabolism-related gene sets in ccRCC cases were obtained from The Cancer Genome Atlas database (TCGA) and Gene Expression Omnibus Database (GEO). The R Programming Language software packages were applied for differential analysis of MRGs. First, a univariate Cox regression model was applied to determine the MRGs linked with overall survival (OS). Then, the multivariate Cox regression model was applied to establish the prognostic signature. Finally, the CIBERSORT algorithm was used to determine the proportion of TIICs.
Results: Overall, 286 differentially expressed MRGs were identified in the TCGA dataset. Univariate and multivariate Cox regression models were applied to develop a prognostic signature with six MRGs. The predictive capability of the prognostic signature was further verified by TCGA and GEO database. In addition, RS positively correlated with memory B cells, plasma cells, activated memory CD4+ T cells, follicular helper T cells, regulatory T cells, CD8+ T cells, and M0 macrophages, and were negatively associated with resting memory CD4+ T cells, resting dendritic cells, activated dendritic cells, M2 macrophages, monocytes, resting mast cells, and eosinophils.
Conclusion: Herein, a prognostic signature was developed using MRGs for ccRCC prognosis. The proportion of 22 TIICs in ccRCC and the association between TIICs and clinical outcomes were also determined. The identified genes and cells could guide future targeted therapy and immunotherapy.
Keywords: altered metabolism, immunization, clear cell renal cell carcinoma, prognostic markers
Introduction
Renal cell carcinoma (RCC) is the most frequent renal cancer threatening human health.1 Clear cell renal cell carcinoma (ccRCC), chromophobe renal cell carcinoma (chRCC), and papillary renal cell carcinoma (pRCC), are the most frequently histopathologic subtypes of RCC.2,3 However, ccRCC is the most prevalent worldwide.4 ccRCC is invasive cancer originating predominantly from the proximal renal tubular epithelium.5 About 140,000 ccRCC-related deaths occur annually worldwide.6 Although ccRCC can be successfully treated by surgery or radiofrequency ablation if detected at an early stage, the disease is usually asymptomatic and is occasionally diagnosed by imaging. In contrast, up to 1/3 of patients have metastases, and metastatic ccRCC has a high mortality rate due to poor response to radiotherapy and chemotherapy.7–10 For example, tyrosine kinase inhibitors currently used in ccRCC therapy act on vascular endothelial growth factor receptor (VEGFR) and target tumor angiogenesis. For example, tyrosine kinase inhibitors currently used in ccRCC therapy act on vascular endothelial growth factor receptor (VEGFR) and target tumor angiogenesis.11 Although tyrosine kinase inhibitors have significantly improved ccRCC prognosis, only 11.7% of patients with metastatic ccRCC can survive for five years.12 Therefore, it is necessary to identify a novel promising therapeutic and prognostic biomarker for the clinical treatment of ccRCC.
Metabolic changes are ubiquitous in several human cancer tissues. For instance, the Warburg effect converts glucose into lactic acid despite the presence of oxygen, causing proliferation and increasing biosynthetic demands of cancer cells.13,14 Similar changes occur in the tumor microenvironment (TME) of ccRCC. Multi-omics studies have discovered some metabolic alterations in ccRCC that included the tricarboxylic acid (TCA), pentose phosphate, and phosphoinositide 3‑kinase (PI3K) pathways,5 and it has been shown that changes in specific intermediates of these pathways are associated with poor prognosis.15–17 These findings indicate that metabolic alteration is associated with ccRCC development and prognosis. ccRCC is characterized by dysregulation of cellular metabolism changes, including increasing glycogen and fat deposition.18 Therefore, metabolic abnormalities provide new insights into ccRCC development, providing novel targets for therapeutic intervention and diagnosis. Interestingly, immunity plays an essential role in the progression of various cancers. The immune escape ability or immune surveillance are associated with effective amplification and metastasis of cancer.19 However, the effects of different types of immune cells in the initiation and progression of ccRCC are unclear.20
Herein, the differentially expressed MRGs were obtained from TCGA, Kyoto Encyclopedia of Genes and Genomes (KEGG), and Gene Ontology (GO) databases. First, the univariate Cox model was applied to pick MRGs associated with the OS of ccRCC. Lasso and multivariate Cox regression models were then applied to construct a prognostic signature with six key MRGs. Finally, we used the CIBERSORT algorithm to estimate the proportion of TIICs in cancer and normal tissues of the TCGA database. The above results were further validated via the GEO database. The objective of this research is to determine therapeutic targets and prognostic biomarkers for ccRCC patients.
Materials and Methods
Raw Data
The transcriptome data and clinical characteristics of 539 ccRCC and 72 normal samples were obtained from the TCGA database (https://portal.gdc.cancer.gov/). GSE53757 and GSE29609 datasets were obtained from the GEO database (https://www.ncbi.nlm.nih.gov/geo/). Pathways with gene symbols were downloaded from KEGG (https://www.kegg.jp/kegg/) and GO (http://geneontology.org/). MRGs were extracted for further analysis.
Screening of Differentially Expressed MRGs
Limma package of R software was utilized to screen the differentially expressed MRGs. ggplot2 package was used for the heatmap and volcano plots. The thresholds were set as |logFC| > 1 and false discovery rate as (FDR) < 0.05.
Construction of Metabolism-Related Prognostic Signature
Univariate Cox regression model was used to obtain prognostic MRGs, and Lasso regression and multivariate Cox regression model (stepwise models) were used for further screening. A prognostic signature was then built. We then computed the risk score for each patients as follows: Risk score(RS) = (expression of mRNA1 *Coefficient of mRNA1) + (expression of mRNA2 *Coefficient of mRNA2) + (expression of mRNAn *Coefficient mRNAn).21 ccRCC cases were grouped using the median value of RS, namely high-RS group, and low-RS group. Finally, Kaplan-Meier survival analysis was conducted using the R package survival. The R packages survivalROC, survminer, and rms were used to plot ROC curves, nomogram, and a calibration curve of prognostic signature, respectively. Statistical significance was set at P < 0.05.
TIICs Analysis
The CIBERSORT algorithm was used to estimate the proportion of 22 immune cells by identifying the cell composition of cancer tissues from their genetic expression.22 CIBERSORT algorithm was also used to calculate the proportion of immune cells in all samples in the TCGA-KIRC cohort. Samples with P<0.05 were screened for further analysis. Spearman rank correlation was used to analyze the relationship between risk score (RS) and the proportion of immune cells. Kaplan-Meier was applied to analyze the correlation between the proportion of immune cells and overall survival (OS) and the relationship between immune cells and the prognostic signature in ccRCC patients. P <0.05 was considered statistically significant.
Results
Identification of Differentially Expressed MRGs
Through the metabolic-related pathway in the KEGG and GO databases, we obtained a total of 940 MRGs. Their expression matrices were obtained from the TCGA-KIRC cohort for subsequent differential analysis. A total of 286 differentially expressed MRGs (109 upregulated and 177 downregulated) were obtained from tumor and normal samples in the TCGA database, using |logFC| > 1 and FDR< 0.05 as the threshold. These were expressed in a heatmap (Figures 1A and B). Next, the 286 differentially expressed MRGs were subjected to pathway enrichment analysis in GO and KEGG database, which pointed out that the MRGs were highly enriched in small molecule catabolic process, mitochondrial matrix, and coenzyme binding (Figure 1C). KEGG pathway analysis of carbon, purine, arachidonic acid, and retinal metabolism is shown in Figure 1D. Taken together, functional enrichment analyses demonstrated that the differentially expressed MRGs were invariably enriched in the catabolic process of nutrients and mitochondria-related physiological functions.
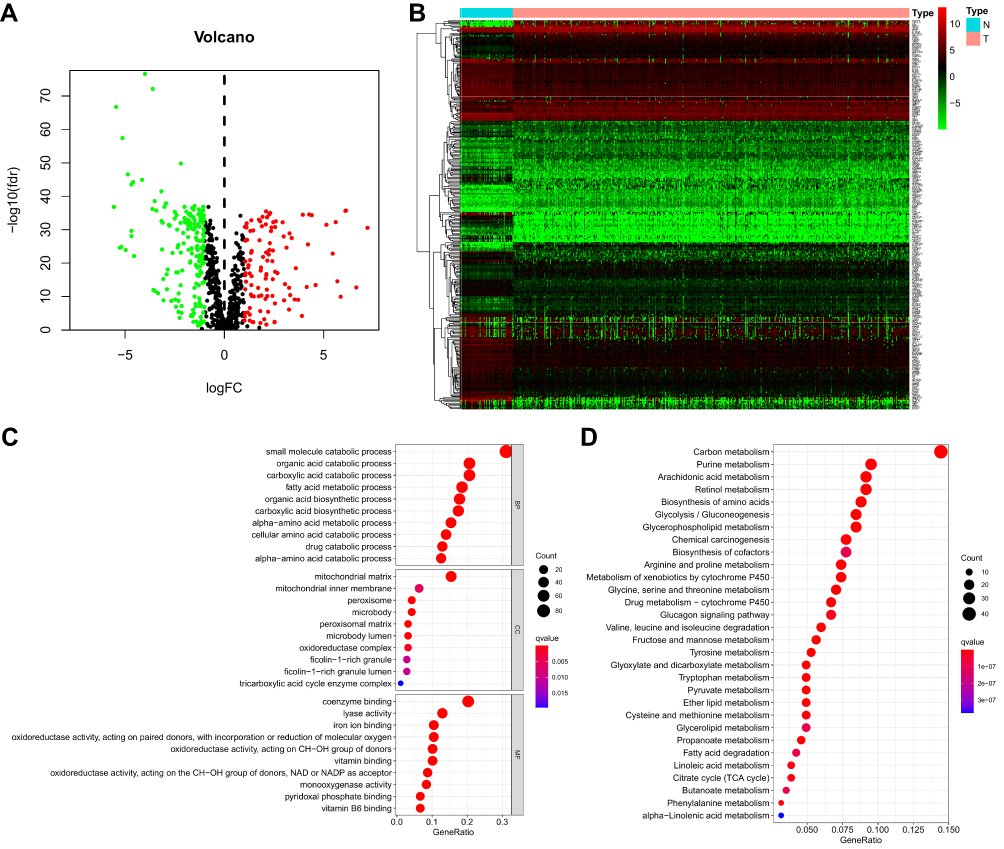 |
Figure 1 Identification of a metabolism-related signature and gene functional enrichment analysis. (A) Volcano plot of DEMRGs: red indicates upregulated MRGs, green indicates downregulated MRGs, and black indicates MRGs that were not significantly differentially expressed. (B) Heatmap of MRGs in KIRC and normal kidney tissues in the TCGA database; Green to red represents the progression from low expression level to high expression level. (C) GO-term function enrichment analysis of MRGs. BP-biological process, CC-cellular component, MF-molecular function. (D) KEGG analysis of MRGs. |
Construction of Metabolism‐Related Prognostic Signature
Univariate Cox regression models were applied to obtain differentially expressed MRGs affecting patient’s OS. A total of 96 MEGs were identified. Lasso regression (Figure 2A and B) and multivariate Cox regression models (Figure 2C) were then applied to confirm the key MRGs. Six MRGs, including PLA2G6, PAFAH2, PYCR1, CYP3A7, RRM2, and ALDH6A1, were identified. Afterward, a metabolism-related prognostic signature was constructed using the six MRGs.
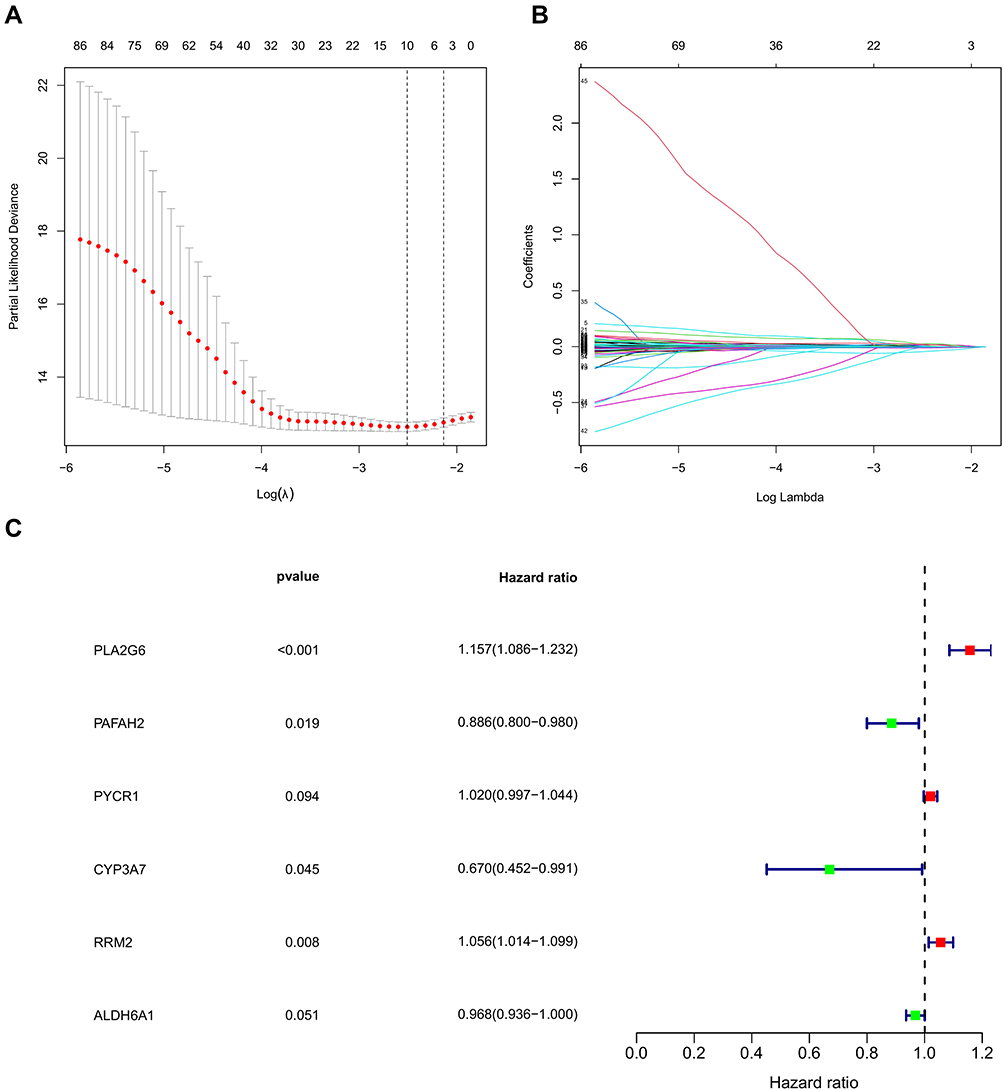 |
Figure 2 Establishment of metabolism-related prognostic signature. (A and B) Lasso Cox regression algorithm. (C) Forrest plot of the multivariate Cox regression analysis results (P < 0.05). |
Verification of the Prognostic Signature Using TCGA and GEO Databases
A nomogram was constructed to predict the OS of ccRCC (Figure 3A). The calibration curve of the nomogram showed the predicted survival rates for each OS are highly consistent with observed data. (Figure 3B–D). The RS of ccRCC cases in the TCGA was calculated, dividing the cases into either high- or low-RS groups according to the median value. Heatmap showing the expression level of genes in the metabolism-related prognostic signature, RS distribution, and survival status of ccRCC cases are demonstrated in Figure 3E–G. Kaplan–Meier survival analysis showed that the clinical outcome of the patients was worse in the high-RS group than in the low-RS group in the TCGA database (P < 0.001; Figure 3H). The area under the curve (AUC) for OS of the prognostic signature was 0.740, 0.729, and 0.756, indicating high sensitivity and specificity (Figure 3I). Similar results were further validated using the KIRC cases in GEO databases (P = 0.008; Figure 4). Then we performed univariate and multivariate Cox regression analysis models to evaluate the independent prognostic ability of the signature. The results point out that age, grade, stage, and riskScore were markedly associated with OS (Figure 5A; p < 0.001), and these factors could present as independent prognostic predictor (Figure 5B; p < 0.01).
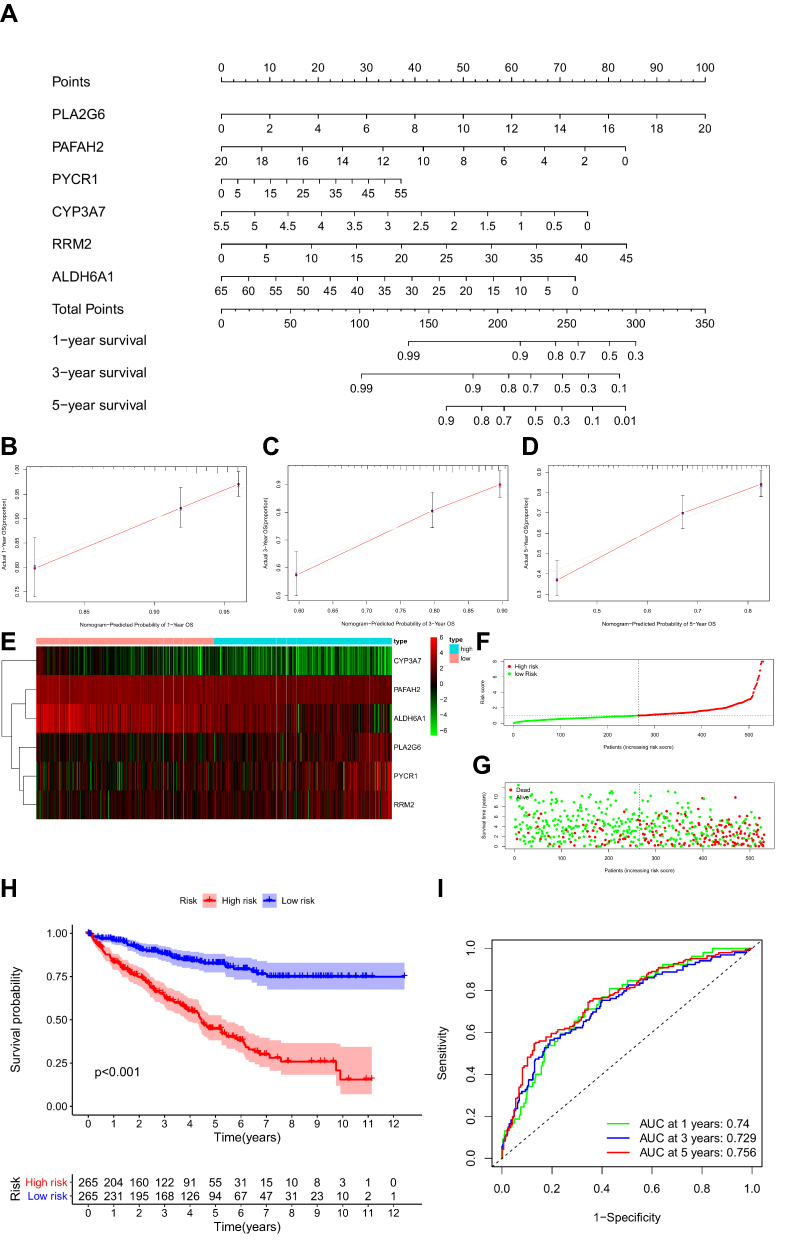 |
Figure 3 Development of metabolism-related prognostic signature of ccRCC patients in the TCGA database. (A) A nomogram based on the signature in ccRCC patients at 1, 3, and 5 years. (B–D) Calibration curves of the nomogram for the signature at 1, 3, and 5 years. (E) Heatmap of the metabolism-related gene expression in the TCGA database. (F) Risk plot showing each point based on the risk score. (G) Survival status of ccRCC patients. (H) Kaplan-Meier plot for overall survival (OS) based on risk score of the six MRGs-based signature of ccRCC patients in the TCGA database. (I) Time-independent ROC analysis of risk scores for OS prediction in the TCGA database. |
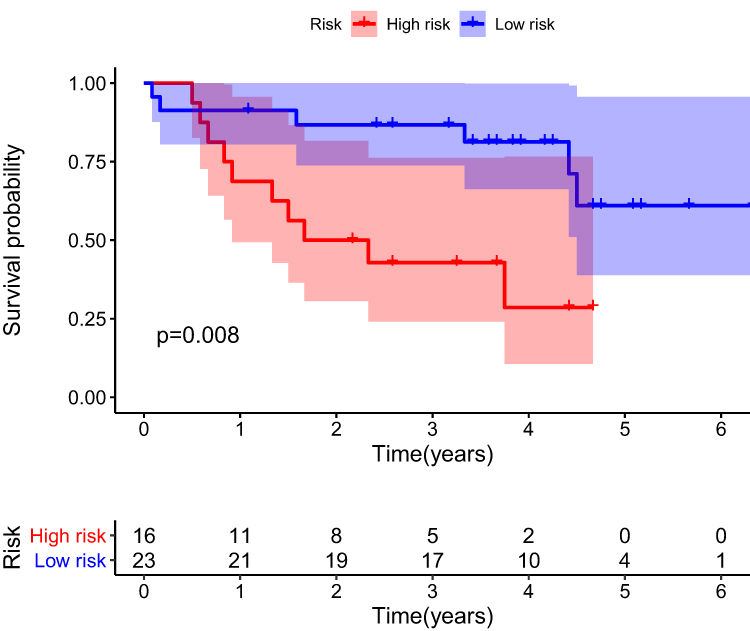 |
Figure 4 Kaplan-Meier plot for OS based on the risk score of the six MRGs-based signatures of ccRCC patients in the GEO database. |
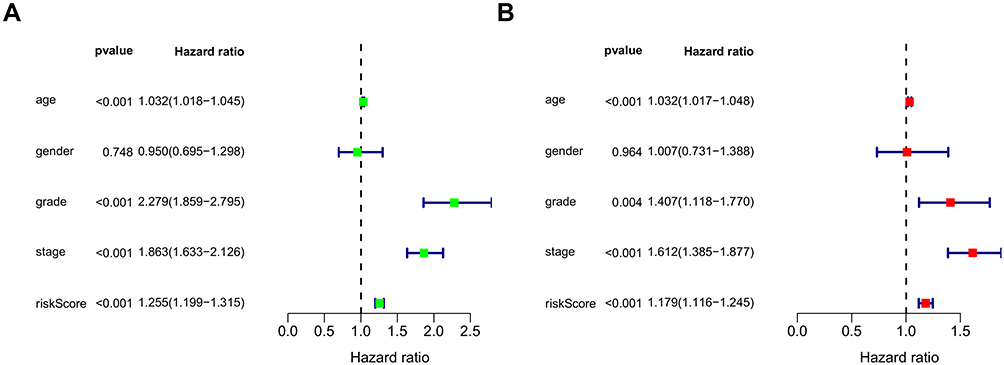 |
Figure 5 Univariate (A) and multivariate (B) independent prognostic analysis of independent risk factors for OS in patients with ccRCC. |
Analysis of Critical MRGs Expression Levels in the Prognostic Signature
mRNA expression levels were analyzed to determine the transcription level of the six MRGs using the TCGA database. PLA2G6, PYCR1, and RRM2 expression levels were significantly upregulated in tumor tissues compared to normal tissues. However, ALDH6A1, CYP3A7, and PAFAH2 expression levels were significantly downregulated in normal tissues (Figure 6). The high expression level of PYCR1, PLA2G6, and RRM2 was associated with markedly poorer OS, while the high expression level of ALDH6A1, CYP3A7, and PAFAH2 was correlated with better survival outcomes (Figure 7). Overall, these results reveal that these MRGs play distinct roles in ccRCC progression.
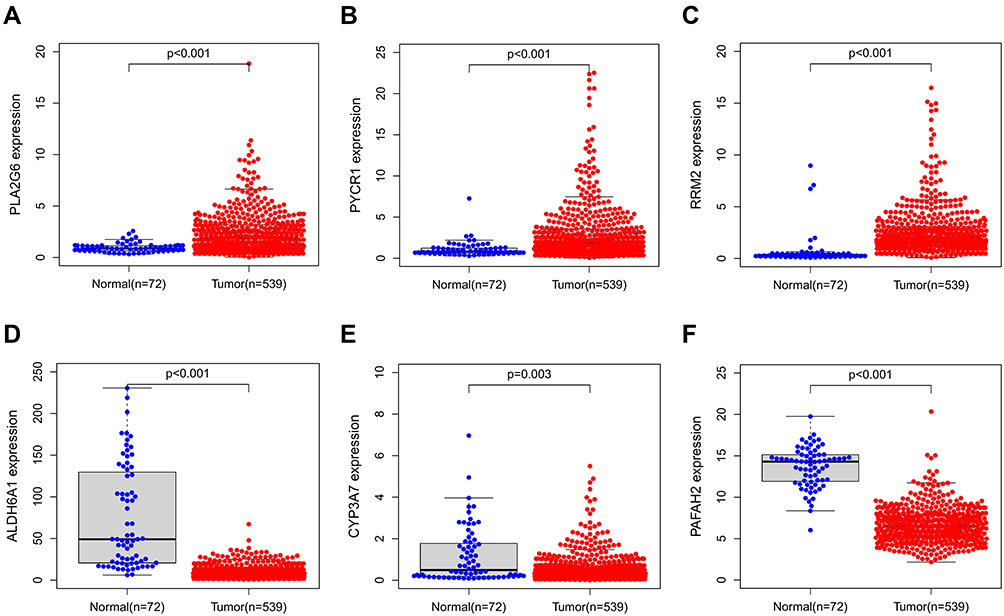 |
Figure 6 MRGs expression in the TCGA database (P < 0.05). (A) Expression level of PLA2G6, (B) PYCR1, (C) RRM2, (D) ALDH6A1, (E) CYP3A7, and (F) PAFAH2. |
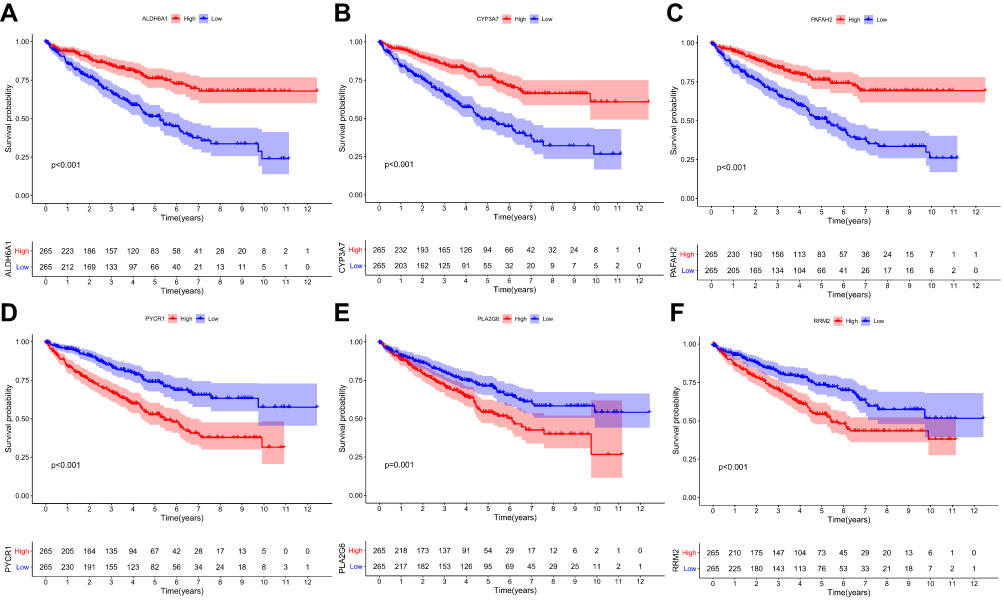 |
Figure 7 The relationship between MRGs expression and OS of ccRCC patients in the TCGA database (P < 0.05). (A) The relationship between ALDH6A1 and OS, (B) CYP3A7 and OS, (C) PAFAH2 and OS., (D) PYCR1 and OS, (E) PLA2G6 and OS, and (F) RRM2 and OS. |
The Landscape of Immune Infiltration in ccRCC
The landscape of TIICs in all ccRCC cases was described by applying the CIBERSORT algorithm. A heatmap plot illustrating the relative abundance of TIIC subpopulations is shown in Figure 8A. Differential analysis indicated that tumor tissues harbored a higher level of naive B cells, plasma cells, CD8+ T cells, naive CD4+ T cells, resting memory CD4+ T cells, follicular helper T cells, regulatory T cells (Tregs), M0 macrophages, M1 macrophages, and resting dendritic cells than the normal tissues. However, naive B cells, naive CD4+ T cells, resting memory CD4+ T cells, monocytes, resting dendritic cells, and resting mast cells fractions were relatively lower in the tumor samples than in the normal tissues (Figure 8B). Notably, the relative proportions of TIICs were correlated in tumor tissues (Figure 8C). CD8+ T cells and follicular helper T cells had the most significant positive correlation (Pearson correlation = 0.58), while CD8+ T and resting memory CD4+ T cells had the most significant negative correlation (Pearson correlation = 0.62). Another point worth mentioning is that CD8+ T cells also had a moderate negative correlation with M2 macrophages (Pearson correlation = 0.51). The above results demonstrate that various immune cells interact or constrain each other in the tumor microenvironment of ccRCC, changing dynamically with tumor progression.
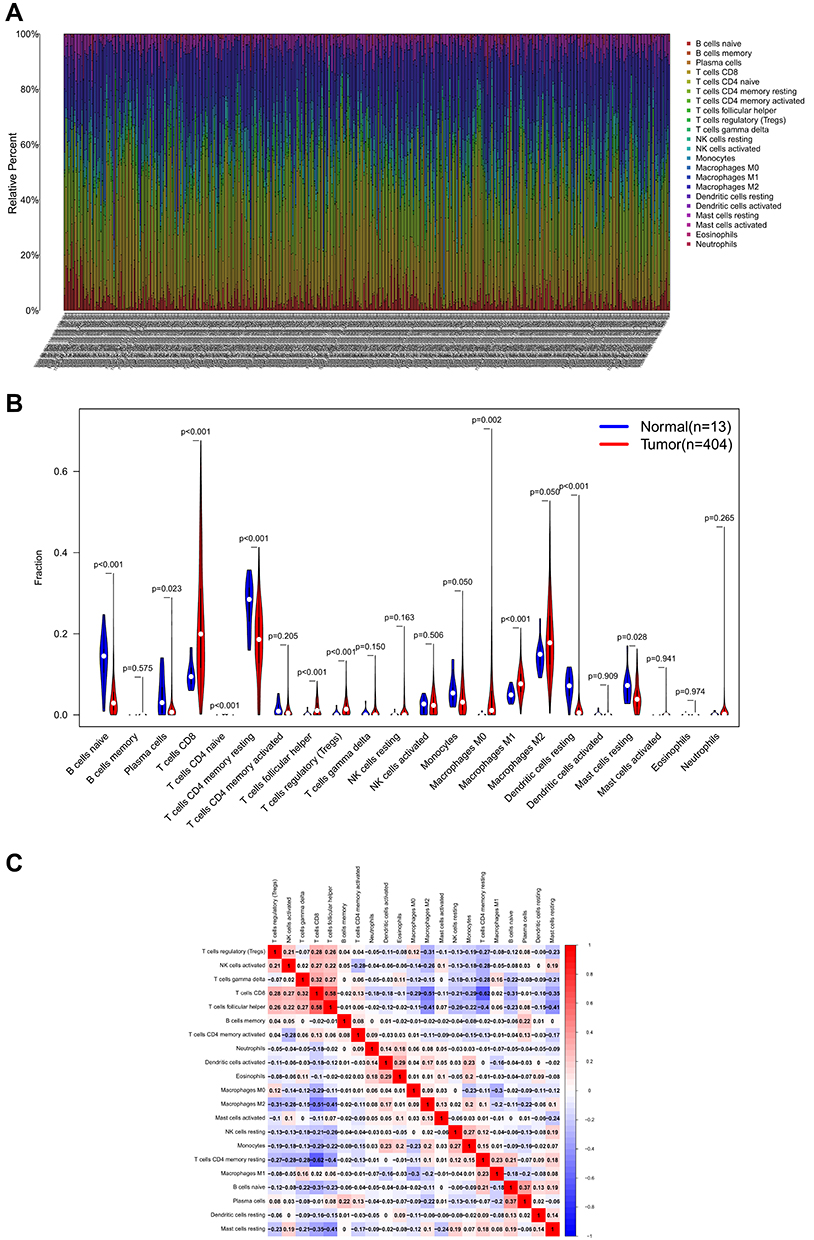 |
Figure 8 The immune infiltration in ccRCC. (A) Heatmap of the 22 immune cell proportions. (B) Violin plot visualizing the difference in immune infiltration between normal and tumor tissues. (C) Heatmap depicting correlations between infiltrated immune cells in tumor tissues. |
Clinical Evaluation by Infiltrating Immune Cell Subsets
Each case was then classified into low- and high-RS groups according to the median level of TIICs. Resting dendritic and mast cells were significantly associated with a favorable outcome (Figure 9). In contrast, follicular helper T cells and Tregs were associated with a poorer prognosis, suggesting that these TIICs may be vital in inhibiting ccRCC progression and anti-tumor response in the tumor microenvironment.
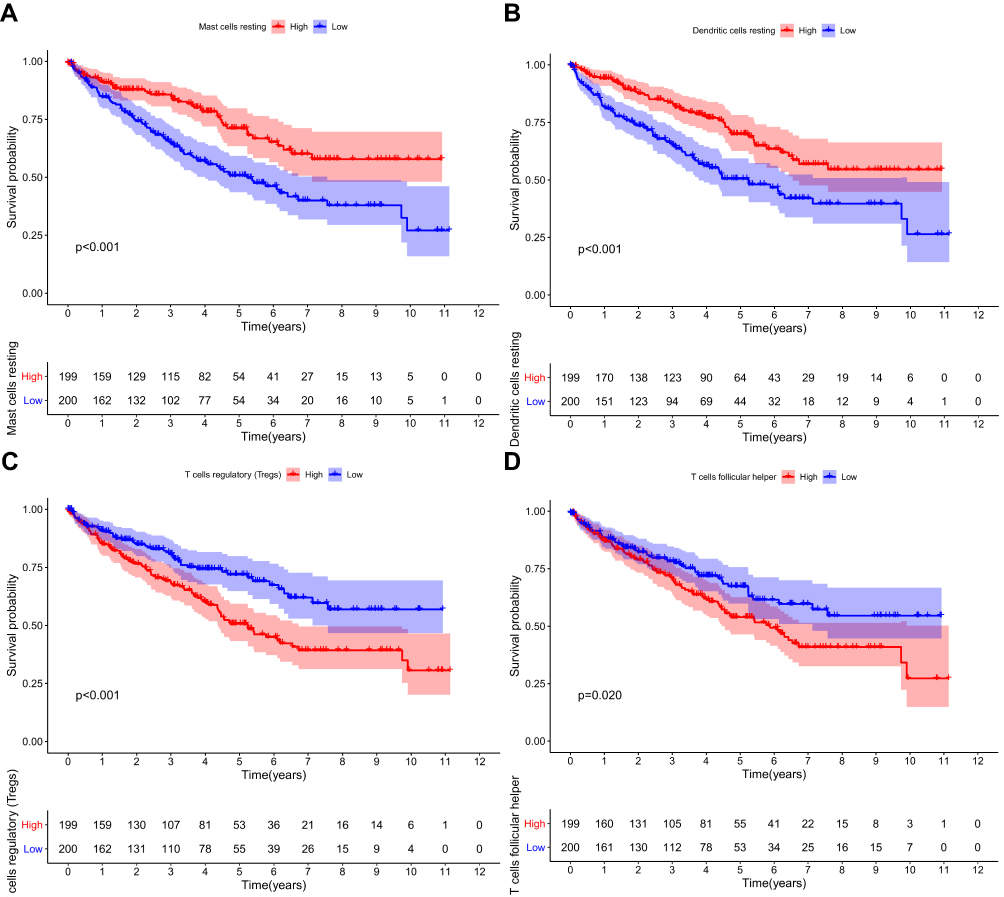 |
Figure 9 Survival plots of the median of immune cell subsets with P-value. (A–D) Key immune cells influencing patients’ survival based on the median level of immune cells. |
Correlation Analysis Between the Prognostic Signature and TIICs
Pearson correlation was applied to analyze the correlation between RS and TIICs. On the one hand, RS was positively correlated with the relative level of memory B cells, M0 macrophages, plasma cells, activated memory CD4+T cells, CD8+ T cells, follicular helper T cells, and Tregs (Figure 10A–G). However, on the other hand, RS was negatively correlated with the relative level of activated dendritic cells, resting dendritic cells, eosinophils, M2 macrophages, resting mast cells, monocytes, and resting memory CD4+ T cells (Figure 10H–N). Indeed, the prognostic signature was significantly associated with TIICs (either positive or negative correlation).
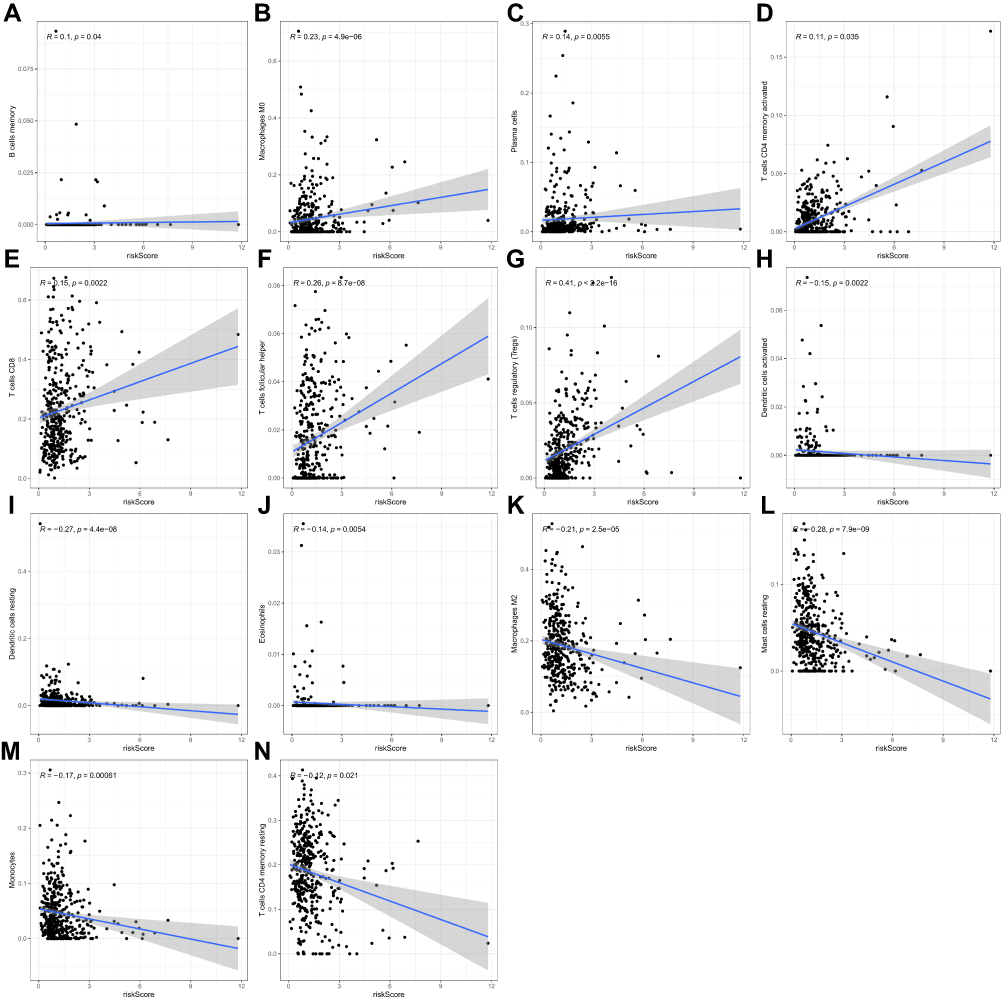 |
Figure 10 Scatter plot showing the relationship between infiltrated immune cells and prognostic model (P < 0.05). (A–G) Positive correlations between infiltrated immune cells and prognostic model. (H–N) Negative correlations between infiltrated immune cells and prognostic model. |
Discussion
ccRCC is one of the most common neoplasms of the kidney endangering human health worldwide. Mounting evidence has demonstrated that metabolic changes occur in cancers.14,23 Undoubtedly, metabolic-related expression profiles play a critical role in tumor occurrence and development. Previous studies have revealed that metabolic alteration is correlated with ccRCC development.5 Therefore, new predictive signatures based on MRGs are needed to assess ccRCC prognosis. Herein, a reliable metabolic predictive signature was developed using six MRGs (PLA2G6, PYCR1, RRM2, PAFAH2, CYP3A7, and ALDH6A1) via the TCGA-KIRC cohort. The signature was validated using a dataset in the GEO database.
PLA2G6 is mainly located in mitochondria and is involved in cell differentiation, proliferation, apoptosis, signal transduction, and membrane phospholipid remodeling.24 Previous researches have shown that PLA2G6 alterations are associated with various autosomal recessive neurodegenerative disorders.25 PLA2G6 alterations are rare events in kidney cancers and only occurs in small-cell variant renal oncocytoma.26 In this study, the expression level of PLA2G6 was upregulated in ccRCC tissues and was negatively correlated with OS. This observation indicates PLA2G6 could be a prognostic risk factor for ccRCC and a potential therapeutic target for ccRCC patients. PYCR1 promotes proline synthesis, increases mitochondrial reactive oxygen species (ROS) production, and promotes epithelial-mesenchymal transition (EMT) through induction of mitochondrial ion protease, thus activating angiogenesis and M2 macrophage polarization.27 A previous Multi-Omic Data Analysis showed that PYCR1 upregulation is correlated with shorter OS time in RCC patients,28 consistent with this study. RRM2 is a small subunit of Ribonucleotide Reductase and is essential for DNA synthesis and cell proliferation.29 Research has shown that RRM2 expression has been identified in numerous cancers, such as kidney cancer, colorectal cancer, breast cancer, and prostate cancer, and RRM2 overexpression is associated with a poorer outcome in these cancers.30–33 The carcinogenic effect of RRM2 is related to the promotion of EMT and angiogenesis.29,34 PAFAH2 encodes an oxidized-phospholipid-selective phospholipase A2, which participates in the metabolism of esterified 8-isoprostaglandin F2α and protects tissues against damage from oxidative stress injury.35 PAFAH2 expression is downregulated in ccRCC tissues. However, no literature has described the mechanisms of PAFAH2 in improving ccRCC outcome to play a protective role against cancer. It has been hypothesized that the mechanism of action of PAFAH2 lies in its ability to inhibit oxidative stress. CYP3A7 encodes enzymes that are involved in metabolic biotransformation of endogenous and exogenous substrates.36 Herein, CYP3A7 expression was downregulated in ccRCC tissues. Recent genome-wide association studies (GWAS) have demonstrated that CYP3A7 can decrease the risk of hormone receptor-positive breast cancer in premenopausal women by influencing endogenous sex hormone metabolism.37 Another research has revealed that the etiology of RCC is hormone-related, explaining the protective effect of CYP3A7 on ccRCC patients.38 ALDH6A1 is a mitochondrial methylmalonate hemaldehyde dehydrogenase involved in lipid metabolism and catabolism of valine and thymine.39,40 ALDH6A1 expression was significantly downregulated in ccRCC tissues and was associated with poor survival in ccRCC patients. In contrast, ALDH6A1 overexpression strongly inhibited tumor cell proliferation, migration, and lactate production via HNF4α, a potent tumor suppressor.41
Additionally, evidence has exposed that TIICs play an essential role in tumor development.42 ccRCC is characterized by several T cell infiltrates, such as CD8+ T cells and CD4+ T cells.43,44 CIBERSORT algorithms also revealed the effect of different relative proportions of TIICs in tumor and normal tissues on ccRCC prognosis. Furthermore, TIICs were associated with RS. The results also showed that infiltration of the multiple TIICs could clinically predict the prognosis of ccRCC patients. Therefore constructed immune landscape can also be used to predict the OS of ccRCC patients.
A large-scale analysis targeting ccRCC tumors confirmed T cells are the main TIICs within the TME.45 Overall, higher CD8+ T cell infiltration in ccRCC is associated with worse outcomes, implying that the infiltrating CD8+ T cells might play a critical role in TME. Multiple ccRCC studies have confirmed that these infiltrating CD8+ T cells can be suppressed to become dysfunctional.16,46 ccRCC typically progresses with T cell infiltration. T cell activation influences the prognosis of ccRCC patients, explaining the positive correlation between activated memory CD4+ T cells and RS and the negative correlation between resting memory CD4+ T cells and RS. Previous research on CD4+ tumor-infiltrating T cells in ccRCC provided evidence of CD4+ T cell-mediated anti-tumor immunity. However, CD4+ T cells are also associated with an immunosuppressed state of the ccRCC.46 Therefore, the underlying mechanisms of memory CD4+ T cells in ccRCC progression call for further investigation. Mast cells and eosinophils are primarily pertinent to allergic diseases. Herein, they were associated with a lower risk. Indeed, previous studies have shown that mast cells have pro-tumor activity in some cancers, such as melanoma and cervical cancer.47 Besides, they have anti-tumor activity in breast cancer and prostate cancer.48,49 Nonetheless, the underlying molecular mechanisms of these phenomena warrant further investigations.
Conclusions
In conclusion, a prognostic model that independently predicts the prognosis of ccRCC patients was developed using six MRGs. The dedifferentiation algorithm showed significant differences in the cell composition of the TIICs of ccRCC and the association between TIICs and clinical outcomes. These genes and cells may guide future targeted therapies and immunotherapies. Nevertheless, this study did not fully assess the six genes used for formulating the model and the 14 associated infiltrating immune cells. Therefore, further validation is required since our results are based on public databases and computational algorithms.
Funding
This work was supported by grants from the National Key Research and Development Program of China (2017YFC0908000), the Natural Key Research and Development Project (2020YFA0113200), the Major Project of Guangxi Innovation Driven (AA18118016), the Guangxi key Laboratory for Genomic and Personalized Medicine (20-065-33), Natural Science Foundation of China (81770759, 82060145, 31970814).
Disclosure
All authors declare no conflict of interests.
References
1. Deveson Kell S. Renal cell carcinoma: treatment options. Br J Nurs. 2011;20(9):536, 538–539.
2. Shuch B, Amin A, Armstrong AJ, et al. Understanding pathologic variants of renal cell carcinoma: distilling therapeutic opportunities from biologic complexity. Eur Urol. 2015;67(1):85–97. doi:10.1016/j.eururo.2014.04.029
3. Hsieh JJ, Purdue MP, Signoretti S, et al. Renal cell carcinoma. Nat Rev Dis Primers. 2017;3(1):17009. doi:10.1038/nrdp.2017.9
4. Shen C, Kaelin WG
5. Wettersten HI, Aboud OA, Lara PN
6. Rini BI, Campbell SC, Escudier B. Renal cell carcinoma. Lancet. 2009;373(9669):1119–1132. doi:10.1016/S0140-6736(09)60229-4
7. Battaglia M, Lucarelli G. The role of renal surgery in the era of targeted therapy: the urologist’s perspective. Urologia. 2015;82(3):137–138. doi:10.5301/uro.5000105
8. Di Lorenzo G, De Placido S, Pagliuca M, et al. The evolving role of monoclonal antibodies in the treatment of patients with advanced renal cell carcinoma: a systematic review. Expert Opin Biol Ther. 2016;16(11):1387–1401. doi:10.1080/14712598.2016.1216964
9. Jonasch E, Gao J, Rathmell WK. Renal cell carcinoma. BMJ. 2014;349(nov10 11):g4797. doi:10.1136/bmj.g4797
10. Tamma R, Rutigliano M, Lucarelli G, et al. Microvascular density, macrophages, and mast cells in human clear cell renal carcinoma with and without bevacizumab treatment. Urol Oncol. 2019;37(6):355e311–355 e319. doi:10.1016/j.urolonc.2019.01.025
11. Choueiri TK, Motzer RJ, Longo DL. Systemic therapy for metastatic renal-cell carcinoma. N Engl J Med. 2017;376(4):354–366. doi:10.1056/NEJMra1601333
12. Courtney KD, Infante JR, Lam ET, et al. Phase I dose-escalation trial of PT2385, a first-in-class hypoxia-inducible factor-2 alpha antagonist in patients with previously treated advanced clear cell renal cell carcinoma. J Clin Oncol. 2018;36(9):867–874. doi:10.1200/JCO.2017.74.2627
13. Rao S, Mondragon L, Pranjic B, et al. AIF-regulated oxidative phosphorylation supports lung cancer development. Cell Res. 2019;29(7):579–591. doi:10.1038/s41422-019-0181-4
14. Warburg O. On the origin of cancer cells. Science. 1956;123(3191):309–314. doi:10.1126/science.123.3191.309
15. Cancer Genome Atlas Research N. Comprehensive molecular characterization of clear cell renal cell carcinoma. Nature. 2013;499(7456):43–49. doi:10.1038/nature12222
16. Ricketts CJ, De Cubas AA, Fan H, et al. The cancer genome atlas comprehensive molecular characterization of renal cell carcinoma. Cell Rep. 2018;23(1):313–326 e315.
17. Sato Y, Yoshizato T, Shiraishi Y, et al. Integrated molecular analysis of clear-cell renal cell carcinoma. Nat Genet. 2013;45(8):860–867. doi:10.1038/ng.2699
18. Valera VA, Merino MJ. Misdiagnosis of clear cell renal cell carcinoma. Nat Rev Urol. 2011;8(6):321–333. doi:10.1038/nrurol.2011.64
19. Xie C, Ji N, Tang Z, Li J, Chen Q. The role of extracellular vesicles from different origin in the microenvironment of head and neck cancers. Mol Cancer. 2019;18(1):83. doi:10.1186/s12943-019-0985-3
20. Vuong L, Kotecha RR, Voss MH, Hakimi AA. Tumor microenvironment dynamics in clear-cell renal cell carcinoma. Cancer Discov. 2019;9(10):1349–1357. doi:10.1158/2159-8290.CD-19-0499
21. Lossos IS, Czerwinski DK, Alizadeh AA, et al. Prediction of survival in diffuse large-B-cell lymphoma based on the expression of six genes. N Engl J Med. 2004;350(18):1828–1837. doi:10.1056/NEJMoa032520
22. Newman AM, Liu CL, Green MR, et al. Robust enumeration of cell subsets from tissue expression profiles. Nat Methods. 2015;12(5):453–457. doi:10.1038/nmeth.3337
23. Mullen AR, Wheaton WW, Jin ES, et al. Reductive carboxylation supports growth in tumour cells with defective mitochondria. Nature. 2011;481(7381):385–388. doi:10.1038/nature10642
24. Kinghorn KJ, Castillo-Quan JI, Bartolome F, et al. Loss of PLA2G6 leads to elevated mitochondrial lipid peroxidation and mitochondrial dysfunction. Brain. 2015;138(Pt 7):1801–1816. doi:10.1093/brain/awv132
25. Lin G, Lee PT, Chen K, et al. Phospholipase PLA2G6, a parkinsonism-associated gene, affects Vps26 and Vps35, retromer function, and ceramide levels, similar to alpha-synuclein gain. Cell Metab. 2018;28(4):605–618 e606. doi:10.1016/j.cmet.2018.05.019
26. Li K, Wang C, Xiong X, et al. Small-cell variant renal oncocytoma: case report on its clinicopathological and genetic characteristics and literature review. Gene. 2020;730:144266. doi:10.1016/j.gene.2019.144266
27. Kuo CL, Chou HY, Chiu YC, et al. Mitochondrial oxidative stress by Lon-PYCR1 maintains an immunosuppressive tumor microenvironment that promotes cancer progression and metastasis. Cancer Lett. 2020;474:138–150. doi:10.1016/j.canlet.2020.01.019
28. Hu F, Zeng W, Liu X. A gene signature of survival prediction for kidney renal cell carcinoma by multi-omic data analysis. Int J Mol Sci. 2019;20(22):5720. doi:10.3390/ijms20225720
29. Zhang K, Hu S, Wu J, et al. Overexpression of RRM2 decreases thrombspondin-1 and increases VEGF production in human cancer cells in vitro and in vivo: implication of RRM2 in angiogenesis. Mol Cancer. 2009;8(1):11. doi:10.1186/1476-4598-8-11
30. Dawany NB, Dampier WN, Tozeren A. Large-scale integration of microarray data reveals genes and pathways common to multiple cancer types. Int J Cancer. 2011;128(12):2881–2891. doi:10.1002/ijc.25854
31. Grade M, Hummon AB, Camps J, et al. A genomic strategy for the functional validation of colorectal cancer genes identifies potential therapeutic targets. Int J Cancer. 2011;128(5):1069–1079. doi:10.1002/ijc.25453
32. Kretschmer C, Sterner-Kock A, Siedentopf F, Schoenegg W, Schlag PM, Kemmner W. Identification of early molecular markers for breast cancer. Mol Cancer. 2011;10(1):15. doi:10.1186/1476-4598-10-15
33. Mazzu YZ, Armenia J, Chakraborty G, et al. A novel mechanism driving poor-prognosis prostate cancer: overexpression of the DNA repair gene, Ribonucleotide Reductase Small Subunit M2 (RRM2). Clin Cancer Res. 2019;25(14):4480–4492. doi:10.1158/1078-0432.CCR-18-4046
34. Shah KN, Wilson EA, Malla R, Elford HL, Faridi JS. Targeting ribonucleotide reductase M2 and NF-kappaB activation with didox to circumvent tamoxifen resistance in breast cancer. Mol Cancer Ther. 2015;14(11):2411–2421. doi:10.1158/1535-7163.MCT-14-0689
35. Kono N, Inoue T, Yoshida Y, et al. Protection against oxidative stress-induced hepatic injury by intracellular type II platelet-activating factor acetylhydrolase by metabolism of oxidized phospholipids in vivo. J Biol Chem. 2008;283(3):1628–1636. doi:10.1074/jbc.M708622200
36. Eun HS, Cho SY, Lee BS, Seong IO, Kim KH. Profiling cytochrome P450 family 4 gene expression in human hepatocellular carcinoma. Mol Med Rep. 2018;18(6):4865–4876.
37. Johnson N, Maguire S, Morra A, et al. CYP3A7*1C allele: linking premenopausal oestrone and progesterone levels with risk of hormone receptor-positive breast cancers. Br J Cancer. 2021;124(4):842–854. doi:10.1038/s41416-020-01185-w
38. Lee JE, Hankinson SE, Cho E. Reproductive factors and risk of renal cell cancer: the Nurses’ Health Study. Am J Epidemiol. 2009;169(10):1243–1250. doi:10.1093/aje/kwp030
39. Sass JO, Walter M, Shield JP, et al. 3-hydroxyisobutyrate aciduria and mutations in the ALDH6A1 gene coding for methylmalonate semialdehyde dehydrogenase. J Inherit Metab Dis. 2012;35(3):437–442. doi:10.1007/s10545-011-9381-x
40. Knebel B, Goeddeke S, Poschmann G, et al. Novel insights into the adipokinome of obese and obese/diabetic mouse models. Int J Mol Sci. 2017;18(9):9. doi:10.3390/ijms18091928
41. Lu J, Chen Z, Zhao H, et al. ABAT and ALDH6A1, regulated by transcription factor HNF4A, suppress tumorigenic capability in clear cell renal cell carcinoma. J Transl Med. 2020;18(1):101. doi:10.1186/s12967-020-02268-1
42. Zhang M, Wang X, Chen X, Zhang Q, Hong J. Novel immune-related gene signature for risk stratification and prognosis of survival in lower-grade glioma. Front Genet. 2020;11:363. doi:10.3389/fgene.2020.00363
43. Kopecky O, Lukesova S, Vroblova V, et al. Phenotype analysis of tumour-infiltrating lymphocytes and lymphocytes in peripheral blood in patients with renal carcinoma. Acta Med. 2007;50(3):207–212.
44. Komohara Y, Hasita H, Ohnishi K, et al. Macrophage infiltration and its prognostic relevance in clear cell renal cell carcinoma. Cancer Sci. 2011;102(7):1424–1431. doi:10.1111/j.1349-7006.2011.01945.x
45. Li Y, Wang Z, Jiang W, et al. Tumor-infiltrating TNFRSF9(+) CD8(+) T cells define different subsets of clear cell renal cell carcinoma with prognosis and immunotherapeutic response. Oncoimmunology. 2020;9(1):1838141. doi:10.1080/2162402X.2020.1838141
46. Chevrier S, Levine JH, Zanotelli VRT, et al. An immune atlas of clear cell renal cell carcinoma. Cell. 2017;169(4):736–749 e718. doi:10.1016/j.cell.2017.04.016
47. Groot Kormelink T, Abudukelimu A, Redegeld FA. Mast cells as target in cancer therapy. Curr Pharm Des. 2009;15(16):1868–1878. doi:10.2174/138161209788453284
48. Rajput AB, Turbin DA, Cheang MC, et al. Stromal mast cells in invasive breast cancer are a marker of favourable prognosis: a study of 4444 cases. Breast Cancer Res Treat. 2008;107(2):249–257. doi:10.1007/s10549-007-9546-3
49. Fleischmann A, Schlomm T, Kollermann J, et al. Immunological microenvironment in prostate cancer: high mast cell densities are associated with favorable tumor characteristics and good prognosis. Prostate. 2009;69(9):976–981. doi:10.1002/pros.20948
 © 2021 The Author(s). This work is published and licensed by Dove Medical Press Limited. The full terms of this license are available at https://www.dovepress.com/terms.php and incorporate the Creative Commons Attribution - Non Commercial (unported, v3.0) License.
By accessing the work you hereby accept the Terms. Non-commercial uses of the work are permitted without any further permission from Dove Medical Press Limited, provided the work is properly attributed. For permission for commercial use of this work, please see paragraphs 4.2 and 5 of our Terms.
© 2021 The Author(s). This work is published and licensed by Dove Medical Press Limited. The full terms of this license are available at https://www.dovepress.com/terms.php and incorporate the Creative Commons Attribution - Non Commercial (unported, v3.0) License.
By accessing the work you hereby accept the Terms. Non-commercial uses of the work are permitted without any further permission from Dove Medical Press Limited, provided the work is properly attributed. For permission for commercial use of this work, please see paragraphs 4.2 and 5 of our Terms.