")
Back to Journals » International Journal of General Medicine » Volume 14
Prognostic Value of Glucose-to-Lymphocyte Ratio in Critically Ill Patients with Acute Pancreatitis
Authors Chen Y, Tang S, Wang Y
Received 8 July 2021
Accepted for publication 16 August 2021
Published 8 September 2021 Volume 2021:14 Pages 5449—5460
DOI https://doi.org/10.2147/IJGM.S327123
Checked for plagiarism Yes
Review by Single anonymous peer review
Peer reviewer comments 2
Editor who approved publication: Dr Scott Fraser
Yongjun Chen,* Shangjun Tang,* Yumei Wang
Department of Gastroenterology, Qianjiang Central Hospital of Chongqing Municipality, Chongqing, 409000, People’s Republic of China
*These authors contributed equally to this work
Correspondence: Yumei Wang
Department of Gastroenterology, Qianjiang Central Hospital of Chongqing Municipality, No. 63, Chengxijiu Road, Qianjiang District, Chongqing, People’s Republic of China
Tel +86 23-79245623
Email [email protected]
Background: Glucose metabolism and systemic inflammation have been associated with prognosis in acute pancreatitis (AP) patients. However, the possible value as a prognostic marker of the glucose-to-lymphocyte ratio (GLR) has not been evaluated in critically ill patients with AP.
Methods: This study included 1,133 critically ill patients with AP from the Medical Information Mart for Intensive Care-IV (MIMIC-IV) database, who were randomly divided into the training cohort (n=806) and the validation cohort (n=327) at a ratio of 7:3. X-tile software was used to determine the optimal cut-off values for GLR. Area under the curve (AUC) analysis was performed to compare the performance between GLR and other blood-based inflammatory biomarkers. Univariate and multivariate Cox regression analyses were applied to select prognostic factors associated with in-hospital mortality. A nomogram model was developed based on the identified prognostic factors and the validation cohort was used to further validate the nomogram.
Results: The optimal cut-off value for GLR was 0.9. The ROC analyses showed that the discrimination abilities of GLR were better than other blood-based inflammatory biomarkers. Multivariate Cox regression analysis demonstrated that age, platelet, albumin, bilirubin, Sequential Organ Failure Assessment (SOFA) score, and GLR are independent predictors of poor overall survival in the training cohort and were incorporated into the nomogram for in-hospital mortality as independent factors. The nomogram exhibited better discrimination with C-indexes in the training cohort and the validation cohort of 0.886 (95% CI=0.849– 0.922) and 0.841 (95% CI=0.767– 0.915), respectively. The calibration plot revealed an adequate fit of the nomogram for predicting the risk of in-hospital mortality in both sets.
Conclusion: As an easily available biomarker, GLR can independently predict the in-hospital mortality of critically ill patients with AP. The nomogram combining GLR with other significant features exerted favorable predictive performance for in-hospital mortality.
Keywords: glucose-to-lymphocyte ratio, acute pancreatitis, predict, critically ill
Introduction
Acute pancreatitis (AP) is a common gastrointestinal condition, and the hallmark characteristic of AP is systemic inflammatory response.1 More than 25% of AP patients can proceed to severe conditions despite developments having been made in the diagnostics and treatment, which leads to intensive care unit (ICU) care.2 These critically ill patients with AP have high mortality rates in the range of 30–50% and a hospital length of stay of more than 1 month.3,4 As such, it is clinically significant to identify a novel biomarker for risk stratification in critically ill patients with AP with high accuracy.
Currently, there are a series of frequently used AP scoring systems which have been reported to evaluate and stratify the risk of AP.5,6 However, these scoring systems have many limitations due to the low sensitivity and the complex for quick evaluation. Moreover, a few indicators included in these scoring systems cannot be collected easily in the early stage of AP, which makes risk stratification difficult. Therefore, novel and uncomplicated predictor and comprehensive assessment systems are needed. Recently, many researchers have focused on the development of rapid systemic inflammatory biomarkers based on accessible laboratory tests for reliable prognosis prediction of AP patients,7,8 including the red cell distribution width (RDW),9 neutrophil–lymphocyte ratio (NLR),9 platelet–lymphocyte ratio (PLR),10 and lymphocyte–monocyte ratio (LMR).11 These systemic inflammatory biomarkers were reported to be linked with AP severity and poor prognosis.
As one of the components of the systemic inflammatory response, lymphocytes are one of the main effector cells in the inflammatory response of AP. Their profound rolea in the concept of immunosurveillance to protect the host from AP development and impaired immune system were reported to be associated with poor prognosis in AP patients.12,13 Shi et al14 reported that lower CD4+ T lymphocytes and elevated CD19+ B lymphocytes was shown in AP patients with organ failure than those AP patients without organ failure, which indicated that AP patients with organ failure are prone to immune system impairment. Thus, the status of the patient’s immune system appeared to be one of the significant factors predicting the outcome among patients with AP.
In addition, elevated fasting blood glucose levels and abnormal glucose metabolism were reported to be associated with the severity and prognosis of patients with AP. Abnormal glucose metabolism is present in almost 40% of AP patients.15–17 However, biomarker combined fasting blood glucose and lymphocytes counts to predict prognosis in critically ill patients with AP remain unclear. The present study tried to assess the ratio of glucose-to-lymphocytes (GLR), an indicator which included both glucose metabolism and systemic inflammation in critically ill patients with AP. Besides, we also attempted to develop a nomogram model which can predict in-hospital mortality accurately in the setting of critically ill patients with AP.
Methods
Data Source
All data were extracted from the Medical Information Mart for Intensive Care-IV (MIMIC-IV version 1.0) database, which is an updated version of MIMIC-III with pre-existing institutional review board approval.18 Currently, the MIMIC-IV includes comprehensive and high-quality data of patients admitted to intensive care units (ICUs) at the Beth Israel Deaconess Medical Center (BIDMC) between 2008 and 2019, developed by the computational physiology laboratory of Massachusetts Institute of Technology (MIT) and approved by the institutional review boards of MIT and Beth Israel Deaconess Medical Center (BIDMC). The MIMIC-IV database includes desensitization data for over 50,000 critically ill patients at BIDMC between 2008 and 2019, and contains demographics, vital signs, laboratory indicators, and medications. After passing the “Protecting Human Research Participants” exam on the website of the National Institutes of Health (NIH), one author was approved to extract data from this database.
Cohort Selection
Patients diagnosed as AP and over 18 years old at their first ICU admission were included in the present study. AP was diagnosed on the grounds of the International Classification of Diseases (ICD) 5770 code, and diagnosed based on the 2012 revision of the Atlanta classification and definitions by the international consensus.19 The exclusion criteria were as follows: 1) less than 18-year-old; 2) fasting blood glucose and lymphocyte counts data at the first day of admission to the ICU were missing; and 3) patients with repeated ICU admissions.
Date Collection and Outcomes
In the present study, we collected patient’s baseline parameters as soon as they were admitted to the ICU, including age, gender, vital signs, total bilirubin, albumin, alanine aminotransferase (ALT), aspartate aminotransferase (AST), amylase, lipase, serum calcium, blood urea nitrogen (BUN), serum creatinine (SCr), hemoglobin, white blood cell (WBC) count, red cell distribution width (RDW), lymphocyte counts, monocyte counts, platelet counts, hypertension, diabetes, coronary artery disease (CAD), chronic kidney disease (CKD), Sequential Organ Failure Assessment score (SOFA), Simplified Acute Physiology Score II (SAPSII), Oxford acute severity of illness score (OASIS), Systemic inflammatory response syndrome score (SIRS), and Bedside index of severity in acute pancreatitis (BISAP). The use of a vasopressor, mechanical ventilation, and renal replacement therapy were also extracted. The GLR was defined as fasting blood glucose/lymphocyte counts. NLR was calculated by neutrophil counts/lymphocyte count. PLR was calculated by platelet counts/lymphocyte counts. LMR was defined as lymphocyte counts/monocyte counts.
In-hospital mortality was defined as the primary outcome.
Statistical Analysis
Baseline characteristics are expressed as mean±standard deviation (SD) and categorical variables are expressed as number (percentage). The baseline characteristics between different groups were analyzed using Student’s t-test or chi-square test. The X-tile software was conducted to evaluate the optimal cut-off GLR.
Univariate and multivariate Cox regression were conducted to determine the significant variables predictive of in-hospital mortality. The Kaplan-Meier analysis was used to estimate overall survival, and the differences between the curves were compared using the Log rank test. Subgroup analysis was exhibited by the Forest plot. We compared the predictive abilities between GLR and other systemic inflammatory biomarkers by conducting the receiver operating characteristic (ROC) curve analysis. We then used the C-index to assess the nomogram performance for predicting in-hospital mortality in critically ill patients with AP. All analyses were conducted using R software (version 4.1.0) and SPSS Statistics (version 22.0). P<0.05 was considered statistically significant.
Results
Patient Characteristics and Clinical Features
This study included 1,133 critically ill patients with AP from the MIMIC-IV database who were randomly divided into the training cohort (n=806) and the validation cohort (n=327) in a ratio of 7:3. The detailed process of selection is shown in Figure 1. Table 1 shows the baseline parameters in the training and validation groups. All parameters in Table 1 showno significant differences between the two groups.
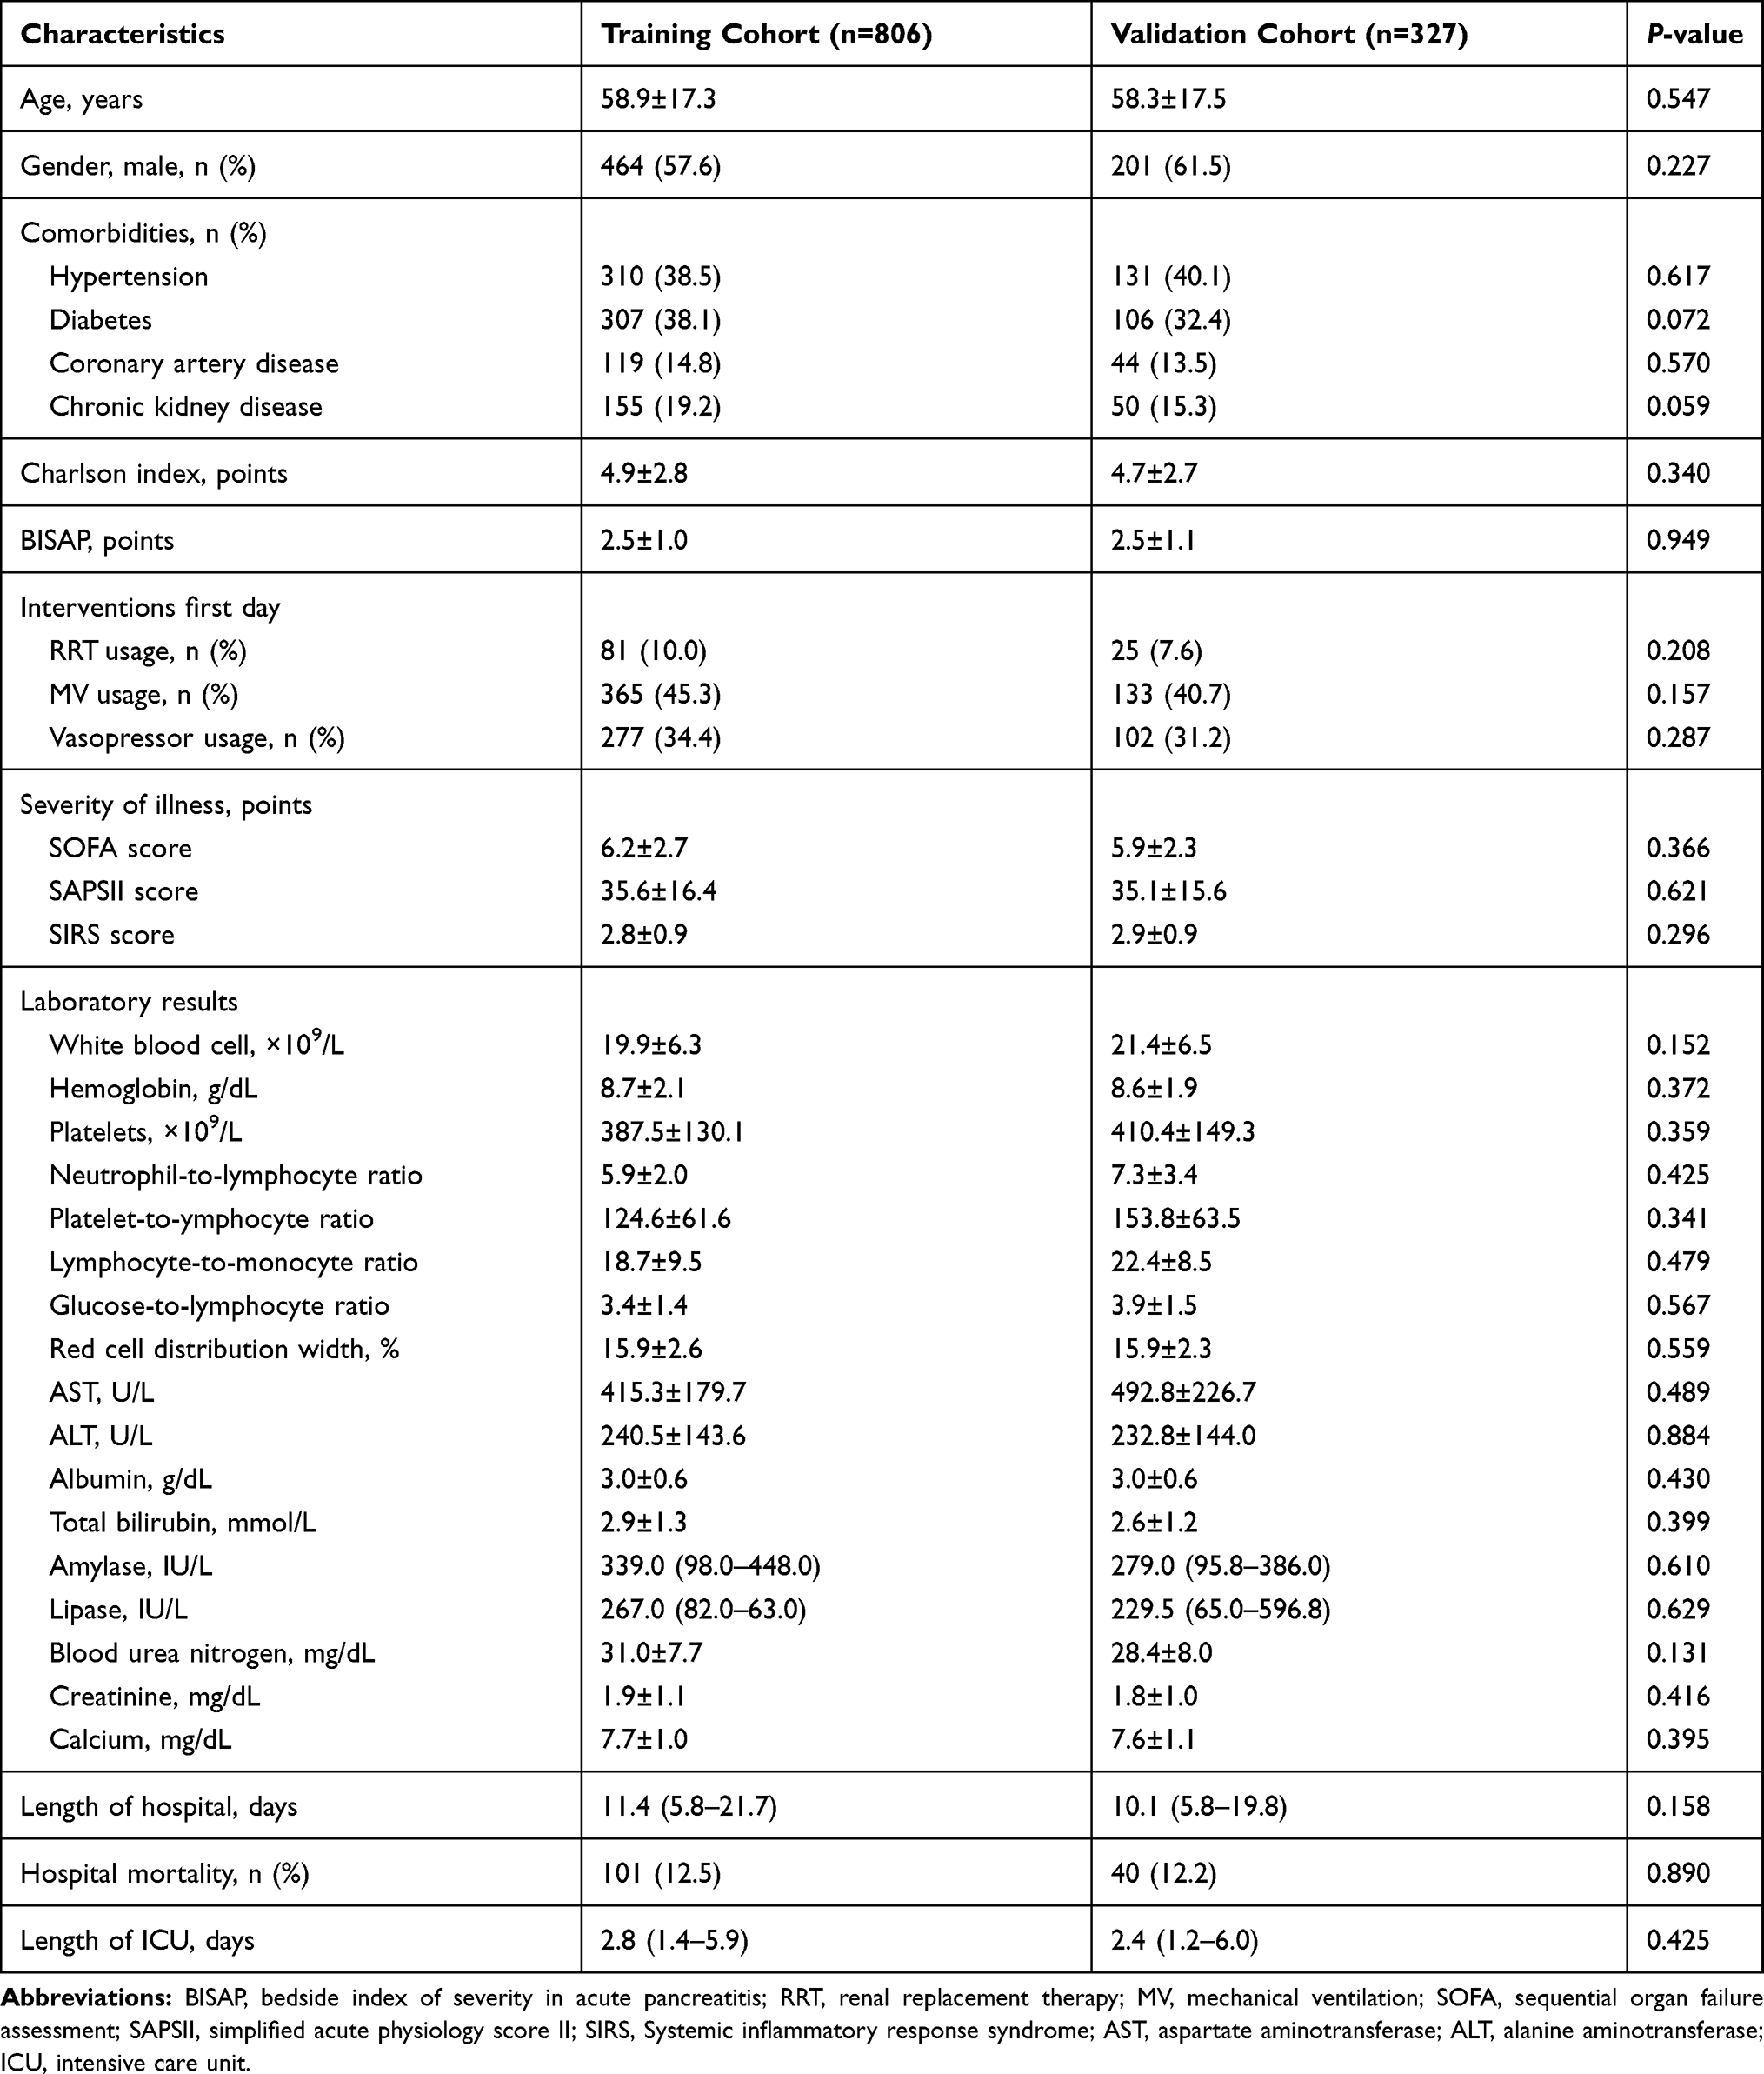 |
Table 1 Baseline Characteristics |
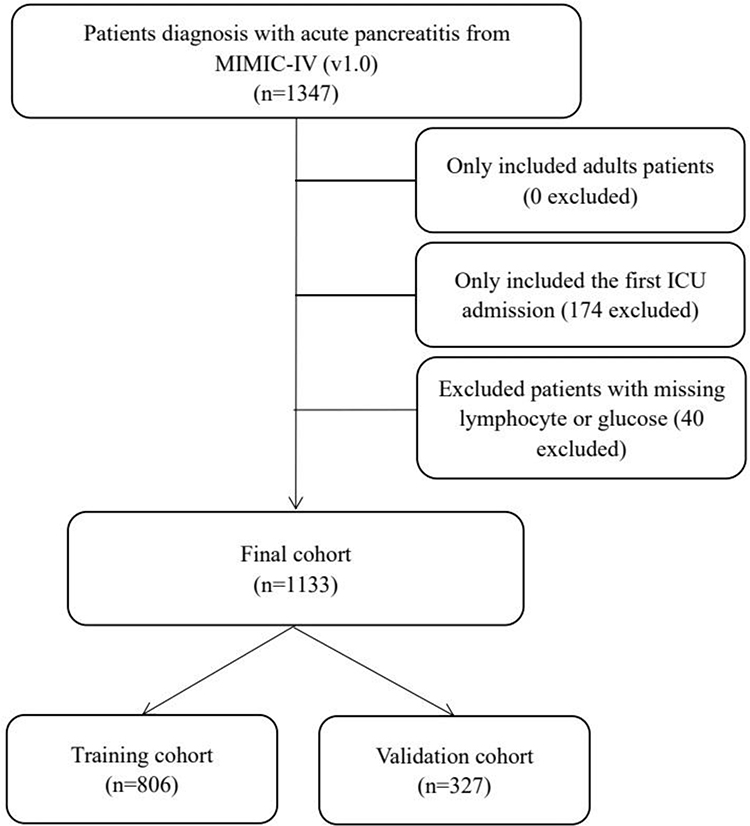 |
Figure 1 The flow chart of the included population. |
Comparison between GLR and Other Systemic Inflammatory Biomarkers
Previous studies focused on the development of rapid systemic inflammatory biomarkers based on accessible laboratory tests for reliable prognosis prediction of AP patients, including RDW,9 NLR,9 PLR,10 and LMR.11 These systemic inflammatory biomarkers were all reported to be linked with AP severity and poor prognosis. As a novel systemic inflammatory biomarker of GLR, we tried to compare the predictive abilities between NLR, PLR, LMR, and GLR by conducting the ROC curve analysis. When predicting the in-hospital mortality for critically ill patients with AP, the AUC of GLR, NLR, PLR, and LMR were 0.779 (0.749–0.807), 0.654 (0.623–0.683), 0.636 (0.602–0.670), and 0.569 (0.602–0.670), respectively, the AUC of GLR was larger when compared with the AUC of NLR, PLR and LMR (P<0.001, respectively, Table 2). The sensitivity of GLR, NLR, PLR, and LMR were 0.89, 0.72, 0.69, and 0.45, respectively, while the specificity of GLR, NLR, PLR, and LMR were 0.63, 0.61, 0.56, and 0.72, respectively. Consequently, these data showthat the novel systemic inflammatory response biomarker of GLR was superior to other systemic inflammatory response biomarkers (NLR, PLR, and LMR) when predicting the in-hospital mortality for critically ill patients with AP. Moreover, we then compared the predictive role of GLR with glucose or lymphocyte by performing ROC analysis. As shown in Table 3, GLR exhibited a better predictive role when compared to glucose or lymphocyte both in the training cohort and the validation cohort in predicting in-hospital mortality for critically ill patients with AP.
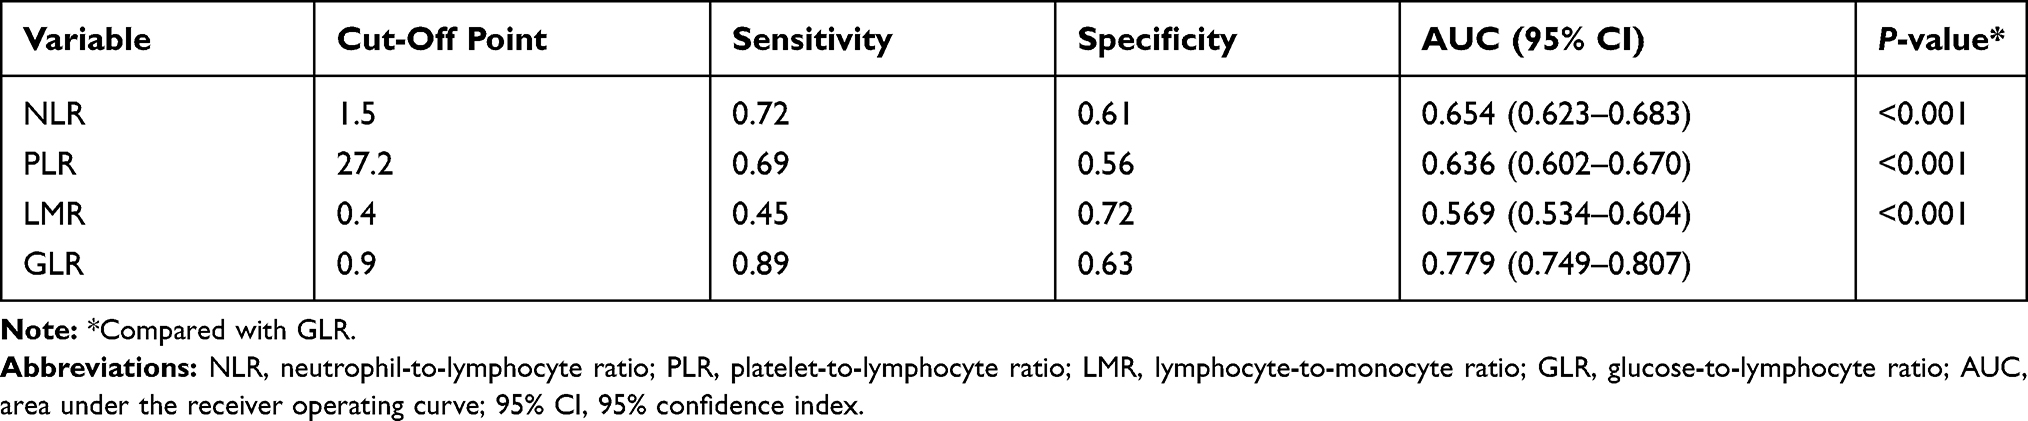 |
Table 2 Receiver Operating Curve Anaysis |
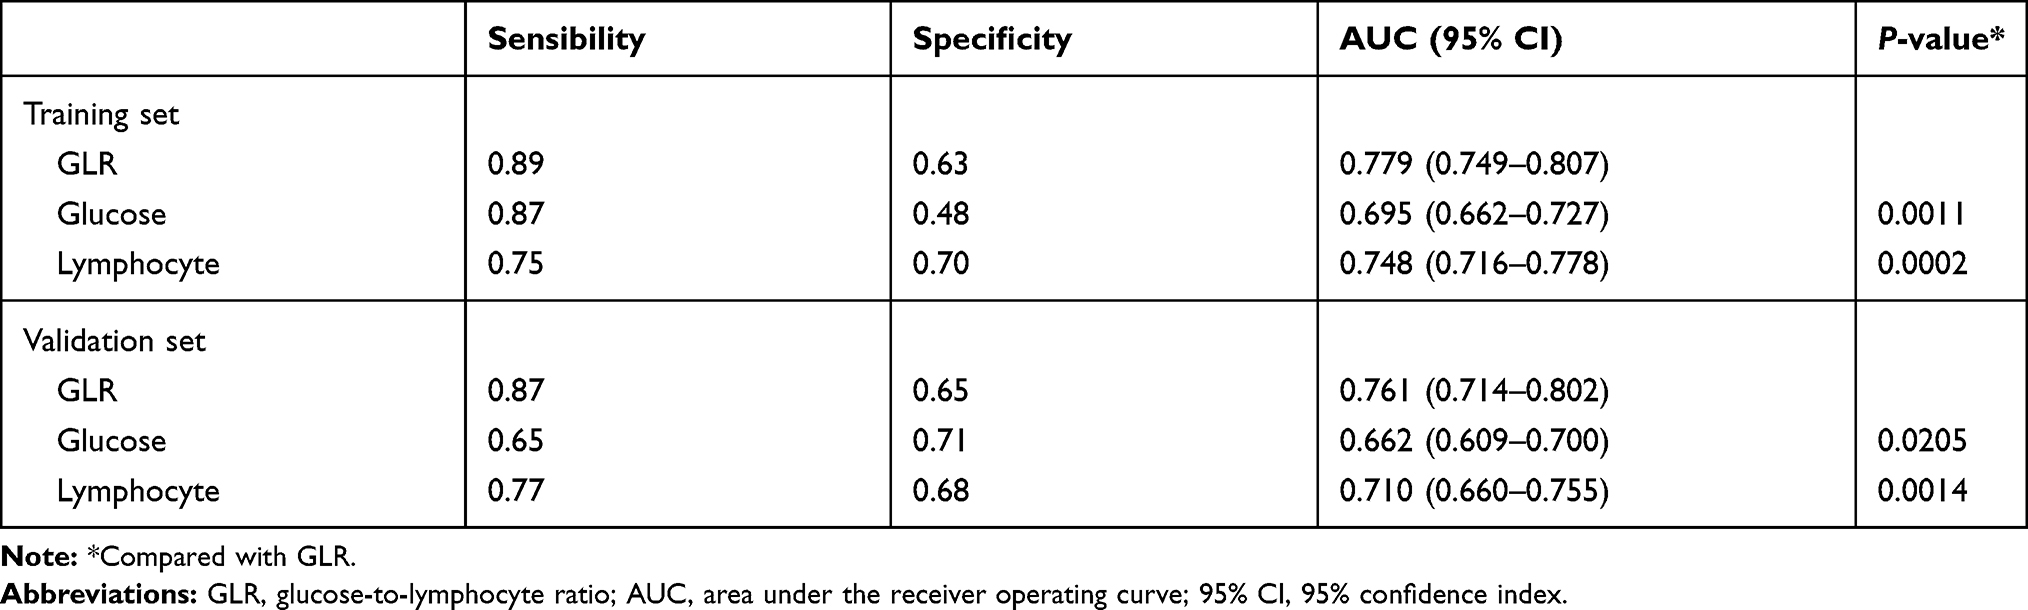 |
Table 3 The Predictive Role of GLR with Glucose or Lymphocyte in Predicting In-Hospital Mortality |
GLR was an Independent Prognostic Factor
Univariate analysis indicated that age, SOFA score, SAPSII score, platelets, LMR, AST, albumin, total bilirubin, blood urea nitrogen, creatinine, and GLR≥0.9 were predictors for in-hospital mortality in the training cohort (P<0.05, Table 4). Multivariate analyses demonstrated that age, SOFA score, platelets, albumin, total bilirubin, and GLR≥0.9 were independent predictors for in-hospital mortality in critically ill patients with AP (P<0.05, Table 4). Kaplan-Meier analysis demonstrated that patients in the lower GLR (≤0.9) group showed a better overall survival than patients in the higher GLR (≥0.9) group, both in the training cohort (P<0.001, Figure 2A) and the validation cohort (P<0.001, Figure 2B).
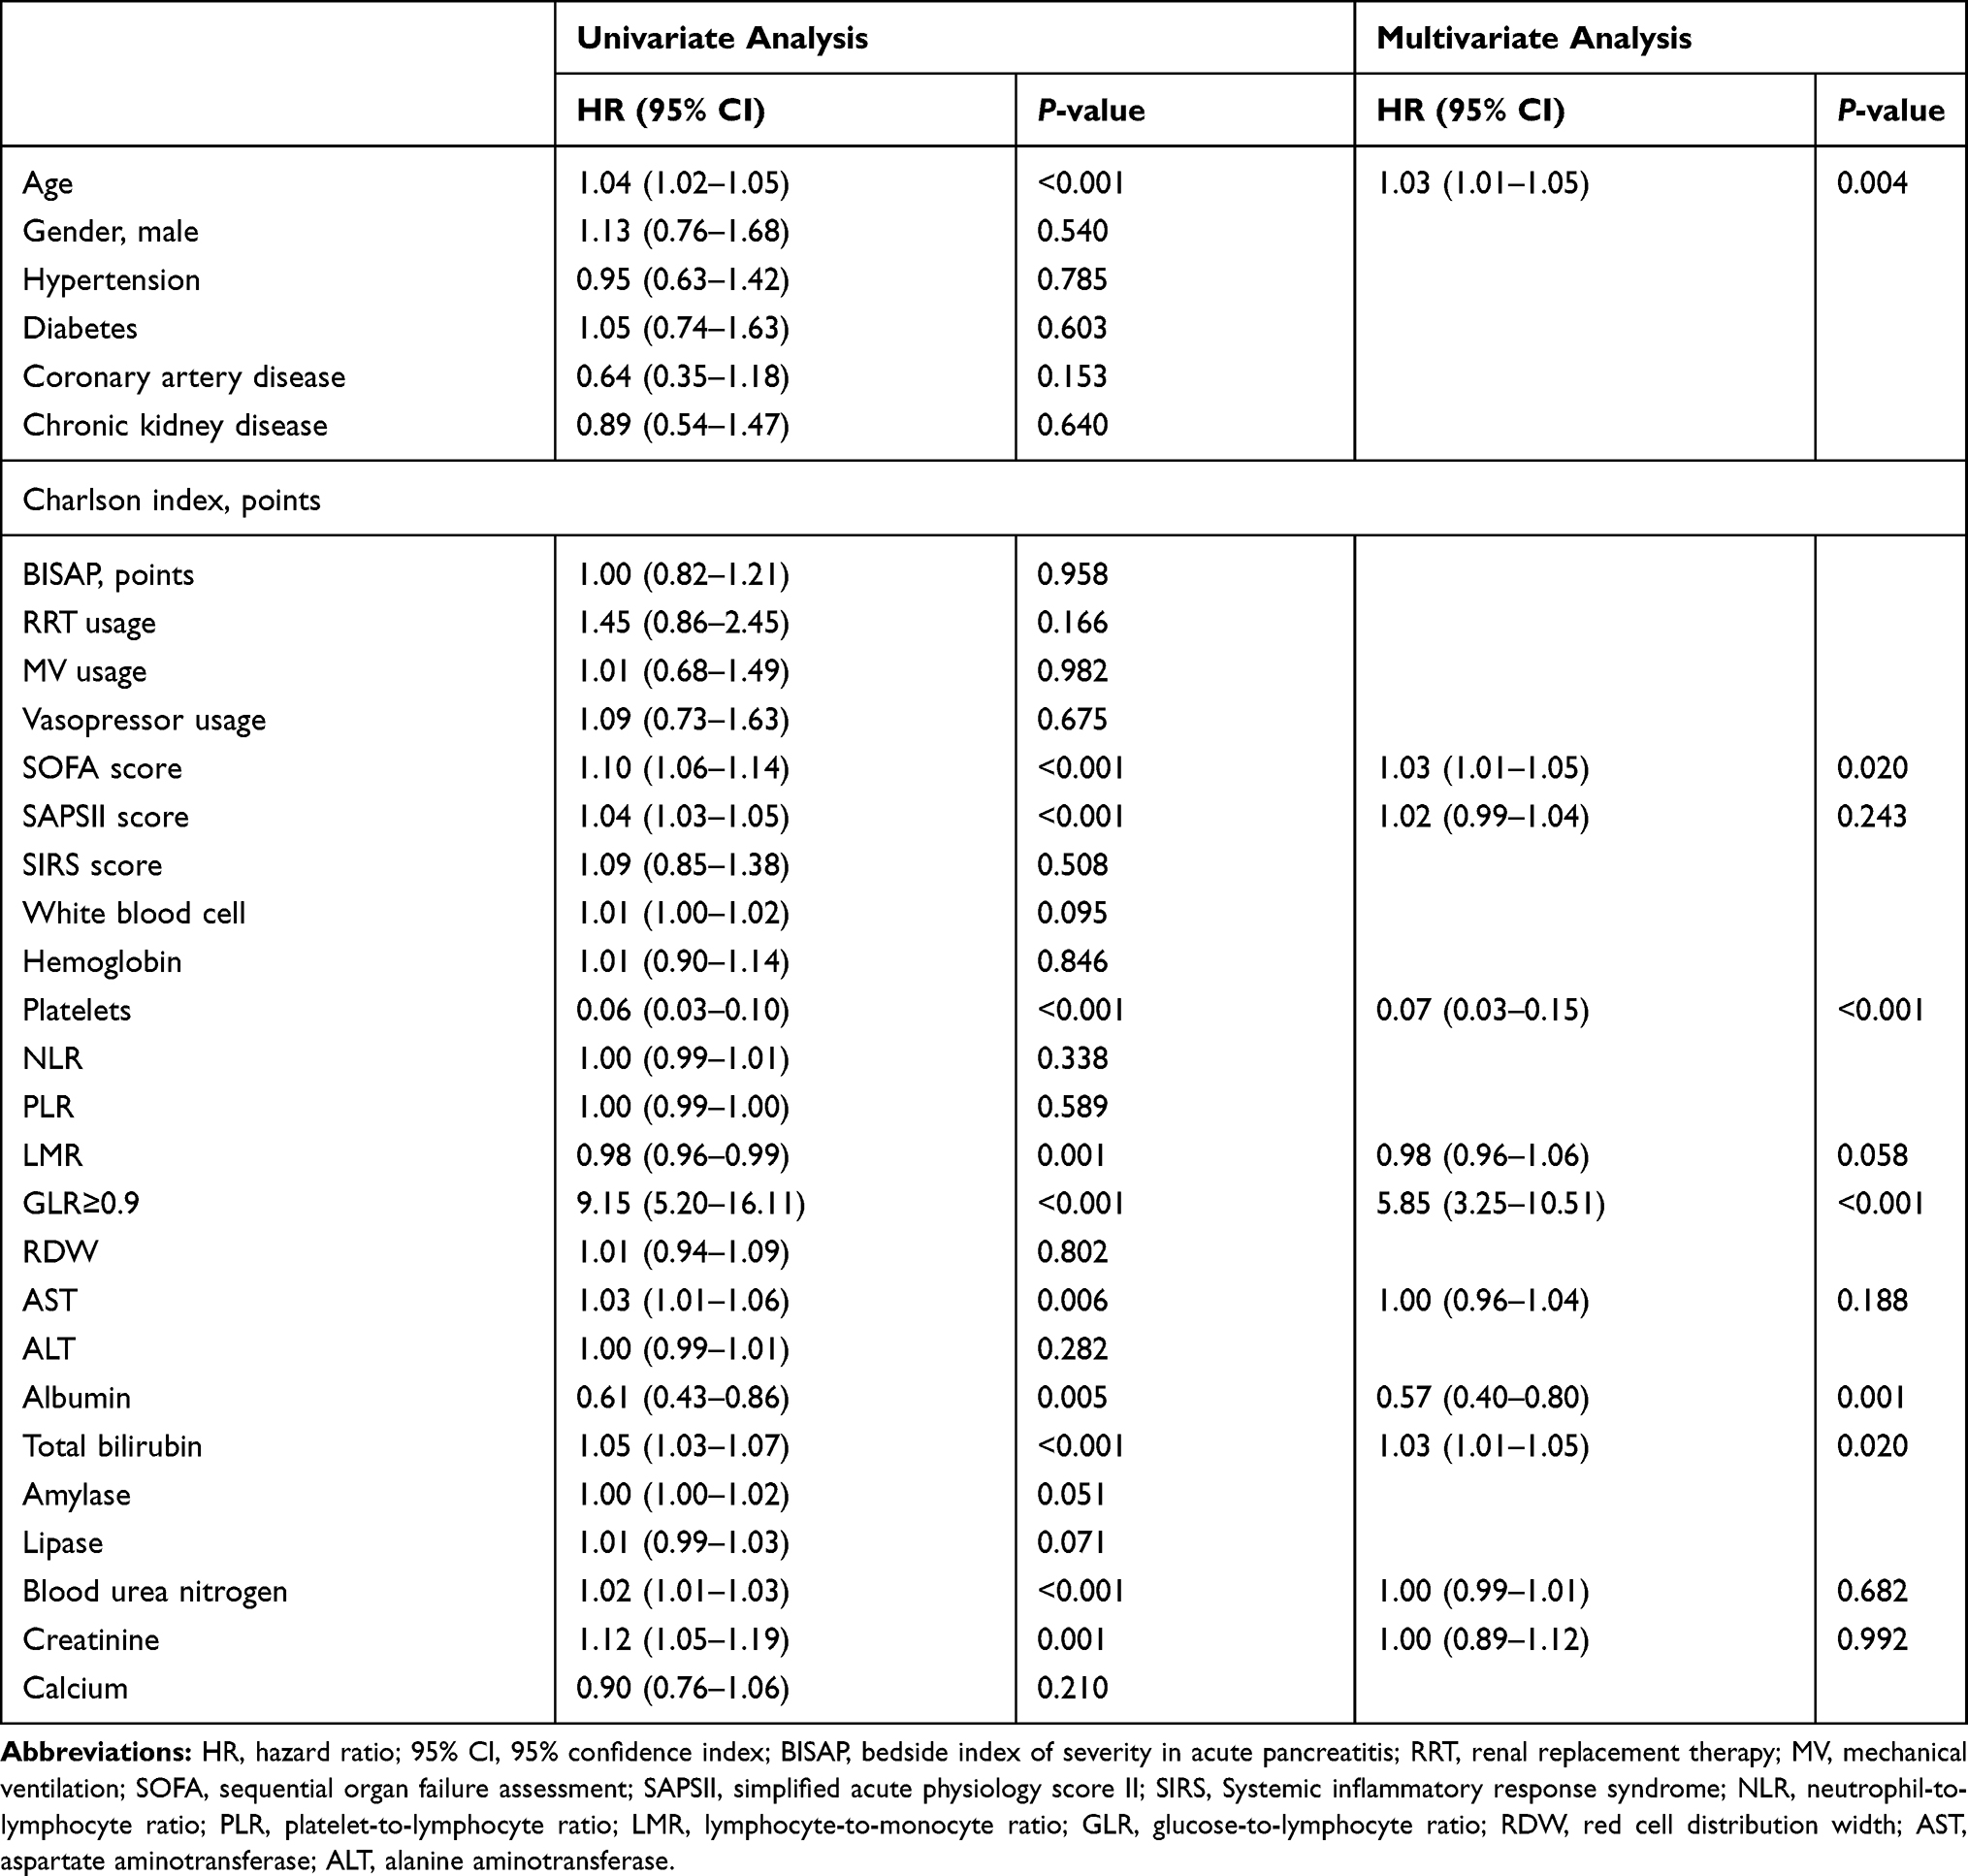 |
Table 4 Univariate and Multivariate Cox Regression Analyses of Factors Associated with In-Hospital Mortality in Training Cohort |
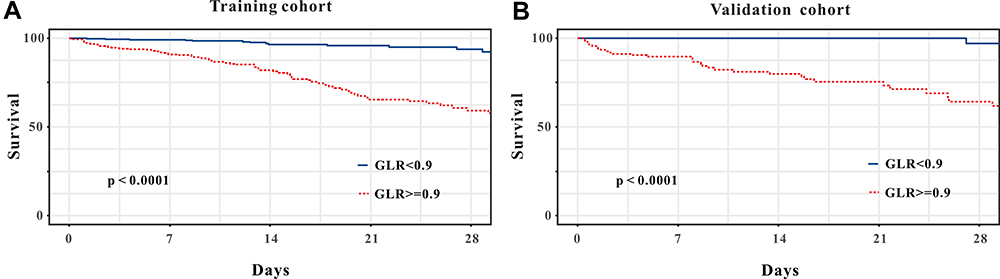 |
Figure 2 Kaplan-Meier curves of critically ill patients with AP stratified by the optimal cut-off value of GLR in the (A) training cohort and (B) validation cohort. |
Prognostic Value of GLR as a Predicted Biomarker in Nomogram for In-Hospital Mortality
A nomogram was created according to the independent predictors based on the multivariate Cox regression analysis to predict the in-hospital mortality of the critically ill patients with AP. A higher score in the nomogram means a shorter in-hospital mortality. As shown in Figure 3, GLR contributed the most to the predictive effect to prognosis in the nomogram, followed by platelet, albumin, etc. (Figure 3). The nomogram exhibited a relatively good model discriminative capacity for in-hospital mortality in critically ill patients with AP, indicated by the C-index. The C-index were 0.886 (95% CI=0.849–0.922) in the training sets and 0.841 (95% CI=0.767–0.915) in the validation cohort. The calibration curve for the predictive nomogram depicted a high agreement between the actual probability and predicted probability in the training set and the validation set (Figure 4A and B). Finally, decision curve analysis (DCA) was performed to determine the clinical utilities of the predictive nomogram. The DCA curve also demonstrated that the survival nomogram derived from the training set was clinically useful in the training set as well as in the validation set (Figure 4C and D).
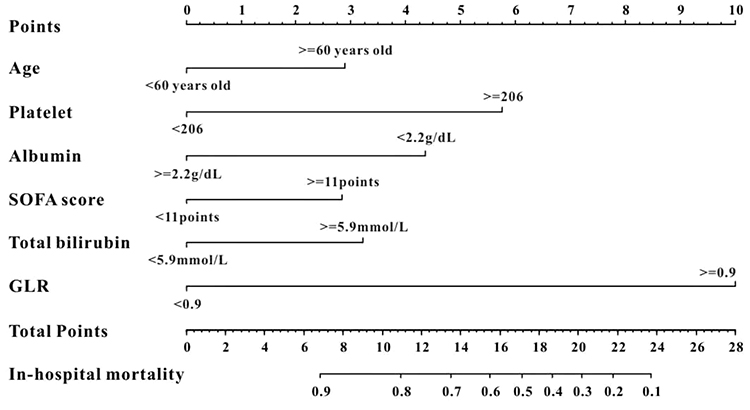 |
Figure 3 The survival nomogram for predicting in-hospital mortality of critically ill patients with AP. When using it, drawing a vertical line from each variables upward to the points and then recording the corresponding points (ie, “age ≥ 60 years old” = 3 points). The point of each variable was then summed up to obtain a total score that corresponds to a predicted probability of in-hospital mortality at the bottom of the nomogram. |
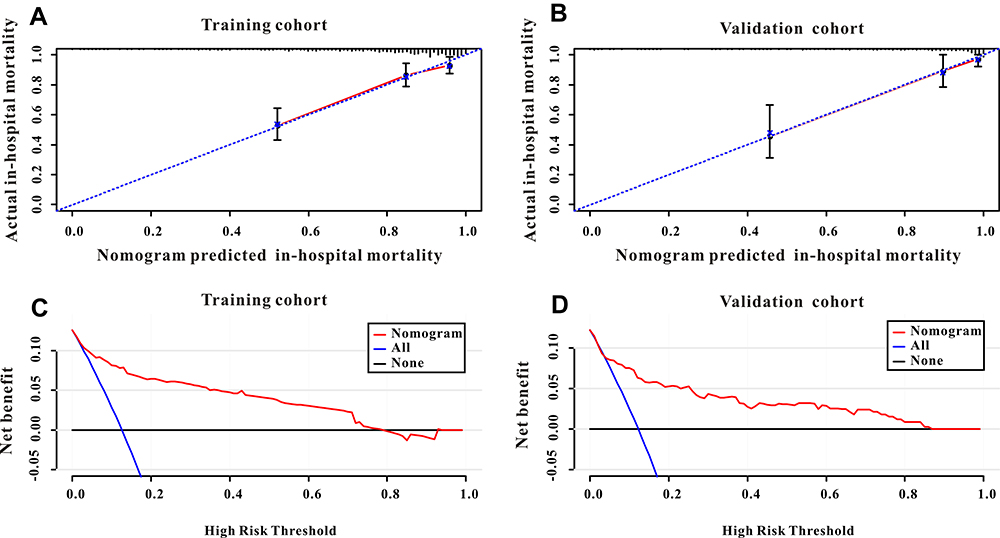 |
Figure 4 (A) The calibration curve for predicting in-hospital mortality in the training cohort. (B) The calibration curve for predicting in-hospital mortality in the validation cohort. (C) Decision curve analysis DCA of the nomogram to predict in-hospital mortality in the training cohort. (D) DCA of the nomogram to predict in-hospital mortality in the validation cohort. |
Subgroup Analysis
Exploratory subgroup analyses was conducted to further evaluate whether GLR was still a good predictor for in-hospital mortality in different subgroups. Subgroup analysis indicated that GLR was a independent predictor for in-hospital mortality in the training cohort (HR=9.15, 95% CI=5.20–16.11; P<0.001, Figure 5). GLR can predict patient survival in almost all subgroups except for patients with albumin lower than 2.2 g/dL (all P<0.01, Figure 5). GLR showed a poor predictive role in patients with albumin lower than 2.2 g/dL (HR=3.28, 95% CI=0.95–11.34; P=0.061, Figure 5).
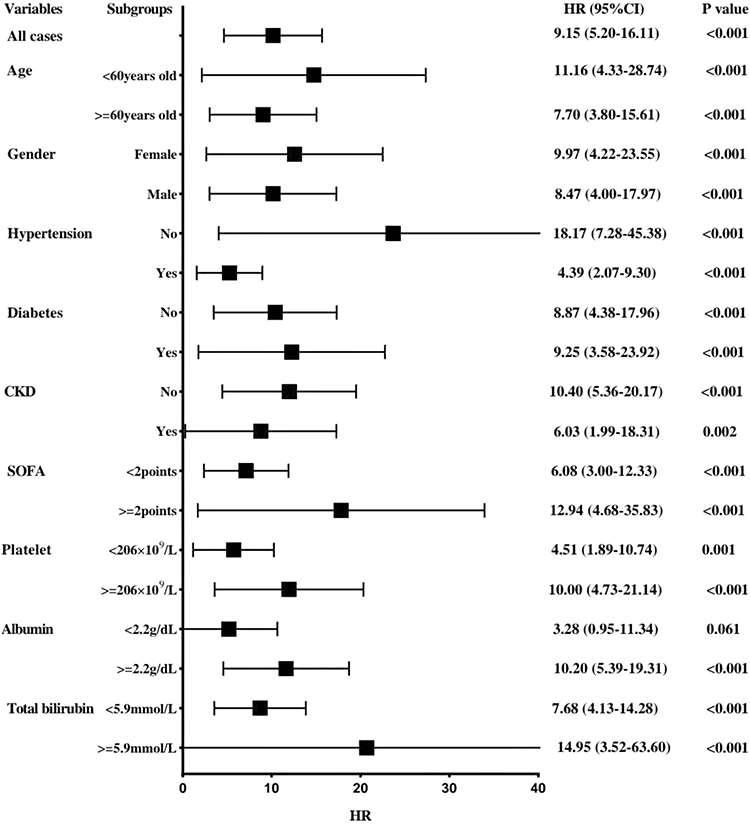 |
Figure 5 Hazard ratios (HRs) of prognostic marker GLR for overall survival in different patient subgroups in the training cohort. |
Discussion
In this study, we evaluated the predictive role of GLR, which combined blood glucose with lymphocyte ratio, in critically ill patients with AP. We found that elevated GLR was significantly associated with a lower survival. Moreover, GLR was a superior predictor for in-hospital mortality compared to NLR, PLR, and LMR. A predictive nomogram model incorporating GLR and other prognostic factors was based on the significant predictors in the multivariate Cox regression analysis which depicted excellent discrimination and calibration abilities in predicting in-hospital mortality. In additional, subgroup analysis demonstrated that GLR was an independent predictor in almost all subgroups of critically ill patients with AP except for patients with albumin lower than 2.2 g/dL.
As the most common pancreatic disease in the world, AP varies considerable in disease severity, progressive course, and eventual prognosis, and severe AP has very high mortality and a prolonged stay in the intensive care unit (ICU). According to the ICNARC study, among 2,677 patients with severe AP admitted to the ICU, the ICU mortality and hospital mortality were 31% and 42%, respectively.20 Another study demonstrated that the ICU mortality and hospital mortality were 16% and 20% in those AP patients admitted to the ICU.21 Hence, an early risk assessment is important to be able to allocate patients with severe AP to surveillance in an ICU. There are few different scoring systems based on different indicators aimed at identifying patients with a high risk. The Ranson and Glasgow (Imrie) criteria are the most commonly used. The Computed Tomography Severity Index (CTSI) is another score that has been shown to have good predictive value. The Acute Physiology and Chronic Health Evaluation (APACHE)-II and the Sequential Organ Failure Assessment (SOFA) scores are general severity of illness scoring systems that were reported to have good prognostic value in identifying severe AP.21 These scoring systems consistently exhibit comparable prognostic accuracy to other newer scoring systems.22 However, these scoring systems also have its limitations. For example, the data used in the Ranson criteria, Glasgow score were has been argued for its 48-hour requirement for computation of the final score and the APACHE-II has more than 10 parameters to assess, all these scoring system need much time to fill which will lead to delayed interventions for AP patients.23 These scoring systems have been verified useful but need many blood parameters, which will add economic burden to these patients. Hence, more readily available and inexpensive prognostic markers need to be explored for risk classification of critically ill patients with AP.
Accumulating researchers have demonstrated that inflammatory biomarkers like NLR,9 LMR,10 and PLR11 playimportant roles in predicting the outcome of AP patients. However, the present study found that these inflammatory biomarkers were not independent prognosis factors to predict in-hospital mortality in critically ill patients with AP when evaluated by Cox regression analysis. The differences deserve further research.
Recently, some investigators have focused on the integrated biomarker which combined the inflammatory indicator lymphocyte and blood glucose level to predict prognosis in some diseases. Zhang et al24 demonstrated that GLR is an independent prognostic factor for patients with pancreatic ductal adenocarcinoma patients who underwent curative resection. Another study indicated that GLR is associated with prognosis in pancreatic cancer patients.25 Moreover, Navarro et al26 revealed that GLR is a prognostic marker in patients with resected pT2 gallbladder cancer. As far as we know, the present study verified that GLR is an independent prognostic marker to predict outcome in critically ill patients with AP according to the results of multivariate Cox regression analysis. We then compared the predictive abilities of GLR with other inflammatory biomarkers including NLR, LMR, and PLR by using the AUC value based on the ROC analysis. The results indicated that the AUC of GLR was higher than other inflammatory markers including NLR, LMR, and PLR. Moreover, the survival nomogram including GLR depicted good performance for predicting in-hospital mortality. Hence, the present study verified a potential good prognosis factor of GLR in predicting in-hospital mortality in critically ill patients with AP.
The exact mechanism to explain the link between increased GLR and poor prognosis in critically ill patients with AP is largely unknown. It was reported that abnormal glucose metabolism was positively correlated with the severity and prognosis of patients with AP. Abnormal glucose metabolism is present in almost 40% of AP patients.12–14 High blood glucose level is an independent risk factor in predicting the prognosis in AP patients.27,28 A retrospective study analyzed the relationship between serum glucose with AP and concluded that abnormal glucose testing was associated with recurrent and chronic pancreatitis.16 Evidence has shown that patients with type 2 DM were positively correlated with risk of AP.29,30 Moreover, an animal experiment indicated that hyperglycemia exacerbates AP by improving inflammation and apoptosis.31 In addition, accumulating evidence has reported that hyperglycemia on admission was positively correlated with poor prognosis in critically ill patients during hospitalization.32,33 On the other hand, lymphocytes are indicators of immunity and decreased lymphocytes counts demonstrate immunity injury.34 It has been reported that the systemic complications associated with AP result from deregulated activation of the immune system.35 Several studies have shown a reduced number of circulating peripheral CD4+ T-cells, and these subsets subsequently increase within 5 days. Moreover, a decrease in CD4+ T-cells indicates a serious illness and poor prognosis in vivo.36,37 Accumulating evidence reported that lymphocyte counts including T-cells, B-cells, and natural killer cells are more significantly decreased in AP patients, particularly in severe AP, than in the healthy population.38,39 One reason for depletion of lymphocytes in AP was apoptosis by cell cycle analysis. One study found the proportion of apoptotic cells was about one quarter of total lymphocytes after incubation for 24 hours.12 Additionally, depletion of circulating lymphocytes is due to migration of activated lymphocytes to the inflammatory site in vivo, such as the pancreas and lungs.40 Consequently, humoral and cellular immune responses are both inhibited to different degrees in patients with AP. Therefore, it is of value to take into account that GLR may reflect the synergistic effect of hyperglycemia and depressed immunity in patients with critically ill patients with AP.
Moreover, in the present study, GLR showed a poor predictive role in patients with albumin lower than 2.2 g/dL (HR=3.28, 95% CI=0.95–11.34; P=0.061). The precise mechanisms are unclear. Serum albumin (Alb) values were used for nutritional assessment. Previous reported increased malnutrition risk almost doubled the risk for hypoglycemia.41 Moreover, hypoglycemia was associated with a higher chance of mortality during hospitalization in children with malnutrition.42 In addition, hypoalbuminemia is a negative acute phase reactant which has been associated with inflammatory response and poor outcome in infectious diseases. Serum albumin has been shown to decrease in many acute and chronic diseases related to the magnitude of the inflammatory response they generate.43 Elevated GLR represents increased serum glucose and lower lymphocytes counts but cannot reflect lower serum ALB levels, as lower serum ALB levels may reflect hypoglycemia and increased inflammatory response.
There were several limitations to our study. First, this was a retrospective study based on the MIMIC-IV database, the results of this study need further validation by prospective studies in the future. Moreover, we evaluated the performance of the predictive effect of GLR in certain critically ill patients with AP, rather than in the general population, which may cause overestimation to the predictive value of GLR. In addition, the GLR used in the present study was calculated based on the data of the first day admission to the ICU ward but not the onset of pancreatitis, or day of admission to hospital. However, the GLR value changes dynamically during hospitalization and this will cause bias to results. Finally, some patients were excluded from the present study due to missing data, which may result in bias to the results in this study. Future larger multicenter prospective studies are warranted to validate these findings.
Conclusions
The present study manifested that higher GLR significantly increased the risk of in-hospital mortality in critically ill patients with AP. The nomogram combined GLR exhibited potential discrimination and calibration abilities for predicting in-hospital mortality. The GLR is very easy to calculate, readily available, and an inexpensive prognostic marker for risk classification. It may possibly provide clinicians with useful clues to make accurate decisions in critically ill patients with AP.
Data Sharing Statement
The datasets used are available from the corresponding author on reasonable request.
Ethics Approval and Consent to Participate
The MIMIC-IV database was approved by the Massachusetts Institute of Technology (Cambridge, MA) and Beth Israel Deaconess Medical Center (Boston, MA), and consent was obtained for the original data collection. Therefore, the ethical approval statement and the need for informed consent were waived for this manuscript.
Funding
There is no funding to report.
Disclosure
The authors declare that they have no conflict of interest.
References
1. Crockett SD, Wani S, Gardner TB, Falck-Ytter Y, Barkun AN; American Gastroenterological Association Institute Clinical Guidelines Committee. American gastroenterological association institute guideline on initial management of acute pancreatitis. Gastroenterology. 2018;154(4):1096–1101. doi:10.1053/j.gastro.2018.01.032
2. Neoptolemos JP, Raraty M, Finch M, Sutton R. Acute pancreatitis: the substantial human and financial costs. Gut. 1998;42(6):886–891. doi:10.1136/gut.42.6.886
3. Quan H, Wang X, Guo C. A meta-analysis of enteral nutrition and total parenteral nutrition in patients with acute pancreatitis. Gastroenterol Res Pract. 2011;2011:698248. doi:10.1155/2011/698248
4. Nathens AB, Curtis JR, Beale RJ, et al. Management of the critically ill patient with severe acute pancreatitis. Crit Care Med. 2004;32(12):2524–2536. doi:10.1097/01.ccm.0000148222.09869.92
5. Yang L, Liu J, Xing Y, et al. Comparison of BISAP, Ranson, MCTSI, and APACHE II in predicting severity and prognoses of hyperlipidemic acute pancreatitis in Chinese patients. Gastroenterol Res Pract. 2016;2016:1834256. doi:10.1155/2016/1834256
6. Harshit Kumar A, Singh Griwan M. A comparison of APACHE II, BISAP, Ranson’s score and modified CTSI in predicting the severity of acute pancreatitis based on the 2012 revised Atlanta classification. Gastroenterol Rep. 2018;6:127–131. doi:10.1093/gastro/gox029
7. Habtezion A, Gukovskaya AS, Pandol SJ. Acute pancreatitis: a multifaceted set of organelle and cellular interactions. Gastroenterology. 2019;156(7):1941–1950. doi:10.1053/j.gastro.2018.11.082
8. Zhang Y, Guo F, Li S, et al. Decreased high density lipoprotein cholesterol is an independent predictor for persistent organ failure, pancreatic necrosis and mortality in acute pancreatitis. Sci Rep. 2017;7(1):8064. doi:10.1038/s41598-017-06618-w
9. Gülen B, Sonmez E, Yaylaci S, et al. Effect of harmless acute pancreatitis score, red cell distribution width and neutrophil/lymphocyte ratio on the mortality of patients with nontraumatic acute pancreatitis at the emergency department. World J Emerg Med. 2015;6(1):29–33. doi:10.5847/wjem.j.1920-8642.2015.01.005
10. Zhou H, Mei X, He X, Lan T, Guo S. Severity stratification and prognostic prediction of patients with acute pancreatitis at early phase: a retrospective study. Medicine. 2019;98(16):e15275. doi:10.1097/MD.0000000000015275
11. Mubder M, Dhindsa B, Nguyen D, et al. Utility of inflammatory markers to predict adverse outcome in acute pancreatitis: a retrospective study in a single academic center. Saudi J Gastroenterol. 2020;26(4):216–221. doi:10.4103/sjg.SJG_49_20
12. Takeyama Y, Takas K, Ueda T, Hori Y, Goshima M, Kuroda Y. Peripheral lymphocyte reduction in severe acute pancreatitis is caused by apoptotic cell death. J Gastrointest Surg. 2000;4(4):379–387. doi:10.1016/s1091-255x(00)80016-5
13. Oiva J, Mustonen H, Kylänpää ML, et al. Acute pancreatitis with organ dysfunction associates with abnormal blood lymphocyte signaling: controlled laboratory study. Crit Care. 2010;14(6):R207. doi:10.1186/cc9329
14. Shi C, Hou C, Zhu X, et al. New predictor of organ failure in acute pancreatitis: CD4+ T lymphocytes and CD19+ B lymphocytes. Biomed Res Int. 2018;2018:1012584. doi:10.1155/2018/1012584
15. Pendharkar SA, Asrani VM, Xiao AY, et al. Relationship between pancreatic hormones and glucose metabolism: a cross-sectional study in patients after acute pancreatitis. Am J Physiol Gastrointest Liver Physiol. 2016;311(1):G50–G58. doi:10.1152/ajpgi.00074.2016
16. Abu-El-Haija M, Hornung L, Denson LA, et al. Prevalence of abnormal glucose metabolism in pediatric acute, acute recurrent and chronic pancreatitis. PLoS One. 2018;13(10):e0204979. doi:10.1371/journal.pone.0204979
17. Bharmal SH, Pendharkar SA, Singh RG, Cameron-Smith D, Petrov MS. Associations between ketone bodies and fasting plasma glucose in individuals with post-pancreatitis prediabetes. Arch Physiol Biochem. 2020;126(4):308–319. doi:10.1080/13813455.2018.1534242
18. Liu T, Zhao Q, Du B. Effects of high-flow oxygen therapy on patients with hypoxemia after extubation and predictors of reintubation: a retrospective study based on the MIMIC-IV database. BMC Pulm Med. 2021;21(1):160. doi:10.1186/s12890-021-01526-2
19. Banks PA, Bollen TL, Dervenis C, et al.; Acute Pancreatitis Classification Working Group. Classification of acute pancreatitis–2012: revision of the Atlanta classification and definitions by international consensus. Gut. 2013;62(1):102–111. doi:10.1136/gutjnl-2012-302779
20. Harrison DA, D’Amico G, Singer M. Case mix, outcome, and activity for admissions to UK critical care units with severe acute pancreatitis: a secondary analysis of the ICNARC Case Mix Programme Database. Crit Care. 2007;11(Suppl 1):S1. doi:10.1186/cc5682
21. Pavlidis P, Crichton S, Lemmich Smith J, et al. Improved outcome of severe acute pancreatitis in the intensive care unit. Crit Care Res Pract. 2013;2013:897107. doi:10.1155/2013/897107
22. Ong Y, Shelat VG. Ranson score to stratify severity in Acute Pancreatitis remains valid-Old is gold. Expert Rev Gastroenterol Hepatol. 2021(15)8;1–13. doi:10.1080/17474124.2021.1924058
23. Shi L, Zhang D, Zhang J. Albumin-bilirubin score is associated with in-hospital mortality in critically ill patients with acute pancreatitis. Eur J Gastroenterol Hepatol. 2020;32(8):963–970. doi:10.1097/MEG.0000000000001753
24. Zhang Y, Xu Y, Wang D, et al. Prognostic value of preoperative glucose to lymphocyte ratio in patients with resected pancreatic cancer. Int J Clin Oncol. 2021;26(1):135–144. doi:10.1007/s10147-020-01782-y
25. Zhong A, Cheng CS, Kai J, Lu R, Guo L. Clinical significance of glucose to lymphocyte ratio (GLR) as a prognostic marker for patients with pancreatic cancer. Front Oncol. 2020;10:520330. doi:10.3389/fonc.2020.520330
26. Navarro J, Kang I, Hwang HK, Yoon DS, Lee WJ, Kang CM. Glucose to lymphocyte ratio as a prognostic marker in patients with resected pT2 gallbladder cancer. J Surg Res. 2019;240:17–29. doi:10.1016/j.jss.2019.02.043
27. Rajaratnam SG, Martin IG. Admission serum glucose level: an accurate predictor of outcome in gallstone pancreatitis. Pancreas. 2006;33(1):27–30. doi:10.1097/01.mpa.0000222315.36490.9b
28. Ranson JH, Rifkind KM, Roses DF, Fink SD, Eng K, Spencer FC. Prognostic signs and the role of operative management in acute pancreatitis. Surg Gynecol Obstet. 1974;139(1):69–81.
29. Kikuta K, Masamune A, Shimosegawa T. Impaired glucose tolerance in acute pancreatitis. World J Gastroenterol. 2015;21(24):7367–7374. doi:10.3748/wjg.v21.i24.7367
30. Xue Y, Sheng Y, Dai H, Cao H, Liu Z, Li Z. Risk of development of acute pancreatitis with pre-existing diabetes: a meta-analysis. Eur J Gastroenterol Hepatol. 2012;24(9):1092–1098. doi:10.1097/MEG.0b013e328355a487
31. Zechner D, Spitzner M, Bobrowski A, Knapp N, Kuhla A, Vollmar B. Diabetes aggravates acute pancreatitis and inhibits pancreas regeneration in mice. Diabetologia. 2012;55(5):1526–1534. doi:10.1007/s00125-012-2479-3
32. Whitcomb BW, Pradhan EK, Pittas AG, Roghmann MC, Perencevich EN. Impact of admission hyperglycemia on hospital mortality in various intensive care unit populations. Crit Care Med. 2005;33(12):2772–2777. doi:10.1097/01.ccm.0000189741.44071.25
33. Egi M, Bellomo R, Stachowski E, et al. Blood glucose concentration and outcome of critical illness: the impact of diabetes. Crit Care Med. 2008;36(8):2249–2255. doi:10.1097/CCM.0b013e318181039a
34. Chen ZQ, Yu XS, Mao LJ, et al. Prognostic value of neutrophil-lymphocyte ratio in critically ill patients with cancer: a propensity score matching study. Clin Transl Oncol. 2021;23(1):139–147. doi:10.1007/s12094-020-02405-8
35. Gukovsky I, Li N, Todoric J, Gukovskaya A, Karin M. Inflammation, autophagy, and obesity: common features in the pathogenesis of pancreatitis and pancreatic cancer. Gastroenterology. 2013;144(6):1199–209.e4. doi:10.1053/j.gastro.2013.02.007
36. Liu Y, Wang L, Cai Z, et al. The decrease of peripheral blood CD4+ T cells indicates abdominal compartment syndrome in severe acute pancreatitis. PLoS One. 2015;10(8):e0135768. doi:10.1371/journal.pone.0135768
37. Yang Z, Zhang Y, Dong L, et al. The reduction of peripheral blood CD4+ T cell indicates persistent organ failure in acute pancreatitis. PLoS One. 2015;10(5):e0125529. doi:10.1371/journal.pone.0125529
38. Dabrowski A, Osada J, Dabrowska MI, Wereszczynska-Siemiatkowska U. Monocyte subsets and natural killer cells in acute pancreatitis. Pancreatology. 2008;8(2):126–134. doi:10.1159/000123605
39. Wei X, Yao W, Li H, et al. B and NK cells closely correlate with the condition of patients with acute pancreatitis. Gastroenterol Res Pract. 2019;2019:7568410. doi:10.1155/2019/7568410
40. Bhatia M, Wong FL, Cao Y, et al. Pathophysiology of acute pancreatitis. Pancreatology. 2005;5(2–3):132–144. doi:10.1159/000085265
41. Leibovitz E, Adler H, Giryes S, Ditch M, Burg NF, Boaz M. Malnutrition risk is associated with hypoglycemia among general population admitted to internal medicine units. Results from the MENU study. Eur J Clin Nutr. 2018;72(6):888–893. doi:10.1038/s41430-018-0143-9
42. Ledger E, Harawa PP, Daniel AI, Candler T, Prentice AM, Bandsma RHJ. Dysglycemia in children with severe acute malnutrition: a systematic review and meta-analysis. Adv Nutr. 2021;12(3):959–968. doi:10.1093/advances/nmaa138
43. Viana-Llamas MC, Arroyo-Espliguero R, Silva-Obregón JA, et al. Hypoalbuminemia on admission in COVID-19 infection: an early predictor of mortality and adverse events. A retrospective observational study. Med Clin. 2021;156(9):428–436. doi:10.1016/j.medcli.2020.12.018
 © 2021 The Author(s). This work is published and licensed by Dove Medical Press Limited. The full terms of this license are available at https://www.dovepress.com/terms.php and incorporate the Creative Commons Attribution - Non Commercial (unported, v3.0) License.
By accessing the work you hereby accept the Terms. Non-commercial uses of the work are permitted without any further permission from Dove Medical Press Limited, provided the work is properly attributed. For permission for commercial use of this work, please see paragraphs 4.2 and 5 of our Terms.
© 2021 The Author(s). This work is published and licensed by Dove Medical Press Limited. The full terms of this license are available at https://www.dovepress.com/terms.php and incorporate the Creative Commons Attribution - Non Commercial (unported, v3.0) License.
By accessing the work you hereby accept the Terms. Non-commercial uses of the work are permitted without any further permission from Dove Medical Press Limited, provided the work is properly attributed. For permission for commercial use of this work, please see paragraphs 4.2 and 5 of our Terms.