")
Back to Journals » Cancer Management and Research » Volume 10
Prognostic significance of leukopenia during the induction phase in adult B cell acute lymphoblastic leukemia
Authors Xing C, Liang B, Wu J, Yang Q, Hu G, Yan Y, Zhang Y, Jiang S, Yu K, Feng J
Received 29 November 2017
Accepted for publication 12 February 2018
Published 28 March 2018 Volume 2018:10 Pages 625—635
DOI https://doi.org/10.2147/CMAR.S158359
Checked for plagiarism Yes
Review by Single anonymous peer review
Peer reviewer comments 2
Editor who approved publication: Dr Kenan Onel
Chongyun Xing,1,* Bin Liang,1,* Junqing Wu,1 Qianqian Yang,1 Gang Hu,1 Ye Yan,1 Yu Zhang,1 Songfu Jiang,1 Kang Yu,1 Jianhua Feng1,2
1Division of Hematology, The First Affiliated Hospital of Wenzhou Medical University, Wenzhou, PR China; 2Division of Pediatric Hematology-Oncology, The First Affiliated Hospital of Wenzhou Medical University, Wenzhou, PR China
*These authors contributed equally to this work
Abstract: The association between chemotherapy-induced leukopenia and clinical outcome has been reported for several types of cancer. The objective of the current study was to evaluate the association of chemotherapy-induced leukopenia during the induction phase with the clinical outcome of adult B cell acute lymphoblastic leukemia (B-ALL). Fifty-one cases of B-ALL, age ≥14 years, were reviewed. The variables under consideration included age, sex, the initial white blood cell (WBC) count (WBC-0), as well as the WBC counts on days 8 (WBC-8), 15 (WBC-15), and 22 (WBC-22) during induction therapy, early bone marrow responses on day 15 during induction therapy, immunophenotype, and cytogenetics. Univariate analysis revealed that WBC-15 ≥0.40×10⁹/L was significantly associated with inferior event-free survival (EFS) (hazard ratio [HR]=2.95, P=0.004) and overall survival (OS) (HR=2.92, P=0.015). On multivariate analysis, high WBC-15 (≥0.40×10⁹/L) remained an independent prognostic factor for EFS (HR=3.29, P=0.014) and OS (HR=3.29, P=0.038). Our results suggested that WBC-15 may contribute to refinements in the current risk stratification algorithms for adult B-ALL.
Keywords: adult acute lymphoblastic leukemia, chemotherapy, white blood cell count, prognosis, survival
Introduction
Acute lymphoblastic leukemia (ALL) is a relatively infrequent malignant hematopoietic neoplasm in adolescents and adults. Despite significant improvements in the management of pediatric ALL patients, because of the contemporary risk-adapted treatment and improved supportive care, for whom long-term survival approaches 90%, the long-term survival rates for adults with ALL remain poor at 40%.1,2 Refinement of the current risk stratification for predicting clinical outcome of this disease is important because treatments can be optimized on the basis of accurate estimation of outcome. Current ALL therapeutic regimens risk-stratify patients based on the patient clinical features (such as age and white blood cell [WBC] count at diagnosis), tumor biologic features (such as immunophenotype, cytogenetic profile, and molecular genetic profile), and early response to initial chemotherapy.3–6 However, identification of additional prognostic markers is still needed to permit better risk stratification, promote the development of novel therapies, as well as improve the outcome of this disease.
Hematologic toxicity (leukopenia, thrombocytopenia, and anemia) is the most common dose-limiting side effect of combination chemotherapy in the treatment of acute leukemia. Despite the use of similar chemotherapy regimens, the degree of acute hematotoxicity among patients is heterogeneous. Several studies have suggested that chemotherapy-induced hematotoxicity might be used as a measure of the biologic activity of cytotoxic drugs.7 The degree of hematotoxicity caused by cytotoxic drugs is probably influenced by the known pharmacokinetic parameters, which reflect individual metabolism and elimination capabilities,8 and thus may correlate with the systemic availability of chemotherapeutic drugs.9 Furthermore, the correlation between hematotoxicity and disease control has been investigated in several diseases. Studies of adjuvant treatment in breast cancer have shown that patients who had increased hematotoxicity during treatment had better clinical outcome than did those whose hematotoxicity was less severe.10–13 Additionally, chemotherapy-induced myelosuppression has also been described to be linked to the clinical outcome in patients with testicular cancer,14 ovarian cancer,15 non-small-cell lung cancer,16 and lymphoma.17,18 More relevantly, the degree of myelosuppression during maintenance therapy has been shown to be associated with the risk of relapse in adolescents with intermediate-risk B cell ALL (B-ALL).19 Furthermore, chemotherapy-induced leukopenia during the consolidation phase has only recently been shown to correlate with relapse-free survival in childhood high-risk ALL.20 However, the influence of chemotherapy-induced leukopenia during the induction phase on the clinical outcome of adult B-ALL patients has not been established.
The objective of the current study was to evaluate the possible association between chemotherapy-induced leukopenia during the induction phase and clinical outcome in a cohort of 51 adult patients with newly diagnosed B-ALL.
Patients and methods
Patients
Patients were enrolled in the study if they were 14 years of age or older, diagnosed with B-ALL, treated at the First Affiliated Hospital of Wenzhou Medical University between February 2010 and June 2016, and had adequate medical records available for review. B-ALL was diagnosed based on standard criteria, which included morphologic, immunophenotypic, and cytogenetic features. The definition and assessment for adult ALL were determined according to NCCN Guideline Version 1.2014 Acute Lymphoblastic Leukemia.21 The study was reviewed and approved by the Institutional Review Board of the First Affiliated Hospital of Wenzhou Medical University. The requirement for patient informed consent was waived by the Institutional Review Board because of the retrospective nature of this study, but patient confidentiality was protected.
Medical records were reviewed to determine age, sex, initial WBC count (WBC-0), as well as the WBC counts on days 8 (WBC-8), 15 (WBC-15), and 22 (WBC-22) during induction therapy, early bone marrow (BM) responses on day 15 during induction therapy, immunophenotype, and cytogenetics. The value for WBC count was obtained from the clinical laboratory records, and was determined either by the hematology automatic analyzer Sysmex XE-2100 (Sysmex, Kobe, Japan) or manual differential (in cases flagged for abnormal values). Early BM responses to treatment on day 15 of induction therapy, evaluated using routine cytologic examination, were defined as M1, M2, or M3 marrow if the residual blast percent was <5, 5–25, or >25, respectively, regardless of cellularity.
For the cytogenetic study, BM samples at diagnosis were obtained and systematically examined by R- and/or G-banding techniques. The criteria of the International System for Human Cytogenetic Nomenclature22 were employed for karyotype descriptions. Risk status based on cytogenetics was defined as follows: favorable: 12p and 14q11 rearrangements, hyperdiploidy (51–65 chromosomes); unfavorable: t(9;22) (q34;q11.2):BCR/ABL1, t(v;11q23):MLL rearrangement, t(1;19) (q23;p13.3):E2A/AML1, hypodiploidy (<44 chromosomes), complex karyotype (5 or more chromosomal abnormalities); and intermediate: abnormalities other than those in categories favorable or unfavorable.23–25
Treatment
Figure 1 shows the flow chart with treatment and outcome of the patients. All patients received 4-week induction therapy with VDCP±L (vincristine 1.5 mg/m2 or vindesine 4 mg, days 1, 8, 15, and 22; daunorubicin 45 mg/m2 or idarubicin 8 mg/m2, days 1–3; cyclophosphamide 600–750 mg/m2, days 1 and/or 15; prednisone 60 mg/m2, days 1–21). A supplement of 6,000 IU/m2 l-asparaginase every other day was added on days 19–29 when BM blasts persisted >5% on day 15. Eighteen patients with Philadelphia-positive ALL received an extra 400 mg/day imatinib or 140 mg/day dasatinib. After induction, the response was evaluated following the recommendation by NCCN Guidelines. Thirty-nine patients after the first induction therapy achieved complete remission (CR), which was defined as the absence of detectable leukemia cells in blood smears, a BM with active hematopoiesis and <5% leukemia blast cells, and without extramedullary disease. Two patients died during induction because of treatment toxicity. Of the remaining 10 patients who did not achieve CR after the first induction therapy, 9 patients received a second course of induction therapy with VDCP±L and 1 patient was administered a second-line induction, FLAM (fludarabine, cytarabine, and mitoxantrone). Eight out of 10 patients achieved CR after the second induction therapy; 1 patient died of infection during the second induction therapy and the remaining 1 patient was refractory. For 47 patients who achieved CR after 1 or 2 induction therapies, consolidation therapy26 alternating with high-dose methotrexate or cytarabine followed. Early relapses were observed in 7 patients, and 2 died because of treatment toxicity. Among the 38 patients in CR, after consolidation, allogeneic hematopoietic stem cell transplantation (HSCT) was performed in 15, and the remaining 23 underwent maintenance therapy. Central nervous system prophylaxis consisted of intrathecal therapy with methotrexate, cytarabine, and dexamethasone administered twice during the induction therapy as well as once during each consolidation. Overall 27 patients died; 10 as a consequence of the therapy (3 in induction, 2 in consolidation, 4 in maintenance, and 1 as a consequence of the HSCT) and 17 because of disease progression. Twenty-one patients are currently alive in remission (Figure 1).
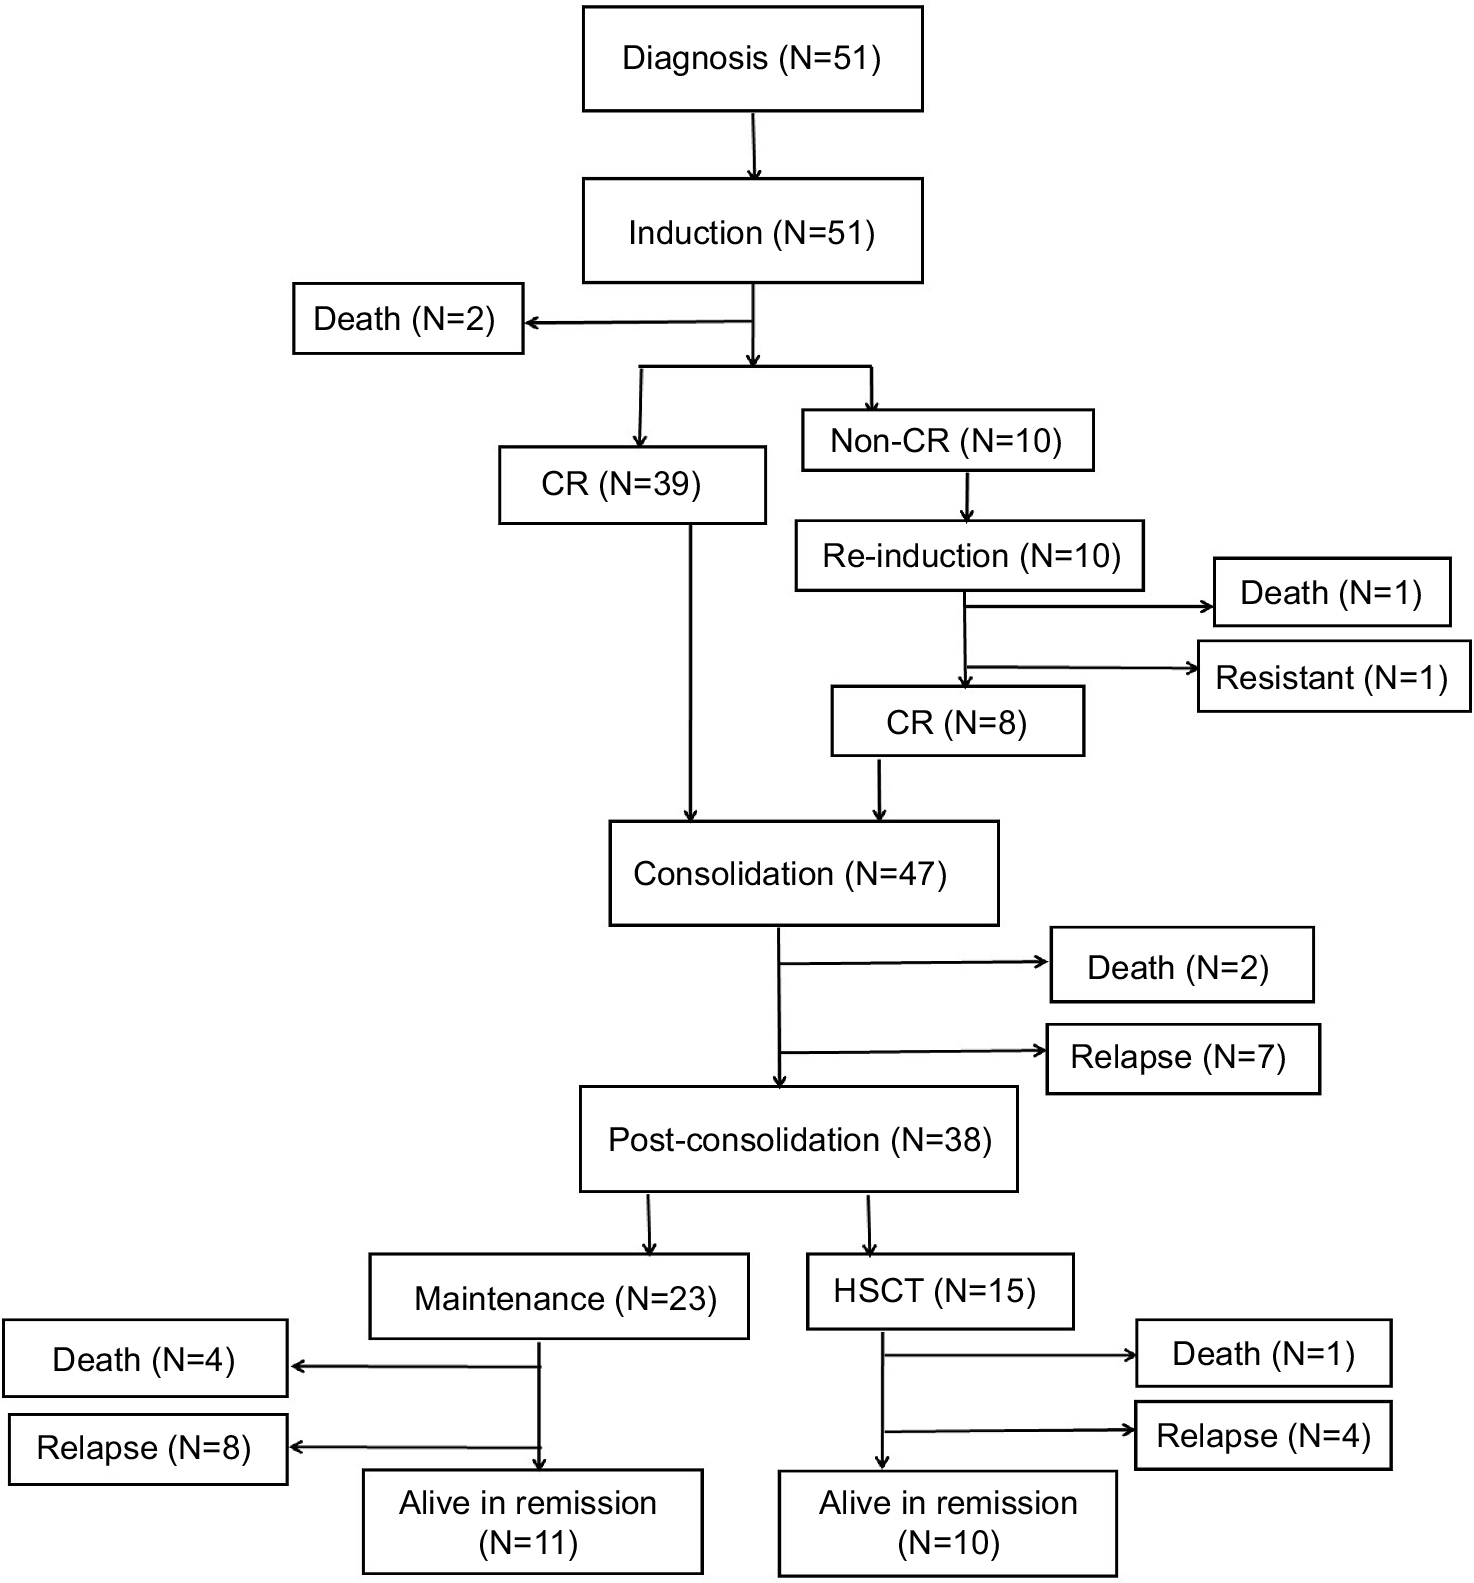 | Figure 1 Flow chart of the patients. Abbreviations: CR, complete remission; HSCT, hematopoietic stem cell transplantation. |
Statistical analysis
Receiver operating characteristic (ROC) curves were derived from the WBC values and survival status. In an ROC curve, the sensitivity and specificity were calculated by combining the optimal cut-off value and survival outcome. Categorical covariates were compared using the chi-square test or Fisher’s exact test and numerical covariates were compared using the Wilcoxon rank-sum test. Event-free survival (EFS) was calculated from the initiation of the treatment to the date of first event (induction failure, relapse, second malignancy, or death from any cause) occurrence or last follow-up. Induction failure was defined as non-CR at the end of the first induction therapy. In the case of induction failure, EFS was set to the first day. Overall survival (OS) was computed from the date of the start of the induction therapy until the date of death from any cause or the last follow-up. EFS and OS were estimated by Kaplan–Meier analysis and compared using the log-rank test. Univariate and multivariate analyses with the Cox proportional hazards model were performed to evaluate the potential risk factors for EFS and OS. Variables with P-value <0.15 in the univariate analysis were included in the multivariate Cox proportional hazards model. All tests were 2-sided and P-value <0.05 was considered to indicate significance. Stata version 12 software (StataCorp LP, College Station, TX, USA) was used for all statistical analyses.
Results
Cut-off value for WBC-15
The potential prognostic factors were initially chosen in an unbiased manner using the median values of WBC counts at different time points during induction therapy as cut-off values. The median values for the initial WBC count as well as WBC-8, WBC-15, and WBC-22 were 11.50, 0.60, 0.39, and 2.40×10⁹/L, respectively. Kaplan–Meier analysis (log-rank test) showed that only WBC-15 was associated with both EFS (P=0.0013) and OS (P=0.0046) when a cut-off point of median value was used. In addition, the ROC curve was also performed to analyze the correlation between different WBC count levels during induction therapy and the survival status of death/survival. The areas under the ROC curve for WBC-0, WBC-8, WBC-15, and WBC-22 were 0.560 (95% CI: 0.397–0.723), 0.419 (95% CI: 0.257–0.581), 0.759 (95% CI: 0.616–0.901), and 0.655 (95% CI: 0.496–0.813), indicating that only WBC-15 was predictive of survival. The optimal cut-off value for WBC-15 was 0.40×10⁹/L, yielding sensitivity and specificity for predicting survival of 74.07% and 79.17%, respectively. Thus, we chose the WBC-15 with a cut point of 0.40×10⁹/L, quite close to the median value of WBC-15, as a threshold value to discriminate patients with different probabilities of survival at the interim of induction therapy.
Patient characteristics
Patient characteristics are summarized in Table 1. Fifty-one patients were evaluable. The median age was 38 years (range: 14–64 years) with 17 (33.3%) males. The median WBC count at diagnosis was 11.5×10⁹/L (range: 0.74–972.4×10⁹/L). Two percent of patients (N=1) had favorable karyotype, 54.9% (N=28) intermediate karyotype, and 43.1% (N=22) unfavorable karyotype. A total of 26 and 25 patients showed low (<0.40×10⁹/L) and high WBC-15 (≥0.40×10⁹/L), respectively. Although WBC-15 <0.40×10⁹/L was more correlated with lower WBC count at diagnosis, no statistical significance was observed (P>0.05). In addition, no relationship was shown between WBC-15 and the percentage of residual BM blasts on day 15 of induction therapy (P=0.414).
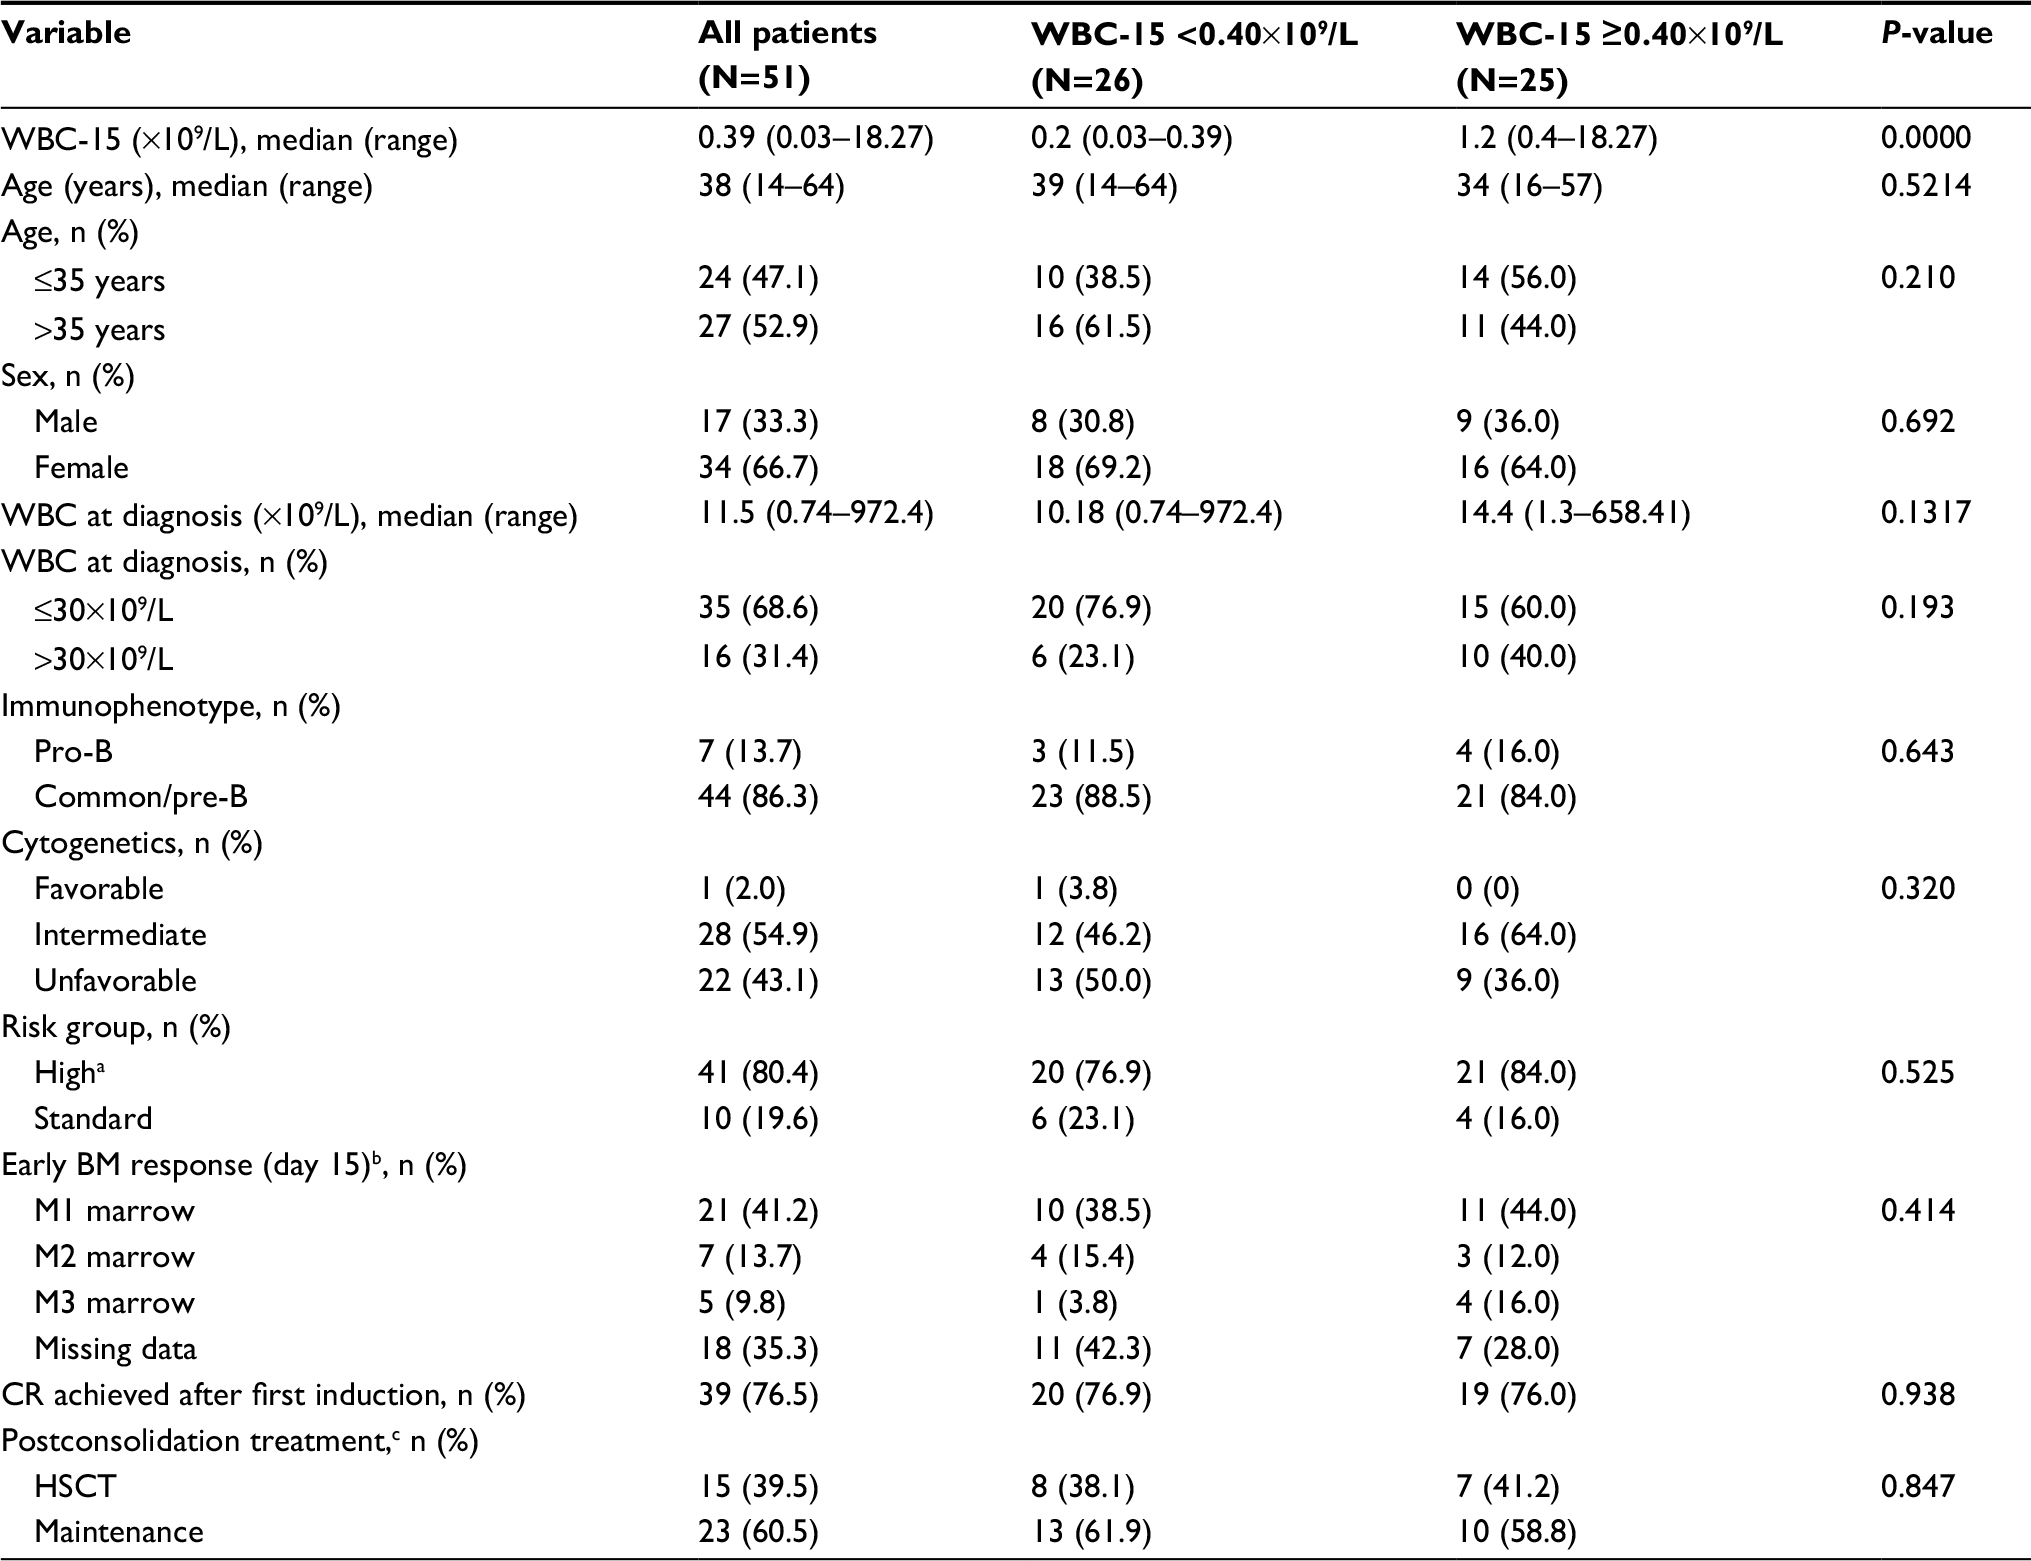 | Table 1 Patient characteristics in adult B-ALL cohorts Notes: aHigh-risk group was defined by the presence of at least 1 of the following parameters: age >35 years, WBC count at diagnosis >30×109/L, pro-B phenotype, 2 courses of induction required to achieve CR, and unfavorable cytogenetic features. bEarly BM responses to the treatment on day 15 of induction therapy were defined as follows: M1 marrow <5%, M2 marrow ≤25% and ≥5%, M3 marrow >25%. cOnly patients who completed consolidation in CR are considered. Abbreviations: B-ALL, B cell acute lymphoblastic leukemia; BM, bone marrow; CR, complete remission; HSCT, hematopoietic stem cell transplantation; WBC, white blood cell; WBC-15, WBC count on day 15. |
Prognostic impact of WBC-15
A total of 33 events occurred during the present study: 10 in the WBC-15 <0.40×10⁹/L group (5 induction failures, 4 relapses, and 1 nonrelapse mortality) and 23 in the WBC-15 ≥0.40×10⁹/L group (5 induction failures, 13 relapses, and 5 nonrelapse mortalities). With a median follow-up duration of 15.5 months (range: 0.8–70.7), the 3-year EFS and OS rates estimated for the entire cohort were 21.9% and 30.1%, respectively. The detailed information regarding treatment and follow-up of the 51 adult B-ALL patients is shown in Table S1.
Kaplan–Meier analysis showed that the patients with WBC-15 <0.40×10⁹/L had a significantly superior EFS and OS: the 2-year EFS estimate was 52.0%±13.9% (N=26, 95% CI: 23.3%–74.5%) vs. 4.3%±4.2% (N=25, 95% CI: 0.3%–18.2%) for the patients with WBC-15 ≥0.40×10⁹/L (P=0.0020; Figure 2A); the 3-year OS estimate was 66.4%±10.8% (N=26, 95% CI: 41.1%–82.8%) vs. 11.2%±7.1% (N=25, 95% CI: 2.1%–29.0%) for the patients with WBC-15 ≥0.40×10⁹/L (P=0.0111; Figure 2B).
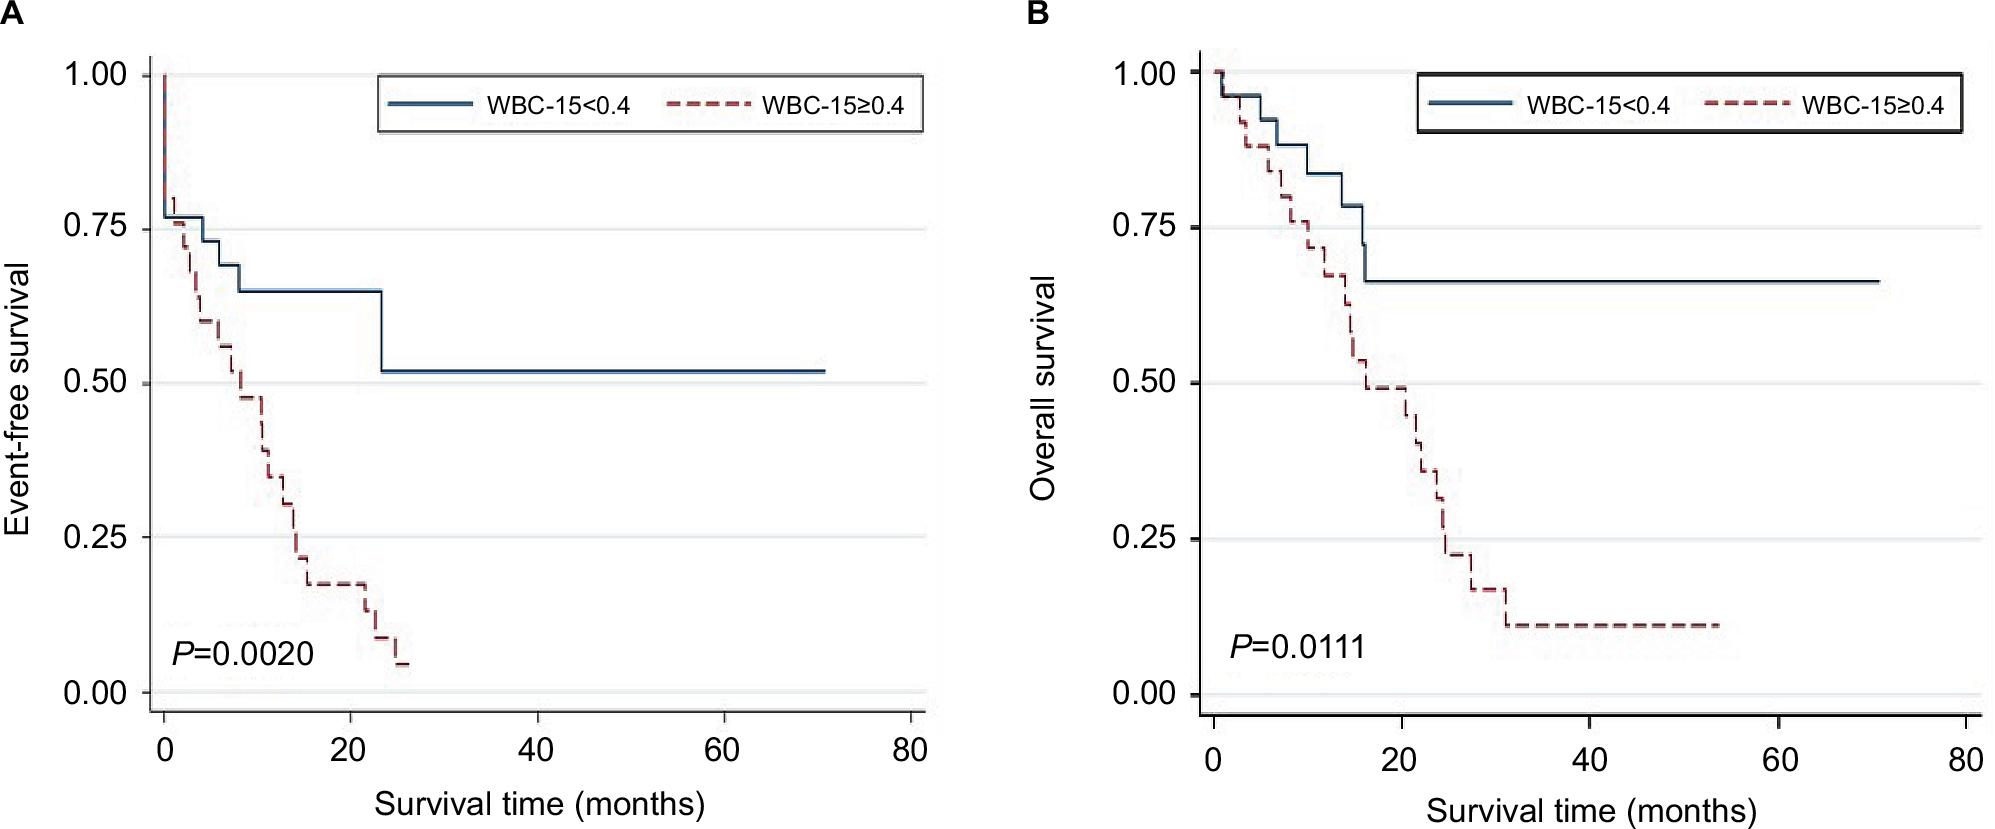 | Figure 2 Kaplan–Meier estimates of EFS and OS in adult patients with B cell acute lymphoblastic leukemia. Notes: Patients with a WBC-15 <0.40×10⁹/L vs. patients with a WBC-15 ≥0.40×10⁹/L. (A) The 2-year EFS was 52.0%±13.9% (N=26, 95% CI: 23.3%–74.5%) vs. 4.3%±4.2% (N=25, 95% CI: 0.3%–18.2%), respectively, P=0.0020. (B) The 3-year OS was 66.4%±10.8% (N=26, 95% CI: 41.1%–82.8%) vs. 11.2%±7.1% (N=25, 95% CI: 2.1%–29.0%), respectively, P=0.0111. P-values were based on the log-rank test. WBC-15 indicates WBC count on day 15 during induction therapy. Abbreviations: EFS, event-free survival; OS, overall survival; WBC, white blood cell. |
Results of the univariate and multivariate analyses for factors associated with EFS and OS are presented in Tables 2 and 3, respectively. The univariate analysis showed that WBC-15 ≥0.40×10⁹/L was significantly associated with inferior EFS (hazard ratio [HR]=2.95, 95% CI: 1.40–6.23, P=0.004) and OS (HR=2.92, 95% CI: 1.23–6.93, P=0.015; Table 2). Among the other factors included in univariate analysis, although early BM responses on day 15 during induction therapy (M2/M3 marrow vs. M1 marrow) were correlated with EFS (Table 2), no statistical significance was observed (P=0.102). Multivariate analysis that included all the parameters with P-value <0.15 in univariate analysis revealed that the high WBC-15 (≥0.40×10⁹/L) was independently associated with shorter EFS (HR=3.29, 95% CI: 1.28–8.49, P=0.014) and OS (HR=3.29, 95% CI: 1.07–10.09, P=0.038; Table 3).
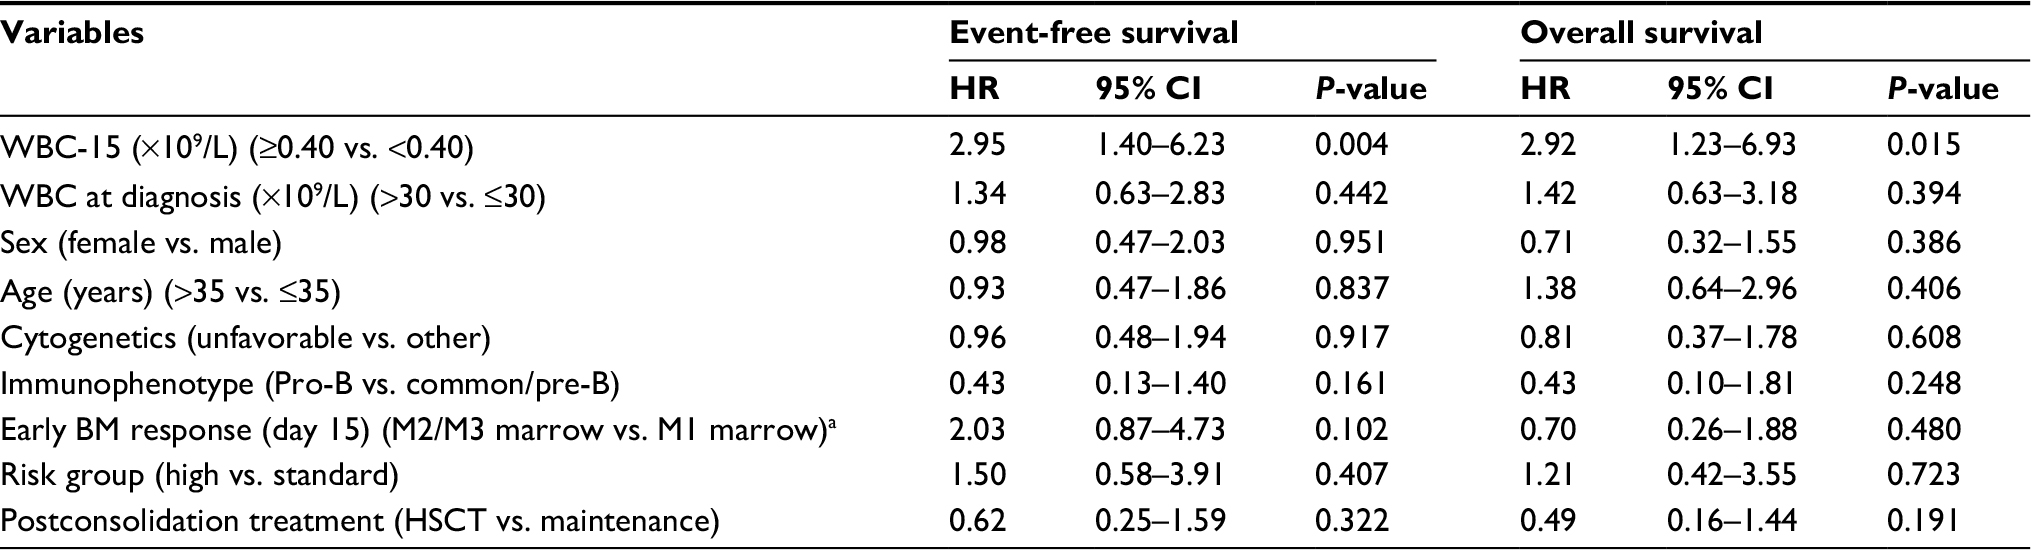 | Table 2 Univariate analysis for event-free and overall survival Notes: aOnly including 33 patients with available data on early BM response at day 15 of the induction therapy. Abbreviations: BM, bone marrow; HR, hazard ratio; HSCT, hematopoietic stem cell transplantation; WBC, white blood cell; WBC-15, WBC count on day 15. |
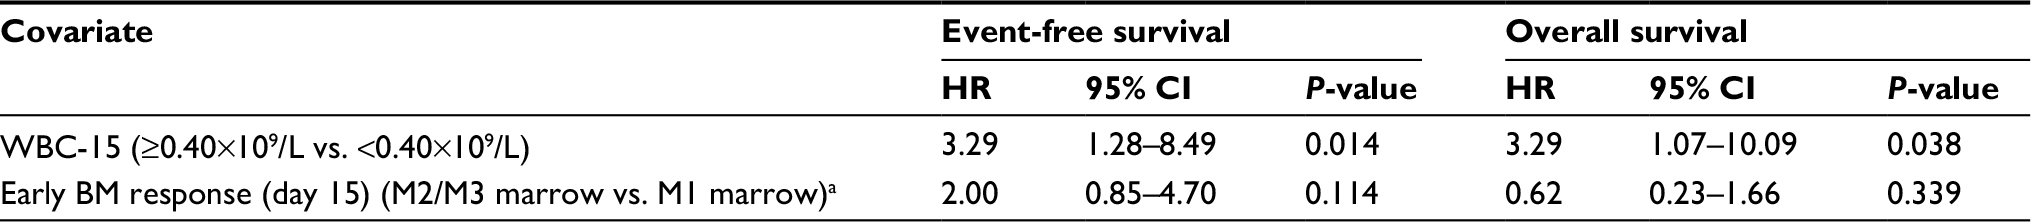 | Table 3 Multivariate analysis for event-free and overall survival Notes: aOnly including 33 patients with available data on early BM response at day 15 of the induction therapy. Abbreviations: BM, bone marrow; HR, hazard ratio; WBC, white blood cell; WBC-15, WBC count on day 15. |
Discussion
The association between chemotherapy-induced leukopenia and clinical outcome has been previously reported for several types of chemosensitive malignancies.10–18 This retrospective analysis was carried out in order to study a possible correlation between the development of leukopenia during the induction phase and clinical outcome in adult B-ALL patients treated with unified induction regimens. Our analysis shows that the patients with a low WBC (<0.40×10⁹/L) at the interim of induction therapy have a significantly superior EFS and OS. This provides additional prognostic information that may be used to further refine current risk stratification strategies for adult B-ALL. Han et al previously reported that a leukocyte nadir of >0.12×10⁹/L in the induction phase was associated with poor OS in older adults with acute myeloid leukemia, although no statistically significant difference was observed.27 This is consistent with our current findings.
ALL can be identified by a combination of morphologic, cytochemical, immunophenotypic, cytogenetic, and molecular assays. However, risk assessment of ALL patients should consider a range of clinical, biologic, and genetic features, such as age, initial WBC, immunophenotypic, cytogenetic, and molecular characteristics,3–6 as well as the response to therapy assessed with the minimal residual disease (MRD) clearance, which is currently shown to be the most important prognostic factor for ALL at any age.28 In childhood ALL, the observation that a rapid drop in peripheral WBCs and circulating lymphoblasts on day 8 of induction is a favorable prognostic factor was described many years ago.29 Our current study confirmed a similar finding in the setting of adult B-ALL, where a low WBC (<0.40×10⁹/L) at the interim of induction therapy can portend a superior prognosis.
A possible explanation for the observed association between chemotherapy-induced leukopenia and clinical outcome is that the absence of leukopenia may suggest a lack of efficacy of cytostatic drugs administered. It is proposed that the bioavailability of cytotoxicity drug is affected by pharmacokinetic factors, which produce a similar effect against both malignant and normal cells. Patients who experience low acute hematologic toxicity probably achieve lower concentrations of the cytostatic drugs because of greater drug metabolism and elimination capabilities. The correlation between the concentration of the cytostatic drugs and anticancer effect has been previously reported.30–32 With lower concentrations of the cytostatic drugs, reduced disease control may be expected. Not surprisingly then, hematologic toxicity, reflecting the ability of individual patients to metabolize antileukemic drugs, correlates with the prognosis of ALL. Wide interindividual variability in pharmacokinetics of most cytotoxic drugs has been described, for example, for doxorubicin, cyclophosphamide, ifosfamide, and others.33,34 The variation may be partially due to patient characteristics such as age, body mass index,35 and impaired liver and/or kidney function,36 but may also be due to genetic background.37 A number of drug-metabolizing enzymes including Phase I activation enzymes and Phase II detoxification enzymes form complex pharmacokinetic systems, which determine the effective dose of antileukemic drugs delivered to target cells. The activities of these drug-metabolizing enzymes are affected by gene polymorphisms, which present with individual differences.8 We speculate that, in the process of leukemia treatment, the detection of genetic polymorphisms and activities of drug-metabolizing enzymes, and monitoring the blood concentrations of antileukemic drugs might provide objective indicators for prognostic evaluation and treatment interventions (such as dose adjustment and change of chemotherapy protocols) to assist in attaining better treatment outcomes.
A second possible explanation for the deleterious effect of high WBC-15 is that blasts may not be cleared from peripheral blood at day 15 of the induction therapy; thus, high WBC-15 may reflect residual blasts and treatment resistance. However, due to the relative ineffectiveness of the hematology automatic analyzer in the proper recognition of abnormal cells and the inaccuracy of manual WBC differential counts for severely leukopenic samples, the information about the WBC differential counts is usually not available in the samples with WBC counts of <0.50×10⁹/L in our department. Therefore, we could not compare the percentages of peripheral blood blasts between patients with WBC-15 values above and below 0.40×10⁹/L. More sensitive and accurate methods, such as multiparameter flow cytometric methods for WBC differential counts,38,39 are needed to explore the above possibility.
The limitations of the present study include its retrospective nature and the relatively small sample size, and thus heterogeneity of the data was difficult to rule out. For example, although a unified programmed treatment was given in our patient cohort, it was possible for the dose of chemotherapeutic drugs to be adjusted according to the patient’s individual situation, such as with a comorbidity or the susceptibility to serious drug-related toxicity. Therefore, there is no guarantee that each patient has received a sufficient dose of chemotherapy. In addition, although the WBC-15 with a cut point of 0.40×10⁹/L was confirmed as the strongest predictor of survival outcome of B-ALL patients by ROC curve analysis, the predictive value of the selected variable should be tested in an independent cohort. Therefore, caution should be taken when interpreting the results of the present study; it might be premature to suggest that chemotherapy-induced leukopenia can be used as an independent prognosis factor to be incorporated into the prognostic models for B-ALL. Prospective studies with more patients, which can provide more detailed information, are needed to validate our work regarding the prognostic significance of WBC-15. Furthermore, most patients lack the data regarding the MRD status after induction, which is considered to be an important prognostic factor in the modern strategy of adult ALL.40 Therefore, the relationship between WBC-15 and MRD data after induction should be addressed in further studies.
In conclusion, we herein demonstrated that WBC-15 is a simple, significantly prognostic factor in a Chinese adult B-ALL cohort. Due to its advantages of convenience and low cost, WBC-15 may contribute to the refinement of current risk stratification algorithms for adult B-ALL, especially in most developing countries. Larger prospective studies are needed to confirm the existence of a correlation between WBC-15 and clinical outcome in adult B-ALL.
Acknowledgments
This study was supported by grants from the Public Welfare Science and Technology Project of Wenzhou (No. Y20160099) and the Natural Science Foundation of Zhejiang Province (Nos. LQ14H080002, LY12H08002, and LY16H080006).
Disclosure
The authors report no conflicts of interest in this work.
References
Supplementary material
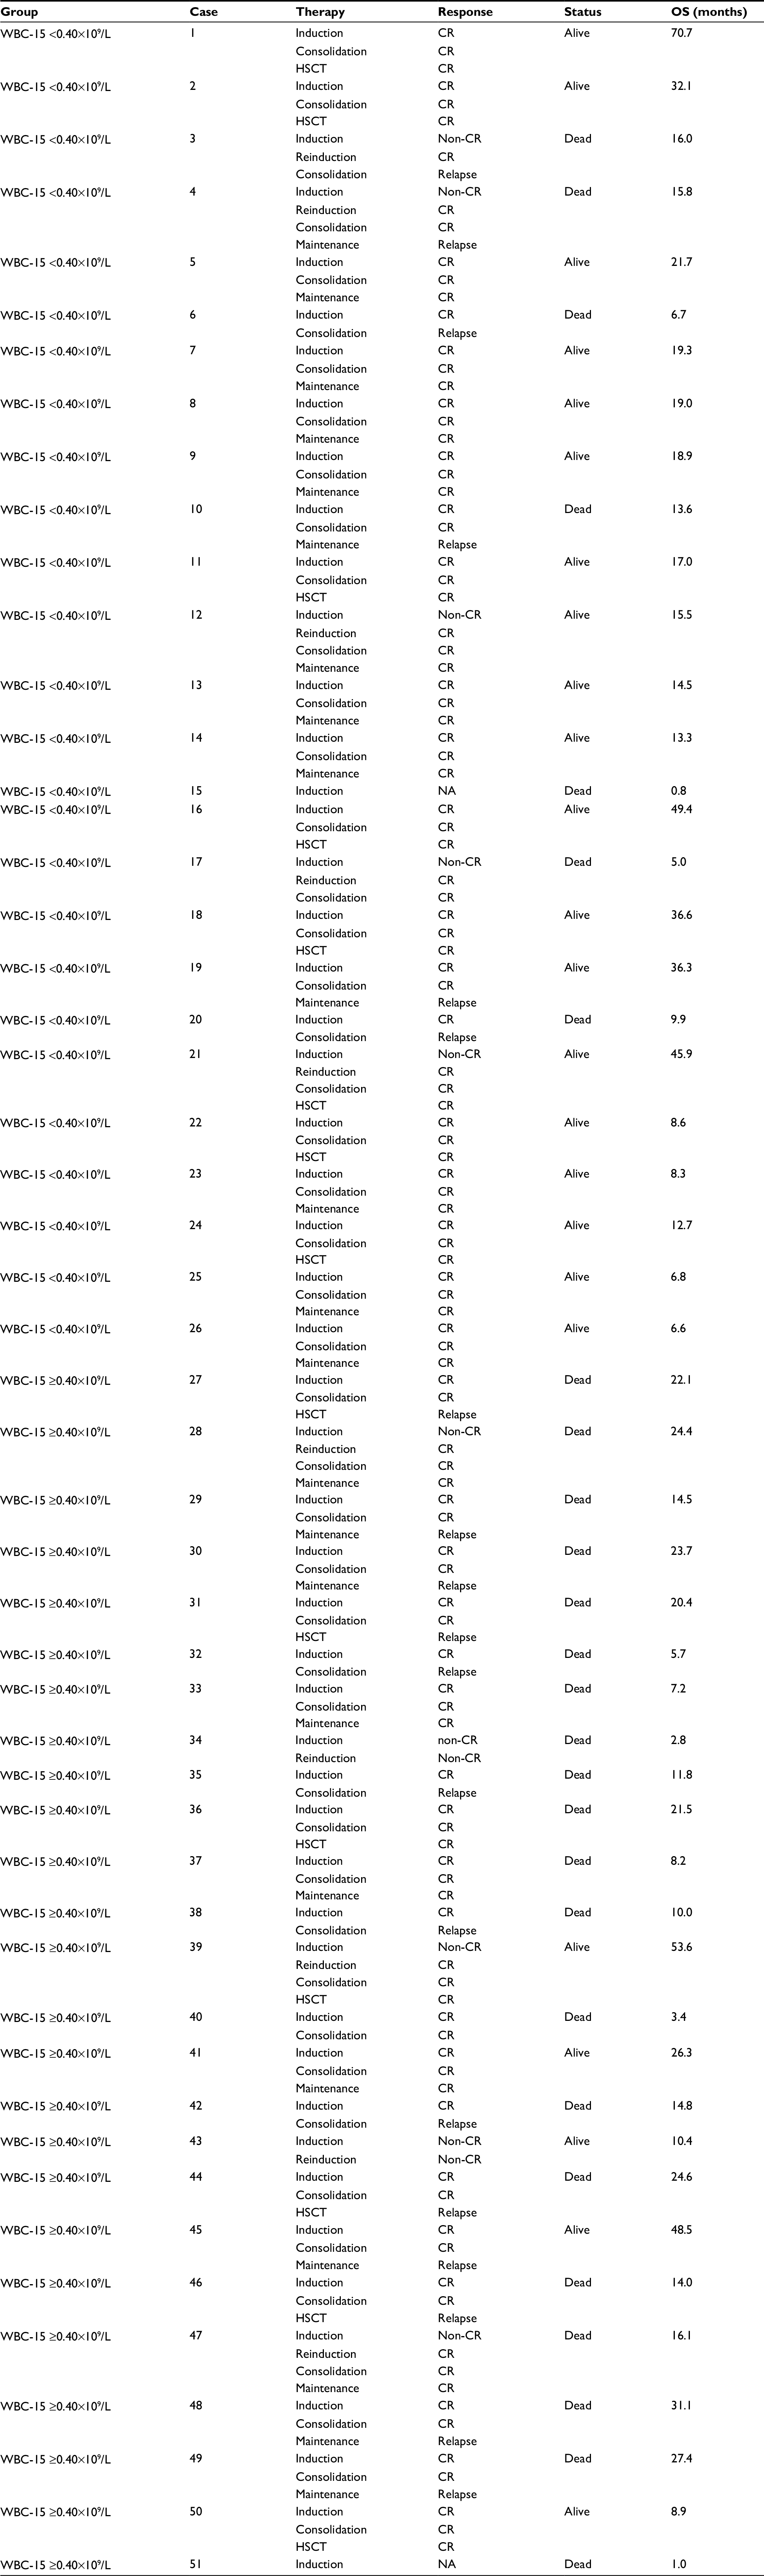 | Table S1 Treatment and follow-up of the 51 adult B-ALL patients Abbreviations: B-ALL, B cell acute lymphoblastic leukemia; CR, complete remission; HSCT, hematopoietic stem cell transplantation; NA, not available; OS, overall survival; WBC, white blood cell; WBC-15, WBC count on day 15. |
 © 2018 The Author(s). This work is published and licensed by Dove Medical Press Limited. The full terms of this license are available at https://www.dovepress.com/terms.php and incorporate the Creative Commons Attribution - Non Commercial (unported, v3.0) License.
By accessing the work you hereby accept the Terms. Non-commercial uses of the work are permitted without any further permission from Dove Medical Press Limited, provided the work is properly attributed. For permission for commercial use of this work, please see paragraphs 4.2 and 5 of our Terms.
© 2018 The Author(s). This work is published and licensed by Dove Medical Press Limited. The full terms of this license are available at https://www.dovepress.com/terms.php and incorporate the Creative Commons Attribution - Non Commercial (unported, v3.0) License.
By accessing the work you hereby accept the Terms. Non-commercial uses of the work are permitted without any further permission from Dove Medical Press Limited, provided the work is properly attributed. For permission for commercial use of this work, please see paragraphs 4.2 and 5 of our Terms.