")
Back to Journals » Cancer Management and Research » Volume 13
Prognostic Significance of CCNB2 Expression in Triple-Negative Breast Cancer
Authors Cao J , Sun S, Min R , Li R, Fan X, Han Y , Feng Z, Li N
Received 13 September 2021
Accepted for publication 21 December 2021
Published 31 December 2021 Volume 2021:13 Pages 9477—9487
DOI https://doi.org/10.2147/CMAR.S339105
Checked for plagiarism Yes
Review by Single anonymous peer review
Peer reviewer comments 2
Editor who approved publication: Dr Antonella D'Anneo
Jintao Cao,1,* Shuai Sun,1,* Rui Min,2,* Ran Li,3 Xingyu Fan,4 Yuexin Han,4 Zhenzhong Feng,3 Nan Li1,2
1Department of Pathology, Bengbu Medical College, Bengbu, Anhui Province, 233000, People’s Republic of China; 2Department of Pathology, The First Affiliated Hospital of Bengbu Medical College, Bengbu Medical College, Bengbu, Anhui Province, 233003, People’s Republic of China; 3Department of Pathology, The Second Affiliated Hospital of Anhui Medical University, Hefei, Anhui Province, 230601, People’s Republic of China; 4School of Clinical Medicine, Bengbu Medical College, Bengbu, Anhui Province, People’s Republic of China
*These authors contributed equally to this work
Correspondence: Nan Li
Department of Pathology, The First Affiliated Hospital of Bengbu Medical College, No. 287 Changhuai Road, Bengbu, Anhui Province, People’s Republic of China
Tel +86 18055201320
Email [email protected]
Zhenzhong Feng
Department of Pathology, The Second Affiliated Hospital of Anhui Medical University, Hefei, Anhui Province, People’s Republic of China
Tel +86 15055289508
Email [email protected]
Purpose: The aim of this study was to explore potential gene therapy targets for triple-negative breast cancer (TNBC).
Patients and Methods: Three gene expression profiles (GSE64790, GSE62931, and GSE38959) from the Gene Expression Omnibus (GEO) database were analyzed. The GEO2R analysis tool was used to screen for differentially expressed genes (DEGs) between TNBC and normal tissues, followed by Gene Ontology functional annotation and Kyoto Encyclopedia of Genes and Genomes pathway enrichment analysis of the DEGs. The protein–protein interaction network of DEGs was visualized using Metascape to identify the core genes. Subsequently, transcriptional data for the core genes in patients with breast cancer were investigated in the ONCOMINE database. Kaplan–Meier survival analysis was used to evaluate the prognostic value of core gene expression levels in patients with TNBC. Finally, the clinicopathological and long-term follow-up data of 39 patients with TNBC were retrospectively analyzed at the First Affiliated Hospital of the Bengbu Medical College between January 2014 and July 2020. Immunohistochemistry was used to evaluate the expression and subcellular localization of CCNB2 in TNBC tissues.
Results: A total of 66 DEGs were identified between TNBC and normal tissues, including 33 upregulated and 33 downregulated genes in TNBC. Furthermore, a potential protein complex was identified for five core genes. The high expression of these core genes, especially the overexpression of CCNB2, was correlated with a poor prognosis of patients with TNBC. The CCNB2 protein was expressed in the cytoplasm, and its expression was significantly higher in TNBC tissues than that in the adjacent nontumor tissues. Overall survival of patients was significantly correlated with the expression of CCNB2 (p < 0.05).
Conclusion: CCNB2 may play a crucial role in the development of TNBC and has the potential to be used as a prognostic biomarker for TNBC.
Keywords: triple-negative breast cancer, bioinformatics, prognosis, CCNB2, immunohistochemistry, overall survival
Introduction
Breast cancer has now surpassed lung cancer as the most common cancer, with an estimated 2.3 million new cases. According to reports, the incidence of breast cancer has increased annually in the past few decades, and it has become the most prevalent among female malignancies. Despite advances in the treatment and diagnosis, approximately 685,000 patients die from breast cancer in 2020 worldwide.1–3 Triple-negative breast cancer (TNBC), a special clinical subtype of breast cancer, which is characterized by negative expression of the estrogen receptor (ER), progesterone receptor (PR), and human epidermal growth factor receptor-2 (HER-2), accounts for 12% to 17% of all invasive breast cancers.4 Since TNBC demonstrates highly malignant features, such as strong invasiveness, early metastasis, frequent recurrence, and a short survival, it has attracted widespread attention.5
Owing to the abundance of molecular information from several public databases, such as Gene Expression Omnibus (GEO) and ONCOMINE,6 the mechanism of cancer progression can be researched using unparalleled methods. Additionally, the differentially expressed genes (DEGs) between cancer and normal tissues can be screened based on bioinformatics analysis. The identification of these oncogenes or tumor suppressor genes may lead to the prediction of potential biomarkers and may provide new therapeutic strategies for cancers. Among various bioinformatics methods, DEG analysis is a widely used independent tool to study gene upregulation and downregulation.7
In this study, we analyzed and validated cancer-related genes using bioinformatics methods to explore new therapeutic targets that could improve the overall prognosis of patients with TNBC.
Materials and Methods
Source of Data
The GEO database (https://www.ncbi.nlm.nih.gov/geo/) was used to download the original data, including the expression profiles of TNBC and non-TNBC tissues. A total of 4442 results for “TNBC” were retrieved from the GEO datasets, among which three TNBC-related gene expression profiles (GSE64790, GSE62931, and GSE38959) were selected. This study did not involve any human or animal experiments.
Screening for DEGs
In each profile, the data were divided into TNBC and non-TNBC subsets. The online analysis tool GEO2R (https://www.ncbi.nlm.nih.gov/geo/geo2r/) was used to analyze the data. An adjusted p-value of < 0.05 and a |log10 fold change (FC)| of ≥ 1.5 were defined as meaningful differences. Statistical analysis was then performed on the three datasets, and the Venn graph network tool (http://www.interactivenn.net/index.html) was used to determine the overlapping DEGs.
Gene Ontology (GO) and Kyoto Encyclopedia of Genes and Genomes (KEGG) Enrichment Analyses
The Database for Annotation, Visualization, and Integrated Discovery (DAVID) was used to simultaneously perform GO functional annotation and KEGG pathway enrichment analysis. In GO analysis, p < 0.01 and a count of ≥ 10 were defined as statistically significant. For KEGG pathway analysis, p < 0.01 was considered meaningful.
Protein–Protein Interaction (PPI) Network Construction and DisGeNET Analysis
Metascape (http://metascape.org/)8,9 was applied to analyze the enriched pathways and processes of DEGs and their adjacent genes, including GO terms for cellular component (CC), biological process (BP), and molecular function (MF) categories and KEGG pathways. A p-value of < 0.01, enrichment factor of > 1.5, and minimum count of 3 were considered meaningful. A subset of enriched terms was selected, and a network plot was drawn to further determine the relationships among the terms. The following databases were used for PPI enrichment analysis: BioGrid+, InWeb_IM+, and OmniPath+. Moreover, the molecular complex detection (MCODE) algorithm was used to identify tightly connected network components. Metascape-provided DisGeNET analysis was used to study and predict human disease-related genes.
ONCOMINE Database Analysis
Using the ONCOMINE (www.oncomine.org)10 database, we determined the mRNA expression levels of the SKA1, CCNB2, CENPF, CENPA, and BIRC5 genes in various cancers.
Kaplan–Meier Analysis
The Kaplan–Meier plotter (www.kmplot.com) was used to evaluate the prognostic value of DEGs in TNBC. The patient samples were divided into two groups (high and low expression) based on the median expression level. Using Kaplan–Meier survival plots, the relapse-free survival (RFS) of patients with TNBC was determined, and the risk ratio was estimated, along with the 95% confidence interval (CI) and the log-rank p-value.
Immunohistochemistry
TNBC specimens confirmed by pathological diagnosis were obtained from the Pathology Department of the First Affiliated Hospital of the Bengbu Medical College. CCNB2 expression was detected by immunohistochemical staining. The tissue sections were deparaffinized and dehydrated following routine protocols, and endogenous peroxidase activity was inactivated with 3% H2O2 in methanol. The primary antibody against CCNB2 (ab185622, Abcam, Cambridge, UK) was diluted to 1/100 with PBS. The tissue sections were then incubated with the relevant antibodies, stained with diaminobenzidine, and counterstained with hematoxylin. Except for the primary antibody, all reagents used in the immunohistochemical experiment were purchased from Fuzhou Maixin Biological Co. Ltd., Fujian Province, China. The positive cells were identified by the obvious brown granules in the cell membrane or cytoplasm.
Statistical Analysis
The Kaplan–Meier method was used for univariate overall survival (OS) analysis. OS was defined as the period from diagnosis to recurrence, metastasis, death, or the end of follow-up. The SPSS software version 22.0 (IBM, New York, NY, USA) was used for all statistical analyses. Statistical significance was set at p < 0.05.
Results
Identification of DEGs
In the GEO database, we selected three TNBC-related gene expression profiles (GSE64790, GSE62931, and GSE38959). The results showed that there were 600 DEGs in GSE62931, of which 269 were upregulated and 331 were downregulated in TNBC. GSE38959 had 1550 DEGs, of which 1010 were upregulated and 540 were downregulated in TNBC. In GSE64790, a total of 660 DEGs were detected, including 186 upregulated and 374 downregulated in TNBC. Venn diagram analysis resulted in the identification of a total of 66 overlapping DEGs, of which 33 were upregulated and 33 were downregulated in TNBC (Table 1, Figure 1).
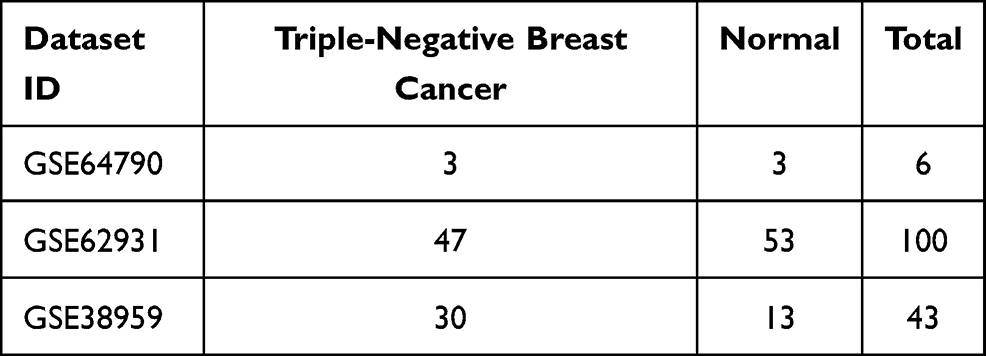 |
Table 1 Statistics of the Three Microarray Datasets Selected from the Gene Expression Omnibus Database |
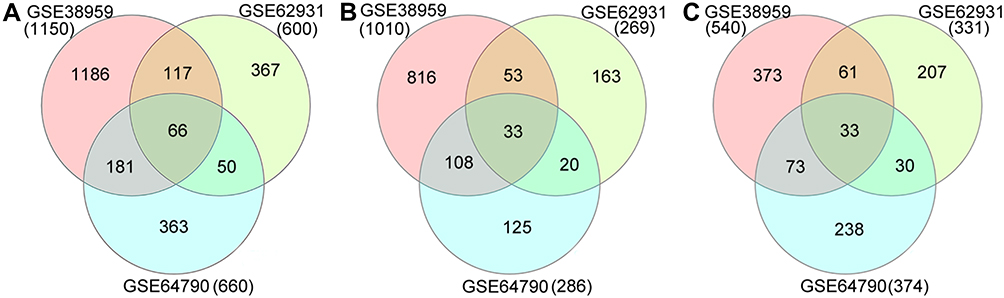 |
Figure 1 Venn diagrams of DEGs common to three Gene Expression Omnibus datasets. (A) Total DEGs; (B) upregulated DEGs; (C) downregulated DEGs. Abbreviation: DEG, differentially expressed gene. |
Functional Enrichment Analysis of DEGs in Patients with TNBC
The DEG list was entered into the DAVID for GO and KEGG pathway enrichment analyses. The enriched GO terms included the CC, BP, and MF categories. The results of GO analysis revealed that the DEGs were mainly enriched in BP terms related to mitosis and cell proliferation, CC terms related to the nucleus and nucleoplasm, and MF terms related to protein binding. In addition, KEGG pathway analysis revealed that the DEGs were mainly enriched in pathways related to progesterone-mediated oocyte maturation, oocyte meiosis, and the cell cycle (Table 2).
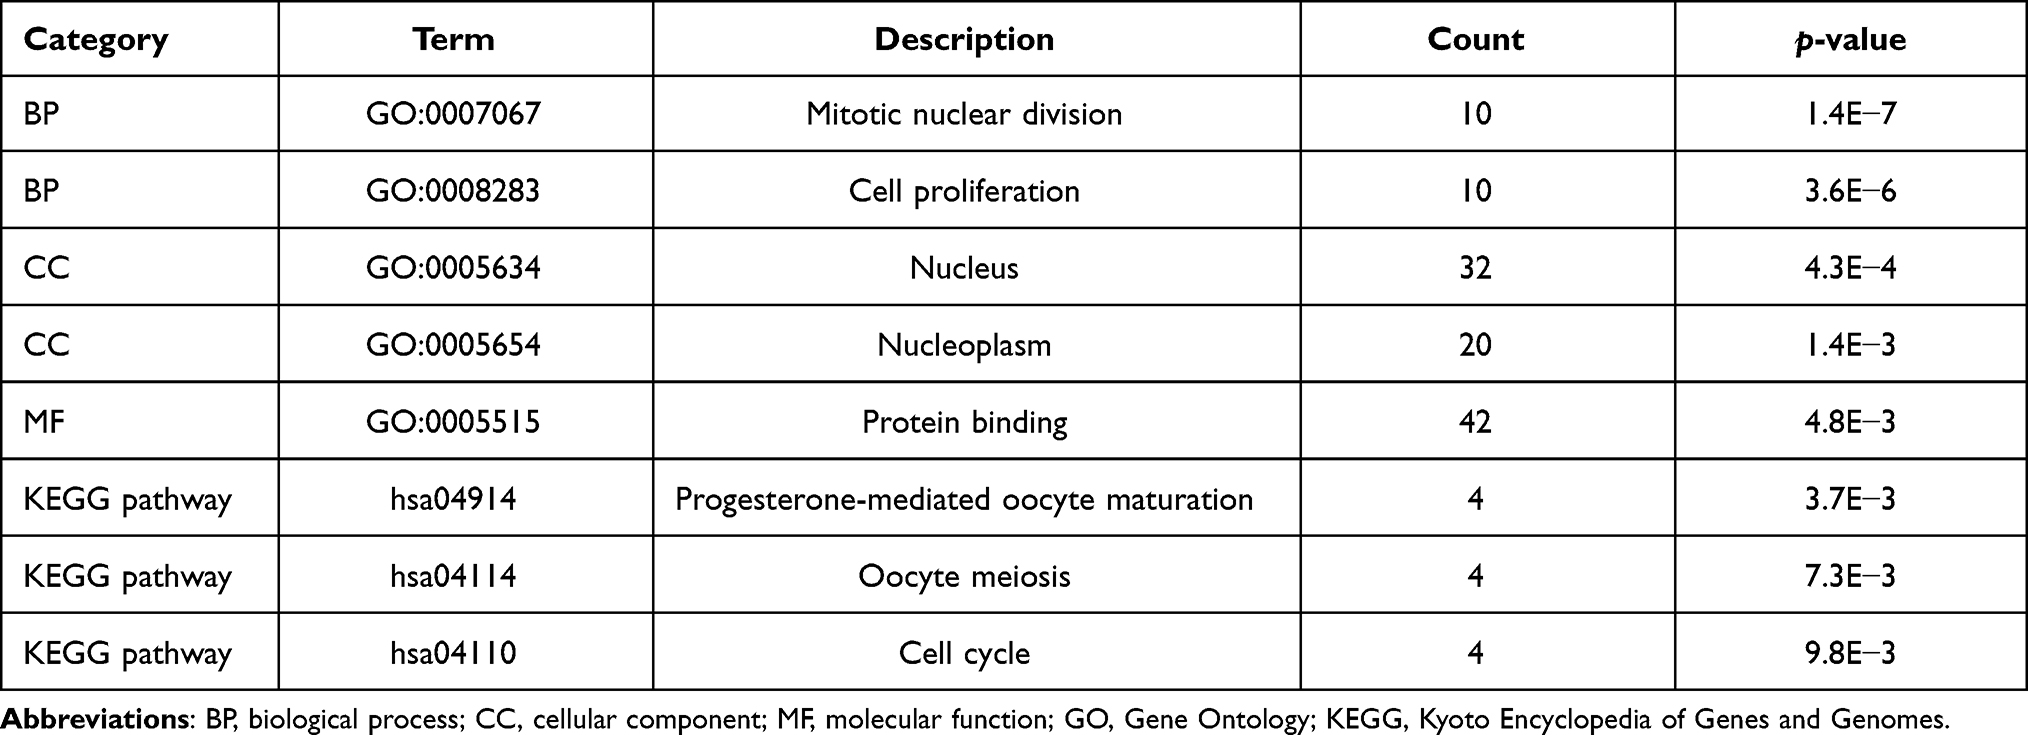 |
Table 2 Significantly Enriched GO Terms and KEGG Pathways |
The results of Metascape analysis showed that the DEGs and their neighboring genes were mainly enriched in cell division, mitotic nuclear division, and cell cycle phase transition (Figure 2A and B). Meanwhile, subnetwork analysis of the PPI network resulted in the identification of the potential protein complex for five core genes (CCNB2, BIRC5, CENPA, CENPF, and SKA1) (Figure 2C and D). Quality control and association analysis using DisGeNET showed that these DEGs were significantly related to the occurrence of invasive breast carcinoma, carcinoma of the male breast, malignant neoplasm of the male breast, and other diseases (p < 0.01) (Figure 2E).
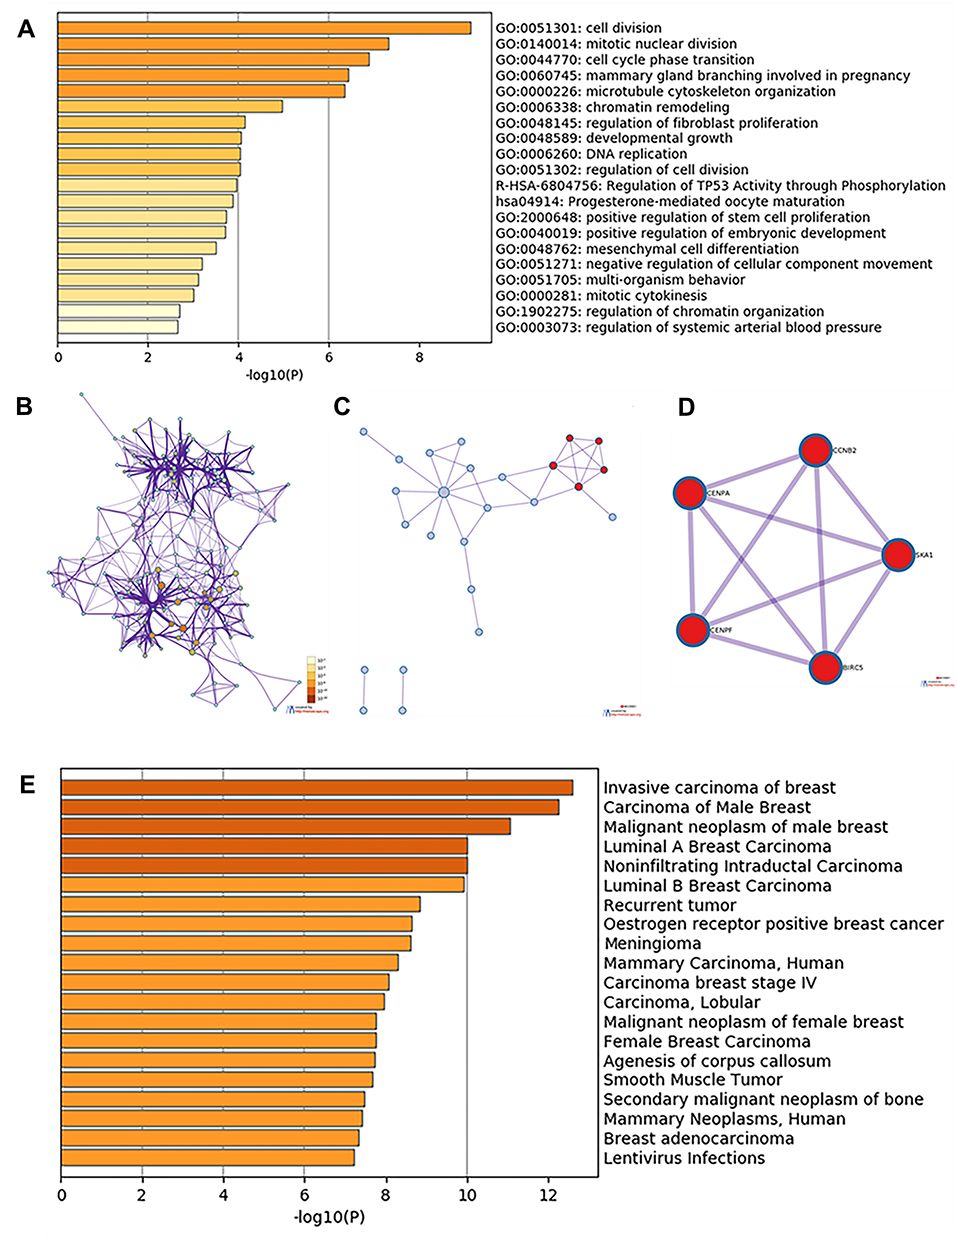 |
Figure 2 Enrichment analysis of DEGs and neighboring genes in triple-negative breast cancer. (A) Heatmap of enriched GO and KEGG terms, colored based on p-values. (B) Network of enriched GO and KEGG terms, colored based on p-values (terms containing more genes tend to have a more significant p-value). (C) PPI network. (D) Five most significant MCODE components from the PPI network. (E) DisGeNET data for the DEGs. Abbreviations: DEG, differentially expressed gene; GO, Gene Ontology; KEGG, Kyoto Encyclopedia of Genes and Genomes; PPI, protein–protein interaction. |
Transcription Levels of DEGs in Patients with Breast Cancer
The graph shows the number of datasets with statistically significantly upregulated (red) or downregulated (blue) mRNA expression of the target genes (Figure 3). The threshold was designed with the following parameters: a p-value of 0.001 and an FC of 1.5. The transcription levels of the core genes in cancers were compared with those in normal tissues using the ONCOMINE database (Figure 4). The data showed that the mRNA expression of BIRC5, CCNB2, CENPA, CENPF, and SKA1 was upregulated in patients with breast cancer. In the Curtis dataset, BIRC5 was upregulated in medullary breast carcinoma, with an FC of 6.014 and a p-value of 9.13E−17. In the Turashvili dataset, CCNB2 was overexpressed in invasive ductal breast carcinoma, with an FC of 4.653 and a p-value of 6.05E−6. In the Curtis dataset, CENPA was overexpressed in invasive ductal breast carcinoma, with an FC of 2.183 and a p-value of 1.27E−115. In The Cancer Genome Atlas dataset, the transcription level of CENPF was significantly higher in patients with invasive lobular breast carcinoma than that in normal specimens, with an FC of 6.980 and a p-value of 1.31E−21. In the Turashvili dataset, the FC in the mRNA expression of SKA1 in invasive ductal breast carcinoma was 7.501, and the p-value was 2.48E−6.
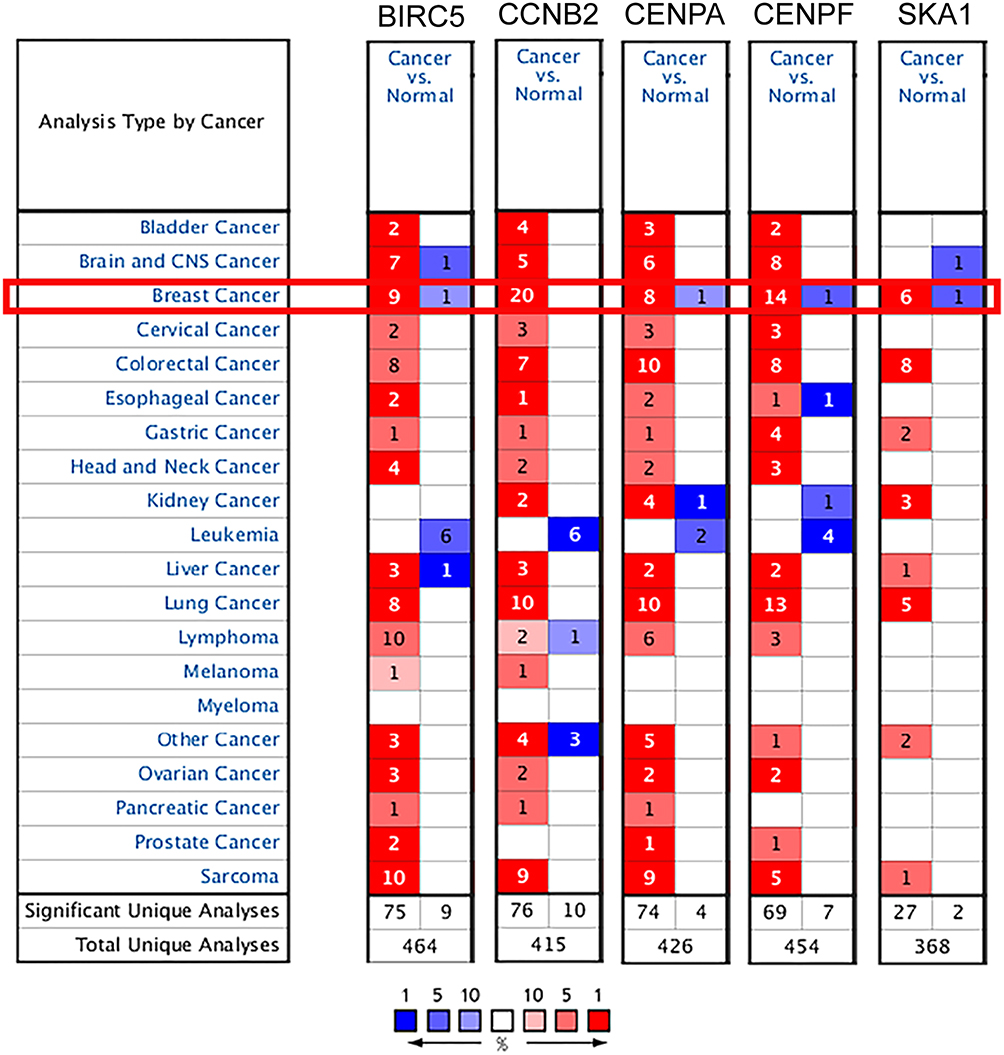 |
Figure 3 Transcription levels of the core genes in different types of cancers in Oncomine database (blue: low expression, red: high expression, comparison within the same line). |
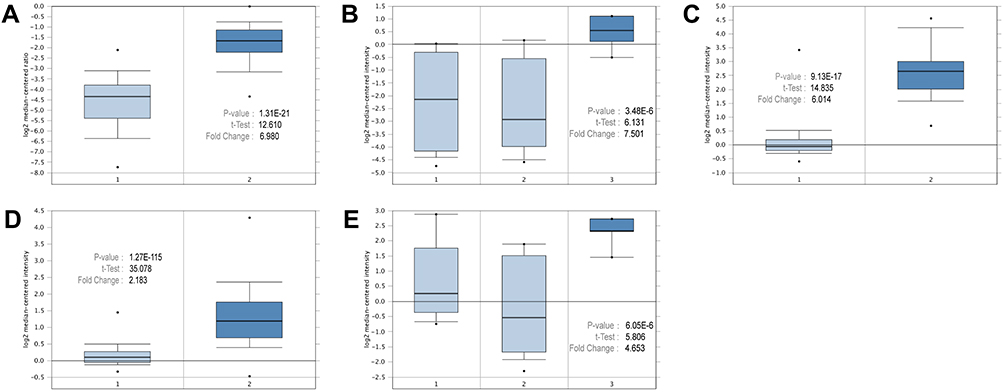 |
Figure 4 Expressions of the core genes in different breast cancer research microarrays. (A) CENPF expression in TCGA breast (1: breast, 2: invasive lobular breast carcinoma). (B) SKA1 expression in Turashvili breast (1: ductal breast cell, 2: lobular breast cell, 3: invasive ductal breast carcinoma). (C) BIRC5 expression in Curtis breast (1: breast, 2: medullary breast carcinoma). (D) CENPA expression in Curtis breast (1: breast, 2: invasive ductal breast carcinoma). (E) CCNB2 expression in Turashvili breast (1: ductal breast cell, 2: lobular breast cell, 3: invasive ductal breast carcinoma). |
Association Between DEG Expression and Survival of Patients
Kaplan–Meier analysis revealed that the five core genes (CCNB2, CENPF, SKA1, CENPA, and BIRC5) were related to the RFS of patients with TNBC. Patients with higher expression levels had a worse RFS than those with lower expression levels. In particular, the overexpression of CCNB2 was the most unfavorable prognostic factor for RFS of patients with TNBC (hazard ratio = 1.98; 95% CI: 1.28–3.06; p = 0.0018; n = 255), consistent with the lowest log-rank p-value (Figure 5).
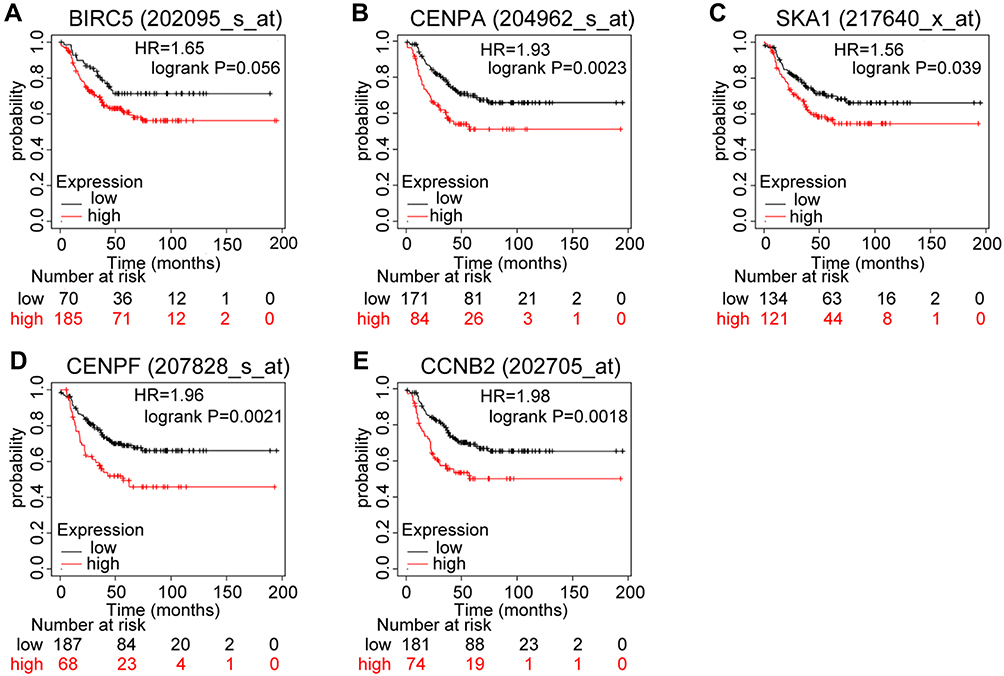 |
Figure 5 Prognostic values of mRNA expression levels of the core genes in patients with triple-negative breast cancer (Kaplan–Meier analysis). (A) Association of BIRC5 with RFS in TNBC. (B) Association of CENPA with RFS in TNBC. (C) Association of SKA1 with RFS in TNBC. (D) Association of CENPF with RFS in TNBC. (E) Association of CCNB2 with RFS in TNBC. Abbreviations: RFS, relapse-free survival; TNBC, triple-negative breast cancer. |
CCNB2 Protein Expression in TNBC Tissues
The results of immunohistochemical staining showed that CCNB2 protein expression in TNBC tissues was significantly higher than that in adjacent nontumor tissues. The protein was localized to the cytoplasm, as indicated by brown-yellow granular staining in the TNBC tissues (Figure 6).
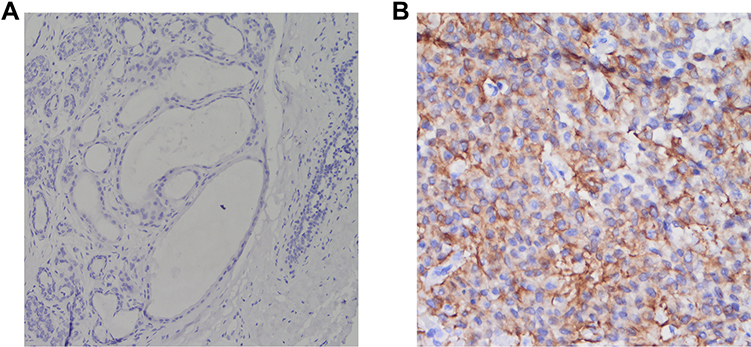 |
Figure 6 Immunohistochemical staining (EnVision Method). (A) CCNB2 is negatively expressed in the adjacent nontumor tissue at ×400 magnification. (B) CCNB2 is positively expressed in the triple-negative breast cancer tissue (magnification, ×400). |
Follow-Up
All patients with TNBC were females and were followed up until July 2020. The median follow-up time was 44 months (range: 10–78 months). During follow-up, eight patients (20.5%) died. The median age of the patients was 47 years old; 26 were under 50 years old, and 13 were over 50 years old. The average diameter of the tumor was 2.7 cm; however, in two cases, the tumor was larger than 5 cm.
In 39 patients with complete follow-up data, Kaplan–Meier survival analysis showed that the expression of CCNB2 and the primary location of the tumor were significantly related to OS of the patients (p < 0.05). However, the patient’s age, tumor location, tumor diameter, lymph node metastasis, and distant metastasis were not associated with OS (p > 0.05) (Table 3 and Figure 7).
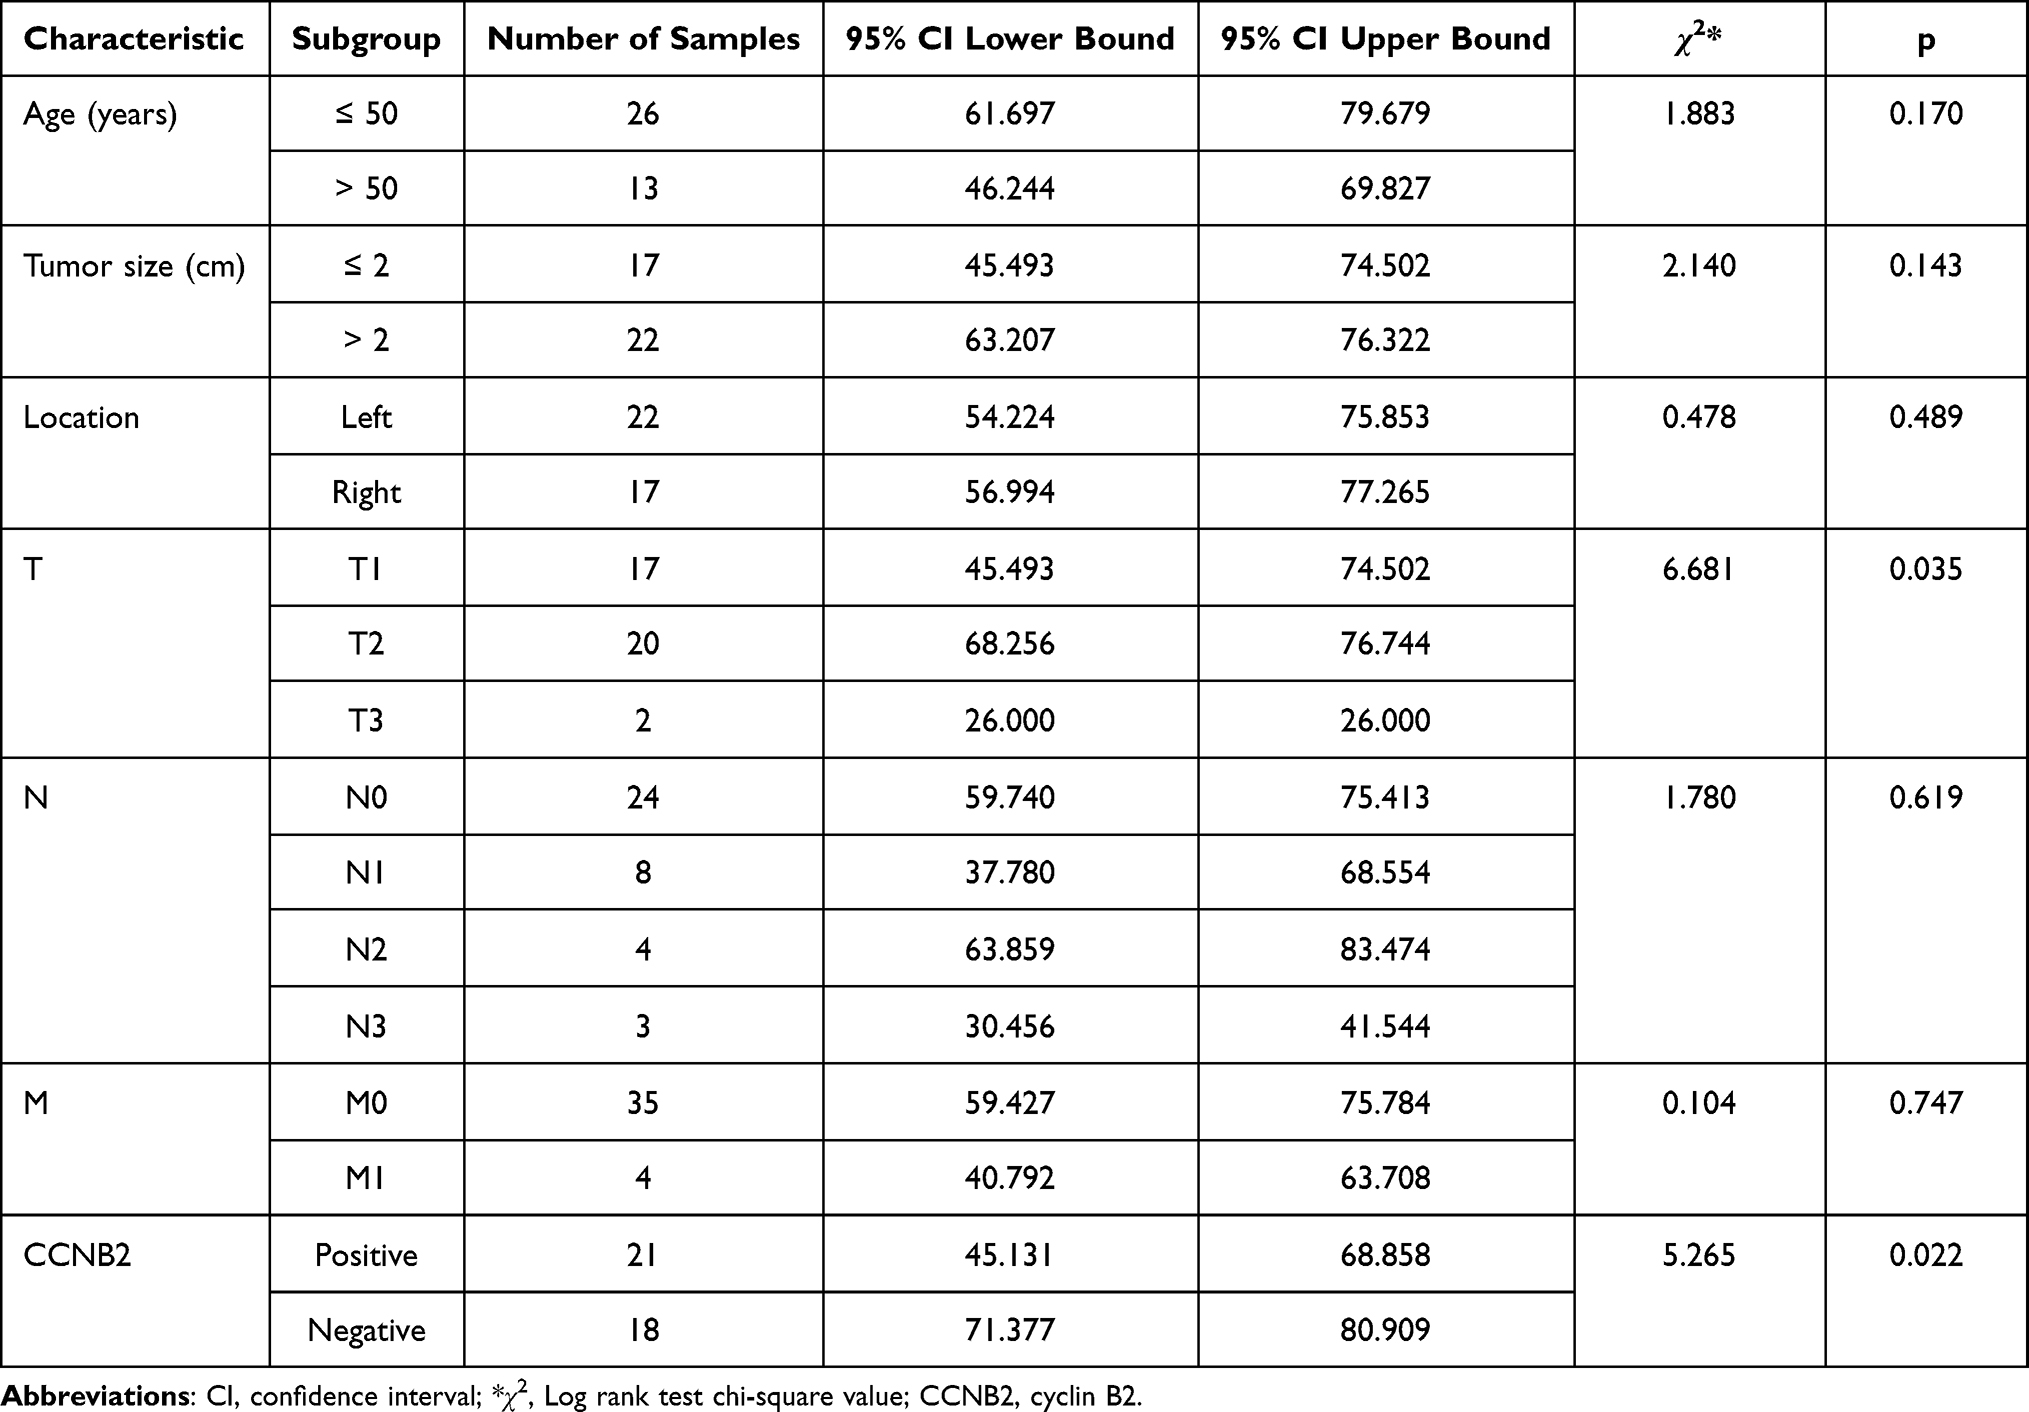 |
Table 3 Clinicopathological Characteristics and Kaplan–Meier Univariate Overall Survival Analysis of Patients with Triple-Negative Breast Cancer |
 |
Figure 7 Kaplan–Meier overall survival curves according to the (A) patient age (p = 0.170), (B) tumor size (p = 0.143), and (C) CCNB2 expression (p = 0.022). |
Discussion
Breast cancer is a malignant tumor that occurs in breast epithelial tissue.11 Because of the loose connection, breast cancer cells easily fall off, and free cancer cells can easily spread in the blood or lymph throughout the body, forming life-threatening metastases. All these factors make breast cancer a serious threat to women’s health. TNBC is a unique subtype of breast cancer. It does not express hormone receptors (ER and PR) and HER-2, which makes clinical targeted therapy and endocrine therapy ineffective.12 Chemotherapy is currently the main adjuvant treatment for patients with TNBC. However, its efficacy is limited compared with that of comprehensive therapy, especially in patients who show resistance to chemotherapy drugs.13 Therefore, identifying reliable biomarkers and effective targets for TNBC is urgently needed to improve the prognosis of patients.
The development of second-generation sequencing technology and high-throughput sequencing platforms has resulted in the generation of a large amount of data, which is being interpreted using bioinformatics methods by an increasing number of researchers. In our study, gene and protein expression analysis based on publicly available bioinformatics databases was performed to screen for potential key genes related to TNBC. Using gene expression profiling data from the GEO database, 66 DEGs were identified between TNBC tissues and normal human breast tissues, which play an important role in cell proliferation and cell cycle. By constructing a PPI network, a potential protein complex that was strongly linked to invasive breast cancer was identified. This protein complex was mainly composed of the protein expression products of the five core genes (BIRC5, CCNB2, CENPA, CENPF, and SKA1). The analysis of these 5 genes using the GEO and ONCOMINE databases showed that they were all significantly overexpressed in breast cancer than in normal tissues (p < 0.05). The Kaplan-Meier plotter showed that CCNB2 overexpression is an unfavorable prognostic factor for patients with TNBC. To strengthen the credibility of the results of the bioinformatics analysis, experimental verification was conducted. Immunohistochemical staining indicated the cytoplasmic localization of CCNB2 in breast tissue and demonstrated that CCNB2 expression in breast tissue was higher than that in the adjacent tissues. Clinicopathological correlation analysis further confirmed that high expression of CCNB2 in patients with TNBC was associated with poor survival expectations.
Cyclin family proteins, including cyclins B1 (CCNB1) and B2 (CCNB2), regulate the activity of cyclin-dependent kinases (CDKs). Different cyclins are involved in specific phases of the cell cycle,14–16 and CCNB2 plays an important role in the regulation of the cell cycle. During the interphase and mitosis, CCNB2 is located in the Golgi apparatus and participates in its decomposition.17 According to previous reports, CCNB2 usually triggers the process of G2/M phase transition by activating CDK1, and downregulation of CCNB2 inhibits cell proliferation and promotes cell cycle arrest in the G2/M phase.18–20 A study has shown that metformin downregulates the expression of CCNB2 to increase the rates of apoptosis and cell cycle arrest.21 A high level of CCNB2 is positively correlated with the degree of undifferentiation, the tumor size, lymph node metastasis, distant metastasis, and the clinical stage. In the past few years, the overexpression of CCNB2 in tumor tissues has been shown to be an unfavorable prognostic biomarker in many human cancers, including gastric cancer,22 breast cancer,23 pituitary adenoma,24 nasopharyngeal carcinoma,25 and adrenocortical carcinoma.26 The results of bioinformatics analysis showed that mRNA expression of CCNB2 was significantly associated with TNBC patients’ prognosis. Owing to the small sample size of TNBC, this study has certain limitations. In the future, we will continue to collect sample information in the clinic, and hope the findings of this study can provide a direction for future TNBC research and clinical treatment.
In this study, BIRC5, SKA1, CENPA, and CENPF were highly expressed in TNBC compared to their expression in normal breast tissues, and CENPA, CENPF, and SKA1 expression levels were significantly correlated with a poor RFS (log-rank p < 0.05). However, the role of these genes in TNBC remains unclear, and more studies are needed.
Conclusions
In summary, CCNB2 protein expression was significantly increased in TNBC tissues and was related to the malignant status and prognosis of patients. The clinical value of CCNB2 has yet to be confirmed by further studies. In the future, the regulation mechanism of CCNB2-related signal pathways in TNBC will be further studied. Nevertheless, CCNB2 has broad potential as a therapeutic target and prognostic factor for TNBC.
Abbreviations
TNBC, triple-negative breast cancer; GEO, gene expression omnibus; DEGs, differentially expressed genes; PPI, protein–protein interaction; GO, gene ontology; KEGG, Kyoto Encyclopedia of Genes and Genomes; ER, estrogen receptor; PR, progesterone receptor; HER-2, human epidermal growth factor receptor-2; FC, fold change; CC, cellular component; BP, biological process; MF, molecular function; MCODE, molecular complex detection; CCNB2, Cyclin B2; OS, overall survival; RFS, relapse-free survival.
Data Sharing Statement
No additional data are available.
Ethics Approval and Informed Consent
The study was approved by the Ethics Committee of the First Affiliated Hospital of Bengbu Medical College (NO. 2021085) and conducted following the ethical guidelines of the Declaration of Helsinki. All patients provided written informed consent.
Acknowledgments
We would like to thank Editage (www.editage.cn) for English language editing.
Author Contributions
All authors made substantial contributions to conception and design, acquisition of data, or analysis and interpretation of data; took part in drafting the article or revising it critically for important intellectual content; agreed to submit to the current journal; gave final approval of the version to be published; and agree to be accountable for all aspects of the work.
Funding
This work was supported by grants from the Postgraduate Scientific Research Innovation Program of the Bengbu Medical College (Byycx20003), Anhui Provincial Natural Science Foundation (No.1908085MH275), Bengbu Medical College 512 Talent Cultivation Program (by51202205), and Natural Science Key Project of Bengbu Medical College (2020byzd030).
Disclosure
The authors declare that they have no competing interests in this work.
References
1. Sung H, Ferlay J, Siegel RL, et al. Global cancer statistics 2020: GLOBOCAN estimates of incidence and mortality worldwide for 36 cancers in 185 countries. CA Cancer J Clin. 2021;71(3):209–249. doi:10.3322/caac.21660
2. Mattiuzzi C, Lippi G. Current cancer epidemiology. J Epidemiol Glob Health. 2019;9:217–222. doi:10.2991/jegh.k.191008.001
3. Li H, Sun X, Miller E, et al. BMI, reproductive factors, and breast cancer molecular subtypes: a case-control study and meta-analysis. J Epidemiol. 2017;27:143–151. doi:10.1016/j.je.2016.05.002
4. Foulkes WD, Smith IE, Reis-Filho JS. Triple-negative breast cancer. N Engl J Med. 2010;363:1938–1948. doi:10.1056/NEJMra1001389
5. Zhou S, Sun X, Yu L, et al. Differential expression and clinical significance of epithelial-mesenchymal transition markers among different histological types of triple-negative breast cancer. J Cancer. 2018;9:604–613. doi:10.7150/jca.19190
6. Barrett T, Wilhite SE, Ledoux P, et al. NCBI GEO: archive for functional genomics data sets—update. Nucleic Acids Res. 2013;41:D991–D995. doi:10.1093/nar/gks1193
7. Wang Y, Li H, Ma J, et al. Integrated bioinformatics data analysis reveals prognostic significance of SIDT1 in triple-negative breast cancer. Onco Targets Ther. 2019;12:8401–8410. doi:10.2147/OTT.S215898
8. Stark C, Breitkreutz BJ, Reguly T, et al. BioGRID: a general repository for interaction datasets. Nucleic Acids Res. 2006;34:D535–D539. doi:10.1093/nar/gkj109
9. Li T, Wernersson R, Hansen RB, et al. A scored human protein–protein interaction network to catalyze genomic interpretation. Nat Methods. 2017;14:61–64. doi:10.1038/nmeth.4083
10. Rhodes DR, Yu J, Shanker K, et al. ONCOMINE: a cancer microarray database and integrated data-mining platform. Neoplasia. 2004;6(1):1–6. doi:10.1016/s1476-5586(04)80047-2
11. Wörmann B. Breast cancer: basics, screening, diagnostics and treatment. Med Monatsschr Pharm. 2017;40:55–64.
12. Camorani S, Fedele M, Zannetti A, et al. TNBC challenge: oligonucleotide aptamers for new imaging and therapy modalities. Pharmaceuticals. 2018;11:123. doi:10.3390/ph11040123
13. Garrido-Castro AC, Lin NU, Polyak K. Insights into molecular classifications of triple-negative breast cancer: improving patient selection for treatment. Cancer Discov. 2019;9:176–198. doi:10.1158/2159-8290.CD-18-1177
14. Qian X, Song X, He Y, et al. CCNB2 overexpression is a poor prognostic biomarker in Chinese NSCLC patients. Biomed Pharmacother. 2015;74:222–227. doi:10.1016/j.biopha.2015.08.004
15. Mo ML, Chen Z, Li J, et al. Use of serum circulating CCNB2 in cancer surveillance. Int J Biol Markers. 2010;25:236–242. doi:10.5301/JBM.2010.6088
16. Gao CL, Wang GW, Yang GQ, et al. Karyopherin subunit-α 2 expression accelerates cell cycle progression by upregulating CCNB2 and CDK1 in hepatocellular carcinoma. Oncol Lett. 2018;15:2815–2820. doi:10.3892/ol.2017.7691
17. Jackman M, Firth M, Pines J. Human cyclins B1 and B2 are localized to strikingly different structures: B1 to microtubules, B2 primarily to the Golgi apparatus. EMBO J. 1995;14:1646–1654. doi:10.1002/j.1460-2075.1995.tb07153.x
18. Fischer M, Quaas M, Steiner L, et al. The p53-p21-DREAM-CDE/CHR pathway regulates G2/M cell cycle genes. Nucleic Acids Res. 2016;44:164–174. doi:10.1093/nar/gkv927
19. Li J, Ouyang YC, Zhang CH, et al. The cyclin B2/CDK1 complex inhibits separase activity in mouse oocyte meiosis I. Development. 2019;146:dev182519. doi:10.1242/dev.182519
20. Roskoski R
21. Li M, Jiang X, Su T, et al. Metformin suppresses proliferation and viability of rat pheochromocytoma cells. Med Sci Monit. 2017;23:3253–3260. doi:10.12659/msm.903348
22. Zhang HP, Li SY, Wang JP, et al. Clinical significance and biological roles of cyclins in gastric cancer. Onco Targets Ther. 2018;11:6673–6685. doi:10.2147/OTT.S171716
23. Shubbar E, Kovács A, Hajizadeh S, et al. Elevated cyclin B2 expression in invasive breast carcinoma is associated with unfavorable clinical outcome. BMC Cancer. 2013;13:1. doi:10.1186/1471-2407-13-1
24. De Martino I, Visone R, Wierinckx A, et al. HMGA proteins up-regulate CCNB2 gene in mouse and human pituitary adenomas. Cancer Res. 2009;69:1844–1850. doi:10.1158/0008-5472.CAN-08-4133
25. Qian D, Zheng W, Chen C, et al. Roles of CCNB2 and NKX3-1 in nasopharyngeal carcinoma. Cancer Biother Radiopharm. 2020;35:208–213. doi:10.1089/cbr.2019.3016
26. Ikeya A, Nakashima M, Yamashita M, et al. CCNB2 and AURKA overexpression may cause atypical mitosis in Japanese cortisol-producing adrenocortical carcinoma with TP53 somatic variant. PLoS One. 2020;15:e0231665. doi:10.1371/journal.pone.0231665
 © 2021 The Author(s). This work is published and licensed by Dove Medical Press Limited. The full terms of this license are available at https://www.dovepress.com/terms.php and incorporate the Creative Commons Attribution - Non Commercial (unported, v3.0) License.
By accessing the work you hereby accept the Terms. Non-commercial uses of the work are permitted without any further permission from Dove Medical Press Limited, provided the work is properly attributed. For permission for commercial use of this work, please see paragraphs 4.2 and 5 of our Terms.
© 2021 The Author(s). This work is published and licensed by Dove Medical Press Limited. The full terms of this license are available at https://www.dovepress.com/terms.php and incorporate the Creative Commons Attribution - Non Commercial (unported, v3.0) License.
By accessing the work you hereby accept the Terms. Non-commercial uses of the work are permitted without any further permission from Dove Medical Press Limited, provided the work is properly attributed. For permission for commercial use of this work, please see paragraphs 4.2 and 5 of our Terms.