")
Back to Journals » OncoTargets and Therapy » Volume 13
Prognostic Significance and Related Mechanisms of Hexokinase 1 in Ovarian Cancer
Authors Li Y, Tian H, Luo H, Fu J, Jiao Y , Li Y
Received 10 July 2020
Accepted for publication 13 October 2020
Published 11 November 2020 Volume 2020:13 Pages 11583—11594
DOI https://doi.org/10.2147/OTT.S270688
Checked for plagiarism Yes
Review by Single anonymous peer review
Peer reviewer comments 2
Editor who approved publication: Dr Federico Perche
Yanqing Li,1 Huining Tian,2 Haoge Luo,1 Jiaying Fu,1 Yan Jiao,3 Yang Li1
1Department of Pathophysiology, College of Basic Medical Sciences, Jilin University, Changchun, Jilin 130021, People’s Republic of China; 2College of Translational Medicine, The First Affiliated Hospital of Jilin University, Jilin University, Changchun, Jilin 130021, People’s Republic of China; 3Department of Hepatobiliary and Pancreatic Surgery, The First Hospital of Jilin University, Changchun, Jilin 130021, People’s Republic of China
Correspondence: Yang Li
Department of Pathophysiology, College of Basic Medical Sciences, Jilin University, Changchun, Jilin 130021, People’s Republic of China
Tel +86 185 4311 2059
Fax +86 431 8561 9101
Email [email protected]
Purpose: Ovarian cancer (OC) has the highest mortality among gynecological malignancies. Therefore, it is urgent to explore prognostic biomarkers to improve the survival of OC patients. One of the most prominent metabolic characteristics of cancer is effective glycolysis. Hexokinase 1 (HK1), as the first rate-limiting enzyme in glycolysis, is closely related to cancer progression. However, the role of HK1 in OC remains unclear.
Materials and Methods: The Cancer Genome Atlas (TCGA) database was used to detect the expression of HK1 in OC patients. The chi-squared test was performed to examine the correlations between HK1 and patients’ clinical characteristics. Survival analyses were undertaken to determine the relationship between HK1 and patient survival, while the univariate/multivariate Cox model was used to evaluate the role of HK1 in patient prognosis. Gene Set Enrichment Analysis (GSEA) was performed to ascertain the related signaling pathways of HK1. RT-qPCR was implemented to validate the mRNA expression of HK1 in OC cells. MTT was used to detect cell viability after adding 2DG and knocking down HK1 in OC cells. HK1 protein expression was examined by Western blotting. Glucose uptake, lactate production, and ATP assays were undertaken following knockdown of HK1 in OC cells. Colony formation assays were performed to determine OC cell proliferation after HK1 knockdown. Transwell and wound healing assays were carried out to detect the invasion and migration of OC cells after HK1 knockdown.
Results: We found that HK1 expression was increased in OC tissues and cells, and HK1 was related to the clinical characteristics of OC patients. Survival analysis revealed that OC patients in the HK1 overexpression group had poor survival. Moreover, univariant/multivariate analyses showed that HK1 may be an independent biomarker for the poor prognosis of OC patients. OC cell viability and proliferation decreased after knockdown of HK1. Consistently, glucose uptake, lactic acid production, ATP production, invasion, and migration were also decreased. Finally, GSEA enrichment analysis and Western blotting showed that HK1 was involved in MAPK/ERK signaling.
Conclusion: HK1 may be a biomarker for the poor prognosis of OC patients and a potential therapeutic target.
Keywords: HK1, ovarian cancer, prognosis, glycolysis
Introduction
Ovarian cancer (OC) is one of the three major malignant cancer types of female genitalia, and its mortality rate ranks first among gynecological malignancies.1 In recent years, the incidence of OC has remained high. Early symptoms of OC are hidden, and abdominal metastasis often occurs before clinical symptoms appear.2 Approximately 60–70% of patients are at an advanced stage when they are diagnosed.3 The primary treatment for OC is surgery supplemented by chemotherapy.4 Although new treatment methods have been developed in recent years, the prognosis of patients remains very poor. Therefore, there is an urgent need to identify new prognostic biomarkers for OC patients.
Cancers are characterized by high glucose metabolism, and approximately 60% of ATP in cancer cells is derived from glycolysis.5 As the first rate-limiting enzyme in the glycolytic pathway, hexokinase (HK) has an important role in cancers.6 There are four different isozymes of HK in mammals. Among them, HK1 is widely expressed in most human tissues. Additionally, HK1 is expressed in many cancers and is associated with cancer progression. For example, HK1 is highly expressed in liver cells and promotes cell proliferation.7 Furthermore, high expression of HK1 leads to the poor prognosis of colorectal cancer patients.8 Additionally, hexokinase 2 (HK2) can regulate the metabolic reprogramming, invasion, and apoptosis of ovarian cancer cells.9 However, the role of HK1 in OC remains unclear.
To further explore the role of HK1 in OC, we tested its expression in vivo and in vitro. Chi-squared test, survival analysis, univariate/multivariate Cox analyses, and Gene Set Enrichment Analysis (GSEA) were undertaken to detect the expression, clinical characteristics, and signaling pathways of HK1 in OC patients from The Cancer Genome Atlas (TCGA) database. MTT assays, RT-qPCR, Western blotting, glucose assays, lactic acid, ATP assays, colony formation, transwell, and wound healing were used to verify the expression of HK1 and its possible mechanism in OC cells.
Materials and Methods
Data Source
The related data of OC patients and normal tissues were obtained from TCGA database (https://cancergenome.nih.gov/). TCGA database is a public database, and there is no ethical conflict.
GSEA
GSEA (https://www.ncbi.nlm.nih.gov/gds/) is an analytical method for microarray data generated from whole-genome expression profiling. Through the analysis of gene expression profile data, the expression status of specific functional gene sets can be determined. Furthermore, any statistical significance of this expression status can be identified. We performed GSEA using GSEA 4.0 software.
Cell Culture
IOSE, A2780, and OVCAR3 cells were acquired from the Bena culture collection (Beijing, China). Cells were cultured in RPMI-1640 medium (Gibco, Grand Island, USA) in a constant temperature incubator (Thermo Fisher, Waltham, USA) at 37°C and 5% CO2.
Plasmid Transfection
HK1 knockdown (shHK1) plasmid was synthesized by GeneChem (Shanghai, China). Cells were seeded into 96-well plates and transfected with TurboFect transfection reagent (Thermo Fisher, Waltham, USA). Transfection was performed for 4–6 hours according to the manufacturer’s instructions, and the culture was continued after changing the culture medium.
Cell Viability Detection
ShHK1 plasmid was transfected when the cells had grown to logarithmic growth phase in 96-well plates. Then, the culture medium was replaced after 4 h. Next, MTT solution was added after 0, 6, 12, and 24 h. Finally, cell viability was detected using a microplate reader (Thermo Fisher, Waltham, USA). The growth inhibition rate was calculated as follows: Inhibition = 1 – (absorbance of experimental group/absorbance of control group)
Real-Time Fluorescence Quantitative PCR (RT-qPCR)
Total RNA was extracted from cells using a TRIzol kit (Invitrogen Carlsbad, CA) according to the manufacturer’s protocol. Then, reverse transcription was performed to synthesize cDNA using the RT2 First Strand Kit (Promega, Madison, MI). Primer sequences were as follows: HK1 5ʹ-GCTCTCCGATGAAACTCTCATAG-3ʹ (forward) and 5ʹ-GGACCTTACGAATGTTGGCAA-3ʹ (reverse); ACTIN 5ʹ-AAGGAGCCCCACGAGAAAAAT-3ʹ (forward) and 5ʹ-ACCGAACTTGCATTGATTCCAG-3ʹ (reverse). The relative expression of the different experimental groups was calculated by the 2‑ΔΔCq method and normalized to ACTIN expression.
Western Blotting
Electrophoresis was performed using 10% (w/v) SDS-polyacrylamide gels. Then, the protein was transferred to PVDF membranes, which were blocked in 5% (w/v) skimmed milk powder at room temperature for 1.5–2 h and then incubated with HK1 (15656-1-AP), ERK (67170-1-Ig), E-cadherin (20874-1-AP), N-cadherin (22018-1-AP), and actin (23660-1-AP) primary antibodies (Proteintech, Chicago, USA). P-ERK antibodies came from abcam (ab201015, Cambridge, England). Finally, a protein imaging map was obtained with a gel imager (Synoptics, Cambridge).
Glycolysis Detection
Glucose uptake and lactate production kits (Nanjing Jiancheng, Nanjing, China) and an ATP detection kit (Biyuntian, China) was used to detect glucose, lactate, and ATP, respectively. OC cells were seeded into 6-well plates. We collected the cells and culture solution after treatment. Finally, we tested them according to the operating instructions.
Transwell Assays
RPMI-1640 medium containing 0.1% bovine serum albumin was used to adjust the cell number to 1×10⁶ cells/mL. Then, 100 µL cell suspension was inoculated into the upper chambers of three Transwell plates per group. In the lower chamber, 500 µL RPMI-1640 medium containing 15% fetal bovine serum was added and the cells were then cultured for 24 h at 37°C with 5% CO2. The cells in the upper layer of the filter membrane were wiped off with a cotton swab, and the membrane was fixed with methanol for 5 min before staining with crystal violet dye for 15 min. Finally, the cells were photographed under a light microscope at 100× magnification.
Wound Healing Assays
Approximately 5×10⁴ cells/well were inoculated into six-well plates. ShHK1 plasmid was transfected in logarithmic phase. After 24 h, the cell monolayer was scratched using a sterile 10-μL pipette tip. The cells were washed three times with PBS and then removed and added to serum-free medium before incubation at 37°C with 5% CO2. After 24 h, images of the cells were taken under light microscopy.
Colony Formation Assays
Cells in logarithmic growth phase were used to prepare serial dilations of cell suspensions, which were seeded into 24-well plates and cultured for 1 week. The supernatant was discarded, fixed with 4% paraformaldehyde for 5 min and dyed with crystal violet for 15 min whereupon images were taken under light microscopy.
ELISA
A sandwich ELISA kit was purchased from Youxuan (Beijing, China). Cell supernatant, standard substrate, and HRP-labeled detection antibody were added to a microporous strip that had been pre-coated with HK1 antibody, followed by incubation and thorough washing. Color was developed with TMB substrate, which was converted to blue under the catalysis of peroxidase and then yellow under the action of acid. There was a positive correlation between the color and HK1 in the sample. The absorbance (OD value) was measured with a microplate reader at 450 nm, and the sample concentration was calculated.
Statistical Analyses
R (version 3.6.1) was used for data mining.10 The Mann–Whitney test was performed to compare data between the two groups, while the Kruskal–Wallis test was used for multiple comparisons. Ggplot2 package was used to draw a box diagram of clinical features.11 The chi-squared test was performed to detect correlations between HK1 and clinical characteristics of patients. A survival package was implemented to evaluate the relationship between HK1 expression and patient survival.12,13 Logarithmic rank test was used to examine survival deviations. The univariate Cox model was utilized to identify clinically relevant variables, while the multivariate Cox model was used to evaluate independent variables. A P-value of <0.05 was considered statistically significant.
Results
Data Overview
To detect the role of HK1 in OC, the data of 308 OC patients were extracted from TCGA database. The clinical characteristics of these patients, including age, subdivision, stage, longest dimension, lymphatic invasion, histologic grade, new type, sample type, vital status, HK1 expression, and overall survival, are shown in Table 1.
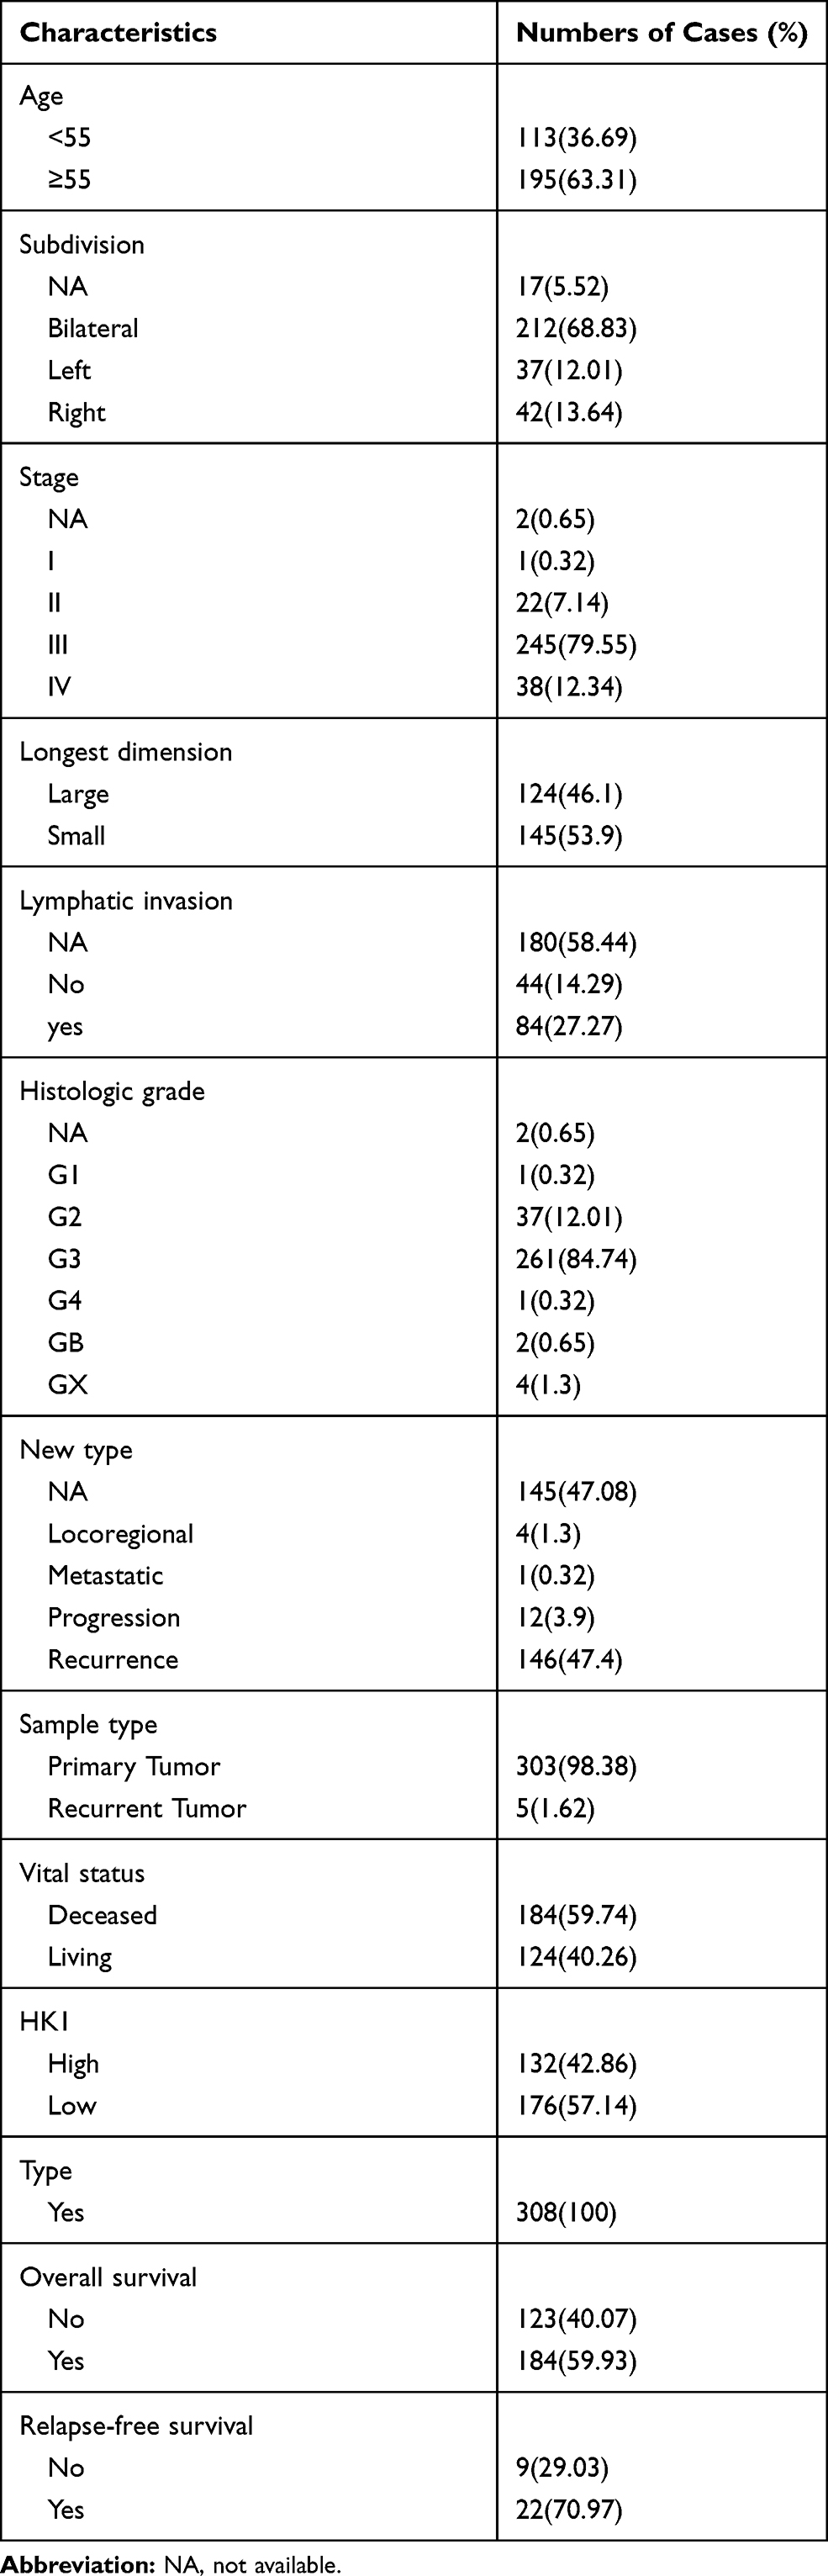 |
Table 1 Clinical Characteristics of the Included Patients with Ovarian Cancer |
Overexpression of HK1 in OC Patients
Changes in mRNA expression levels indicate that genes have a regulatory role in cancer development. We used ggplot2 package to detect the HK1 expression changes in OC tissues and adjacent tissues. The results showed that HK1 expression was increased in cancer tissues (P<0.001; Figure 1A). There was no significant difference in HK1 expression among age, new type, histologic grade, lymphatic invasion, subdivision, sample type, and stage (Figure 1B–H). This indicated that we needed to further explore the correlation between HK1 and clinical features of OC patients.
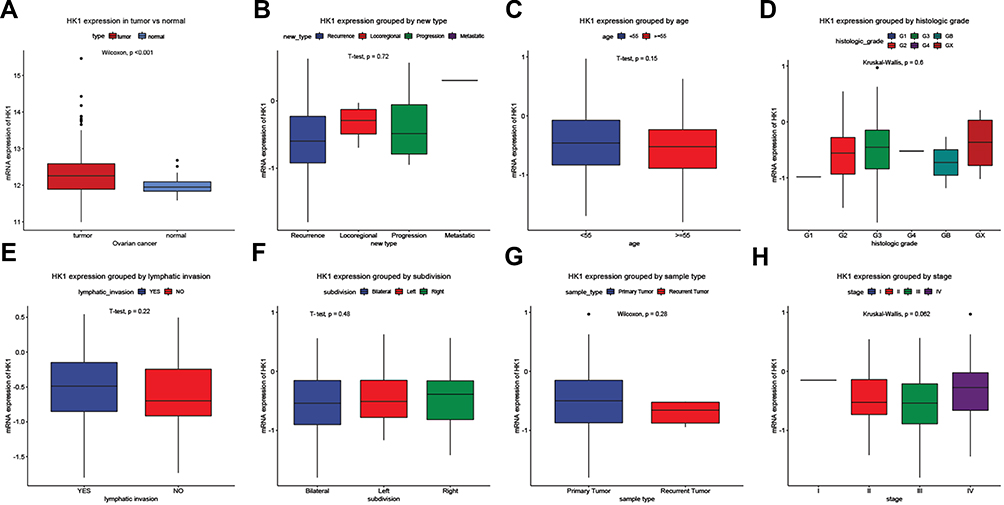 |
Figure 1 Clinicopathological characteristics and HK1 expression. Boxplots showing HK1 expression. HK1 expression grouped by type (A), new type (B), age (C), histologic grade (D), lymphatic invasion (E), subdivision (F), sample type (G), and stage (H). |
HK1 is Related to the Clinical Features of OC Patients
To identify the clinical significance of HK1 in OC patients, we used the chi-squared test to assess the association between HK1 expression and clinical characteristics of OC patients. The results showed that HK1 expression was related to stage (P=0.030) and longest dimension (P=0.009; Table 2). This indicated that HK1 had higher expression in advanced OC.
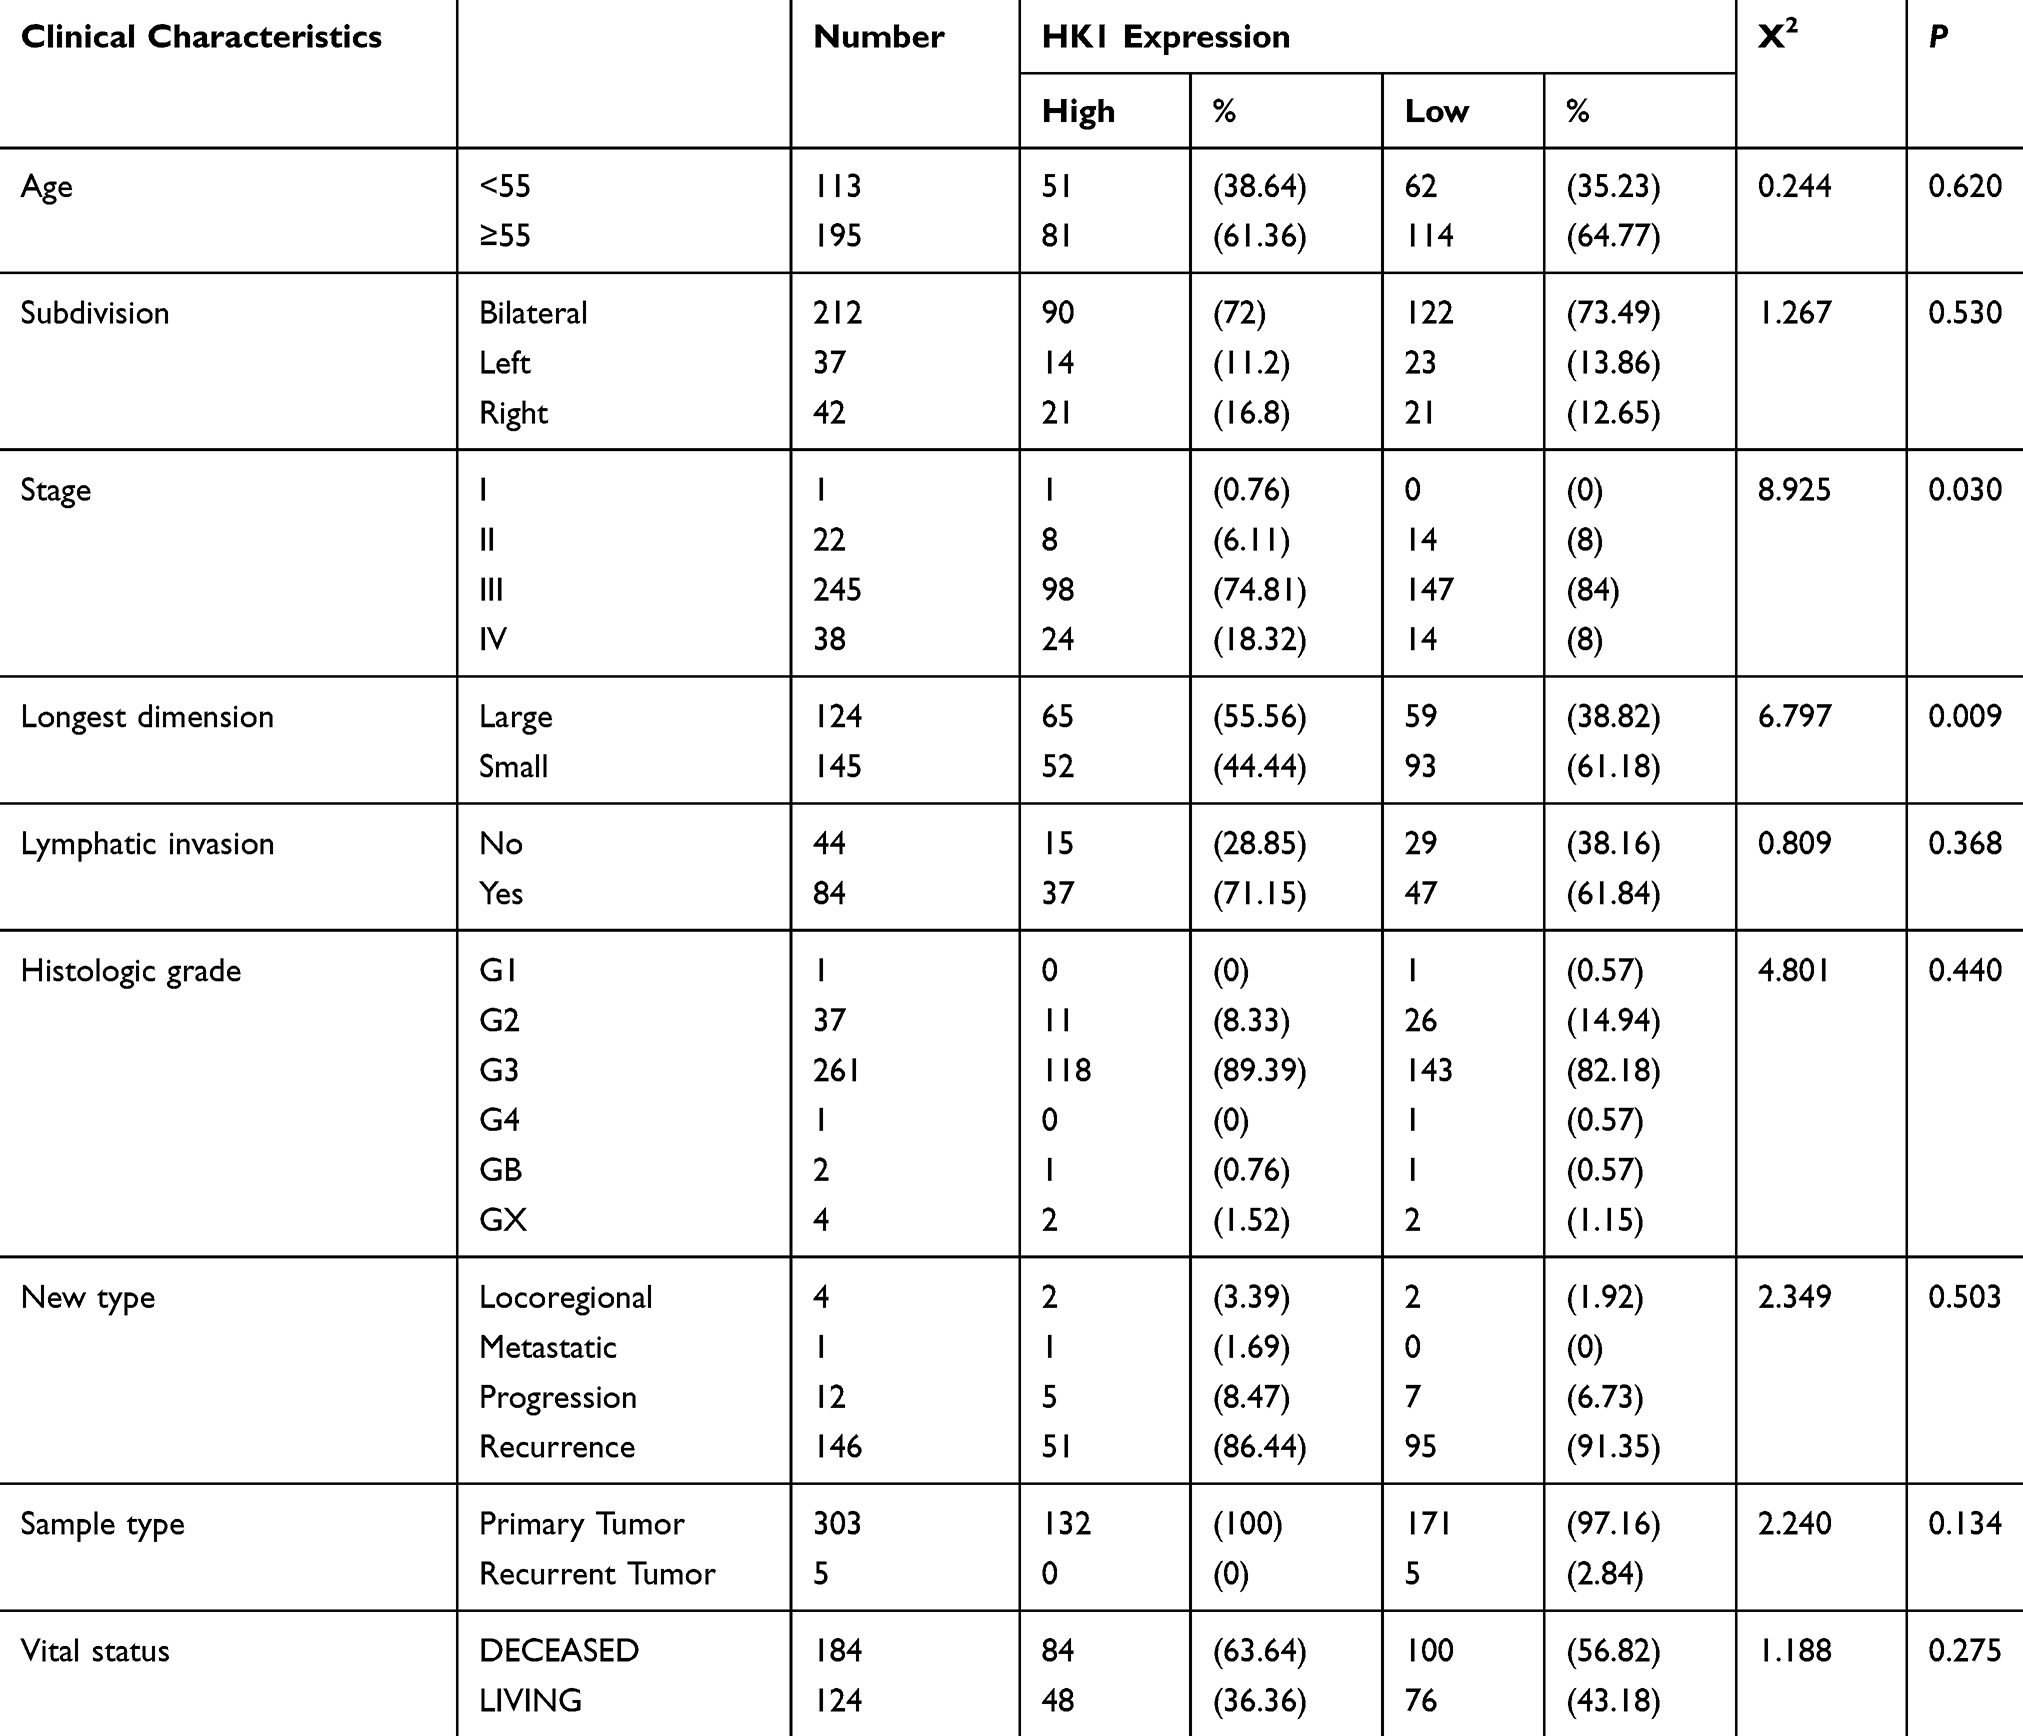 |
Table 2 Correlation Between the Expression of HK1 and the Clinic Pathologic Characteristics in Patients |
HK1 is an Independent Factor of Poor Prognosis in OC Patients
To further analyze the significance of HK1 in the prognosis of OC patients, we used a survival analysis package to examine the relationship between HK1 expression and the overall survival of OC patients. The results showed that OC patients with high expression of HK1 had poor survival (P=0.0047; Figure 2A), consistent with the subgroup analysis, especially advanced stage (P=0.04; Figure 2B), G3 and G4 (P=0.0081; Figure 2E), and young age (P=0.005; Figure 2I). There was no significant difference in HK1 among early type (Figure 2C), G1 and G2 (Figure 2D), lymphatic invasion (Figure 2F), non-lymphatic invasion (Figure 2G), old age (Figure 2H), and recurrence (Figure 2J). These results suggested that high HK1 expression affected the survival of OC patients, mainly in highly malignant cells and young patients. Therefore, we needed to further examine whether HK1 is an independent factor.
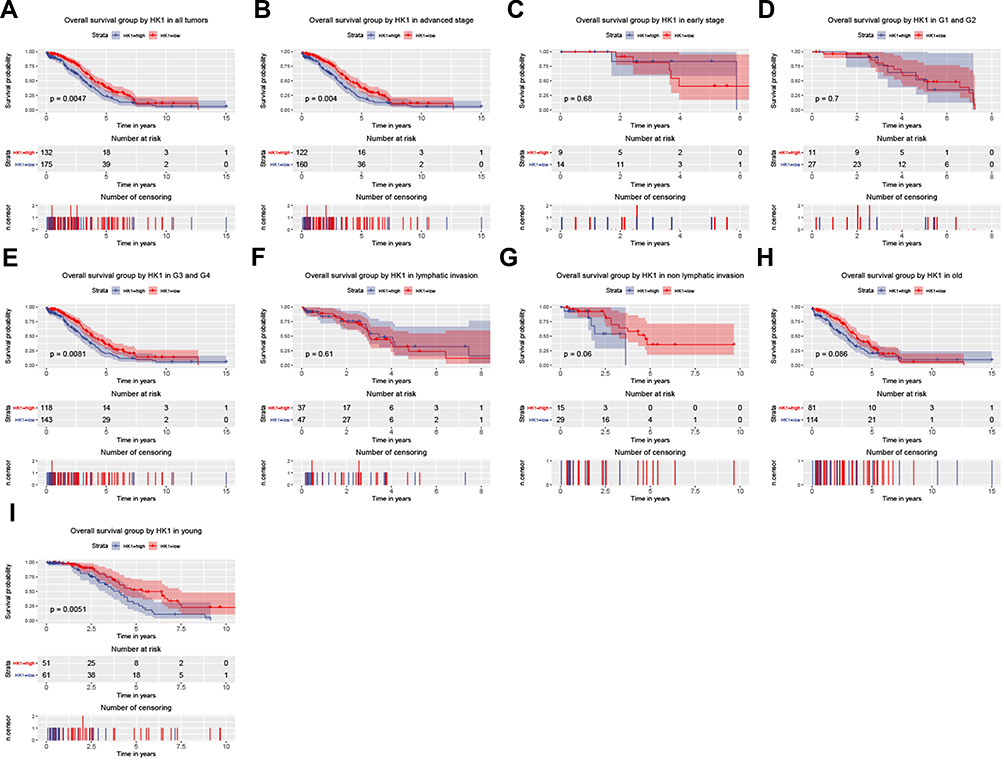 |
Figure 2 HK1 expression and overall survival. Kaplan–Meier curves showing survival analysis (A) and subgroup analysis of advanced stage (B), early stage (C), G1 and G2 (D), G3 and G4 (E), lymphatic invasion (F), non-lymphatic invasion (G), old age (H), and young age (I). |
Next, we used the univariate/multivariate Cox model to discover the factors affecting the prognosis of OC patients. Univariate Cox analysis showed that age and HK1 expression were potential survival-related variables, while the multivariate Cox model results suggested that high HK1 expression was a potential and independent risk factor for poor prognosis in OC patients (HR=1.52, P=0.005; Table 3).
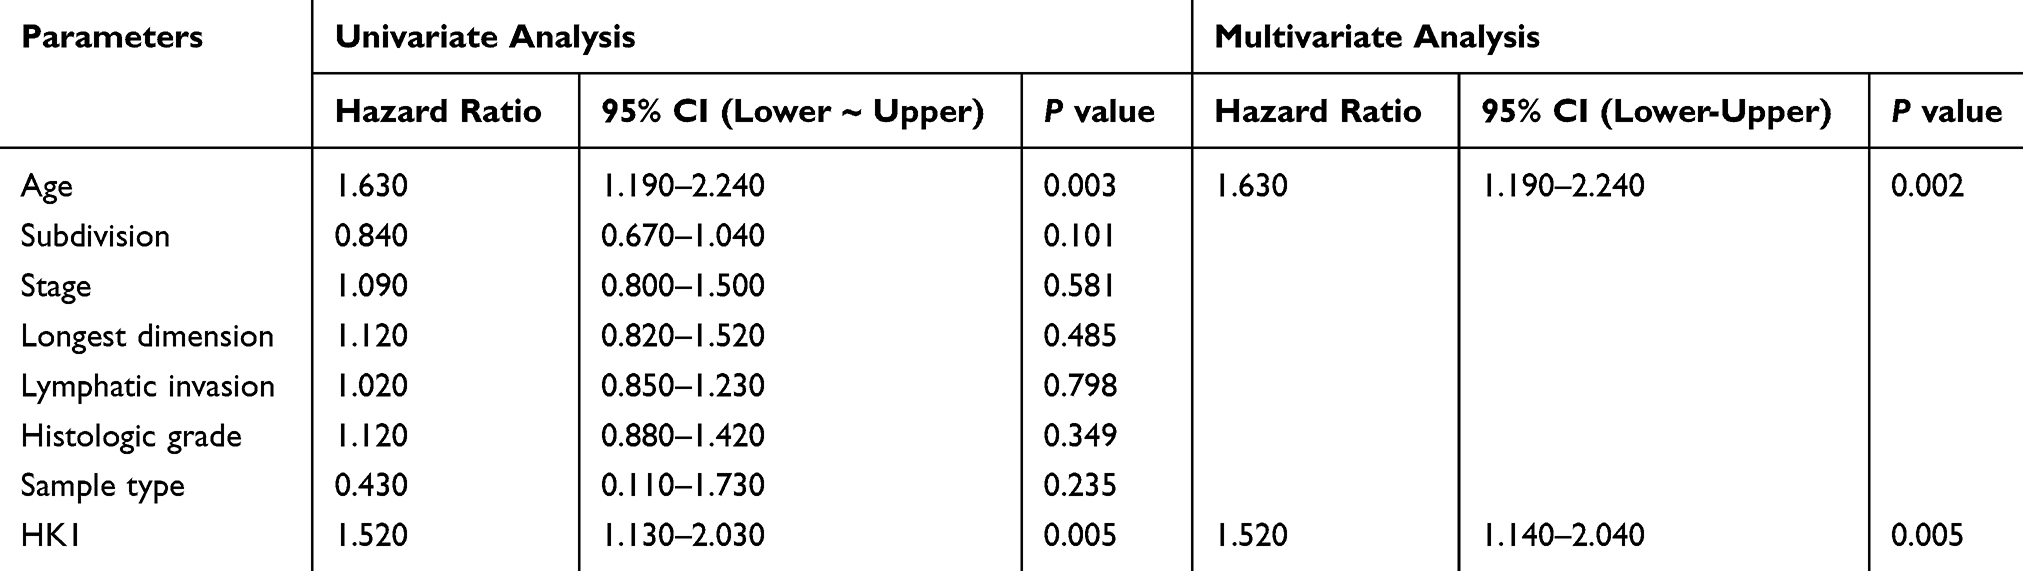 |
Table 3 Association Between HK1 Expression and Overall Survival |
HK1 is Related to OC Cell Viability
To further explore the molecular mechanism, we detected the mRNA and protein expression levels of HK1 in A2780 and OVCAR3 OC cells. Consistent with the results of OC patients, the protein expression of HK1 was increased in OC cells (Figure 3A and B). Additionally, RT-qPCR showed that the expression of HK1 mRNA was increased in cancer cells (Figure 3C). We also used ELISA to detect the protein levels of HK1, and found that the results were consistent with the results of Western blotting (Figure 3D). To further explore the role of HK1 in ovarian cancer cells, we transfected HK1 knockdown plasmid and observed cell viability (Figure 3G). MTT assays revealed that the viability of A2780 and OVCAR3 cells decreased gradually with increased time (Figure 3E and F). Furthermore, the results of colony formation assays showed that the proliferative ability of OC cells decreased with HK1 knockdown (Figure 3H).
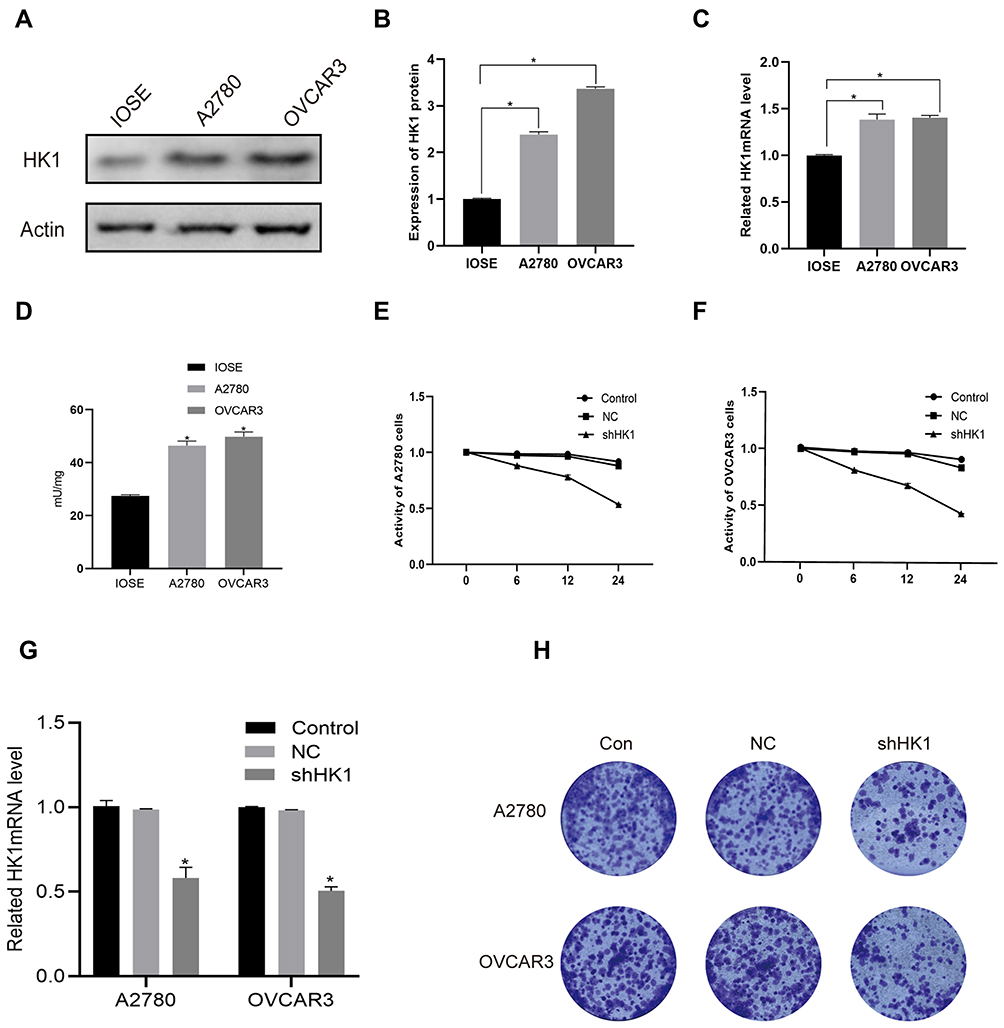 |
Figure 3 HK1 was associated with ovarian cancer cell proliferation. Western blotting, ELISA and RT-qPCR were performed to assess HK1 protein and mRNA expression in A2780 and OVCAR3 cells (A–D; *P<0.05, vs IOSE). MTT was used to detect cell viability after knockdown of HK1 in ovarian cancer cells (E and F; *P<0.05, vs control). RT-qPCR were performed to assess HK1 mRNA expression in IOSE, A2780, and OVCAR3 cells (G; *P<0.05, vs control). Colony formation assays were performed to detect the proliferation of ovarian cancer cells after HK1 knockdown (H). |
HK1 Participates in the Progression of OC Through Glycolysis
As HK1 is the first rate-limiting enzyme in glycolysis, we examine the level of glycolysis in OC cells. When 2DG, an inhibitor of HK1, was added to OC cells, it was found that glucose uptake, lactic acid production, and ATP were decreased (Figure 4A–C). To further determine the role of HK1, HK1 was knocked down in OC cells, revealing that glucose uptake, lactic acid production, and ATP production were decreased (Figure 4D–F), and demonstrating that HK1 was involved in the survival of OC cells through glycolysis.
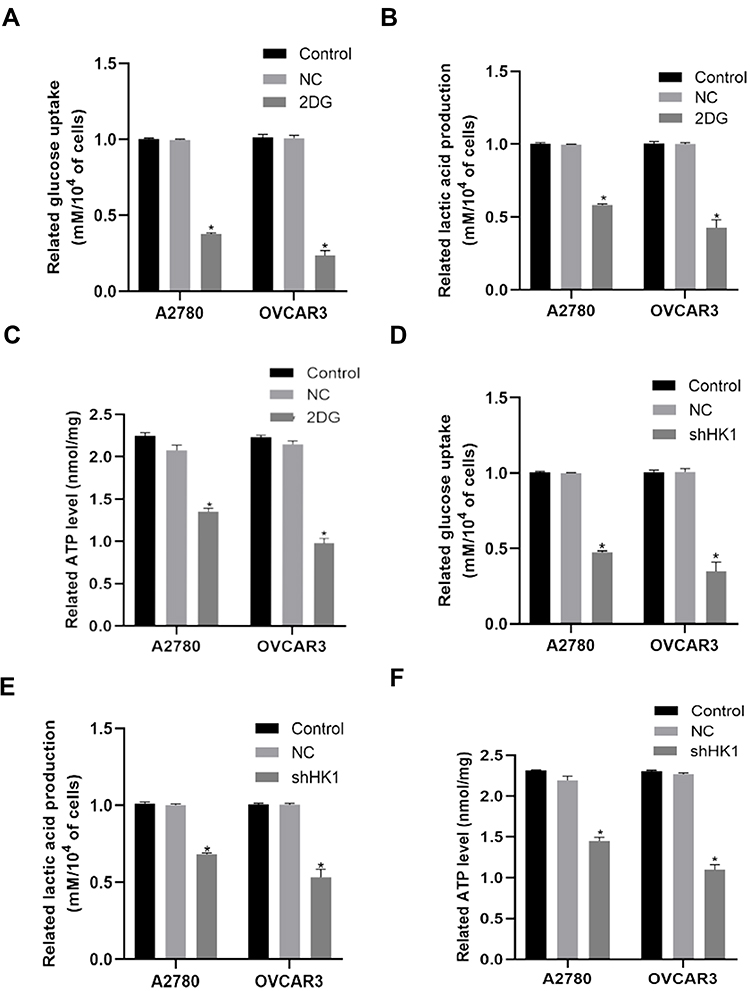 |
Figure 4 HK1 is involved in the glycolysis of ovarian cancer cells. Glucose uptake, lactate production, and ATP assays were performed to examine changes in glucose uptake (A and D; *P<0.05, vs control), lactate production (B and E; *P<0.05, vs control), and ATP (C and F; *P<0.05, vs control) in ovarian cancer cells. |
HK1 is Involved in the Invasion and Migration of OC Cells and is Related to the MAPK/ERK Pathway
Invasion and migration are one of the main reasons for the high malignant degree of OC cells. Therefore, we examined the role of HK1 in the migration and invasion of OC cells. Wound healing assays showed that the invasive ability of OC cells was decreased with HK1 knockdown (Figure 5A and B), while transwell assays showed that the migration ability of ovarian cancer cells decreased with HK1 knockdown (Figure 5C). Analysis of signaling pathways is one of the most effective methods to discover the mechanism of genes in cancer, and thus we used GSEA enrichment to identify related signaling pathways of HK1. The results showed that the signaling pathways of pathways in cancer, MAPK, and type II diabetes mellitus were enriched (Figure 5D; Table 4). These results suggested that HK1 is involved in cancer, angiogenesis, tumor invasion, and type II diabetes. We further examined the MAPK signaling pathway by Western blotting and found that HK1 may upregulate this pathway (Figure 5E and F).
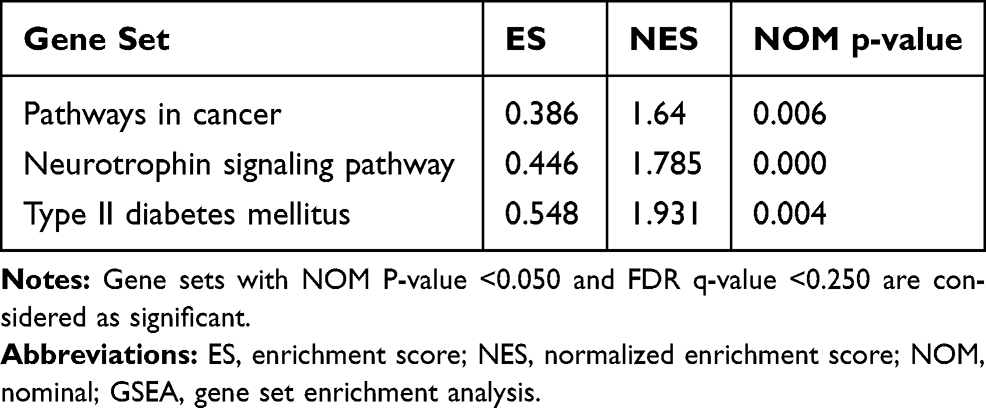 |
Table 4 GSEA Enrichment in High HK1 Phenotype |
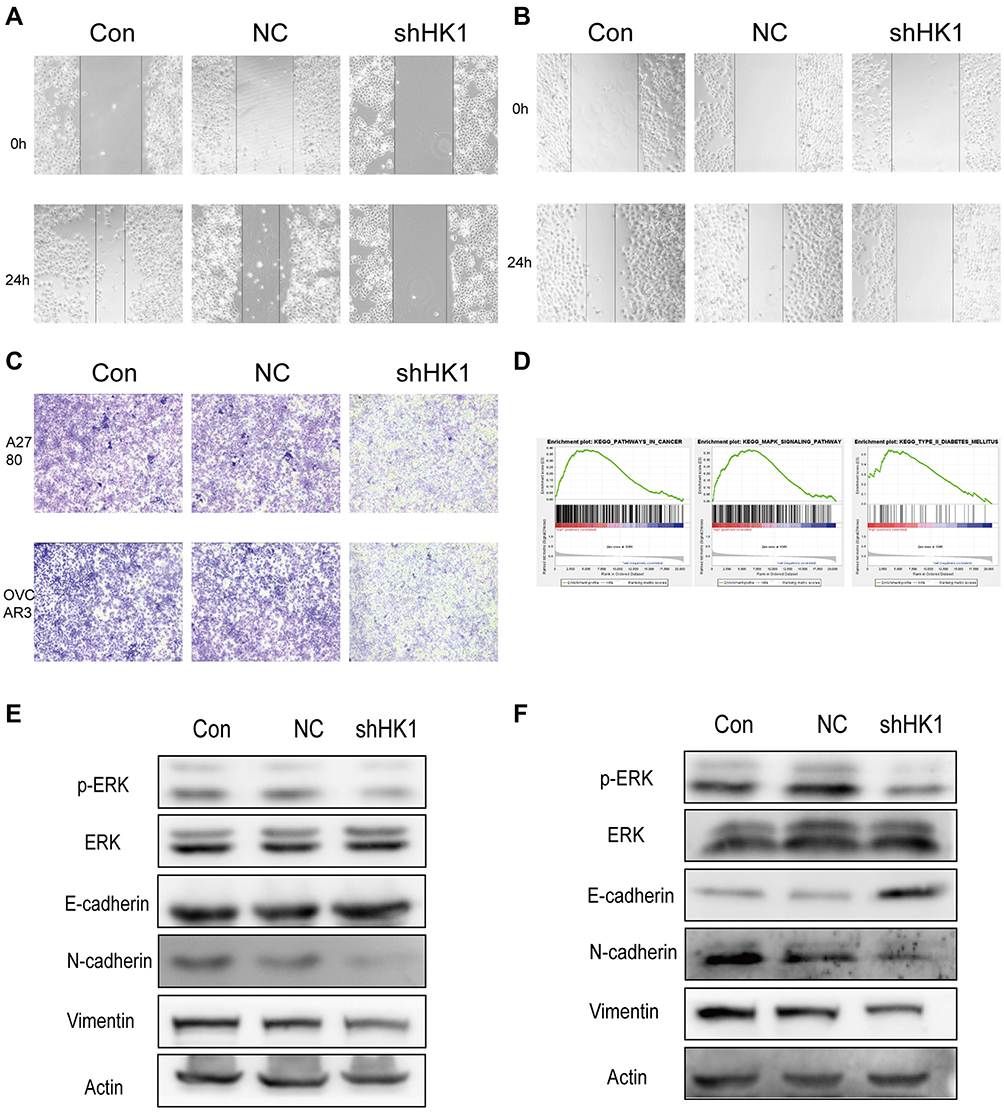 |
Figure 5 HK1 is involved in the invasion, migration, and proliferation of ovarian cancer cells and is related to MAPK/ERK signaling. Wound healing assays were performed to detect the migration ability of A2780 (A) and OVCAR3 (B) ovarian cancer cells after HK1 knockdown. Transwell assays were used to detect the migration ability of ovarian cancer cells after HK1 knockdown (C). GSEA results showed pathways in cancer, the MAPK signaling pathway, and type II diabetes mellitus were enriched in the high HK1 expression phenotype (D). Western blotting was used to detect changes in transfer-related proteins and the MAPK/ERK signaling pathway in A2780 (E) and OVCAR3 cells (F). |
Discussion
OC is a common malignant gynecological cancer with high morbidity and mortality and a poor 5-year survival rate.14 Early diagnosis is difficult, and metastasis and recurrence frequently occur.15 Neoadjuvant chemotherapy, radiotherapy, biotherapy, immunotherapy, and molecular-targeted therapy are also applied to the treatment of OC patients.16 However, the 5-year survival rate of patients with advanced OC is still less than 30%.17 Therefore, exploring the development mechanism of OC and identifying effective biomarkers to judge the prognosis of OC are current research hotspots. Our laboratory has also been committed to the study of cancer biomarkers for patient prognosis.18–21 In this study, we found that HK1 participates in the glycolysis of OC cells and may be an independent biomarker for the poor prognosis of OC patients.
Glucose metabolism enzymes are associated with cancer prognosis. For example, HK2, fructose phosphate kinase, pyruvate kinase 2, and isocitrate dehydration may be prognostic biomarkers of multiple myeloma, prostate cancer, oral squamous cell carcinoma, and glioma.22–26 This is because glucose metabolism enzymes have the ability to promote cancer migration, invasion, and angiogenesis.27 Moreover, the characteristics of metabolic plasticity are more conducive to cancer recurrence and chemotherapy resistance.28 Consistently, we found that high HK1 expression was related to survival, young patients, and G3/G4. This may be because of the increasing occurrence of OC in younger patients. This result also suggests that HK1 may play a role in malignant OC.
HK1 is associated with cancer progression. Among the four isozymes of HK, HK1 has the most significant relationship with cancer.29 HK1 is overexpressed in many cancer cells, such as lung, gastrointestinal, and breast cancer.30,31 Additionally, in an animal model of colorectal cancer, the expression level of HK1 was positively correlated with the proliferation rate of cancer.32 Moreover, HK1 expression was higher in malignant tissues. We also found that HK1 participates in the MAPK signaling pathway. MAPK/ERK signaling is one of the most important pathways in the occurrence and development of OC.33 Therefore, HK1 may promote the proliferation, invasion, and migration of OC cells through MAPK/ERK signaling.
One of the most significant metabolic characteristics of cancer is the Warburg effect.34 It can not only provide macromolecular anabolic precursors for the rapid proliferation of cancer cells but also create a suitable growth microenvironment.27 Moreover, efficient glycolysis is an important energy metabolism characteristic to maintain the malignant phenotype of cancer cells.35 Additionally, HK1 participates in the first reaction of glycolysis by catalyzing glucose to produce glucose 6-phosphate. Recently, some studies found that HK1 can maintain cancer cell proliferation and migration by promoting glycolysis in some cancer types including lung cancer, breast cancer, colorectal adenocarcinoma, and pancreatic cancer.36 We also found that HK1 could promote glucose uptake, lactate production, and ATP production in OC cells. Therefore, even under the pressure of hypoxia, OC tissue can still gain enough energy and necessary materials to promote the growth and proliferation of cancer cells.
In this study, we identified the role of HK1 in OC tissues and cells. HK1 may promote the glycolysis, proliferation, and invasion and migration of OC cells through the MAPK/ERK signaling pathway. Additionally, it may be an independent risk factor for poor prognosis in OC patients. However, because of the limited sample size, the mechanism we examined has not been fully confirmed. In the future, we will further explore the role of HK1 in OC angiogenesis.
Conclusion
In conclusion, we found that HK1 may promote the proliferation, invasion, migration, and glycolysis of ovarian cancer cells through the MAPK/ERK signaling pathway. Additionally, it may be an independent risk factor for poor prognosis in OC patients. In the future, we will increase the sample size to further explore the role of HK1 in OC angiogenesis.
Abbreviations
OC, ovarian cancer; HK1, hexokinase 1; HK2, hexokinase 2; TCGA, The Cancer Genome Atlas; GSEA, Gene set enrichment analysis; NES, normalized enrichment score; ES, enrichment score; NOM, nominal.
Data Deposition
We obtain patients’ information from an open TCGA database (https://portal.gdc.cancer.gov/). Private clinical studies or patient data are not included in this study.
Acknowledgments
We thank Yanan Liu from Jilin University and H. Nikki March, PhD, from Liwen Bianji, Edanz Editing China (www.liwenbianji.cn/ac), for editing the English text of a draft of this manuscript.
Author Contributions
All authors made a significant contribution to the reported work, whether in the conception, study design, execution, acquisition of data, analysis, and interpretation, or in all these areas, or in drafting, revising, or critically reviewing the article. All authors gave final approval of the version to be published, have agreed on the journal to which the article has been submitted, and agree to be accountable for all aspects of the work.
Funding
This work was in part supported by grants from the 11th Young Fund of the First Hospital Jilin University [grant number JDYY11202008].
Disclosure
The authors report no conflicts of interest for this work.
References
1. Wilson MK, Pujade-Lauraine E, Aoki D, et al. Fifth ovarian cancer consensus conference of the gynecologic cancer intergroup: recurrent disease. Ann Oncol. 2017;28(4):727–732. doi:10.1093/annonc/mdw663
2. Menon U, Karpinskyj C, Gentry-Maharaj A. Ovarian cancer prevention and screening. Obstet Gynecol. 2018;131(5):909–927. doi:10.1097/AOG.0000000000002580
3. Essel KG, Moore KN. Niraparib for the treatment of ovarian cancer. Expert Rev Anticancer Ther. 2018;18(8):727–733. doi:10.1080/14737140.2018.1490180
4. Hacker NF, Rao A. Surgery for advanced epithelial ovarian cancer. Best Pract Res Clin Obstet Gynaecol. 2017;41:71–87. doi:10.1016/j.bpobgyn.2016.10.007
5. Ganapathy-Kanniappan S. Molecular intricacies of aerobic glycolysis in cancer: current insights into the classic metabolic phenotype. Crit Rev Biochem Mol Biol. 2018;53(6):667–682. doi:10.1080/10409238.2018.1556578
6. Wilson JE. Hexokinases. Rev Physiol Biochem Pharmacol. 1995;126:65–198.
7. Zhou Y, Liu K, Liu Y, Tan L. MicroRNA-34a inhibit hepatocellular carcinoma progression by repressing hexokinase-1. J Cell Biochem. 2019;120:7147–7153.
8. Graziano F, Ruzzo A, Giacomini E, et al. Glycolysis gene expression analysis and selective metabolic advantage in the clinical progression of colorectal cancer. Pharmacogenomics J. 2017;17(3):258–264. doi:10.1038/tpj.2016.13
9. Siu MKY, Jiang YX, Wang JJ, et al. Hexokinase 2 regulates ovarian cancer cell migration, invasion and stemness via FAK/ERK1/2/MMP9/NANOG/SOX9 signaling cascades. Cancers. 2019;11(6):813. doi:10.3390/cancers11060813
10. Team RDCJC. R: a language and environment for statistical computing. R foundation for statistical computing, Vienna, Austria. 2008.
11. Wickham H. Ggplot2: elegant graphics for data analysis. J R Stat Soc. 2011;174(1):245–246. doi:10.1111/j.1467-985X.2010.00676_9.x
12. Therneau TM. A Package for Survival Analysis in S. Mayo Clinic Foundation Rochester; 1994.
13. Therneau TM, Grambsch PM. Modeling Survival Data: Extending the Cox Model. Vol. 97. New York: Springer; 2000.
14. Siegel RL, Miller KD, Jemal A. Cancer statistics, 2019. CA Cancer J Clin. 2019;69(1):7–34.
15. Eisenhauer EA. Real-world evidence in the treatment of ovarian cancer. Ann Oncol. 2017;28(suppl_8):viii61–viii65. doi:10.1093/annonc/mdx443
16. Orr B, Edwards RP. Diagnosis and treatment of ovarian cancer. Hematol Oncol Clin North Am. 2018;32(6):943–964. doi:10.1016/j.hoc.2018.07.010
17. DeSantis CE, Miller KD, Goding Sauer A, Jemal A, Siegel RL. Cancer statistics for African Americans, 2019. CA Cancer J Clin. 2019;69(3):211–233.
18. Jiao Y, Li Y, Jiang P, Fu Z, Liu Y. High MAST2 mRNA expression and its role in diagnosis and prognosis of liver cancer. Sci Rep. 2019;9(1):19865. doi:10.1038/s41598-019-56476-x
19. Jia B, Tan L, Jin Z, Jiao Y, Fu Y, Liu Y. MiR-892a promotes hepatocellular carcinoma cells proliferation and invasion through targeting CD226. J Cell Biochem. 2017;118(6):1489–1496. doi:10.1002/jcb.25808
20. Zhou LL, Jiao Y, Chen HM, et al. Differentially expressed long noncoding RNAs and regulatory mechanism of LINC02407 in human gastric adenocarcinoma. World J Gastroenterol. 2019;25(39):5973–5990. doi:10.3748/wjg.v25.i39.5973
21. Cui Y, Jiao Y, Wang K, He M, Yang Z. A new prognostic factor of breast cancer: high carboxyl ester lipase expression related to poor survival. Cancer Genet. 2019;239:54–61. doi:10.1016/j.cancergen.2019.09.005
22. Abe Y, Ikeda S, Kitadate A, et al. Low hexokinase-2 expression-associated false-negative (18)F-FDG PET/CT as a potential prognostic predictor in patients with multiple myeloma. Eur J Nucl Med Mol Imaging. 2019;46(6):1345–1350. doi:10.1007/s00259-019-04312-9
23. Bjerre MT, Strand SH, Nørgaard M, et al. Aberrant DOCK2, GRASP, HIF3A and PKFP hypermethylation has potential as a prognostic biomarker for prostate cancer. Int J Mol Sci. 2019;20(5):1173. doi:10.3390/ijms20051173
24. Wang Y, Zhang X, Zhang Y, et al. Overexpression of pyruvate kinase M2 associates with aggressive clinicopathological features and unfavorable prognosis in oral squamous cell carcinoma. Cancer Biol Ther. 2015;16(6):839–845. doi:10.1080/15384047.2015.1030551
25. Zhao R, Li L, Yang J, et al. Overexpression of pyruvate kinase M2 in tumor tissues is associated with poor prognosis in patients with hepatocellular carcinoma. Pathol Oncol Res. 2020;26(2):853–860. doi:10.1007/s12253-019-00630-3
26. Vuong HG, Tran TTK, Ngo HTT, et al. Prognostic significance of genetic biomarkers in isocitrate dehydrogenase-wild-type lower-grade glioma: the need to further stratify this tumor entity - a meta-analysis. Eur J Neurol. 2019;26(3):379–387. doi:10.1111/ene.13826
27. Bose S, Le A. Glucose metabolism in cancer. Adv Exp Med Biol. 2018;1063:3–12.
28. Sun L, Suo C, Li ST, Zhang H, Gao P. Metabolic reprogramming for cancer cells and their microenvironment: beyond the Warburg effect. Biochim Biophys Acta Rev Cancer. 2018;1870(1):51–66. doi:10.1016/j.bbcan.2018.06.005
29. Sebastian S, Kenkare UW. Expression of two type II-like tumor hexokinase RNA transcripts in cancer cell lines. Tumour Biol. 1998;19(4):253–260. doi:10.1159/000030015
30. Neary CL, Pastorino JG. Nucleocytoplasmic shuttling of hexokinase II in a cancer cell. Biochem Biophys Res Commun. 2010;394(4):1075–1081. doi:10.1016/j.bbrc.2010.03.129
31. Altenberg B, Greulich KO. Genes of glycolysis are ubiquitously overexpressed in 24 cancer classes. Genomics. 2004;84(6):1014–1020. doi:10.1016/j.ygeno.2004.08.010
32. Burt BM, Humm JL, Kooby DA, et al. Using positron emission tomography with [(18)F]FDG to predict tumor behavior in experimental colorectal cancer. Neoplasia. 2001;3(3):189–195. doi:10.1038/sj.neo.7900147
33. Chen K, Liu MX, Mak CS, et al. Methylation-associated silencing of miR-193a-3p promotes ovarian cancer aggressiveness by targeting GRB7 and MAPK/ERK pathways. Theranostics. 2018;8(2):423–436. doi:10.7150/thno.22377
34. Porporato PE, Filigheddu N, Pedro JMB, Kroemer G, Galluzzi L. Mitochondrial metabolism and cancer. Cell Res. 2018;28(3):265–280. doi:10.1038/cr.2017.155
35. Yang J, Ren B, Yang G, et al. The enhancement of glycolysis regulates pancreatic cancer metastasis. Cell Mol Life Sci. 2020;77(2):305–321. doi:10.1007/s00018-019-03278-z
36. Amendola CR, Mahaffey JP, Parker SJ, et al. KRAS4A directly regulates hexokinase 1. Nature. 2019;576(7787):482–486. doi:10.1038/s41586-019-1832-9
 © 2020 The Author(s). This work is published and licensed by Dove Medical Press Limited. The full terms of this license are available at https://www.dovepress.com/terms.php and incorporate the Creative Commons Attribution - Non Commercial (unported, v3.0) License.
By accessing the work you hereby accept the Terms. Non-commercial uses of the work are permitted without any further permission from Dove Medical Press Limited, provided the work is properly attributed. For permission for commercial use of this work, please see paragraphs 4.2 and 5 of our Terms.
© 2020 The Author(s). This work is published and licensed by Dove Medical Press Limited. The full terms of this license are available at https://www.dovepress.com/terms.php and incorporate the Creative Commons Attribution - Non Commercial (unported, v3.0) License.
By accessing the work you hereby accept the Terms. Non-commercial uses of the work are permitted without any further permission from Dove Medical Press Limited, provided the work is properly attributed. For permission for commercial use of this work, please see paragraphs 4.2 and 5 of our Terms.