")
Back to Journals » International Journal of General Medicine » Volume 14
Prognostic Roles of Phosphofructokinase Platelet in Clear Cell Renal Cell Carcinoma and Correlation with Immune Infiltration
Authors Liu B , Li F, Liu M , Xu Z, Gao B, Wang Y, Zhou H
Received 22 May 2021
Accepted for publication 8 July 2021
Published 20 July 2021 Volume 2021:14 Pages 3645—3658
DOI https://doi.org/10.2147/IJGM.S321337
Checked for plagiarism Yes
Review by Single anonymous peer review
Peer reviewer comments 2
Editor who approved publication: Dr Scott Fraser
Bin Liu,1 Faping Li,1 Mingdi Liu,2 Zhixiang Xu,2 Baoshan Gao,1 Yishu Wang,2 Honglan Zhou1
1Department of Urology, the First Hospital of Jilin University, Changchun, 130021, Jilin, People’s Republic of China; 2Key Laboratory of Pathobiology, Ministry of Education, Jilin University, Changchun, 130021, Jilin, People’s Republic of China
Correspondence: Yishu Wang
Key Laboratory of Pathobiology, Ministry of Education, Jilin University, Changchun, 130021, Jilin, People’s Republic of China
, Tel +86-18686686698
Email [email protected]
Honglan Zhou
Department of Urology, the First Hospital of Jilin University, Changchun, 130021, Jilin, People’s Republic of China
Tel +86 0431-81875821
Email [email protected]
Background: Abnormal expression of phosphofructokinase platelet (PFKP) has been reported in various cancer types. However, the role of PFKP in clear cell renal cell carcinoma (ccRCC) remains unclear.
Methods: In this study, the PFKP expression levels in various cancers were systemically described by integrating multiple kinds of publicly available databases. The relationship between PFKP expression and clinical prognosis of ccRCC patients was analyzed based on the TCGA database. Furthermore, PFKP-related genes and the top 10 hub genes were identified. The enrichment analysis, PPI network, and the relationship between PFKP and tumor-infiltrating immune cells were conducted to explore why PFKP was associated with clinical outcomes in ccRCC patients.
Results: PFKP was significantly highly expressed in kidney cancer, especially in ccRCC. Moreover, patients with low expression of PFKP were correlated with poor 5-year and 10-year overall survival (OS) (P < 0.05). Low PFKP expression was a risk factor associated with decreased OS in subgroups including males, females, grade 3– 4, and stage III–IV (all P < 0.05). GO and KEGG enrichment analyses showed that 10 hub genes were mainly enriched in the tumor immune response. Finally, PFKP expression level was highly correlated with the infiltration of B cell, CD8+ T cell, CD4+ T cell, macrophage, neutrophil, and dendritic cell.
Conclusion: In short, our findings suggested that PFKP is highly expressed in ccRCC significantly and facilitated tumor immune response which in turn associated with a good prognosis.
Keywords: phosphofructokinase platelet, clear cell renal cell carcinoma, prognosis, biological function enrichment analyses, tumor immune infiltrating cells
Introduction
Worldwide, kidney cancer accounts for about 2.2% of new cancer cases and 1.8% of oncological causes of death.1 According to the International Agency for Research on Cancer statistics in 2018, more than 403,262 new cases are diagnosed worldwide annually, with more than 175,098 deaths.2 Renal cell carcinoma (RCC) accounts for approximately 80–90% of kidney cancer.3 Clear cell renal cell carcinoma (ccRCC) originates from renal proximal tubule epithelial cells, which is the commonest histological subtype of RCC.4
Despite impressive advances in imaging techniques, diagnosis, and treatment, many issues are still to be solved in RCC. On the one hand, metastasis occurs in approximately 20–30% RCC cases of pT1b-pT2 stage within 1–2 years after surgery,5 but only high-risk localized RCC patients may benefit from the postoperative adjuvant approach, including cytokine therapy, radiotherapy, and chemotherapy. On the other hand, only a small number of locally advanced RCC patients could benefit from extended lymphadenectomy. Hence, accurate prediction of disease outcomes and early selection of appropriate treatment options in ccRCC patients are critical to improving prognosis.
Cancer cells obtain energy mainly through the Warburg effect,6 which describes that cancer cells increase glycolysis, lactic acid fermentation, and synthesize macromolecular precursors to support cell proliferation even in excessive oxygen.7 Phosphofructokinase platelet (PFKP) is one of three subtypes of phosphofructokinase-1 (PFK-1), including phosphofructokinase muscle and phosphofructokinase liver. As a rate-controlling enzyme in essential glycolytic reaction, PFKP changes its conformation and catalyzes the phosphorylation of fructose-6-phosphate to fructose-1,6-bisphosphate.8
Recently, it has been reported that PFKP is highly expressed in different types of tumors, including oral squamous cell carcinoma (OSCC) and lung cancer.9,10 The upregulation of PFKP is associated with the pathological differentiation and lymph node metastasis of oral squamous cell carcinoma. Furthermore, it is necessary for starvation-mediated autophagy, glycolysis, and epithelial-mesenchymal transition.9 PFKP regulates lung cancer cell proliferation by adjusting the glycolysis level, which has a tight connection with tumor size and patient prognosis.10 Wang et al11 found that the PFKP was required for cell proliferation in kidney cancer, and the suppression of PFKP resulted in the reduction of ccRCC growth in vivo. However, Wang et al12 revealed that low expression of PFKP was correlated with a poor outcome in ccRCC patients. Thus, the role of PFKP in RCC is still unclear, and it is necessary to evaluate whether PFKP is a prognostic indicator for RCC patients.
In this paper, we integrated multiple kinds of publicly available databases and found that the PFKP expression was highly expressed in ccRCC but associated with a good prognosis. Then, the PFKP-related genes and hub genes, which were mainly enriched in metabolism and immune response, were identified. Besides, the PFKP expression level was positively correlated with the abundance of six types of tumor immune infiltrating cells (TIICs). Overall, our research might provide a new perspective on the relationship between PFKP and ccRCC.
Materials and Methods
Data Collection
Gene Expression Omnibus (GEO) microarray series (GSE17895, GSE36895, GSE40435, GSE46699, GSE53757, GSE68417, GSE71963) containing ccRCC and normal samples were downloaded from the GEO (https://www.ncbi.nlm.nih.gov/geo/) of National Center for Biotechnology Information. Details of the GEO series and platforms were summarized in Table 1.
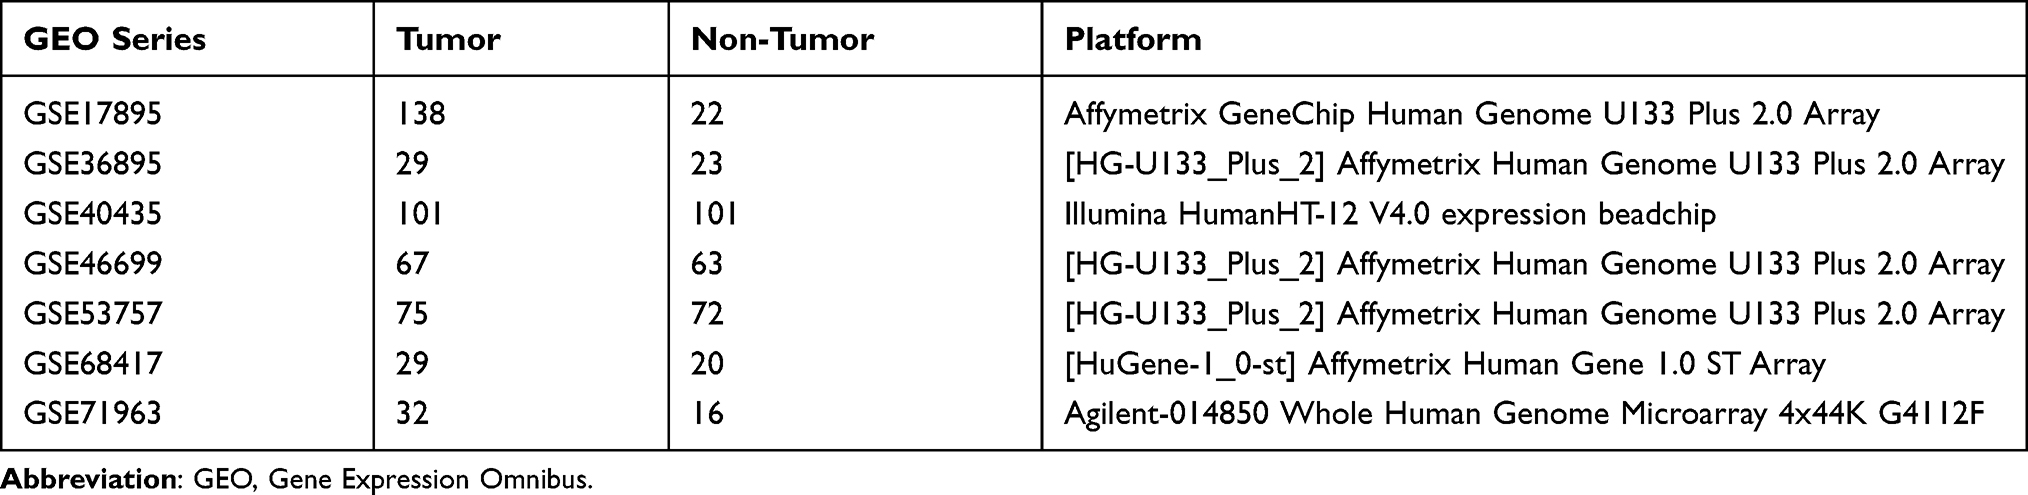 |
Table 1 Details of the GEO Series Included in This Analysis |
All of the publicly available The Cancer Genome Atlas (TCGA) level 3 gene expression data of ccRCC samples were obtained from the TCGA website (https://cancergenome.nih.gov/), which comprised 541 tumor samples and 70 normal samples.
Identifying PFKP Expression Through Bioinformatics Analysis
The analysis and visualization of PFKP expression in different cancers were confirmed using publicly available databases, including the Oncomine database (https://www.oncomine.org/), Gene Expression Profiling Interactive Analysis (GEPIA) database (http://gepia.cancer-pku.cn/), Cancer Cell Line Encyclopedia (CCLE) (https://portals.broadinstitute.org/ccle), and Human Protein Atlas (HPA) database (https://www.proteinatlas.org/). The threshold of the Oncomine database was set with p-value ≤ 1E-3, fold change ≥ 2, and the top 10% gene rank.
Raw microarray files (.CEL files) of ccRCC patients from the GEO dataset were normalized and log2-transformed using Robust Multichip Analysis algorithm by the “affy” package in R (version 4.0.2).13 Differential expression of PFKP between tumor and normal samples from the GEO database was performed using the R “Limma” package.14 And the data from TCGA were compared by the “edgeR” package.15
A meta-analysis of 7 datasets containing PFKP mRNA expression data was performed in the Oncomine database with a threshold of p-value ≤ 1E-4, fold change ≥ 2, and top 10% gene rank to illustrate comparisons between ccRCC and normal tissues. Detailed data were downloaded and visualized using GraphPad Prism 8 (GraphPad Software Inc., the United States).
A p-value of less than 0.05 was considered to indicate statistical significance.
Survival Analysis
GEPIA database was used to analyze the overall survival (OS) and disease-free survival (DFS) of ccRCC, chromophobe renal cell carcinoma (cRCC), and papillary renal cell carcinoma (pRCC) patients based on the PFKP expression levels. The median cutoff value was used to divide the samples into high and low expression groups. The HR and the 95% confidence interval were also included in the survival plot. Curves of OS in ccRCC were generated from the Kaplan-Meier Plotter website16 (https://kmplot.com/analysis/), which split patients (n=530) by auto-selecting the best cutoff.
The ccRCC patients’ clinical data were extracted using the UCSC Xena project (https://xena.ucsc.edu)17 from TCGA. The exclusion criteria including (i) unavailable survival information and (ii) unavailable subgroup data. After deleting some missing data, the PFKP median expression level was taken as the cutoff point and classified the patient into low expression and high expression groups. Then, we analyzed the correlation between PFKP expression levels with survival rates and clinical pathological characteristics in different subgroups using GraphPad Prism 8.
Identification of PFKP-Related Genes
As mentioned above, the data from TCGA were compared by the “edgeR” package15 to screen for differential expression genes (DEGs). The P < 0.05 and |logFC| > 1 were chosen as cut-off threshold. The Spearman coefficients of the DEGs and PFKP were calculated. DEGs with P < 0.05 were defined as PFKP-related genes and used for further analysis.
GO/KEGG/PPI Biological Function Enrichment Analyses
The DAVID (version 6.8) online tool (https://david.ncifcrf.gov/) was applied for the Gene Ontology (GO) and the Kyoto Encyclopedia of Genes and Genomes (KEGG) enrichment analyses of PFKP-related genes. P < 0.05 was considered statistically significant. The GO analysis included biological process, cellular component, and molecular function, which were ascending ranked according to their FDR value, and the top 5 terms of each aspect were selected for the main figure By the same token, the top 10 terms were selected in KEGG.
STRING (http://string-db.org)18 was performed to predict the known and unknown protein interaction relationships of PFKP-related genes setting the medium confidence at 0.400 as a minimum required interaction score. The protein-protein interaction (PPI) pairs were downloaded and imported into the Cytoscape19 software (version 3.7.2) to generate a PPI network. And the plug-in cytohubba20 (version 0.1) of Cytoscape was used to identify the top 10 hub genes ranked by “Degree”.
Immune Infiltrates Analysis
The abundance of TIICs, including B cell, CD8+ T cell, CD4+ T cell, macrophage, neutrophil, and dendritic cell in ccRCC were evaluated based on PFKP expression data via the Tumor Immune Estimation Resource platform (https://cistrome.shinyapps.io/timer/).21
Results
Expression of PFKP in Different Cancers
To identify PFKP expression levels in various human cancers, we used several publicly available databases to compare it between tumor and normal samples (Figure 1). PFKP was significantly highly expressed in kidney cancer, leukemia, lung cancer, lymphoma, and sarcoma (Figure 1A), especially in ccRCC (Figure 1B). CCLE is an RNA-seq dataset that contains more than 1,400 cell lines and 136,488 unique data sets. It was shown that the PFKP mRNA expression level of the kidney was highest in all kinds of cell lines (Figure 1C). Immunohistochemistry staining from the HPA database also confirmed that PFKP expression of kidney adenocarcinomas was higher than normal tissues (Figure 1D). In general, PFKP was highly expressed in renal carcinoma.
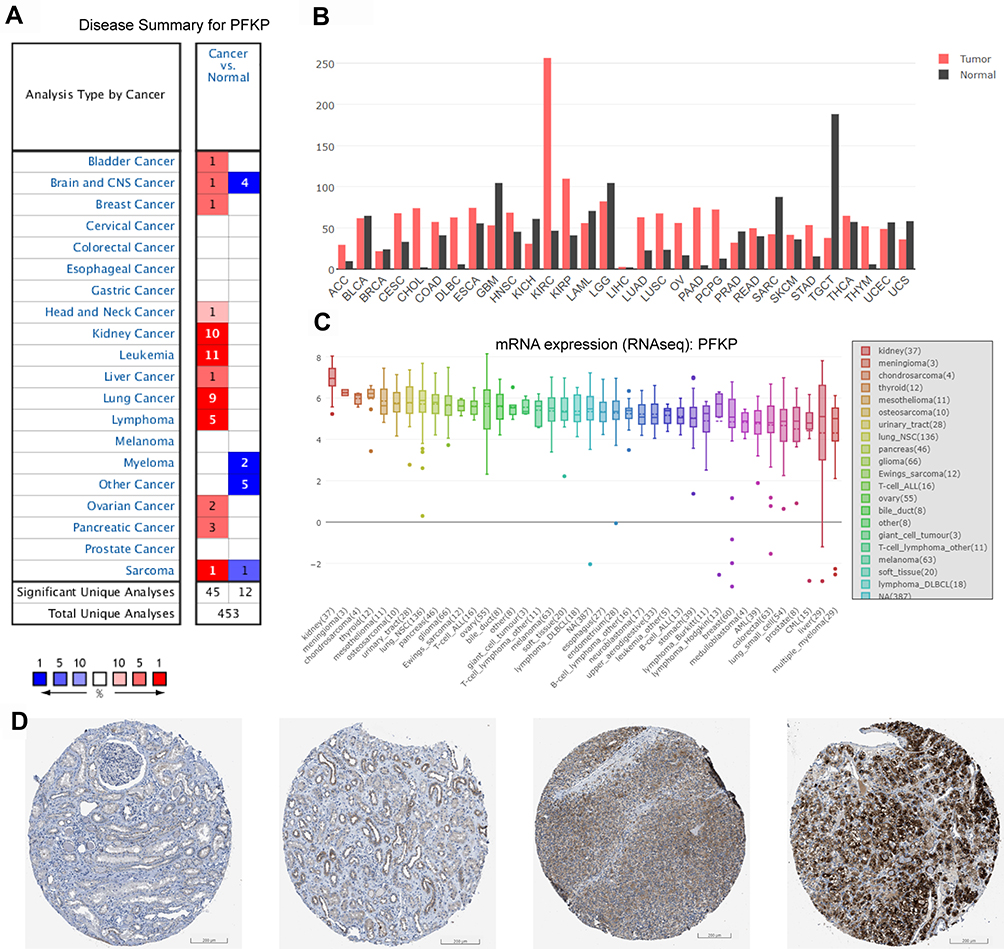 |
Figure 1 Comparing PFKP expression between tumor and normal samples in various cancers. (A) Oncomine database with a threshold of p-value ≤ 1E-3, fold change ≥ 2, and rank top 10% genes. (B) GEPIA database. (C) PFKP mRNA expression level in kinds of cell lines from RNA-seq datasets (CCLE). (D) Representative images of immunohistochemistry staining of PFKP from the HPA database. Scale bar 200 μm. The first two pictures are normal kidney tissue, and the last two are kidney adenocarcinomas. Patient ID is 1933, 3229, 3225, 3061, respectively. Abbreviations: GEPIA, Gene Expression Profiling Interactive Analysis; CCLE, cancer cell line encyclopedia; HPA, Human Protein Atlas; KIRC, kidney renal clear cell carcinoma (equivalent to ccRCC); KICH, kidney chromophobe (equivalent to chromophobe renal cell carcinoma); KIRP, kidney renal papillary cell carcinoma (equivalent to papillary renal cell carcinoma). |
Effect of PFKP on the Survival Rate of Renal Carcinoma Patients
Based on the above findings, we focused on the role of PFKP in renal carcinoma and investigated its effect on survival in patients with different types. Validation was performed in GEPIA and Kaplan-Meier Plotter databases, respectively (Figure 2). The results showed that high expression of PFKP in ccRCC patients was considerably associated with favorable OS (P = 9.8E-5, Figure 2A; P = 0.00021, Figure 2C) and DFS (P = 0.0065, Figure 2B). Meanwhile, there was no effect of PFKP expression level on OS and DFS in cRCC (Figure S1A and B) and pRCC (Figure S1C and D) patients.
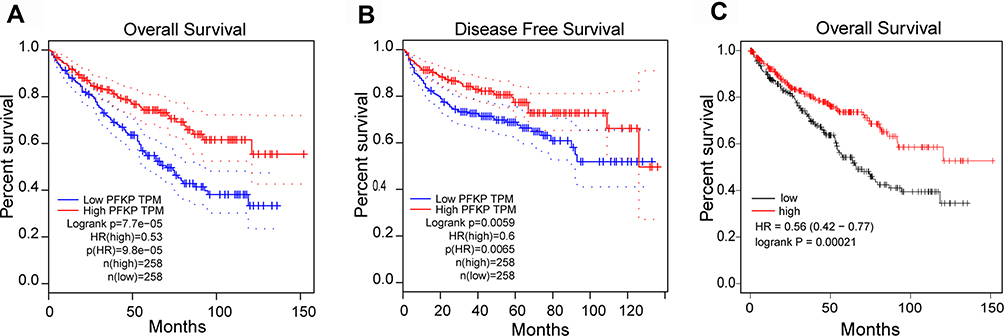 |
Figure 2 Relationship between PFKP expression levels and patient survival in ccRCC. Kaplan-Meier OS curve (A) and DFS curve (B) were shown in GEPIA; The patients were grouped by PFKP media cutoff. Curves of OS (C) were generated from the Kaplan-Meier Plotter website; The patients grouped by PFKP auto-select the best cutoff. Abbreviations: OS, overall survival; DFS, disease-free survival; GEPIA, Gene Expression Profiling Interactive Analysis. |
Expression of PFKP in ccRCC
Microarray series data in the GEO and TCGA database were downloaded to explore the differential expression of PFKP in normal renal and ccRCC tissues. And we found that the expression of PFKP in tumor samples was significantly higher than normal samples (all P < 0.0001, Figure 3).
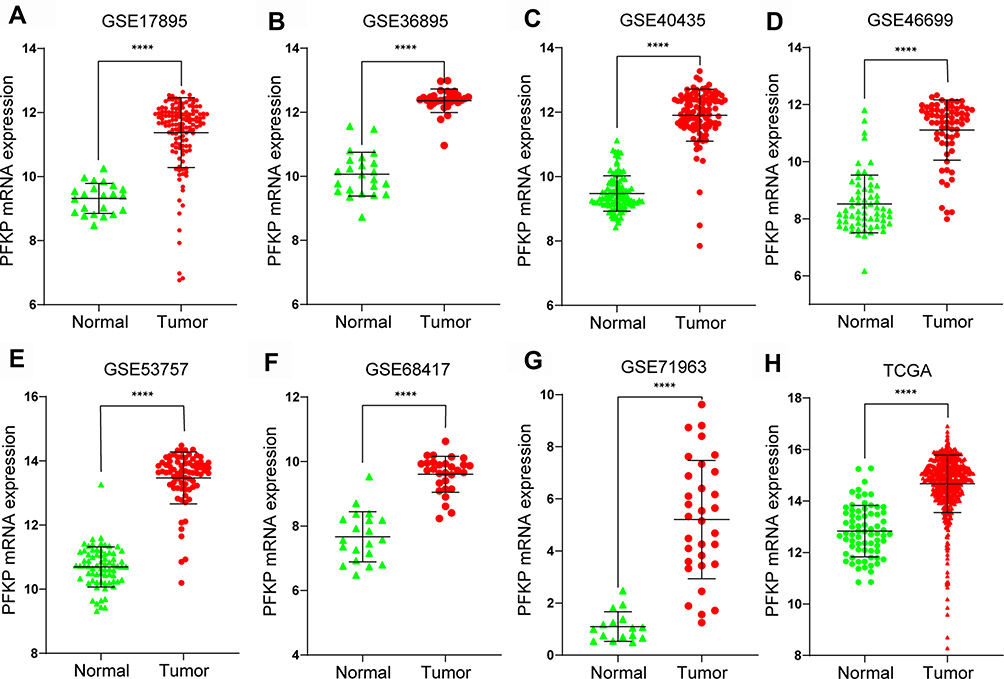 |
Figure 3 Differential mRNA expression of PFKP between tumor and normal samples in ccRCC patients were determined with the use of the Mann–Whitney test based on the data of the GEO database, including GSE17895 (A), GSE36895 (B), GSE40435 (C), GSE46699 (D), GSE53757 (E), GSE68417 (F), GSE71963 (G) and the TCGA database (H). ****P < 0.0001. Abbreviations: ccRCC, kidney renal clear cell carcinoma; GEO, Gene Expression Omnibus; TCGA, The Cancer Genome Atlas. |
To verify the above results, we performed a meta-analysis of PFKP expression in 7 analyses in the Oncomine database (Figure 4A). Compared with normal renal tissues, the expression of PFKP in ccRCC tissues was significantly highly expressed in the Beroukhim Renal study (P < 0.0001, Figure 4B), Cutcliffe Renal study (P < 0.05. Figure 4C), Gumz Renal study (P < 0.0001, Figure 4D), Jones Renal study (P < 0.0001, Figure 4E), Lenburg Renal study (P < 0.0001, Figure 4F), and Yusenko Renal study (P < 0.001, Figure 4G).
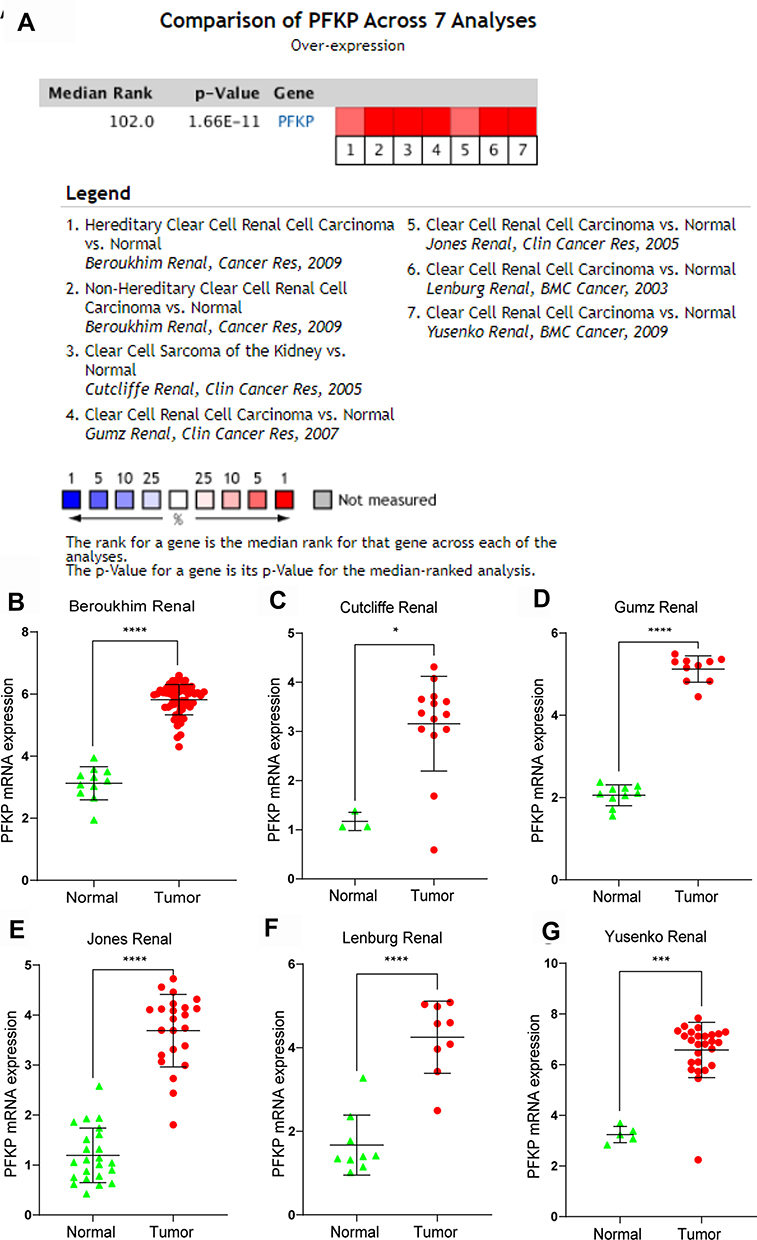 |
Figure 4 Comparison of PFKP expression levels in the Oncomine database. A meta-analysis of PFKP mRNA expression between normal and ccRCC samples in 7 analyses (A). PFKP mRNA expression levels in Beroukhim Renal (B), Cutcliffe Renal (C), Gumz Renal (D), Jones Renal (E), Lenburg Renal (F), and Yusenko Renal (G). In the Beroukhim Renal study, Hereditary Clear Cell Renal Cell Carcinoma (n=32) and Non-Hereditary Clear Cell Renal Cell Carcinoma (n=27) were all regarded as tumors. *P < 0.05. ***P < 0.001. ****P < 0.0001. |
Association Between PFKP and Survival Rate with Different Clinical Characteristics of ccRCC Patients
We further analyzed the relationship between PFKP expression level and survival rate of ccRCC patients from TCGA. The results revealed that low expression of PFKP in tumor tissues was significantly associated with poor 5-year (P = 0.0011, Figure 5A) and 10-year (P = 0.0004, Figure 5B) OS in ccRCC patients. We also performed survival analyses in different subgroups. As shown in Figure 5, low expression of PFKP was a risk factor for reduced males (P = 0.0054, Figure 5C) and females OS (P = 0.0276, Figure 5D). Moreover, lower PFKP levels considerably contributed to worse OS in ccRCC patients with grade 3–4 (P = 0.0018, Figure 5F) and stage III–IV (P = 0.0206, Figure 5H), while no significant differences were observed in grade 1–2 (P = 0.5213, Figure 5E) and stage I–II (P = 0.5572, Figure 5G).
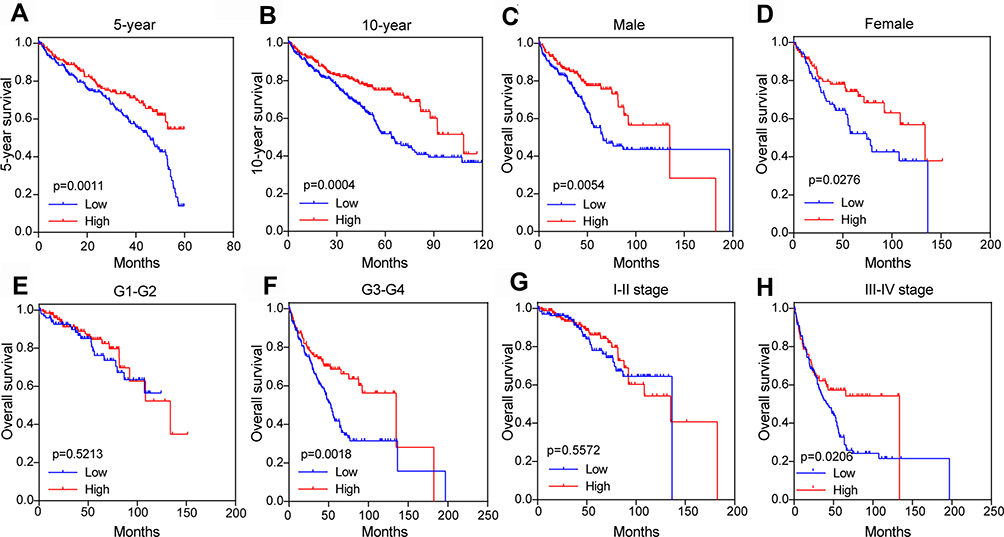 |
Figure 5 Subgroup comparison of ccRCC patients’ OS between high and low PFKP groups in the TCGA database. 5-year (A) and 10-year (B), gender (C and D), different grades (E and F), and stage (G and H). The patients were grouped by PFKP media cutoff. Abbreviations: ccRCC, kidney renal clear cell carcinoma; OS, overall survival; TCGA, The Cancer Genome Atlas. |
As shown in Table 2, the Grade was higher in the PFKP low group (60.5% vs 47.5%, P = 0.003), whilst the tumor stage, metastasis stage, and stage were more serious (P = 0.009, P = 0.030, P = 0.034, respectively). However, the expression levels of PFKP were not affected by age and gender (all P > 0.05).
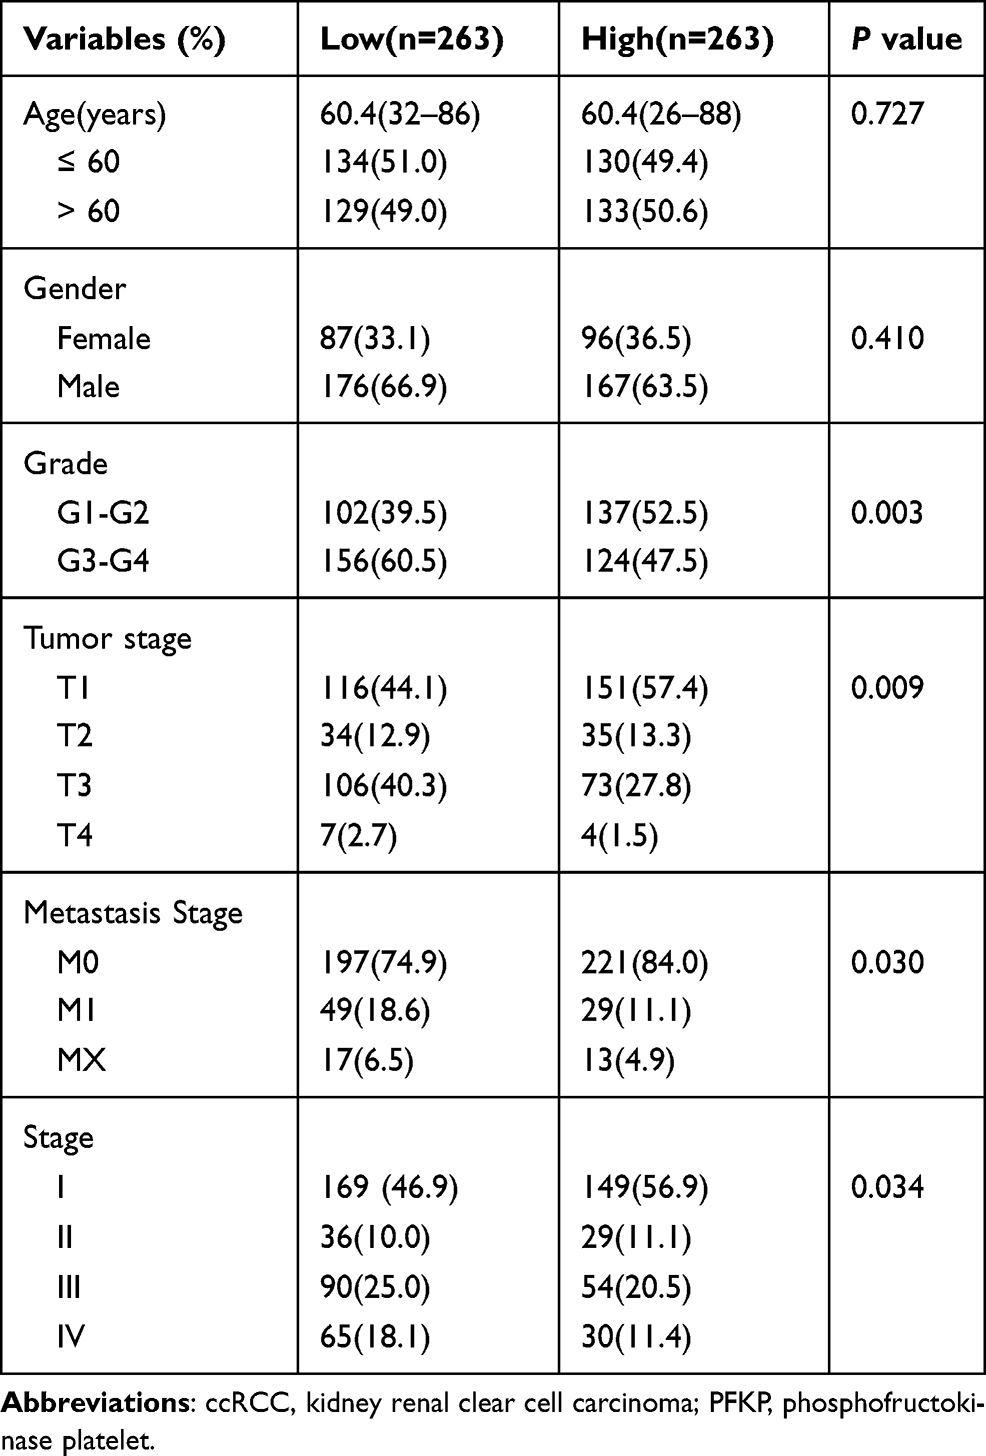 |
Table 2 Characteristics of ccRCC Patients Between PFKP High and Low Groups |
Enrichment Analysis and PPI Network
GO analysis results indicated that PFKP-related genes were significantly enriched in the cellular defense response, proteolysis, and cell-cell signaling in terms of biological process; In terms of cellular component, genes were mainly associated with the extracellular region, integral component of plasma membrane, and extracellular space. Further, in terms of molecular function, genes were enriched in heparin-binding, inorganic anion exchanger activity, and anion antiporter activity (Figure 6A, Table S1). Additionally, the KEGG pathway enrichment analysis showed that the PFKP-related genes are mainly associated with metabolism and immunity response, such as drug metabolism-cytochrome P450 and complement and coagulation cascades (Figure 6B, Table S2). The PPI network of PFKP-related genes was constructed (Figure S2), and the top 10 hub genes were identified using Cytoscape (Figure 7A). We found that CRR5, CRR8, CXCL10, CXCL11, CXCL13, and XCL1 were positively correlated with PFKP, whereas KNG1, GNB3, AOX1, and FABP1 were negatively correlated with PFKP.
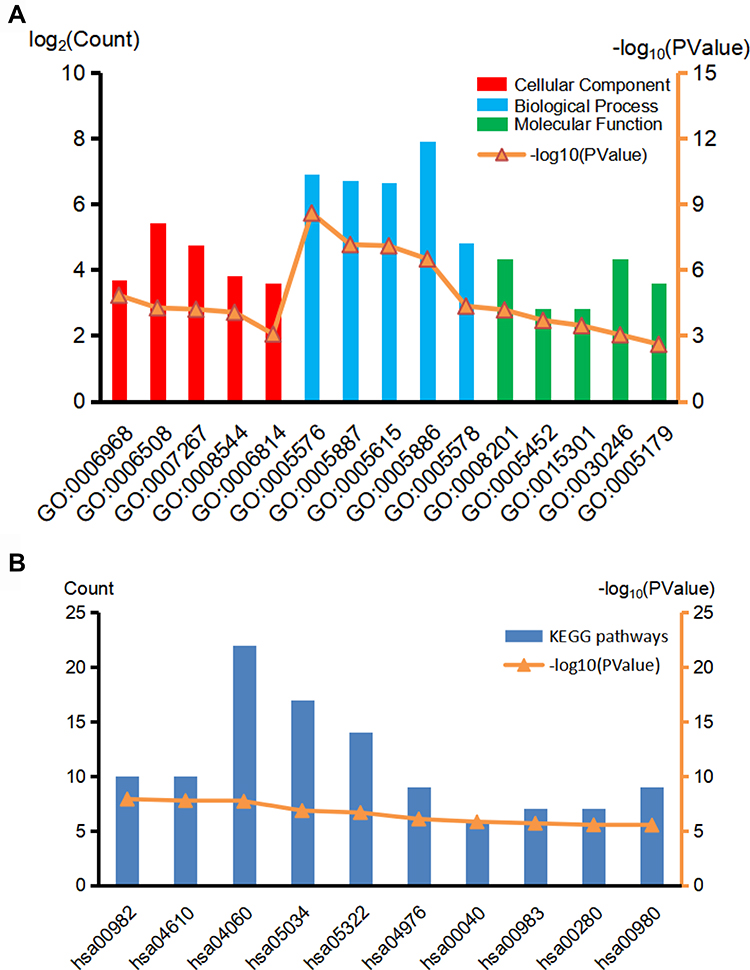 |
Figure 6 GO (A) and KEGG (B) biological function enrichment analyses of PFKP related genes. Red lines indicate the top 5 terms of the cellular component, blue lines indicate the top 5 terms of the biological process, and green lines indicate the top 5 terms of the molecular function in GO analyses. The top 10 terms were selected in KEGG. Abbreviations: GO, Gene Ontology; KEGG, Kyoto Encyclopedia of Genes and Genomes. |
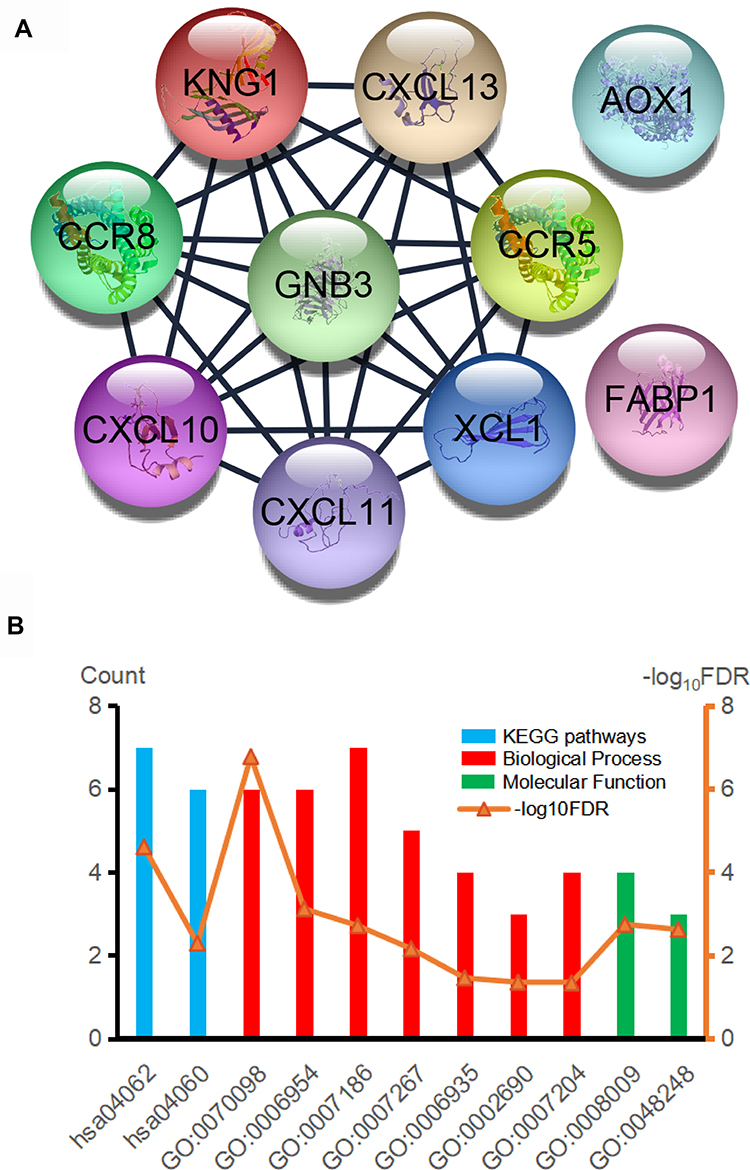 |
Figure 7 (A) Hub genes were identified in the PPI network. (B) GO and KEGG biological function enrichment analyses of hub genes. Abbreviations: PPI, protein-protein interaction; GO, Gene Ontology; KEGG, Kyoto Encyclopedia of Genes and Genomes. |
Next, the GO/KEGG enrichment analyses of the 10 hub genes were further analyzed. As shown in Table 3, hub genes were significantly enriched in immunity and inflammatory response, including chemokine signaling pathway and G-protein coupled receptor signaling pathway (Figure 7B).
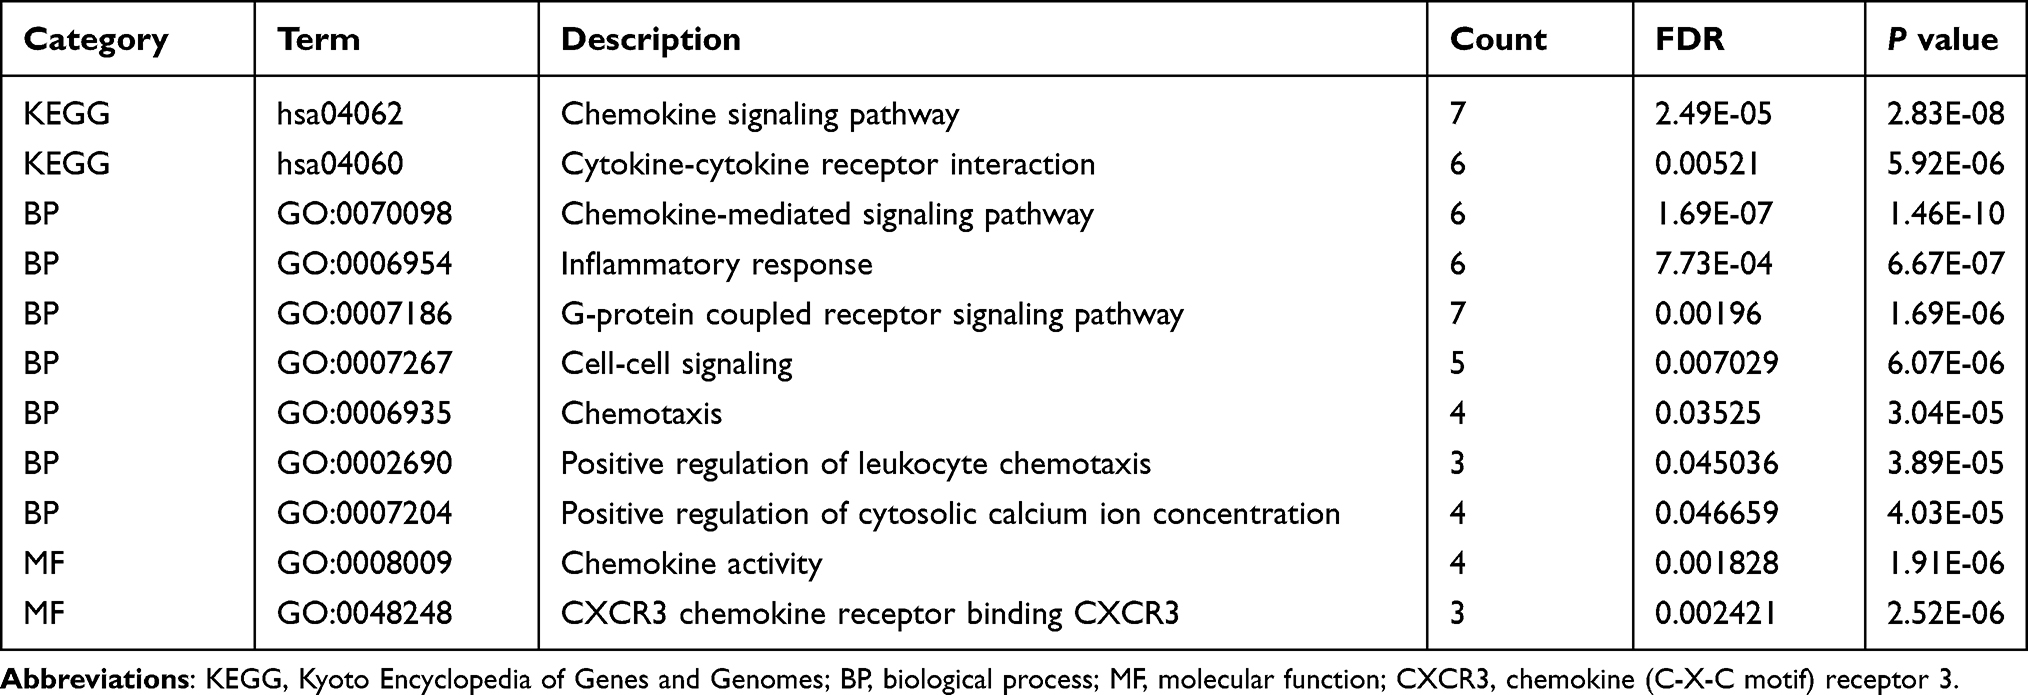 |
Table 3 Enrichment Analysis of the 10 Hub Genes |
The Correlation Analysis Between PFKP and TIICs
The enrichment analysis showed that the PFKP-related genes were closely related to immune response, so we further analyzed the relationship between PFKP and tumor-infiltrating immune cells using the Tumor Immune Estimation Resource database. It was interesting to note that the highest correlations were found between PFKP and B cell (r = 0.228, P = 8.36E-07), CD8+ T cell (r = 0.098, P = 3.96E-02), CD4+ T cell (r = 0.15, P = 1.24E-03), macrophage (r = 0.147, P = 1.83E-03), neutrophil (r = 0.182, P = 8.64E-05), and dendritic cell (r = 0.16, P = 6.28E-04) infiltrates (Figure 8). These results suggested that PFKP might influence the development of ccRCC by influencing the immune microenvironment other than just metabolism.
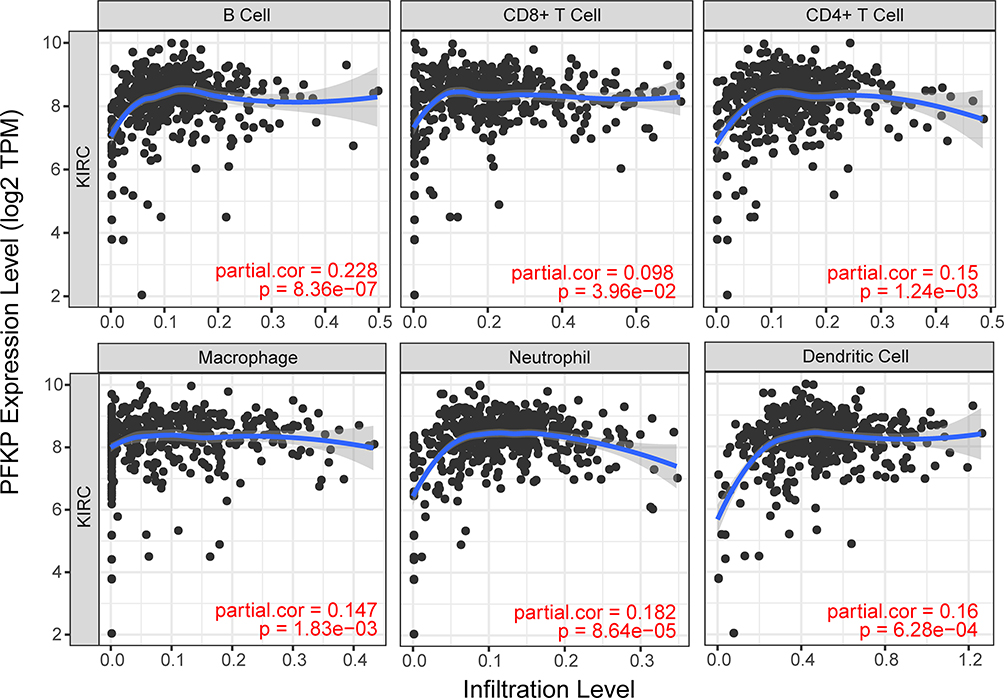 |
Figure 8 The correlation between PFKP expression levels and abundance of tumor immune infiltrating cells. Abbreviation: KIRC, kidney renal clear cell carcinoma (equivalent to ccRCC). |
Discussion
RCC is characterized by reprogramming of energetic metabolism. The metabolic flux through glycolysis is partitioned,22–24 and mitochondrial bioenergetics and oxidative phosphorylation are impaired, as well as lipid metabolism.25,26 In particular, it has been shown that in ccRCC, Complex I is inhibited by NADH dehydrogenase 1 alpha subcomplex 4-like 2 (NDUFA4L2), a HIF-1 target gene encoding for a regulatory protein that attenuates mitochondrial oxygen consumption.26 The most common and malignant histological subtype of RCC is ccRCC, which is insensitive to radiotherapy and has high rates of local invasion, metastasis, and acquired chemoresistance.27,28 In addition, RCC is one of the most immune-infiltrated tumors.29,30 Emerging evidence suggests that the activation of specific metabolic pathways regulates angiogenesis and inflammatory signatures.31 Features of the tumor microenvironment heavily affect disease biology and may affect responses to systemic therapy. Previous studies have revealed that PFKP, as a rate-controlling enzyme in essential glycolytic reaction, is associated with cancer incidence and progression, and is expressed at a high level in different types of cancer such as OSCC and lung cancer.9,10 Sanders et al found that genes involved in glycolysis and lactic acid synthesis were overexpressed, including PFKP in ccRCC.32 Simon et al also found that hexokinase 1, PFKP, and solute carrier family 2 member 1 were highly expressed in the case of ccRCC primary culture.33 Consistent with those previous studies, our study showed that PFKP expression was significantly high in kidney cancer, especially in ccRCC, which was identified by several publicly available databases.
Traditionally, as a rate-controlling enzyme in essential glycolytic reaction, PFKP was considered to play an essential role in tumor migration and metastasis.34,35 Shen et al10 found that PFKP regulated the level of glycolysis in lung cancer and was associated with tumor size, proliferation, and patient prognosis. PFKP also has been demonstrated to increase the risk of poor prognosis in breast cancer patients36 and promote the malignant proliferation of OSCC.9 Meanwhile, it was noteworthy that the high expression of PFKP was considerably associated with a good prognosis in ccRCC patients. And the grade was higher in the PFKP low group, while the tumor stage, metastasis stage, and stage were also more severe. In contrast, there are some different views. The amplification and upregulation of PFK family genes only meant that the patients were likely to have a history of noninvasive bladder cancer and were not associated with survival or disease relapse.37 Wang et al also revealed that low expression of PFKP was correlated with a poor outcome in ccRCC patients.12 Anyway, we confirmed that PFKP played an essential role in ccRCC patients and affected prognosis.
To explore the mechanism of PFKP affecting the prognosis of ccRCC patients, we identified the PFKP-related genes and further screened 10 hub genes. The GO/KEGG analysis proved that those genes were mainly enriched in metabolism, immune and inflammatory response. The hub genes that were positively correlated with PFKP, including CRR5, CRR8, CXCL10, CXCL11, CXCL13, and XCL1, were associated with T cell extravasation, specific T cell activity of intratumoral,38 recruiting effector T cell,39–41 B cell adhesion, and lymphotoxin synthesis,42 and recruitment of dendritic cell.43 The 6-phosphofructo-2-kinase/fructose-2, 6-bisphosphatase, isoform 3, as another critical enzyme for endothelial glycolysis, may promote angiogenesis by regulating CD163+ tumor-associated macrophages infiltration in OSCC.44 Thence, we speculated that PFKP was associated with anti-tumor immune cell infiltration, which had never been observed in previous studies and even influenced the prognosis of ccRCC patients.
Thus, we further carried out immune infiltrate analysis. As expected, the PFKP was highly correlated with the infiltration of B cell, CD8+ T cell, CD4+ T cell, macrophage, neutrophil, and dendritic cell. For the T cell-dependent treatments, the common denominator for tumor microenvironment disruption and subsequent therapeutic fulfillment hinges on the effective trafficking of anti-tumor-directed immune effector CD8+ or CD4+ T cell to cancer cells via the microvasculature.38,45 CD3/CD28 stimulation of human naive CD4+ T cells induced the expression of PFKP.46 To fulfill the bioenergetic and biosynthetic demand of proliferation, T cell reprogramed their metabolic pathways by upregulating glycolytic enzymes.47 This also partly explained that high expression of PFKP was associated with better OS in ccRCC patients.
Conclusion
In conclusion, our study showed that PFKP was highly expressed in ccRCC. And the high expression level of PFKP may induce anti-tumor immune cell infiltration contributing to a better prognosis of ccRCC patients. However, further experiments were needed to explore how high PFKP expression improves outcomes in ccRCC patients, which was not consistent with other studies in other types of cancer.10,12,36 In any case, we provided a newly exciting insight into understanding the role of PFKP in ccRCC.
Abbreviations
CCLE, Cancer cell line encyclopedia; ccRCC, clear cell renal cell carcinoma; cRCC, chromophobe renal cell carcinoma; DEGs, differential expression genes; DFS, disease-free survival; GEO, Gene Expression Omnibus; GEPIA, Gene Expression Profiling Interactive Analysis; GO, Gene Ontology; HPA, Human Protein Atlas; KEGG, Kyoto Encyclopedia of Genes and Genomes; OS, overall survival; OSCC, oral squamous cell carcinoma; PFKP, phosphofructokinase platelet; PPI, protein-protein interaction; pRCC, papillary renal cell carcinoma; RCC, Renal cell carcinoma; TCGA, The Cancer Genome Atlas; TIICs, tumor immune infiltrating cells.
Data Sharing Statement
Publicly available datasets were analyzed in this study. The data can be found in the GEO, TCGA, Oncomine, GEPIA, CCLE, HPA databases, Kaplan-Meier Plotter website, and Tumor Immune Estimation Resource platform.
Ethics Approval and Informed Consent
Several gene expression data and clinical characteristics of patients were publicly available. Therefore, there was no requirement for ethics committee approval.
Author Contributions
All authors made substantial contributions to conception and design, acquisition of data, or analysis and interpretation of data; took part in drafting the article or revising it critically for important intellectual content; agreed to submit to the current journal; gave final approval of the version to be published; and agree to be accountable for all aspects of the work.
Funding
This study in the authors’ laboratory was supported by grants from the National Natural Science Foundation of China (Nos. 81970648) and International Cooperation Project of the Department of Science and Technology of Jilin Province (Nos. 20180101162JC and 20190701049GH).
Disclosure
The authors declare no competing interests.
References
1. Bray F, Ferlay J, Soerjomataram I, Siegel R, Torre L, Jemal A. Global cancer statistics 2018: GLOBOCAN estimates of incidence and mortality worldwide for 36 cancers in 185 countries. CA Cancer J Clin. 2018;68(6):394–424. doi:10.3322/caac.21492
2. Ferlay J, Colombet M, Soerjomataram I, et al. Estimating the global cancer incidence and mortality in 2018: GLOBOCAN sources and methods. Int J Cancer. 2019;144(8):1941–1953. doi:10.1002/ijc.31937
3. Su T, Han Y, Yu Y, et al. A GWAS-identified susceptibility locus on chromosome 11q13.3 and its putative molecular target for prediction of postoperative prognosis of human renal cell carcinoma. Oncol Lett. 2013;6(2):421–426. doi:10.3892/ol.2013.1422
4. Frew IJ, Moch H. A clearer view of the molecular complexity of clear cell renal cell carcinoma. Annu Rev Pathol. 2015;10:263–289. doi:10.1146/annurev-pathol-012414-040306
5. Subramanian V, Stephenson A, Goldfarb D, Fergany A, Novick A, Krishnamurthi V. Utility of preoperative renal artery embolization for management of renal tumors with inferior vena caval thrombi. Urology. 2009;74(1):154–159. doi:10.1016/j.urology.2008.12.084
6. Warburg O. On the origin of cancer cells. Science. 1956;123(3191):309–314. doi:10.1126/science.123.3191.309
7. Liberti MV, Locasale JW. The Warburg effect: how does it benefit cancer cells? Trends Biochem Sci. 2016;41(3):211–218. doi:10.1016/j.tibs.2015.12.001
8. Webb BA, Forouhar F, Szu FE, Seetharaman J, Tong L, Barber DL. Structures of human phosphofructokinase-1 and atomic basis of cancer-associated mutations. Nature. 2015;523(7558):111–114. doi:10.1038/nature14405
9. Chen G, Liu H, Zhang Y, et al. Silencing PFKP inhibits starvation-induced autophagy, glycolysis, and epithelial mesenchymal transition in oral squamous cell carcinoma. Exp Cell Res. 2018;370(1):46–57. doi:10.1016/j.yexcr.2018.06.007
10. Shen J, Jin Z, Lv H, et al. PFKP is highly expressed in lung cancer and regulates glucose metabolism. Cell Oncol. 2020;43(4):617–629. doi:10.1007/s13402-020-00508-6
11. Wang J, Zhang P, Zhong J, et al. The platelet isoform of phosphofructokinase contributes to metabolic reprogramming and maintains cell proliferation in clear cell renal cell carcinoma. Oncotarget. 2016;7(19):27142–27157. doi:10.18632/oncotarget.8382
12. Wang S, Zhang L, Yu Z, Chai K, Chen J. Identification of a glucose metabolism-related signature for prediction of clinical prognosis in clear cell renal cell carcinoma. J Cancer. 2020;11(17):4996–5006. doi:10.7150/jca.45296
13. Gautier L, Cope L, Bolstad BM, Irizarry RA. affy–analysis of Affymetrix GeneChip data at the probe level. Bioinformatics. 2004;20(3):307–315. doi:10.1093/bioinformatics/btg405
14. Ritchie ME, Phipson B, Wu D, et al. limma powers differential expression analyses for RNA-sequencing and microarray studies. Nucleic Acids Res. 2015;43(7):e47. doi:10.1093/nar/gkv007
15. Robinson MD, McCarthy DJ, Smyth GK. edgeR: a Bioconductor package for differential expression analysis of digital gene expression data. Bioinformatics. 2010;26(1):139–140. doi:10.1093/bioinformatics/btp616
16. Nagy Á, Lánczky A, Menyhárt O, Győrffy B. Validation of miRNA prognostic power in hepatocellular carcinoma using expression data of independent datasets. Sci Rep. 2018;8(1):9227. doi:10.1038/s41598-018-27521-y
17. Hinrichs AS, Raney BJ, Speir ML, et al. UCSC data integrator and variant annotation integrator. Bioinformatics. 2016;32(9):1430–1432. doi:10.1093/bioinformatics/btv766
18. Szklarczyk D, Gable AL, Lyon D, et al. STRING v11: protein-protein association networks with increased coverage, supporting functional discovery in genome-wide experimental datasets. Nucleic Acids Res. 2019;47(D1):D607–d613. doi:10.1093/nar/gky1131
19. Smoot ME, Ono K, Ruscheinski J, Wang PL, Ideker T. Cytoscape 2.8: new features for data integration and network visualization. Bioinformatics. 2011;27(3):431–432. doi:10.1093/bioinformatics/btq675
20. Chin CH, Chen SH, Wu HH, Ho CW, Ko MT, Lin CY. cytoHubba: identifying hub objects and sub-networks from complex interactome. BMC Syst Biol. 2014;8:1–7. doi:10.1186/1752-0509-8-S4-S11
21. Li T, Fan J, Wang B, et al. TIMER: a web server for comprehensive analysis of tumor-infiltrating immune cells. Cancer Res. 2017;77(21):e108–e110. doi:10.1158/0008-5472.CAN-17-0307
22. Bianchi C, Meregalli C, Bombelli S, et al. The glucose and lipid metabolism reprogramming is grade-dependent in clear cell renal cell carcinoma primary cultures and is targetable to modulate cell viability and proliferation. Oncotarget. 2017;8(69):113502–113515. doi:10.18632/oncotarget.23056
23. Lucarelli G, Loizzo D, Franzin R, et al. Metabolomic insights into pathophysiological mechanisms and biomarker discovery in clear cell renal cell carcinoma. Expert Rev Mol Diagn. 2019;19(5):397–407. doi:10.1080/14737159.2019.1607729
24. Ragone R, Sallustio F, Piccinonna S, et al. Renal cell carcinoma: a study through NMR-based metabolomics combined with transcriptomics. Diseases. 2016;4(1). doi:10.3390/diseases4010007
25. Bombelli S, Torsello B, De Marco S, et al. 36-kDa annexin A3 isoform negatively modulates lipid storage in clear cell renal cell carcinoma cells. Am J Pathol. 2020;190(11):2317–2326. doi:10.1016/j.ajpath.2020.08.008
26. Lucarelli G, Rutigliano M, Sallustio F, et al. Integrated multi-omics characterization reveals a distinctive metabolic signature and the role of NDUFA4L2 in promoting angiogenesis, chemoresistance, and mitochondrial dysfunction in clear cell renal cell carcinoma. Aging. 2018;10(12):3957–3985. doi:10.18632/aging.101685
27. Liu R, Wang X, Li W, et al. Influence of VEGFR single nucleotide polymorphisms on the efficacy of sunitinib therapy against renal cell carcinoma. Oncol Lett. 2017;13(1):201–205. doi:10.3892/ol.2016.5396
28. Rini BI, Campbell SC, Escudier B. Renal cell carcinoma. Lancet. 2009;373(9669):1119–1132. doi:10.1016/S0140-6736(09)60229-4
29. Vuong L, Kotecha RR, Voss MH, Hakimi AA. Tumor microenvironment dynamics in clear-cell renal cell carcinoma. Cancer Discov. 2019;9(10):1349–1357. doi:10.1158/2159-8290.CD-19-0499
30. Tamma R, Rutigliano M, Lucarelli G, et al. Microvascular density, macrophages, and mast cells in human clear cell renal carcinoma with and without bevacizumab treatment. Urol Oncol. 2019;37(6):
31. Netti GS, Lucarelli G, Spadaccino F, et al. PTX3 modulates the immunoflogosis in tumor microenvironment and is a prognostic factor for patients with clear cell renal cell carcinoma. Aging. 2020;12(8):7585–7602. doi:10.18632/aging.103169
32. Sanders E, Diehl S. Analysis and interpretation of transcriptomic data obtained from extended Warburg effect genes in patients with clear cell renal cell carcinoma. Oncoscience. 2015;2(2):151–186. doi:10.18632/oncoscience.128
33. Simon AG, Esser LK, Ellinger J, et al. Targeting glycolysis with 2-deoxy-d-glucose sensitizes primary cell cultures of renal cell carcinoma to tyrosine kinase inhibitors. J Cancer Res Clin Oncol. 2020;146(9):2255–2265. doi:10.1007/s00432-020-03278-8
34. Beckert S, Farrahi F, Aslam R, et al. Lactate stimulates endothelial cell migration. Wound Repair Regen. 2006;14(3):321–324. doi:10.1111/j.1743-6109.2006.00127.x
35. Hirschhaeuser F, Sattler U, Mueller-Klieser W. Lactate: a metabolic key player in cancer. Cancer Res. 2011;71(22):6921–6925. doi:10.1158/0008-5472.CAN-11-1457
36. Yeerken D, Hong R, Wang Y, et al. PFKP is transcriptionally repressed by BRCA1/ZBRK1 and predicts prognosis in breast cancer. PLoS One. 2020;15(5):e0233750. doi:10.1371/journal.pone.0233750
37. Sun CM, Xiong DB, Yan Y, Geng J, Liu M, Yao XD. Genetic alteration in phosphofructokinase family promotes growth of muscle-invasive bladder cancer. Int J Biol Markers. 2016;31(3):e286–293. doi:10.5301/jbm.5000189
38. Mikucki ME, Fisher DT, Matsuzaki J, et al. Non-redundant requirement for CXCR3 signalling during tumoricidal T-cell trafficking across tumour vascular checkpoints. Nat Commun. 2015;6:7458. doi:10.1038/ncomms8458
39. Spranger S, Gajewski TF. Impact of oncogenic pathways on evasion of antitumour immune responses. Nat Rev Cancer. 2018;18(3):139–147. doi:10.1038/nrc.2017.117
40. Brewitz A, Eickhoff S, Dähling S, et al. CD8(+) T cells orchestrate pDC-XCR1(+) dendritic cell spatial and functional cooperativity to optimize priming. Immunity. 2017;46(2):205–219. doi:10.1016/j.immuni.2017.01.003
41. Proost P, Mortier A, Loos T, et al. Proteolytic processing of CXCL11 by CD13/aminopeptidase N impairs CXCR3 and CXCR7 binding and signaling and reduces lymphocyte and endothelial cell migration. Blood. 2007;110(1):37–44. doi:10.1182/blood-2006-10-049072
42. Sáez de Guinoa J, Barrio L, Mellado M, Carrasco YR. CXCL13/CXCR5 signaling enhances BCR-triggered B-cell activation by shaping cell dynamics. Blood. 2011;118(6):1560–1569. doi:10.1182/blood-2011-01-332106
43. Engel I, Seumois G, Chavez L, et al. Innate-like functions of natural killer T cell subsets result from highly divergent gene programs. Nat Immunol. 2016;17(6):728–739. doi:10.1038/ni.3437
44. Li J, Mao X, Tian T, et al. Role of PFKFB3 and CD163 in oral squamous cell carcinoma angiogenesis. Curr Med Sci. 2019;39(3):410–414. doi:10.1007/s11596-019-2051-1
45. Lugade AA, Moran JP, Gerber SA, Rose RC, Frelinger JG, Lord EM. Local radiation therapy of B16 melanoma tumors increases the generation of tumor antigen-specific effector cells that traffic to the tumor. J Immunol. 2005;174(12):7516–7523. doi:10.4049/jimmunol.174.12.7516
46. Lu W, Zhang Y, McDonald DO, et al. Dual proteolytic pathways govern glycolysis and immune competence. Cell. 2014;159(7):1578–1590. doi:10.1016/j.cell.2014.12.001
47. Wang R, Dillon CP, Shi LZ, et al. The transcription factor Myc controls metabolic reprogramming upon T lymphocyte activation. Immunity. 2011;35(6):871–882. doi:10.1016/j.immuni.2011.09.021
 © 2021 The Author(s). This work is published and licensed by Dove Medical Press Limited. The full terms of this license are available at https://www.dovepress.com/terms.php and incorporate the Creative Commons Attribution - Non Commercial (unported, v3.0) License.
By accessing the work you hereby accept the Terms. Non-commercial uses of the work are permitted without any further permission from Dove Medical Press Limited, provided the work is properly attributed. For permission for commercial use of this work, please see paragraphs 4.2 and 5 of our Terms.
© 2021 The Author(s). This work is published and licensed by Dove Medical Press Limited. The full terms of this license are available at https://www.dovepress.com/terms.php and incorporate the Creative Commons Attribution - Non Commercial (unported, v3.0) License.
By accessing the work you hereby accept the Terms. Non-commercial uses of the work are permitted without any further permission from Dove Medical Press Limited, provided the work is properly attributed. For permission for commercial use of this work, please see paragraphs 4.2 and 5 of our Terms.