")
Back to Journals » Pharmacogenomics and Personalized Medicine » Volume 14
Prognostic Role and Potential Mechanisms of the Ferroptosis-Related Metabolic Gene Signature in Hepatocellular Carcinoma
Authors Dai T , Li J, Lu X, Ye L , Yu H, Zhang L, Deng M, Zhu S, Liu W , Wang G , Yang Y
Received 12 May 2021
Accepted for publication 21 July 2021
Published 3 August 2021 Volume 2021:14 Pages 927—945
DOI https://doi.org/10.2147/PGPM.S319524
Checked for plagiarism Yes
Review by Single anonymous peer review
Peer reviewer comments 2
Editor who approved publication: Dr Martin H Bluth
Tianxing Dai,1,* Jing Li,2,* Xu Lu,3,* Linsen Ye,1 Haoyuan Yu,1 Lele Zhang,1 Mingbin Deng,1 Shuguang Zhu,1 Wei Liu,3 Guoying Wang,4 Yang Yang1
1Department of Hepatic Surgery and Liver Transplant Program, The Third Affiliated Hospital of Sun Yat-Sen University, Guangzhou, People’s Republic of China; 2Department of Infectious Diseases and Hepatology Unit, Nanfang Hospital, Southern Medical University, Guangzhou, People’s Republic of China; 3Guangdong Key Laboratory of Liver Disease Research, The Third Affiliated Hospital of Sun Yat-Sen University, Guangzhou, People’s Republic of China; 4Department of Hepatobiliary Surgery, The First Affiliated Hospital of Guangzhou Medical University, Guangzhou, People’s Republic of China
*These authors contributed equally to this work
Correspondence: Guoying Wang
Department of Hepatobiliary Surgery, The First Affiliated Hospital of Guangzhou Medical University, 151 Yanjiangxi Road, Guangzhou, 510120, People’s Republic of China
Tel +86-020-83062703
Fax +86-020-83395651
Email [email protected]
Yang Yang
Department of Hepatic Surgery and Liver Transplant Program, The Third Affiliated Hospital of Sun Yat-Sen University, 600 Tianhe Road, Guangzhou, 510630, People’s Republic of China
Tel +86-020-85252177
Fax +86-020-85252276
Email [email protected]
Purpose: Ferroptosis, as a novel regulated cell death form, has a close interaction with metabolism, which is largely unknown in cancer. In the present study, we conducted a comprehensive analysis of ferroptosis-related metabolic genes to delineate the metabolic signatures induced by ferroptosis and evaluate its prognostic significance in hepatocellular carcinoma (HCC).
Methods: The ferroptosis-related metabolic genes (Fer-MRGs) were identified by correlation analyses with transcriptome data from The Cancer Genome Atlas and Gene Expression Omnibus. Then, univariate and the least absolute shrinkage and selection operator Cox regression analysis was used to establish a novel risk score model. Univariate and multivariate COX analyses were used to identify independent prognostic factors for overall survival (OS) of HCC, and a nomogram was developed. The Fer-MRGs’ expression was further evaluated by quantitative real-time polymerase chain reaction in HCC.
Results: A total of 77 metabolic genes were identified as Fer-MRGs, and 26 were found with prognostic values for OS of HCC. Then, a novel nine-gene (AKR1C3, ATIC, G6PD, GMPS, GNPDA1, IMPDH1, PRIM1, RRM2, and TXNRD1) risk score model was constructed. Survival analyses showed worse OS in high-risk patients both in the training and validation groups. The model was also identified as an independent prognostic factor for HCC, and a prognostic nomogram for OS was further established with superior discriminative capacity and prediction accuracy. Notably, close correlations were also identified between the risk score and the expression of immune checkpoint genes, immune subtypes of tumor, and susceptibility of HCC to chemotherapeutic agents. Finally, elevated expression of eight Fer-MRGs (except for IMPDH1) was further verified in 16 pairs of HCC tumor and adjacent tissues.
Conclusion: These results indicated the intense interaction between ferroptosis and metabolism, the significant role of ferroptosis-related MRGs, and the great potential of the novel risk score model for prognosis prediction in HCC.
Keywords: hepatocellular carcinoma, ferroptosis, metabolism, gene signature, prognosis
Introduction
Due to the high morbidity and mortality, hepatocellular carcinoma (HCC) remains one of the major types of deadly malignancies worldwide.1,2 The high proportion of advanced stage, the complicated background of liver disease, and high recurrence rate are the important factors affecting the treatment and prognosis of HCC patients. Although a variety of new therapies for advanced HCC have been exploited in recent years, especially targeted therapies, which have increased the overall survival of HCC patients, the proportion of effective population, the availability of effective drugs, and the duration of efficacy still limit the clinical benefits.3 The emerging of immunotherapy, including immune checkpoint inhibitors, holds new promise for the treatment of HCC, but similar issues exist as well.4,5 Therefore, it is still urgent to comprehensively investigate the mechanism of HCC development and progression, which may provide new perspectives to break the dilemma of HCC treatment.6
Ferroptosis is a newly identified form of regulated cell death and is mainly driven by iron-mediated oxidative damage, excessive lipid peroxidation, and cell membrane damage.7,8 Increasing evidence has demonstrated the significant role of ferroptosis inhibition in the development and therapeutic response of various cancers. The transporter-dependent (extrinsic) and enzyme-regulated (intrinsic) pathways are the two main forms that induce ferroptosis.7,9 The extrinsic regulation can be induced by the suppression of membrane transporters (such as system xc– cystine/glutamate antiporter) or by the activation of iron transporters (such as serotransferrin and lactotransferrin), whereas the intrinsic pathway can be induced by inhibition of the intracellular antioxidant enzymes (such as glutathione peroxidase 4/GPX4). Iron accumulation and lipid peroxidation are the hallmarks of ferroptosis initiation, and the regulation between oxidative damage and antioxidant defense is the key molecular mechanism of ferroptosis. Recently, several GPX4-independent pathways have also been identified for ferroptosis regulation. These findings provide potential targets and strategies for anticancer treatment by targeting ferroptosis.
Noticeably, increasing evidence points to the comprehensive interactions between ferroptosis and metabolic pathways, including: (1) Amino acid and glutathione metabolism: Limitation of cysteine reduces the biosynthesis of glutathione (GSH) and causes the depletion of GSH, which directly inhibits the activity and stability of GPX4 and thereby induces the ferroptosis; (2) Lipid metabolism: Lipid peroxidation of polyunsaturated fatty acids (PUFAs) is an important process for the execution of ferroptosis, and the abundance and localization of PUFAs also correlate with the extent of ferroptosis; (3) Iron metabolism: The transport, storage, and transition of the intracellular iron impact the accumulation of lipid peroxides and subsequent ferroptosis; (4) Other metabolic pathways such as the mevalonate, NADPH, and selenium metabolism. Extensive changes in metabolic pathways involved in the regulation of ferroptosis indicate the intimate crosstalk between them. At present, ferroptosis is considered a combined result of the disturbance of multiple metabolic pathways and the dysfunction of ferroptosis surveillance systems.10 Therefore, it is of great significance to investigate the mechanisms and implications of ferroptosis from the perspective of metabolic regulation.
In the present study, we comprehensively investigated the correlations and intersections between ferroptosis regulators and metabolism-related genes (MRGs) in HCC. On this basis, the critical MRGs with prognostic significance were identified to develop a novel risk score model. Then, prognostic analyses were conducted to evaluate its prediction capacity for overall survival (OS) of HCC both in the training and the validation cohorts, and the prognostic nomograms were also established, respectively. Finally, we further assessed the correlation between the risk model and the immune checkpoint expression, immune subtype, and drug susceptibility. Hence, this study may provide some new perspectives on the interaction between ferroptosis and metabolism, and a novel prognostic model for HCC.
Materials and Methods
Data Collection
The transcriptome data of 374 HCC tumor samples and 50 normal controls were obtained from The Cancer Genome Atlas (TCGA) database (TCGA-LIHC, https://portal.gdc.cancer.gov/, March 4, 2021). At the same time, the clinical and pathological information (age, gender, tumor grade, stage, follow-up time, and survival status) was also collected. The analysis based on the gene expression profile was conducted with all samples (n = 424), while the clinical correlation and prognostic analyses were conducted only in the tumor samples from unique HCC patients. Duplicated data from the same patient was combined with average. Finally, 370 HCC patients with valid clinicopathological information were identified.
Besides, the gene expression microarray data of 225 HCC tumors and 220 adjacent/normal controls were downloaded from the Gene Expression Omnibus (GEO, GSE14520, https://www.ncbi.nlm.nih.gov/geo/, March 4, 2021) with the platform data of GPL3921. The clinical characteristics (age, gender, tumor size, tumor number, stage, follow-up time, and survival status) were also collected. Excluding patients with incomplete clinical information, a total of 221 patients were enrolled in the clinical correlation and prognostic analyses. The clinical characteristics of HCC patients in the TCGA and GSE14520 cohorts are shown in Supplementary Table 1.
The TCGA and GEO are public databases, and all cases involved in the database have been consented to use for analyses and obtained ethical approval, which are free to be downloaded and analyzed by individual researchers. Our study was based on the open-source data, and strictly followed the publication guidelines and access policies of the database, so the study protocol was exempted from additional ethical approval.
Besides, tumor and adjacent tissue samples from 16 HCC patients undergoing surgical resection from January 2019 to December 2019 in the Third Affiliated Hospital of Sun Yat-Sen University were collected for the validation of gene expression. Written informed consent was obtained from all patients. The study was also approved by the Ethics Committee of the Third Affiliated Hospital of Sun Yat-Sen University.
The study procedures were briefly shown in Figure 1.
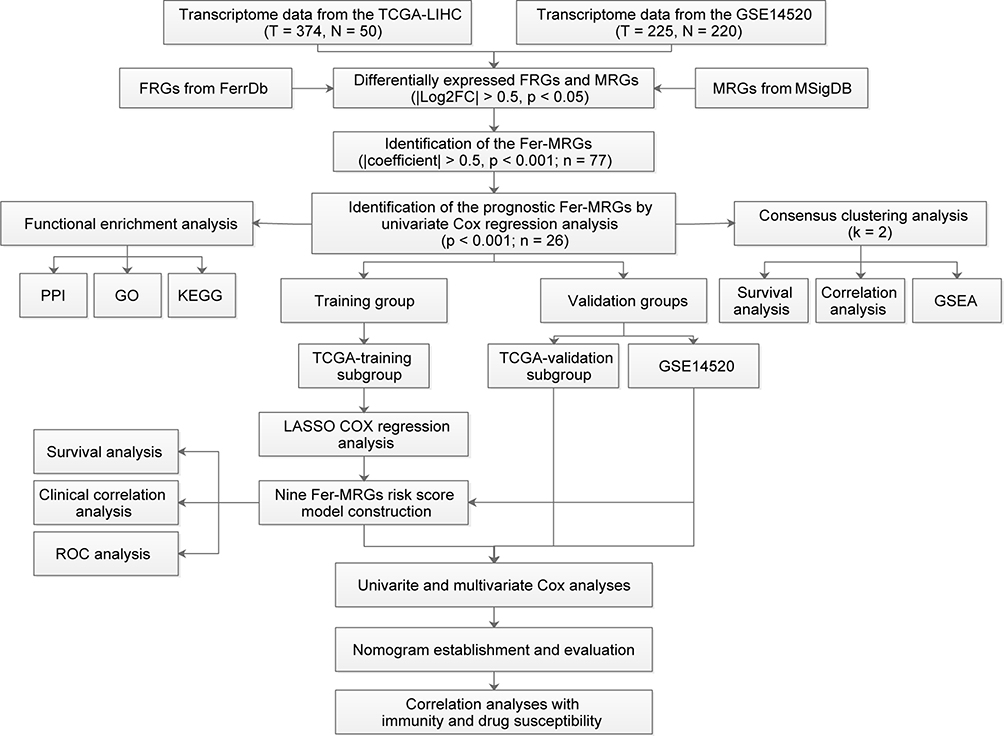 |
Figure 1 Data processing and analysis procedures of the study. Abbreviations: TCGA, the Cancer Genome Atlas; GO, Gene Ontology; KEGG, Kyoto Encyclopedia of Genes and Genomes; PPI, protein–protein interaction; FRGs, ferroptosis-related genes; MRGs, metabolism-related genes; FC, fold change; LASSO, least absolute shrinkage and selection operator; ROC, receiver operating characteristic; GSEA, Gene Set Enrichment Analysis. |
Identification of Differentially Expressed Ferroptosis- and Metabolism-Related Genes in HCC
At first, the ferroptosis-related genes (FRGs) were obtained from the FerrDb (http://www.zhounan.org/ferrdb/) with 108 driver genes and 69 suppressor genes. After the non-coding RNA were removed, a total of 167 FRGs were obtained (shown in Supplementary Table 2). The MRGs were obtained from the metabolism-related pathway enrichment gene sets in the “c2.cp.kegg.v7.2.symbols.gmt”, which was downloaded from the Molecular Signatures Database (MSigDB) of Gene Set Enrichment Analysis (GSEA, http://www.gsea-msigdb.org/gsea/downloads.jsp, March 4, 2021).
Then, the expression of FRGs and MRGs in the TCGA and GSE14520 were extracted respectively. Differentially expressed FRGs and MRGs between HCC tumors and normal/adjacent controls were identified by Wilcoxon test with R package “limma” with the criteria of |log2fold-change (log2FC)| > 0.5 and false discovery rate (FDR) <0.05. Then, the overlapped differentially expressed FRGs and MRGs both in the TCGA and GSE14520 were screened out.
Identification of the Prognostic MRGs Correlated with Ferroptosis
First, the correlations between FRGs and MRGs were evaluated by Pearson’s correlation analyses in the TCGA data set, and the MRGs correlated with ferroptosis (Fer-MRGs) were screened with the criteria of |correlation coefficients| > 0.5 and p < 0.001. Then, univariate COX analyses using the R package “survival” were conducted to identify the Fer-MRGs with significant prognostic values for OS of HCC. The selection criteria was set with a p-value < 0.001.
Interaction Network and Functional Enrichment Analyses
The protein-protein interaction (PPI) network of prognostic Fer-MRGs was analyzed at the STRING website (https://www.string-db.org/). Then, the network was further analyzed in the Cytoscape software (Version 3.8.0, https://cytoscape.org/) with “cytoHubba” for identification of key genes. Gene Ontology (GO) and Kyoto Encyclopedia of Genes and Genomes (KEGG) pathway enrichment analyses were performed using the R package “clusterProfiler”.
Consensus Clustering Analysis
Based on the consensus expression of prognostic Fer-MRGs in tumors, all cases in the TCGA cohort were clustered into two groups using the R package “ConsensusClusterPlus”. Then, the Kaplan–Meier survival analysis was conducted using the R package “survival” to compare the differential OS between clusters. The clinical characteristics were also compared by the Chi-square test.
Gene Set Enrichment Analysis
The gene set enrichment analysis (GSEA) was conducted to evaluate the enriched pathways within different clusters, which was conducted within the GSEA software (http://www.gsea-msigdb.org/gsea/index.jsp) with the KEGG gene set (C2.cp.kegg.v7.2.symbols.gmt). An FDR < 0.25 and adjusted p < 0.05 were considered statistically significant.
Construction of the Risk Score Model Based on the Prognostic Fer-MRGs
All patients in the TCGA cohort were randomly divided into two groups (186 cases in the training group, and 184 cases in the internal validation group). Based on the results of univariate Cox analyses, the least absolute shrinkage and selection operator (LASSO) Cox regression was utilized to eliminate the highly correlated Fer-MRGs using the R package “glment” in the training group. Ultimately, nine Fer-MRGs were identified to construct the novel risk score model. The risk score was calculated by the following formula:
The risk score was also calculated for the patients in the internal validation group and the external validation cohort (GSE14520), and patients were divided into low- and high-risk groups according to the median risk scores. Thereafter, the survival analyses using the R package “survival” for OS were conducted in both training, internal, and validation groups. The 1-, 3- and 5-year receiver operating characteristic (ROC) curves were adopted to evaluate the prognostic accuracy of the model using R package “timeROC”. The Chi-square test was used to compare the difference of clinical factors between different risk groups. Besides, the survival analyses were further evaluated in different subgroups divided by the clinical factors.
Prognostic Nomogram Construction and Evaluation
The univariate and multivariate Cox regression analyses were used to evaluate the independent prognostic significance of this risk score model in the training and validation groups. And the nomogram for OS prediction of HCC was established using the R package “RMS”. The prediction performance was assessed by the concordance index (C index), calibration curves, and time-dependent ROCs.
Correlations Between Risk Score Model and Immune Checkpoint Genes and Immune Subtypes
We compared the expression of immune checkpoint genes (programmed cell death 1, PD-1; cytotoxic T lymphocyte-associated antigen-4, CTLA-4; lymphocyte-activation gene 3, LAG3; T-cell immunoglobulin and mucin domain 3, TIM3; T cell immunoreceptor with immunoglobulin and ITIM domain, TIGIT; and B7 homolog 3, B7-H3) in different risk groups by the Wilcoxon test. Besides, we also obtained the profile of immune subtypes for HCC patients in the TGGA database from the UCSC-Xena (https://xenabrowser.net/datapages/, version: 2018–04-03).11 The risk scores were also compared between different immune subtypes by the Wilcoxon test.
Correlations Between Risk Score Model and Drug Susceptibility
To evaluate the potential significance of the risk score model in the treatment guidance for HCC, we conducted the drug susceptibility analyses with the R package “pRRophetic” to compare the IC50s of regular chemotherapeutic agents and several targeted drugs between high- and low-risk groups. Furthermore, the response to immune checkpoint inhibitors (anti-CTLA4 and anti-PD-1 antibodies) between different risk groups was analyzed using immunophenoscore (IPS) from The Cancer Immunome Atlas (TCIA, https://tcia.at/, June 29, 2021).12
Cell Culture and Ferroptosis Introduction
Human hepatoma cell lines (Huh7 and HepG2) were obtained from the Shanghai Cell Bank of the Chinese Academy of Sciences. The cells were cultured in Dulbecco’s modified Eagle’s medium (DMEM; Gibco, Carlsbad, CA) supplemented with 1% penicillin/streptomycin (Gibco), and 10% fetal bovine serum (FBS; PAN, Germany) in a humidified incubator at 37°C containing 5% CO2. Hepatoma cells were seeded into six-well plate, and treated with ferroptosis inducer (Erastin, 10μM; RSL3, 1μM, Selleck Chemicals, Houston, TX) for 24h and harvested for RNA extraction. The experiment was repeated independently three times in triplicates.
RNA Extraction and Quantitative Real-Time Polymerase Chain Reaction (qRT-PCR)
Total RNA from hepatoma cells and tissues was obtained using TRIZOL (Invitrogen, USA). Reverse transcriptional reaction was conducted using the Transcriptor First Strand cDNA Synthesis Kit (Roche, Switzerland) with 1.5 μg of total RNA to get the complementary DNA. Then, qRT-PCR was conducted using the LightCycler 480 SYBR Green I Master (Roche) on the LightCycler 480 Fluorescence Quantitative System (Roche). The relative gene expression levels were normalized against ACTB. All of the primers were synthesized by Sangon (Sangon, China), and the primer sequences are listed in Supplementary Table 3.
Statistical Analysis
All statistical analyses were conducted by using R (https://www.r-project.org/, version 4.0.3). A p-value < 0.05 (two-sided) was considered statistically significant.
Results
Identification of the Differentially Expressed FRGs and MRGs in HCC
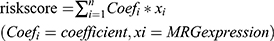
Of the 167 FRGs obtained from FerrDb, 135 FRGs were found both in the TCGA and GSE14520. As for the MRGs from the metabolic pathways, a total of 723 MRGs were found both in the TCGA and GSE14520. Then, the expression levels of these genes were compared between HCC tumors and normal/adjacent controls. A total of 71 and 41 FRGs, and 295 and 284 MRGs, were found statistically different in the TCGA and GSE14520, respectively. Ultimately, only 34 and 189 differentially expressed FRGs and MRGs were overlapped both in the TCGA and GSE14520 (Figure 2A), which were utilized for the subsequent analyses.
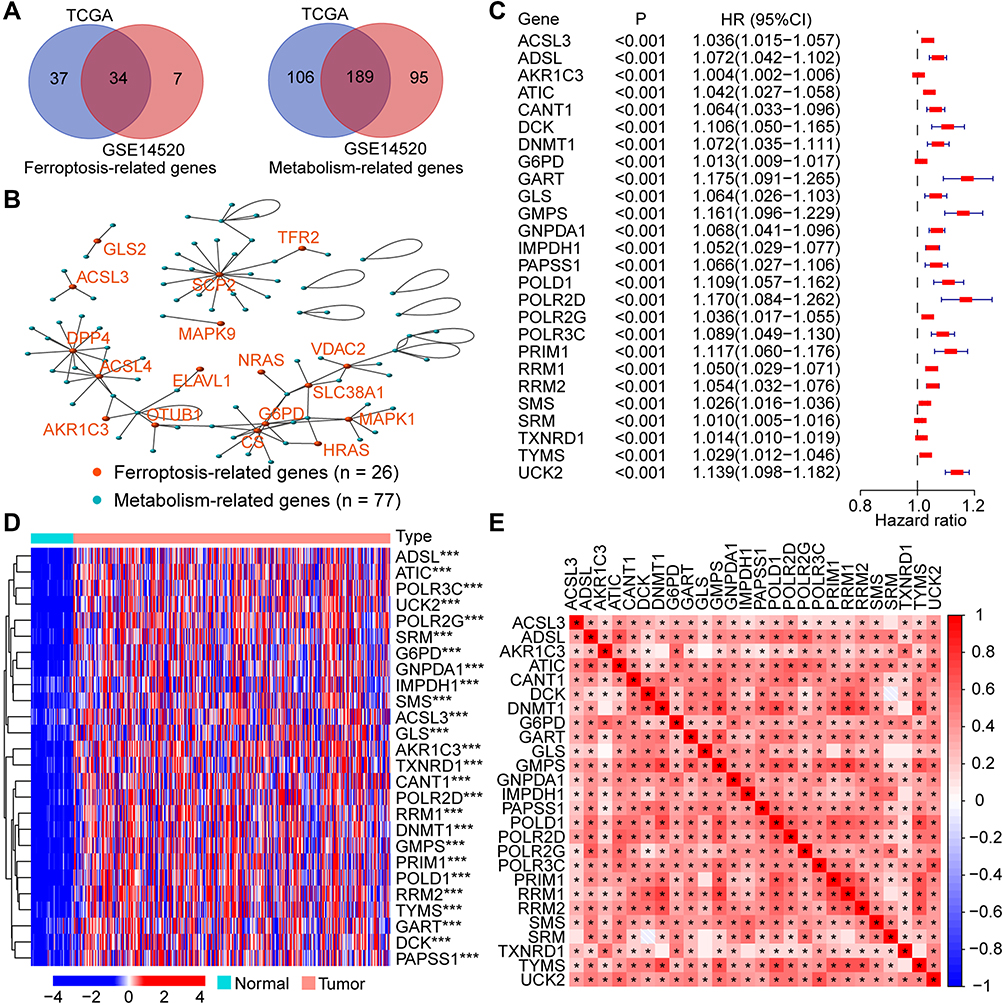 |
Figure 2 Identification of the prognostic Fer-MRGs in HCC. (A) The overlapped differentially expressed FRGs and MRGs in the TCGA and GSE14520 datasets; (B) The correlation network between FRGs and MRGs in HCC; (C) Prognostic Fer-MRGs identified via univariate Cox analysis (all p < 0.001); (D) Expression profile of the prognostic Fer-MRGs in the TCGA dataset; (E) heatmap of the correlation between these prognostic Fer-MRGs. *p < 0.05, ***p < 0.001. Abbreviations: HCC, hepatocellular carcinoma; FRGs, ferroptosis-related genes; MRGs, metabolism-related genes; Fer-MRGs, MRGs associated with ferroptosis; TCGA, the Cancer Genome Atlas. |
Identification of the Fer-MRGs in HCC
To identify the Fer-MRGs, the correlation analyses between differentially expressed FRGs and MRGs were conducted with the gene expression levels in the TCGA. Then, a total of 77 MRGs were found with significant correlations with 26 FRGs in HCC (Figure 2B, details in Supplementary Table 4). Notably, nine genes (ACSL3, ACSL4, AKR1C3, CS, ENPP2, FADS2, G6PD, GLS2, and GOT1) were found both in the FRGs and MRGs with significant correlations. These findings indicated an intimate interaction between ferroptosis and metabolism.
Identification of the Prognostic Fer-MRGs in HCC
Of the 77 MRGs with significant correlations to ferroptosis, 26 MRGs were found with prognostic significance by the univariate Cox analysis (all p < 0.001, Figure 2C). The expression profile of these prognostic Fer-MRGs in the TCGA was exhibited with a heatmap, which showed significant upregulation of all 26 Fer-MRGs in HCC tumors (all p < 0.001, Figure 2D). The expression correlations of these genes were further illustrated with another heatmap, which showed significant correlations among most Fer-MRGs in HCC (p < 0.05, Figure 2E). These findings indicated the important role of the disturbance of MRGs correlated with ferroptosis in HCC.
Then, the potential interactions among these Fer-MRGs were analyzed by the PPI network, and results revealed significant interactions among most of the Fer-MRGs (Figure 3A). The TYMS, RRM1, ADSL, CANT1, CART, POLD1, GMPS, RRM2, TXNRD1, and ATIC were identified as the top 10 core genes in the network (Figure 3B and C). The functional enrichments were conducted with the GO and KEGG analyses. Results indicated that the Fer-MRGs were mainly enriched in the nucleotide biosynthetic and metabolic process, and the regulation of nucleotide transferase and RNA polymerase activity (Figure 3D). KEGG pathway analysis showed that the purine, pyrimidine, glutathione, cysteine, and methionine metabolism were mainly enriched (Figure 3E). These findings indicated the potential molecular mechanisms involved in the regulation of HCC phenotypes by Fer-MRGs.
 |
Figure 3 The interaction and functional analyses of prognostic Fer-MRGs in HCC. (A) PPI network of the prognostic Fer-MRGs; (B and C) Top ten hub genes and the node count of first fifteen Fer-MRGs in the PPI network; (D and E) GO and KEGG analysis for the prognostic Fer-MRGs. Abbreviations: HCC, hepatocellular carcinoma; Fer-MRGs, MRGs associated with ferroptosis; PPI, protein–protein interaction; GO, Gene Ontology; BP, biological process; CC, cellular component; MF, molecular function; KEGG, Kyoto Encyclopedia of Genes and Genomes. |
Consensus Clustering of HCC Patients Based on the Prognostic Fer-MRGs
Consensus clustering analysis was used to evaluate the significance of Fer-MRGs in the development of HCC by dividing the HCC tumors into different clusters. The cumulative distribution function (CDF) of different clustering methods from k = 2 to 9 and the relative changes of the area under CDF curves are shown in Figure 4A and B. The corresponding sample distribution is shown in Figure 4C. Considering the increase in CDF and consistent expression of Fer-MRGs in HCC, two clusters were determined with 60 and 310 cases in cluster 1 and 2, respectively (Figure 4D).
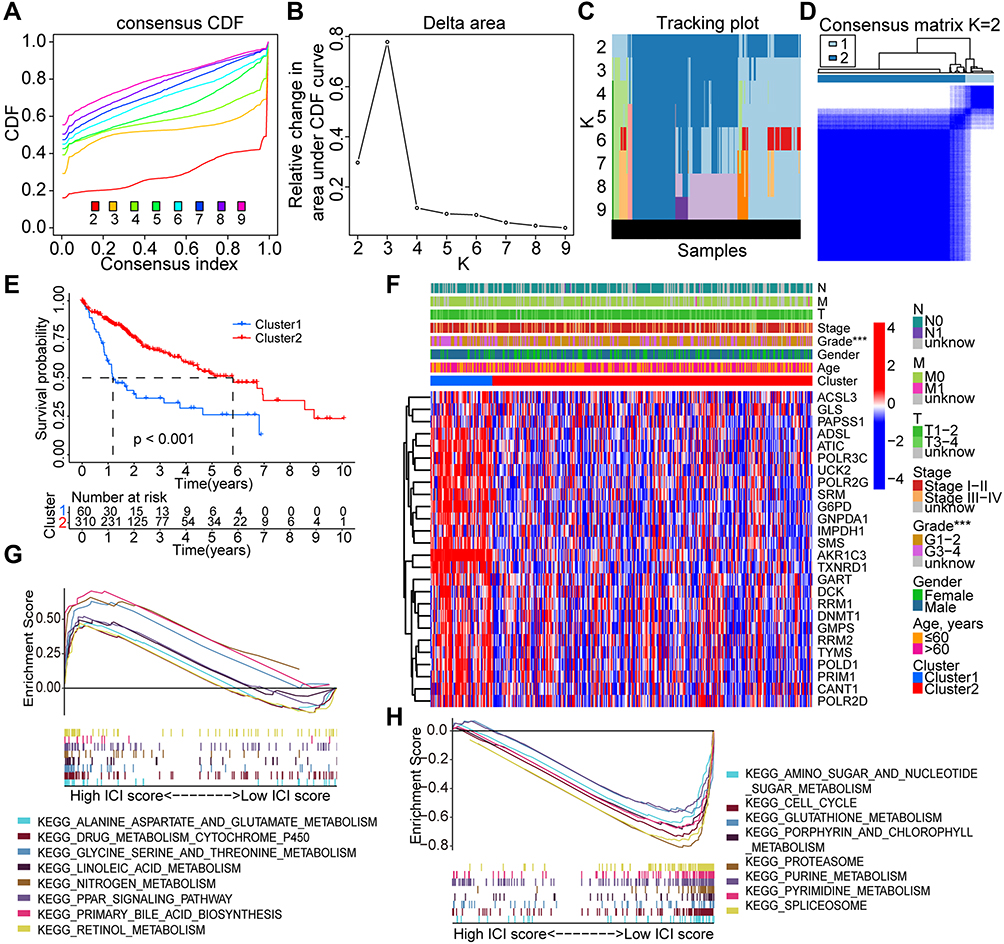 |
Figure 4 Consensus clustering analysis based on the prognostic Fer-MRGs in HCC. (A–C) The consensus CDF, relative changes in area under the CDF curves, and tracking plots showed with the index from 2 to 9; (D) The distribution of different clusters with the index k = 2; (E) Survival curves of overall survival in different clusters; (F) Heatmap with visualization of the expression of Fer-MRGs in the TCGA dataset and the correlation with other clinical factors; (G and H) Enriched pathways by GSEA in cluster 2 and cluster 1. ***p < 0.001. Abbreviations: HCC, hepatocellular carcinoma; Fer-MRGs, MRGs associated with ferroptosis; CDF, cumulative distribution function; TCGA, the Cancer Genome Atlas. |
The survival analysis showed that HCC patients in cluster 1 had worse OS than those in cluster 2 (Figure 4E). The median survival time of patients in cluster 1 was less than two years, whereas almost six years in cluster 2. Besides, a higher expression level of most Fer-MRGs in cluster 1 was observed (Figure 4F), which indicated the significant metabolic alternation in cluster 1. A higher proportion of pathological grade 3–4 was also shown in cluster 1, which indicated that the cluster strategy based on the expression of Fer-MRGs could reflect the progression and prognosis of HCC.
The GSEA analysis further demonstrated the differential pathway enrichment in the two clusters. The results showed that pathways with alanine aspartate and glutamate metabolism, drug metabolism with cytochrome p450, glycine, serine, and threonine metabolism, nitrogen metabolism, and linoleic acid and retinol metabolism enriched in cluster 2 (Figure 4G), while the pathways with purine metabolism, pyrimidine metabolism, glutathione metabolism, amino sugar and nucleotide sugar metabolism, and cell cycle enriched in cluster 1 (Figure 4H).
Development and Validation of the Novel Prognostic Risk Score Model Based on Fer-MRGs
Based on the 26 prognostic Fer-MRGs from univariate Cox analyses, we identified nine critical Fer-MRGs (AKR1C3, ATIC, G6PD, GMPS, GNPDA1, IMPDH1, PRIM1, RRM2, and TXNRD1) by the LASSO Cox regression analysis in the TCGA training group (Figure 5A and B). Coefficients of these Fer-MRGs are shown in Figure 5C, which showed that PRIM1 had the highest coefficient with 0.03480. When compared with the top 10 core genes in Fer-MRGs, four genes (ATIC, GMPS, RRM2, and TXNRD1) were listed.
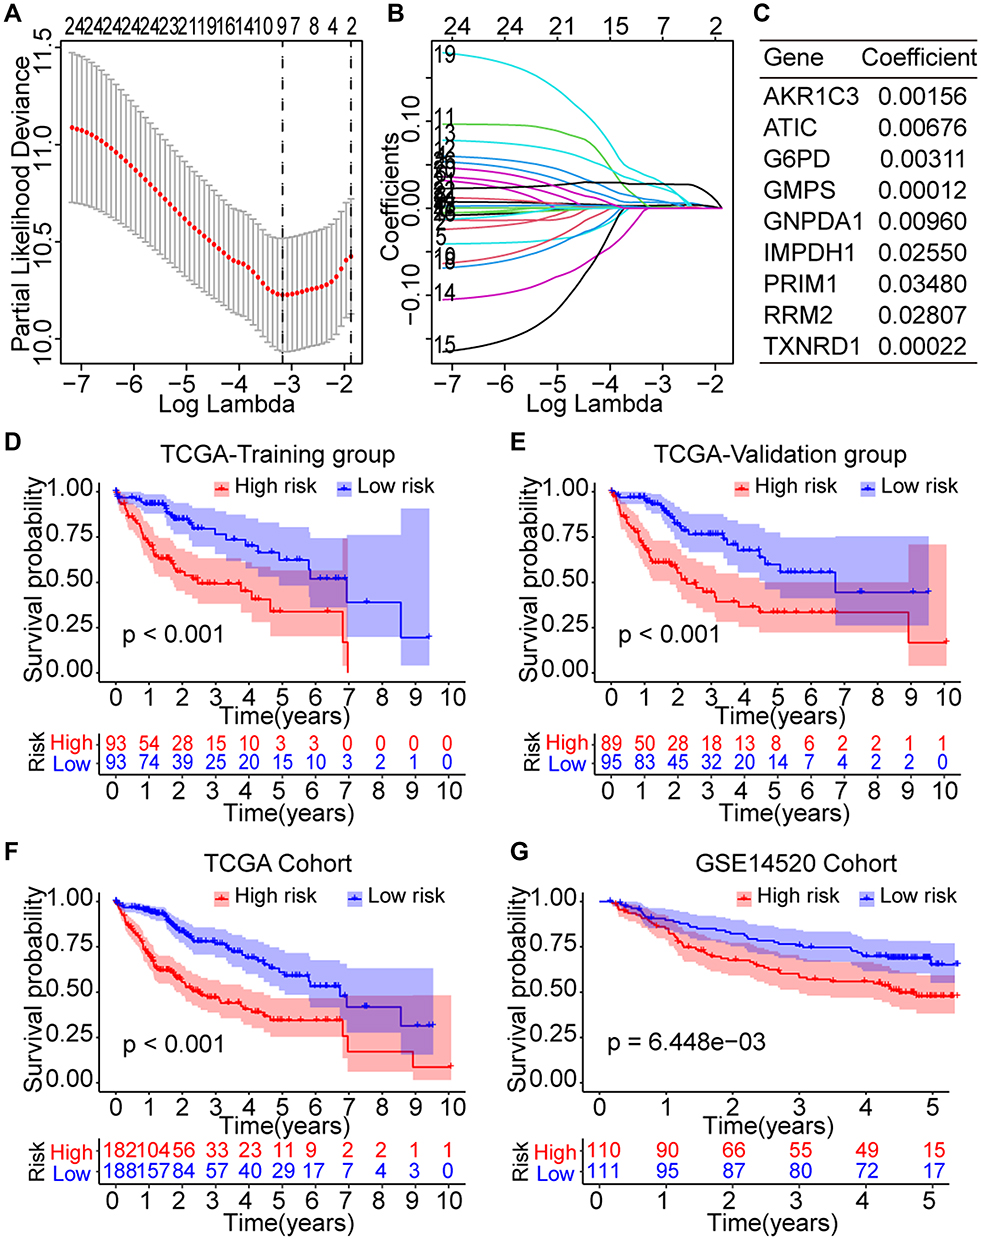 |
Figure 5 Prognostic significance of the novel risk score model based on the Fer-MRGs in the training and validation groups. (A and B) Screening of the critical Fer-MRGs by LASSO Cox regression; (C) Coefficients of the nine critical Fer-MRGs in the model; (D and E) Survival curves of high- and low-risk patients in the TCGA training and validation subgroups; (F and G) Survival curves of high- and low-risk patients in the overall TCGA and GSE14520 cohorts. Abbreviations: HCC, hepatocellular carcinoma; Fer-MRGs, MRGs associated with ferroptosis; LASSO, least absolute shrinkage and selection operator; TCGA, the Cancer Genome Atlas. |
Then, the risk score model was developed with the expression and coefficients of these nine Fer-MRGs, and each patient in the TCGA and GSE1520 cohorts was given a risk score for risk evaluation of OS. The median risk scores were used to divide the patients into high- and low-risk subgroups in the TCGA training, internal validation, and external validation groups. Survival analyses showed that the Oss of high-risk subgroups in the TCGA training (p < 0.001, Figure 5D), TCGA validation (p < 0.001, Figure 5E), overall TCGA (p < 0.001, Figure 5F), and GSE14520 (p = 6.448e-3, Figure 5G) groups were significantly worse than the Oss of low-risk subgroups.
The time-dependent ROCs were further plotted. In the TCGA training group, the area under the curve (AUC) for 1-, 3-, and 5-year OS was 0.717, 0.702, and 0.665, respectively (Figure 6A). In the TCGA validation group, the AUC for 1-, 3-, and 5-year OS was 0.808, 0.639, and 0.605, respectively (Figure 6B). In the overall TCGA cohort, the AUC for 1-, 3-, and 5-year OS was 0.765, 0.684, and 0.642, respectively (Figure 6C). In the GSE14520 cohort, the AUC for 1-, 3-, and 5-year OS was 0.581, 0.632, and 0.615, respectively (Figure 6D). Besides, we also compared the proportion of death event occurrence in different risk subgroups, and found that 45% of high-risk patients died during the follow-up period, while only 24% of low-risk patients died in the TCGA training group (Figure 6E). In the TCGA validation group, 48% of patients died in the high-risk subgroup, while only 24% died in the low-risk subgroup (Figure 6F). In the overall TCGA cohort, 47% of patients died in the high-risk subgroup, and 24% died in the low-risk subgroup (Figure 6G). In the GSE14520 cohort, 46% of patients died in the high-risk subgroup, and 31% died in the low-risk subgroup (Figure 6H). The risk plots of both the training and validation groups showed clearly the risk score distribution, survival status, and expression of the nine Fer-MRGs of each HCC patient (Figure 6I–L). These findings suggested that the risk score model based on Fer-MRGs had superior capacity in discriminating and predicting the OS of HCC patients.
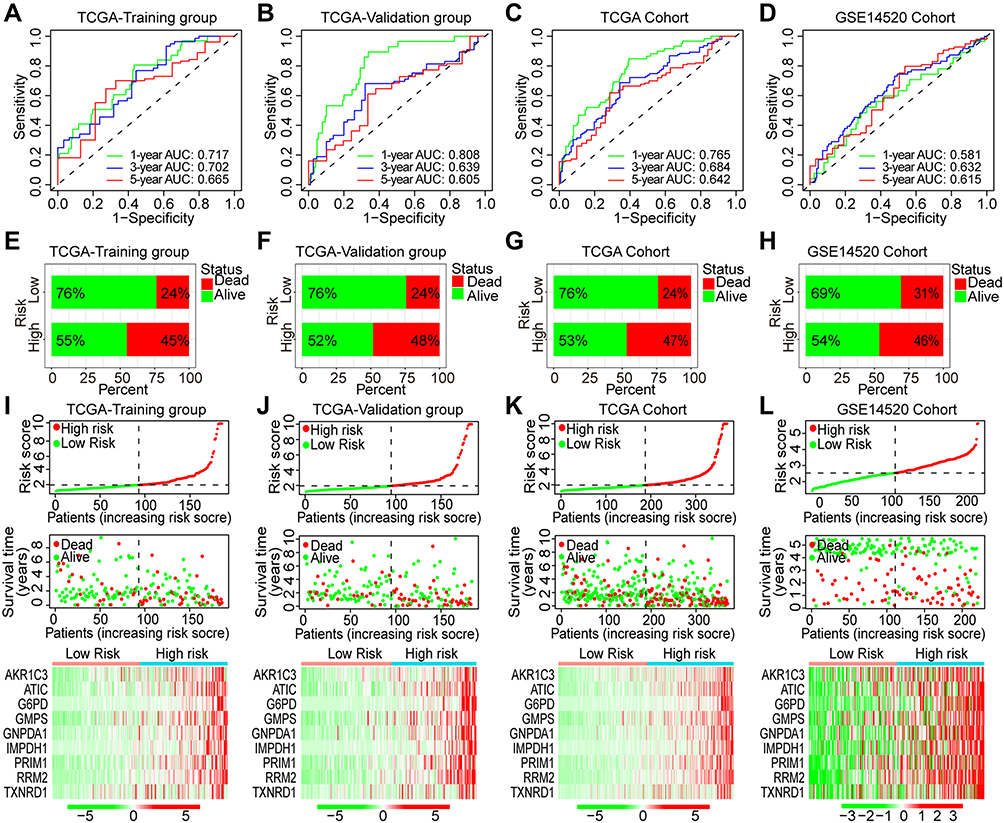 |
Figure 6 ROC curves and risk plots of the risk score model in HCC. (A–D) ROC curves of the risk score model in the TCGA-training group, TCGA-validation group, TCGA-overall cohort, and GSE14520 cohort; (E–H) proportions of death events in high- and low-risk patients of the TCGA-training group, TCGA-validation group, TCGA-overall cohort, and GSE14520 cohort; (I–L) Risk plots of the risk score, survival time, and gene expression in the TCGA-training group, TCGA-validation group, TCGA-overall cohort, and GSE14520 cohort. Abbreviations: HCC, hepatocellular carcinoma; TCGA, the Cancer Genome Atlas; ROC, receiver operating characteristic; AUC, area under the curve. |
Furthermore, we also evaluated the prognostic significance of the risk model in the overall TCGA cohort with different subgroups of clinical factors. Results showed that patients in high-risk group showed with worse OS both with age ≤ 60 years (p < 0.001, Figure 7A) and > 60 years (p < 0.001, Figure 7B), female (p = 0.007, Figure 7C) and male (p < 0.001, Figure 7D), grade 1–2 (p < 0.001, Figure 7E) and 3–4 (p < 0.001, Figure 7F), and stage I–II (p < 0.001, Figure 7G) and III–IV (p = 0.008, Figure 7H). The higher proportions of advanced stage (stage III–IV, p < 0.01), pathological grade (grade 3–4, p < 0.001), and cluster 1 (p < 0.01) were found in the high-risk group (Figure 7I). The mean risk scores of patients in grade 3–4, stage III–IV, and cluster 1 were significantly higher than those in grade 1–2, stage I–II, and cluster 2 (all p < 0.001, Figure 7J–L).
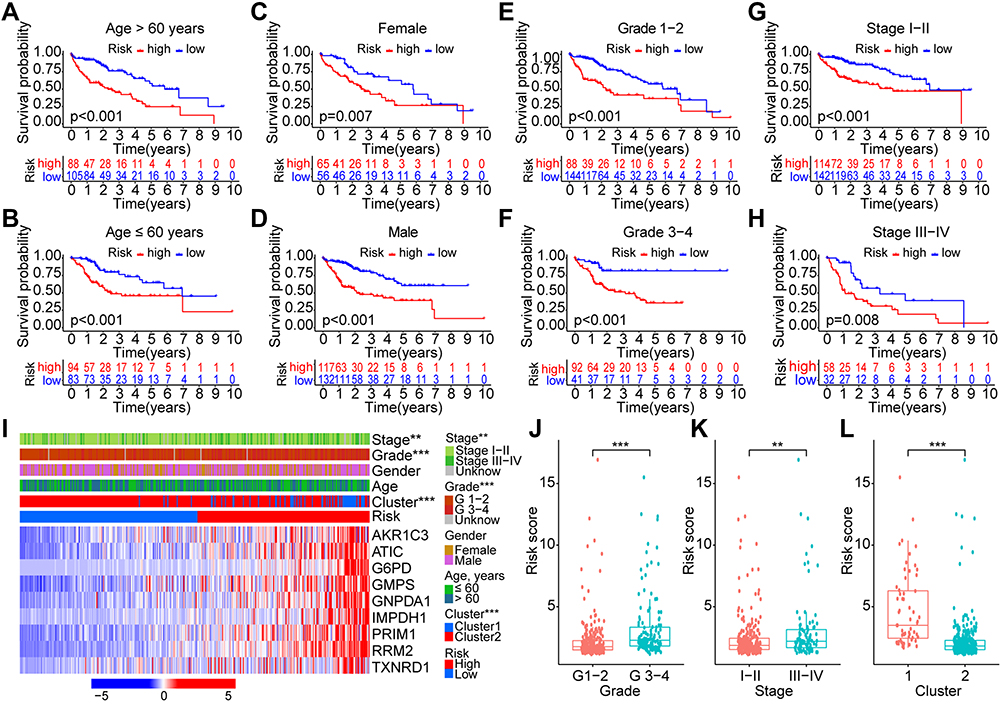 |
Figure 7 Survival and correlation analyses of the risk score model in different subgroups with various clinical factors. (A–H) Survival analyses of the risk score in different subgroups of various clinical factors: age (≤/> 60 years), gender (female/male), pathological grade (G1-2/G3-4), and clinical stage (I–II/III–IV); (I) Heatmap with visualization of the correlations between risk score and other clinical characteristics; (J–L) Risk scores in different subgroups with clinical factors of grade (G1-2/G3-4), stage (I–II/III–IV), and cluster (1/2). **p < 0.01, ***p < 0.001. |
Independent Prognostic Significance of the Novel Risk Score Model Based on Fer-MRGs
Univariate and multivariate Cox analyses were conducted to evaluate the independent prognostic values of the risk score model in the training and validation groups. In the TCGA training group, only the stage and risk score were found significant both in the univariate [stage, p < 0.001, HR = 1.737 (1.293–2.335); risk score, p < 0.001, HR = 1.286 (1.188–1.392)] and multivariate [stage, p = 0.029, HR = 1.438 (1.039–1.991); risk score, p < 0.001, HR = 1.260 (1.151–1.379)] Cox analyses (Figure 8A and B). In the TCGA validation group, clinical stage and risk score were also found with significance both in the univariate [stage, p = 0.002, HR = 1.596 (1.194–2.134); risk score, p = 0.004, HR = 1.125 (1.037–1.219)] and multivariate [stage, p = 0.001, HR = 1.634 (1.209–2.210); risk score, p = 0.008, HR = 1.139 (1.035–1.255)] Cox analyses (Figure 8C and D). In the overall TCGA cohort, clinical stage and risk score were still found significant both in the univariate [stage, p < 0.001, HR = 1.680 (1.369–2.062); risk score, p < 0.001, HR = 1.189 (1.127–1.255)] and multivariate [stage, p < 0.001, HR = 1.589 (1.286–1.964); risk score, p < 0.001, HR = 1.198 (1.126–1.274)] Cox analyses (Figure 8E and F). In the GSE14520 cohort, tumor size [p = 0.002, HR = 2.002 (1.300–3.083)], clinical stage [p < 0.001, HR = 2.294 (1.730–3.042)], and risk score [p = 0.001, HR = 1.627 (1.215–2.179)] were found significant in the univariate Cox analysis, while only clinical stage [p < 0.001, HR = 2.433 (1.677–3.529)] and risk score [p = 0.032, HR = 1.408 (1.029–1.925)] were found significant in the multivariate Cox analysis (Figure 8G and H).
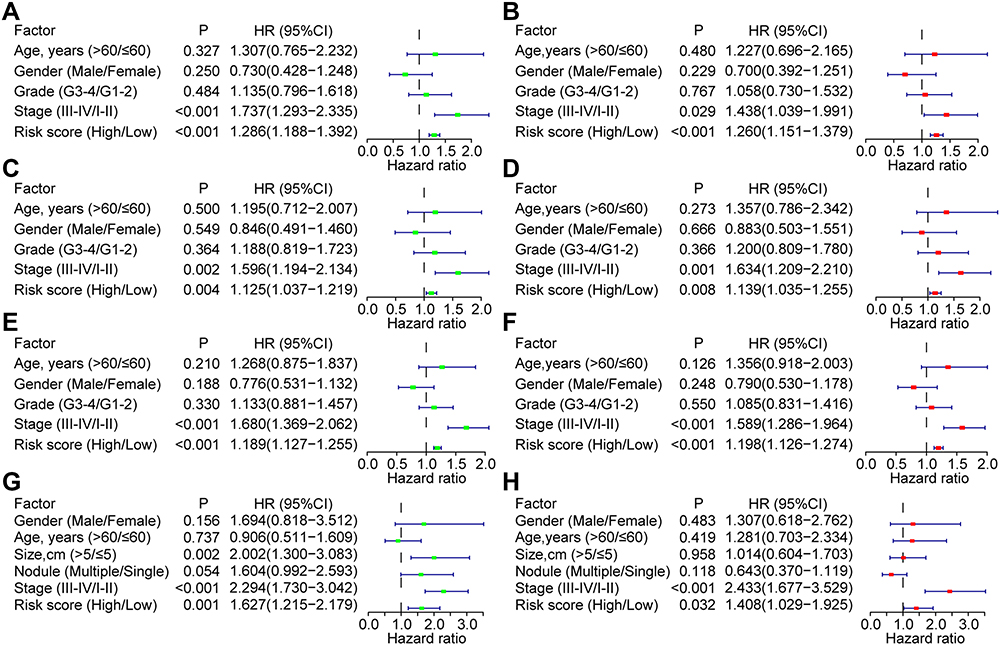 |
Figure 8 Univariate and multivariate Cox analyses for the independent prognostic factors for HCC in the training and validation groups. Univariate and multivariate Cox analyses in the TCGA-training subgroup (A and B), TCGA-validation subgroup (C and D), TCGA-overall cohort (E and F), and GSE14520 cohort (G and H). Abbreviations: HCC, hepatocellular carcinoma; TCGA, the Cancer Genome Atlas. |
Construction and Validation of the Prognostic Nomogram
Based on the results of multivariate Cox analyses for OS in the overall TCGA cohort and GSE14520 cohort, we developed prognostic nomograms for prognosis prediction with the clinical stage and our risk score model (Figure 9A and B), which could provide an easy-to-use method to predict the 1-, 3-, and 5-year OS of HCC. The nomogram exhibited good efficacy in estimating the OS in the TCGA and GSE14520 cohorts with a high C-index of 0.688 and 0.700, respectively. The calibration curves for 1-, 3- and 5-year OS rates were also largely overlapped with the standard lines both for the TCGA and GSE14520 cohorts (Figure 9C and D). The AUCs for predicting 1-, 3- and 5-year OS with nomogram in the TCGA cohort were 0.764, 0.733, and 0.703, respectively (Figure 9E). Patients were divided into high- and low-risk groups according to the median total point calculated by the nomogram, and results showed that worse OS was observed in the high-risk group (P < 0.001, Figure 9F). In the GSE14520 cohort. The AUCs for predicting 1-, 3- and 5-year OS with nomogram were 0.718, 0.756, and 0.795, respectively (Figure 9G), and patients with high risk also had worse OS (P < 0.001, Figure 9H).
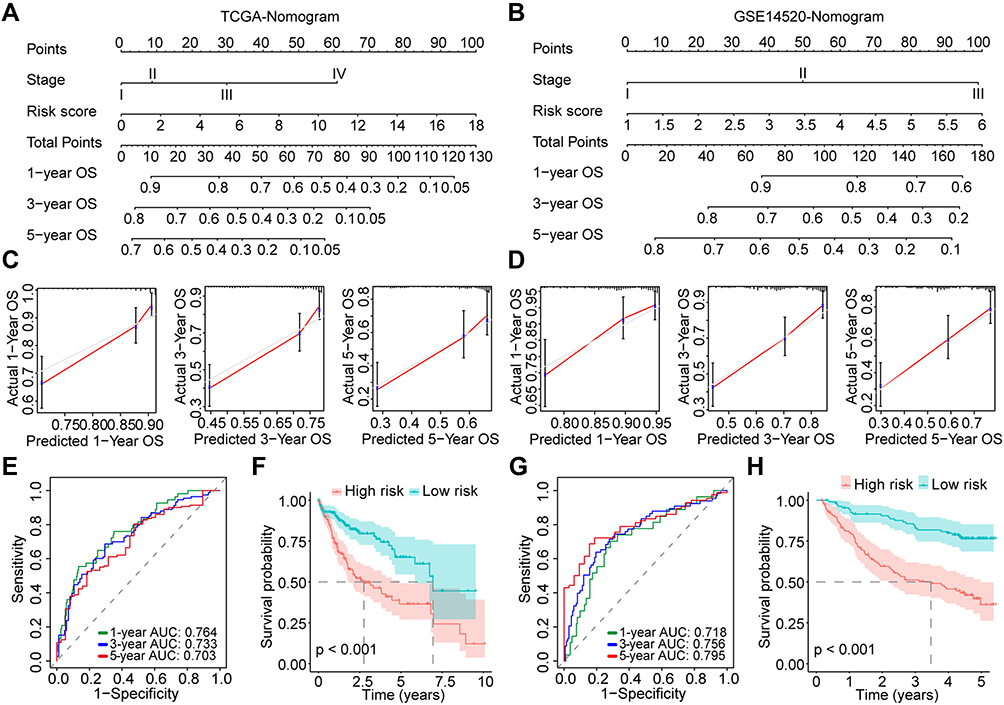 |
Figure 9 Construction and evaluation of the prognostic nomograms for HCC. (A and B) Nomograms for HCC in the TCGA and GSE14520 cohorts; (C and D) Calibration curves for evaluation of the prognostic accuracy of the nomograms for the TCGA and GSE14520 cohorts; (E) Time-dependent ROC curves for the nomogram in the TCGA cohort; (F) Survival curves for HCC patients with different total points derived from the nomogram of the TCGA cohort; (G) Time-dependent ROC curves for the nomogram in the GSE14520 cohort; (H) Survival curves for HCC patients with different total points derived from the nomogram of the GSE14520 cohort. Abbreviations: HCC, hepatocellular carcinoma; TCGA, the Cancer Genome Atlas; OS, overall survival; ROC, receiver operating characteristic; AUC, area under the curve. |
Correlation Analyses of the Risk Score Model with the Expression of Immune Checkpoint Genes, Tumor Immune Subtypes, and Drug Susceptibility
More and more attention has been attracted to the role of ferroptosis and metabolism on immunoregulation. Hence, we would like to investigate the potential impact of changes in Fer-MRGs on the immune microenvironment of HCC. First, we explored the correlations between the risk score based on Fer-MRGs and the expression of immune checkpoint genes. Surprisingly, the higher expression levels of PD-1, CTLA-4, TIM3, LAG3, TIGIT, and B7-H3 were all found in the high-risk groups of the TCGA cohort (all p < 0.001), and positive correlations between these immune checkpoint genes and risk scores were also observed (all R > 0, and all p < 0.001) (Figure 10A). Besides, we also analyzed the expression of these Fer-MRGs in different immune subtypes of HCC (C1: wound healing, C2: IFN-γ dominant, C3: inflammatory, C4: lymphocyte depleted, C5: immunologically quiet, and C6: TGF-β dominant). Due to no C5 subtype observed in the TCGA HCC samples and only one sample classified as C6, we only analyzed the C1-4 subtypes in 369 HCC samples. Results showed that higher expression levels of ATIC, G6PD, GMPS, GNPDA1, IMPDH1, PRIM1, and RRM2 were found in C1 and C2 subtypes, while higher expression of AKR1C3 was found in C2 and C4 subtypes (all p < 0.001). The expression of TXNRD1 showed no significant difference among these subtypes (p > 0.05). Patients in the C1 subtype owned the highest risk score, followed by C2 and C4. Patients in C3 had the lowest risk score (Figure 10B).
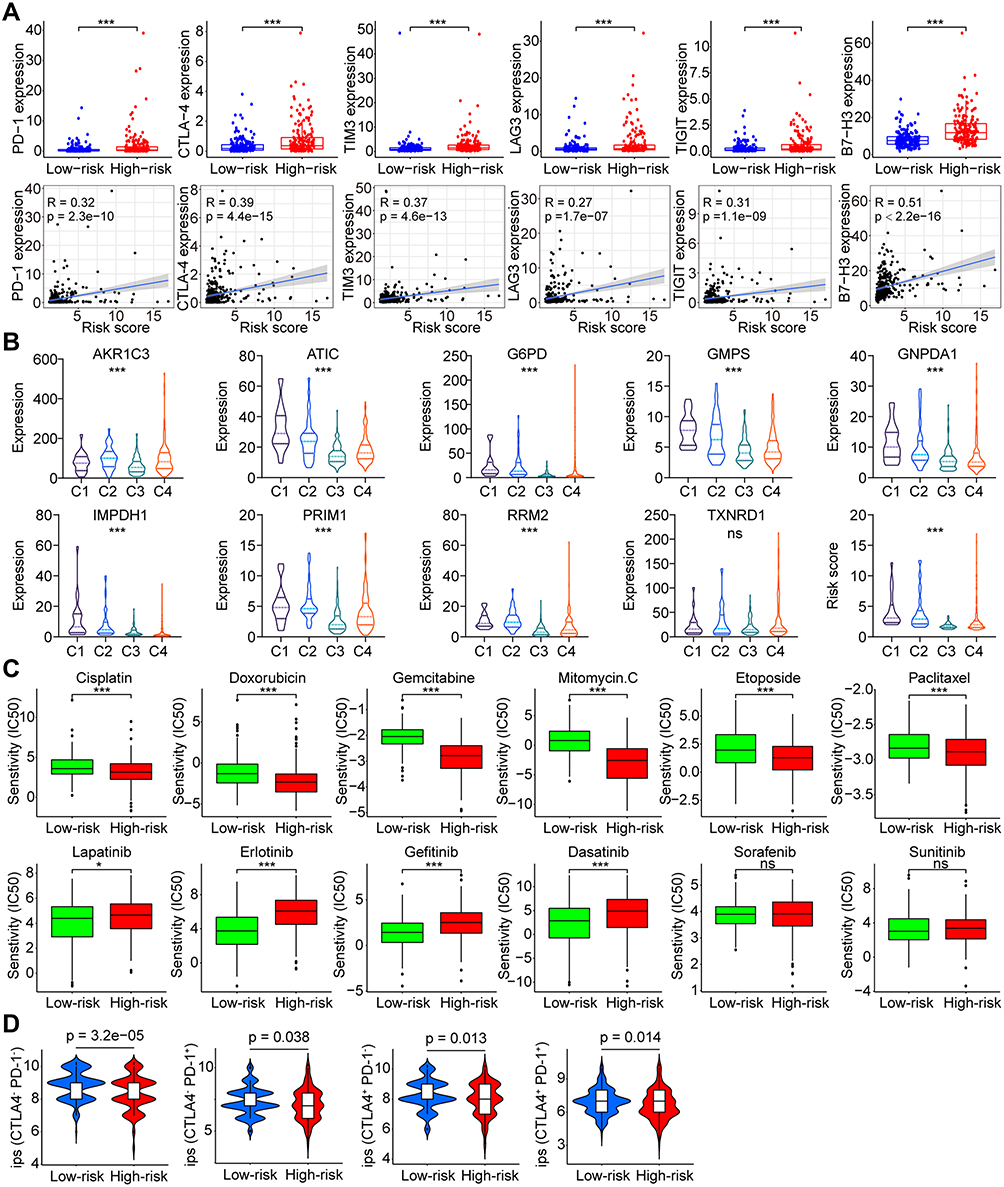 |
Figure 10 Correlations between the risk score and immune checkpoint genes, immune subtypes, and drug susceptibility in HCC. (A) Correlation between the risk score and the expression of PD-1, CTLA-4, TIM3, LAG3, TIGIT, and B7-H3 in the TCGA cohort; (B) Distribution of the risk score and the immune subtypes of HCC; (C) Sensitivity of various chemotherapeutic and targeted agents in high- and low-risk groups of HCC patients. (D) Efficacy analysis of different risk groups for immune checkpoint inhibitors. ns p > 0.05, *p < 0.05, ***p < 0.001. Abbreviations: HCC, hepatocellular carcinoma; TCGA, the Cancer Genome Atlas; PD-1, programmed cell death 1; CTLA-4, cytotoxic T lymphocyte-associated antigen-4; LAG3, lymphocyte-activation gene 3; TIM3, T-cell immunoglobulin and mucin domain 3; TIGIT, T cell immunoreceptor with immunoglobulin and ITIM domain; B7-H3, B7 homolog 3; ips, Immunophenoscore. |
The sensitivity of HCC to various chemotherapeutic drugs is relatively poor, leading to limited benefit from chemotherapy. But the metabolic changes in the tumor might provide potential targets for chemotherapeutic drugs. Therefore, we evaluated the IC50s of several chemotherapeutics between the different risk groups (Figure 10C). Results showed that patients in the high-risk group had lower IC50s of cisplatin, doxorubicin, gemcitabine, mitomycin C, etoposide, and paclitaxel than those in the low-risk group, which suggested that patients with high risk may benefit more from chemotherapy. In addition, we also analyzed the sensitivity of patients in different risk subgroups to several multikinase inhibitors. Results showed that patients in the low-risk group had a significantly lower IC50s to multiple targeted drugs (including lapatinib, erlotinib, gefitinib, and dasatinib) than patients in the high-risk group, whereas no significant difference was observed for sorafenib or sunitinib (Figure 10C). These findings indicated the potential benefits from specific targeted therapy for HCC patients in low-risk group. Notably, the potential differences in the effects of immune checkpoint inhibitor treatment between different risk groups were further noticed. Based on the comparison of IPS, we found that patients in the low-risk group had a higher potential benefit from either single or combination therapy against PD-1 or CTLA-4 than patients in the high-risk group (Figure 10D).
Validation of the Expression and Correlation with Ferroptosis of the Nine Fer-MRGs in HCC
To verify the expression of nine Fer-MRGs in HCC tissues, we examined the expression levels of the above genes in 16 pairs of HCC tumors and adjacent tissues using qRT-PCR. Results showed that elevated expression levels of AKR1C3, ATIC, G6PD, GMPS, GNPDA1, PRIM1, RRM2, and TXNRD1 were verified in HCC tumors (all p < 0.05), while no significant difference was found for IMPDH1 (p = 0.5829) (Figure 11A). Then, we tested the correlation between the above metabolic genes and ferroptosis in different hepatoma cell lines. After inducing ferroptosis with erastin and RSL3, the expression changes of ferroptosis-related genes (GPX4, PTGS2, FTH1, and ACSL4) and critical Fer-MRGs were examined. Results showed that PTGS2 and FTH1 were significantly upregulated under the introduction of ferroptosis in Huh7 cells, whereas ACSL4 was found with significant decrease (all p < 0.05, Figure 11B). No significant change was found for GPX4 gene expression (p > 0.05, Figure 11B). The alterations of these genes indicated the occurrence of ferroptosis in hepatoma cells. The expression of metabolic genes showed that AKR1C3, G6PD, GNPDA1, and TXNRD1 were significantly upregulated in ferroptotic hepatoma cells, whereas ATIC, GMPS, PRIM1, and RRM2 were significantly decreased (all p < 0.05, Figure 11B). No significant difference was observed for IMPDH1 under the introduction of erastin and RLS3 in Huh7 cells (p > 0.05, Figure 11B). Similar results were observed in Hep-G2 cells, although its response to ferroptosis inducers was partially different from that of Huh7. After ferroptosis introduction, FTH1 were significantly upregulated both for erastin and RLS3, while GPX4 and ACSL4 were significantly decreased only for RSL3. PTGS2 was not detected in Hep-G2 cells. As for the metabolic genes, significant changes were found for G6PD, AKR1C3, ATIC, GMPS, GNPDA1, PRIM1, RRM2, and TXNRD1 in erastin and/or RSL3 treatment, while no significant changes were found in IMPDH1 (Figure 11B).
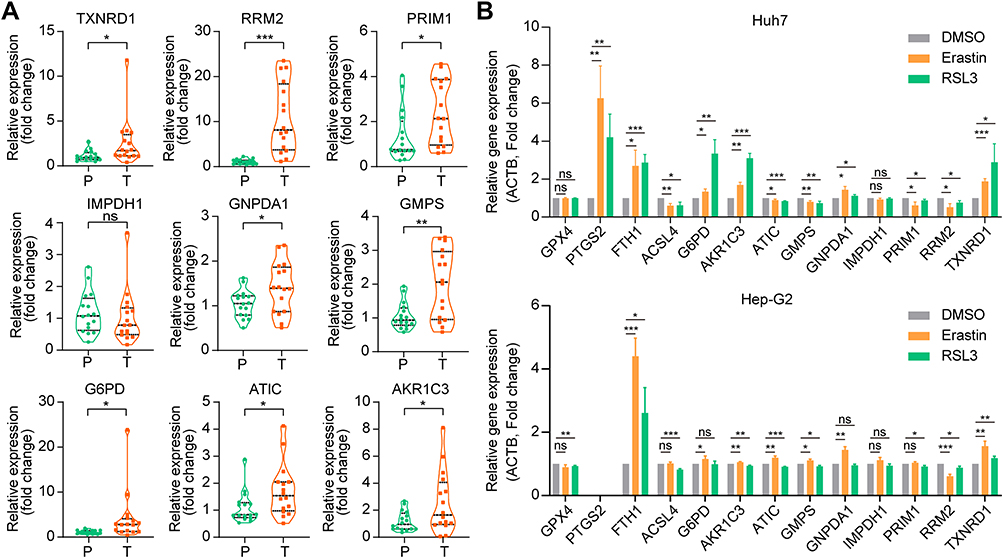 |
Figure 11 Validation of the expression and correlation of Fer-MRGs in HCC by qRT-PCR. (A) The upregulated RNA expression levels of TXNDR1, RRM2, PRIM1, GNPDA1, GMPS, G6PD, ATIC, and AKR1C3 were found in HCC, while no significant difference was found for IMPDH1. (B) The expression changes of ferroptosis-related genes and metabolic genes in hepatoma cells after ferroptosis introduction with erastin (10uM) and RSL3 (1uM). ns p > 0.05, *p < 0.05, **p < 0.01, ***p < 0.001. Abbreviations: HCC, hepatocellular carcinoma; Fer-MRGs, ferroptosis-related metabolic genes; qRT-PCR, quantitative real-time polymerase chain reaction. |
Discussion
Ferroptosis, as a novel type of regulated cell death, has attracted much attention in cancer research.7 Increasing evidence has indicated the significant role and mechanism of ferroptosis involved in the development and therapeutic response of multiple cancers, including HCC.13 As the first approved targeted therapy for unresectable HCC, sorafenib has been revealed to induce apoptosis or autophagy of tumor cells by inhibiting the activity of various kinases. However, recent studies suggested that the induction of ferroptosis by suppressing system xc− might play the major anticancer role of sorafenib.14,15 When combined with the ferroptosis promoter acyl-CoA synthetase long-chain family member 4 (ACSL4), the sensitivity to sorafenib of HCC cells was enhanced, which indicated the potential strategy to overcome the sorafenib resistance.16 Besides, other regulators were also identified as ferroptosis regulators in HCC, including the retinoblastoma (Rb), nuclear factor erythroid 2-related factor 2 (NRF2), and metallothionein 1G (MT1G).15,17,18 To date, a variety of promoters and suppressors of ferroptosis have been recognized and the regulatory network has also been established preliminarily. Liang et al analyzed the overall expression of 60 FRGs in HCC and found that 49 genes showed significant differences between tumor and nontumor tissues in the TCGA cohort with the criteria of FDR < 0.05.19 Du et al identified 26 differentially expressed genes of 60 FRGs in HCC with both FDR < 0.05 and |Log2FC| > 1.20 In the present study, we summarized 168 FRGs from the FerrDb database, in which only the driver and suppressor genes were included. Finally, only 20% (34/168) of FRGs were identified as the differentially expressed genes both in the TCGA and GSE14520 cohort with our screening criteria. These findings indicated the dysregulation and significant role of ferroptosis in HCC.
Besides, several studies also evaluated the prognostic values of FRGs in HCC and established several gene signatures for prognosis prediction based on the FRGs separately or in combination with other signatures. However, few studies have focused on the metabolic changes induced or regulated by ferroptosis in tumors. Hence, in the present study, we comprehensively delineated the disturbance of metabolic pathways associated with ferroptosis in HCC at the transcriptome level, and preliminarily explored the potential mechanisms and clinical implications of these metabolic changes.
Metabolic dysfunction occupies an important downstream effect in various regulatory axes of ferroptosis.9,10 GPX4 is a key inhibitor of phospholipid peroxidation by regulating the biosynthesis of reactive oxygen species (ROS)-scavenging selenoproteins, which act as a suppressor of ferroptotic cell death.21 Besides, ACSL4 is regarded as a promoter of ferroptosis by regulating the PUFAs, which are the main substrate of lipid peroxidation.22 The regulation axes with cystine/GSH/GPX4, GCH1/BH4/DHFR, and FSP1/CoQ10 have been identified as three important antioxidant mechanisms in ferroptosis, which involved in the metabolic processes with amino acid transportation, mevalonate, and NADPH pathways.10 Therefore, the changes in metabolic processes are primary mechanisms and characteristics of ferroptosis.
In the present study, the significant correlation between ferroptosis and metabolism was confirmed in HCC. Almost 40% (77/189) of differentially expressed MRGs were identified as the Fer-MRGs (coefficient > 0.5), and nine of them were identified as common regulators involved in ferroptosis and metabolic pathways. The PPI analyses indicated the complex interactions between these Fer-MRGs, which mainly participated in the nucleotide, glutathione, and amino acid metabolism. As for the top ten hub Fer-MRGs, few studies have investigated their role in ferroptosis, while RRM2 has been identified as an anti-ferroptotic regulator in HCC by promoting the GSH synthesis in a recent study.23 Hence, these findings need further investigation.
Prognostic analyses of Fer-MRGs further revealed the important role of ferroptosis-mediated metabolic changes in the progression and prognosis of HCC. Nine critical Fer-MRGs (AKR1C3, ATIC, G6PD, GMPS, GNPDA1, IMPDH1, PRIM1, RRM2, and TXNRD1) were screened out to develop a novel risk model for predicting the OS of HCC patients, which showed superior prediction capacity both in the training and the validation groups. Patients in the high-risk group presented with worse OS than those in the low-risk group. Besides, the risk score model was also identified as an independent prognostic factor for OS of HCC. These findings provide potential targets for the intervention of HCC.
All of the nine critical Fer-MRGs were found upregulated in HCC in our study. Similar to the hub Fer-MRGs, the correlations to ferroptosis of most genes have not been investigated, but some have been demonstrated to be involved in the regulation of metabolic processes or tumors. Recent studies have demonstrated that PRIM1 could promote tumor growth, migration, invasion, and regulate the sorafenib resistance in HCC.24,25 RRM2 has been found a role in GSH synthesis and ferroptosis inhibition in HCC.23 Besides, RRM2 was also found as a core gene in the p53 regulation pathway in hepatitis B virus-related HCC.26 TXNRD1 was identified as a key metabolic reprogramming-associated gene, and could participate in the regulation of oxidative stress and lipid peroxidation in HCC.27–29 A recent study found that ATIC, IMPDH1, and RRM2 were key genes of purine metabolism in HCC, which was similar to our results.30 As for G6PD, previous studies have revealed its role in contributing to the tumor proliferation, migration, and invasion of HCC, and it was also identified as a key energy metabolism gene for HCC.31–33
The relationship between ferroptosis and anticancer immunity has been revealed recently.34–36 Hence, we would like to explore whether the metabolic changes mediated by ferroptosis could also affect the immunophenotype in HCC. Notably, positive correlations were found between the risk score based on Fer-MRGs and immune checkpoint genes with PD-1, CTLA4, TIM3, LAG3, TIGIT, and B7-H3. Besides, most Fer-MRGs were also found with specific expression profiles in the different immune subtypes of HCC. The highest risk score was observed in the wound healing subtype (C1), while the lowest risk score was identified in the inflammatory subtype (C3), which indicated the unique metabolic characteristic related to ferroptosis in the different subtype of HCC. Furthermore, analyses on the potential benefits of immunotherapy for different risk groups found that patients in the high-risk group might have better outcomes with immune checkpoint inhibitors of anti-PD-1 and/or anti-CTLA4. This may provide some reference for the selection and efficacy prediction of immune checkpoint inhibitor therapy in HCC patients. Furthermore, the drug susceptibility analyses also indicated potential benefits from chemotherapy for patients in the high-risk group.
Nevertheless, there are some limitations to our study. First, all of the analyses and results are based on the transcriptome data from public databases, which need further validation in experiments. Second, the transcriptome data of HCC in TCGA and GSE14520 are mainly derived from Americans, which need further validation in other population groups.
Conclusion
In summary, we developed a novel risk score model based on the Fer-MRGs with superior capacity in prognosis prediction, and the results further provided some new perspectives for the potential mechanisms of Fer-MRGs in regulating the immune microenvironment and drug resistance of HCC.
Data Sharing Statement
The datasets generated and analyzed during the current study are available in the TCGA (https://portal.gdc.cancer.gov/), and GEO (https://www.ncbi.nlm.nih.gov/geo/).
Ethical Statement
The data from TCGA and GEO are shared and available to the public, and there are no ethical concerns. The tissue samples of 16 HCC patients used in the present study was approved by the Ethics Committee of the Third Affiliated Hospital of Sun Yat-Sen University. Written informed consent was obtained from all patients. The study was performed and reported in accordance with the Helsinki Declaration.
Acknowledgments
The authors are truly grateful to the TCGA and GEO databases for the data shared policy.
Funding
This work was supported by the Guangdong Natural Science Foundation (No. 2015A030313038, 2015A030312013).
Disclosure
The authors report no conflicts of interest in this work.
References
1. Llovet JM, Kelley RK, Villanueva A, et al. Hepatocellular carcinoma. Nat Rev Dis Primers. 2021;7(1):6. doi:10.1038/s41572-020-00240-3
2. Singal AG, Lampertico P, Nahon P. Epidemiology and surveillance for hepatocellular carcinoma: new trends. J Hepatol. 2020;72(2):250–261. doi:10.1016/j.jhep.2019.08.025
3. Faivre S, Rimassa L, Finn RS. Molecular therapies for HCC: looking outside the box. J Hepatol. 2020;72(2):342–352. doi:10.1016/j.jhep.2019.09.010
4. Heinrich S, Craig AJ, Ma L, Heinrich B, Greten TF, Wang XW. Understanding tumour cell heterogeneity and its implication for immunotherapy in liver cancer using single-cell analysis. J Hepatol. 2021;74(3):700–715. doi:10.1016/j.jhep.2020.11.036
5. Sangro B, Chan SL, Meyer T, Reig M, El-Khoueiry A, Galle PR. Diagnosis and management of toxicities of immune checkpoint inhibitors in hepatocellular carcinoma. J Hepatol. 2020;72(2):320–341. doi:10.1016/j.jhep.2019.10.021
6. Rebouissou S, Nault JC. Advances in molecular classification and precision oncology in hepatocellular carcinoma. J Hepatol. 2020;72(2):215–229. doi:10.1016/j.jhep.2019.08.017
7. Chen X, Kang R, Kroemer G, Tang D. Broadening horizons: the role of ferroptosis in cancer. Nat Rev Clin Oncol. 2021;18(5):280–296. doi:10.1038/s41571-020-00462-0
8. Dixon SJ, Lemberg KM, Lamprecht MR, et al. Ferroptosis: an iron-dependent form of nonapoptotic cell death. Cell. 2012;149(5):1060–1072. doi:10.1016/j.cell.2012.03.042
9. Jiang X, Stockwell BR, Conrad M. Ferroptosis: mechanisms, biology and role in disease. Nat Rev Mol Cell Biol. 2021;22(4):266–282. doi:10.1038/s41580-020-00324-8
10. Zheng J, Conrad M. The metabolic underpinnings of ferroptosis. Cell Metab. 2020;32(6):920–937. doi:10.1016/j.cmet.2020.10.011
11. Thorsson V, Gibbs DL, Brown SD, et al. The immune landscape of cancer. Immunity. 2018;48(4):812–830 e14. doi:10.1016/j.immuni.2018.03.023
12. Charoentong P, Finotello F, Angelova M, et al. Pan-cancer immunogenomic analyses reveal genotype-immunophenotype relationships and predictors of response to checkpoint blockade. Cell Rep. 2017;18(1):248–262. doi:10.1016/j.celrep.2016.12.019
13. Nie J, Lin B, Zhou M, Wu L, Zheng T. Role of ferroptosis in hepatocellular carcinoma. J Cancer Res Clin Oncol. 2018;144(12):2329–2337. doi:10.1007/s00432-018-2740-3
14. Lachaier E, Louandre C, Godin C, et al. Sorafenib induces ferroptosis in human cancer cell lines originating from different solid tumors. Anticancer Res. 2014;34(11):6417–6422.
15. Sun X, Ou Z, Chen R, et al. Activation of the p62-Keap1-NRF2 pathway protects against ferroptosis in hepatocellular carcinoma cells. Hepatology. 2016;63(1):173–184. doi:10.1002/hep.28251
16. Feng J, Lu PZ, Zhu GZ, et al. ACSL4 is a predictive biomarker of sorafenib sensitivity in hepatocellular carcinoma. Acta Pharmacol Sin. 2021;42(1):160–170. doi:10.1038/s41401-020-0439-x
17. Louandre C, Marcq I, Bouhlal H, et al. The retinoblastoma (Rb) protein regulates ferroptosis induced by sorafenib in human hepatocellular carcinoma cells. Cancer Lett. 2015;356(2 Pt B):971–977. doi:10.1016/j.canlet.2014.11.014
18. Sun X, Niu X, Chen R, et al. Metallothionein-1G facilitates sorafenib resistance through inhibition of ferroptosis. Hepatology. 2016;64(2):488–500. doi:10.1002/hep.28574
19. Liang JY, Wang DS, Lin HC, et al. A novel ferroptosis-related gene signature for overall survival prediction in patients with hepatocellular carcinoma. Int J Biol Sci. 2020;16(13):2430–2441. doi:10.7150/ijbs.45050
20. Du X, Zhang Y. Integrated analysis of immunity- and ferroptosis-related biomarker signatures to improve the prognosis prediction of hepatocellular carcinoma. Front Genet. 2020;11:614888. doi:10.3389/fgene.2020.614888
21. Seibt TM, Proneth B, Conrad M. Role of GPX4 in ferroptosis and its pharmacological implication. Free Radic Biol Med. 2019;133:144–152. doi:10.1016/j.freeradbiomed.2018.09.014
22. Doll S, Proneth B, Tyurina YY, et al. ACSL4 dictates ferroptosis sensitivity by shaping cellular lipid composition. Nat Chem Biol. 2017;13(1):91–98. doi:10.1038/nchembio.2239
23. Yang Y, Lin J, Guo S, et al. RRM2 protects against ferroptosis and is a tumor biomarker for liver cancer. Cancer Cell Int. 2020;20(1):587. doi:10.1186/s12935-020-01689-8
24. Zhu M, Wu M, Bian S, et al. DNA primase subunit 1 deteriorated progression of hepatocellular carcinoma by activating AKT/mTOR signaling and UBE2C-mediated P53 ubiquitination. Cell Biosci. 2021;11(1):42. doi:10.1186/s13578-021-00555-y
25. Jiang J, Zhang Y, Xu R, Ren L, Chen J, Lu H. PRIM1 promotes the proliferation of hepatocellular carcinoma cells in vitro and in vivo. J Cancer. 2020;11(22):6601–6611. doi:10.7150/jca.47870
26. Yu M, Xu W, Jie Y, et al. Identification and validation of three core genes in p53 signaling pathway in hepatitis B virus-related hepatocellular carcinoma. World J Surg Oncol. 2021;19(1):66. doi:10.1186/s12957-021-02174-w
27. Cui L, Xue H, Wen Z, Lu Z, Liu Y, Zhang Y. Prognostic roles of metabolic reprogramming-associated genes in patients with hepatocellular carcinoma. Aging. 2020;12(21):22199–22219. doi:10.18632/aging.104122
28. Gao Q, Zhang G, Zheng Y, et al. SLC27A5 deficiency activates NRF2/TXNRD1 pathway by increased lipid peroxidation in HCC. Cell Death Differ. 2020;27(3):1086–1104. doi:10.1038/s41418-019-0399-1
29. Lee D, Xu IM, Chiu DK, et al. Induction of oxidative stress through inhibition of thioredoxin reductase 1 is an effective therapeutic approach for hepatocellular carcinoma. Hepatology. 2019;69(4):1768–1786. doi:10.1002/hep.30467
30. Su WJ, Lu PZ, Wu Y, Kalpana K, Yang CK, Lu GD. Identification of key genes in purine metabolism as prognostic biomarker for hepatocellular carcinoma. Front Oncol. 2020;10:583053. doi:10.3389/fonc.2020.583053
31. Zhang X, Gao F, Ai H, et al. TSP50 promotes hepatocyte proliferation and tumour formation by activating glucose-6-phosphate dehydrogenase (G6PD). Cell Prolif. 2021;2:e13015. doi:10.1111/cpr.13015
32. Chen Q, Li F, Gao Y, Xu G, Liang L, Xu J. Identification of energy metabolism genes for the prediction of survival in hepatocellular carcinoma. Front Oncol. 2020;10:1210. doi:10.3389/fonc.2020.01210
33. Lu M, Lu L, Dong Q, et al. Elevated G6PD expression contributes to migration and invasion of hepatocellular carcinoma cells by inducing epithelial-mesenchymal transition. Acta Biochim Biophys Sin (Shanghai). 2018;50(4):370–380. doi:10.1093/abbs/gmy009
34. Tang R, Xu J, Zhang B, et al. Ferroptosis, necroptosis, and pyroptosis in anticancer immunity. J Hematol Oncol. 2020;13(1):110. doi:10.1186/s13045-020-00946-7
35. Stockwell BR, Jiang X, Physiological A. Function for ferroptosis in tumor suppression by the immune system. Cell Metab. 2019;30(1):14–15. doi:10.1016/j.cmet.2019.06.012
36. Friedmann Angeli JP, Krysko DV, Conrad M. Ferroptosis at the crossroads of cancer-acquired drug resistance and immune evasion. Nat Rev Cancer. 2019;19(7):405–414. doi:10.1038/s41568-019-0149-1
 © 2021 The Author(s). This work is published and licensed by Dove Medical Press Limited. The full terms of this license are available at https://www.dovepress.com/terms.php and incorporate the Creative Commons Attribution - Non Commercial (unported, v3.0) License.
By accessing the work you hereby accept the Terms. Non-commercial uses of the work are permitted without any further permission from Dove Medical Press Limited, provided the work is properly attributed. For permission for commercial use of this work, please see paragraphs 4.2 and 5 of our Terms.
© 2021 The Author(s). This work is published and licensed by Dove Medical Press Limited. The full terms of this license are available at https://www.dovepress.com/terms.php and incorporate the Creative Commons Attribution - Non Commercial (unported, v3.0) License.
By accessing the work you hereby accept the Terms. Non-commercial uses of the work are permitted without any further permission from Dove Medical Press Limited, provided the work is properly attributed. For permission for commercial use of this work, please see paragraphs 4.2 and 5 of our Terms.