")
Back to Journals » OncoTargets and Therapy » Volume 14
Prognostic Implications of the Complement Protein C1Q and Its Correlation with Immune Infiltrates in Osteosarcoma
Authors Huang H , Tan M, Zheng L, Yan G, Li K, Lu D, Cui X, He S, Lei D, Zhu B, Zhao J
Received 3 December 2020
Accepted for publication 15 February 2021
Published 5 March 2021 Volume 2021:14 Pages 1737—1751
DOI https://doi.org/10.2147/OTT.S295063
Checked for plagiarism Yes
Review by Single anonymous peer review
Peer reviewer comments 3
Editor who approved publication: Professor Gaetano Romano
Hanji Huang,1,2,* Manli Tan,1,* Li Zheng,1,3 Guohua Yan,1,2,4 Kanglu Li,1,2,4 Dejie Lu,1,2,4 Xiaofei Cui,1,2,4 Si He,1,2 Danqing Lei,5,6 Bo Zhu,1 Jinmin Zhao1– 4,7
1Guangxi Engineering Center in Biomedical Materials for Tissue and Organ Regeneration, The First Affiliated Hospital of Guangxi Medical University, Nanning, 530021, People’s Republic of China; 2Guangxi Collaborative Innovation Center for Biomedicine, Life Sciences Institute, Guangxi Medical University, Nanning, 530021, People’s Republic of China; 3International Joint Laboratory of Ministry of Education for Regeneration of Bone and Soft Tissues, The First Affiliated Hospital of Guangxi Medical University, Nanning, 530021, People’s Republic of China; 4Department of Orthopaedics Trauma and Hand Surgery, The First Affiliated Hospital of Guangxi Medical University, Nanning, 530021, People’s Republic of China; 5Pharmaceutical College, Guangxi Medical University, Nanning, 530021, People’s Republic of China; 6The Medical and Scientific Research Center, Life Sciences Institute, Guangxi Medical University, Nanning, 530021, People’s Republic of China; 7Guangxi Key Laboratory of Regenerative Medicine, The First Affiliated Hospital of Guangxi Medical University, Nanning, 530021, People’s Republic of China
*These authors contributed equally to this work
Correspondence: Danqing Lei
The Medical and Scientific Research Center, Life Sciences Institute, Guangxi Medical University, Nanning, 530021, People’s Republic of China
Tel +86-07715358549
Email [email protected]
Bo Zhu
Guangxi Engineering Center in Biomedical Materials for Tissue and Organ Regeneration, The First Affiliated Hospital of Guangxi Medical University, Nanning, 530021, People’s Republic of China
Tel +86-07715540515
Email [email protected]
Background: Osteosarcoma (OS) is the most widespread bone tumour among childhood cancers, and distant metastasis is the dominant factor in poor prognosis for patients with OS. Therefore, it is necessary to identify new prognostic biomarkers for identifying patients with aggressive disease.
Methods: Two OS datasets (GSE21257 and GSE33383) were downloaded from the Gene Expression Omnibus (GEO) and subsequently subjected to weighted gene co-expression network analysis (WGCNA) and differential gene expression analysis (DGE) to screen candidate genes. A prognostic model was constructed using OS data derived from the Therapeutically Applicable Research to Generate Effective Treatments (TARGET) program to further screen key genes and perform gene ontology (GO) analysis. The prognostic values of key genes were assessed using the Kaplan–Meier (KM) plotter. The GEO dataset was used for immune infiltration analysis and association analysis of key genes. In addition, quantitative real-time polymerase chain reaction (qRT-PCR) was employed to validate the expression levels of potentially crucial genes in OS cell lines.
Results: In the present study, we found 114 genes with a highly significant correlation in the module and 44 downregulated genes; 25 candidate genes overlapped in the two parts of the genes. Among these, three key genes, C1QA, C1QB, and C1QC, were the most significant hub genes, which had the highest node degrees, were clustered into one group, and implicated in most significant biological processes (regulation of immune effector process). Moreover, these three key genes were negatively associated with the prognosis of OS and positively associated with three immune cells (follicular helper T cells, memory B cells, and CD8 T cells). Additionally, compared to non-metastatic OS cell lines, the expression of three key genes was significantly downregulated in metastatic OS cell lines.
Conclusion: Our results revealed that three key genes (C1QA, C1QB, and C1QC) were implicated in tumour immune infiltration and may be promising biomarkers for predicting metastasis and prognosis of patients with OS.
Keywords: osteosarcoma, immune infiltrates, complement protein, C1Q, metastasis
Introduction
Osteosarcoma (OS) is one of the most frequent types of primary cancers in adolescent malignant bone tumours, and its characteristics include high aggressiveness and early systemic metastasis.1,2 At present, a large number of studies have suggested that the prognosis of OS patients with distant metastasis is poor, and its pathogenesis is still unknown.3 Advanced surgical techniques combined with multiple chemotherapies in clinical settings have significantly improved the 5-year survival rate for OS patients by 55–70%. This rate is still unsatisfactory, and many patients suffer from aggressive disease relapse owing to potential distant metastases. For patients with recurrent or metastatic OS, the 5-year survival rate drops to 15%;4 thus, metastasis is the most unfavourable factor in diagnosis,5 indicating a poor prognosis in OS patients. Therefore, novel diagnostic biomarkers and better therapeutic targets are required to enhance the efficacy of early diagnosis and treatment of OS metastases.
Recently, immunotherapy has attracted the most attention for many types of cancers, such as hepatocellular carcinoma, breast cancer, and OS, although the mechanism underlying the treatment of osteosarcoma is unclear.6,7 The relationship between the corresponding immune cells and tumour cells is embodied in the tumour microenvironment, which is a hot topic in malignant tumour research.8 In the tumour microenvironment (TME), infiltrating immune cells are the predominant non-neoplastic component, and increasing evidence has revealed that the characteristics of tumour-infiltrating immune cells (TIICs) are related to tumour progression.9–11 Therefore, it is essential to determine the distribution and function of TIICs by systematically assessing the immune properties of the TME to improve the effectiveness of immunotherapy for OS.
Using bioinformatics methods, two kinds of databases (TARGET and GEO) have been extensively utilised to probe the biomarkers of diagnosis and prognosis for OS.12–14 However, most studies used data from only a single dataset, which limited the sample sizes. Some performed only differential expression analyses, which may have biased the final results. Recently, using cell-type identification by estimating relative subsets of RNA transcripts (CIBERSORT), the relative fractions of different cell subpopulations of gene expression profiles (GEP) in complex tissues have been analysed.15 This technique has been successfully applied to determine TIICs and their relationship to prognosis in many malignancies, including bladder carcinoma,16 non-small cell lung cancer,17 and breast cancer.18 CIBERSORT was used to analyse tumour-infiltrating immune cells in OS samples in our study. This may provide some clues for the search for new potential immune targets for OS.
To analyse a larger number of samples and avoid sample heterogeneity/errors arising from different technical platforms and dissimilar methods of processing data, we downloaded the GSE2125719 and GSE3338320 gene chip datasets from the GEO database and used the R “SVA“ package to remove batch effects and merge the data. The WGCNA algorithm was used to obtain the module genes most relevant to metastasis and perform differential analysis of differentially expressed genes (DEGs) between metastatic and primary OS tissues, and the intersection of the module genes and downregulated genes were used as the candidate genes. Survival analysis of the genes acquired from the intersection was carried out utilizing the R “survival” package. Subsequently, GO enrichment analysis was performed to explore candidate gene functions, and a protein-protein interaction (PPI) network was constructed to filter 3 hub genes (C1QA, C1QB, and C1QC). The most enriched biological process in the GO analysis was the regulation of the immune effector process, and all other enriched pathways were immune-related. It was inferred that the hub gene may affect OS metastasis through the regulation of immune function. Finally, CIBERSORT was utilised to further analyse the link between tumour-infiltrating immune cells and hub genes. The present study provides a detailed analysis of the role of C1Q in OS metastasis, which will aid in understanding its underlying mechanisms.
Materials and Methods
Data Sources and Data Preprocessing
To obtain genome-wide datasets comparing gene expression between metastatic and non-metastatic OS, we downloaded two preprocessed gene expression profile datasets (GSE2125719 and GSE3338320) from the GEO database. First, the GPL10295 Illumina human-6 v2.0 expression beadchip was used to remove the probes that did not map to gene symbol annotation files. The average value of expression of the different probes for the same gene was used as the ultimate gene expression level. Second, these two datasets were merged and processed for normalisation by employing the “SVA” R package to obtain a total of 106 samples. In addition, 88 cases of osteogenic sarcoma and related clinical information were obtained from the TARGET database (https://ocg.cancer.gov/programs/target/) to build a survival model. OS sample-related information is listed in Table 1.
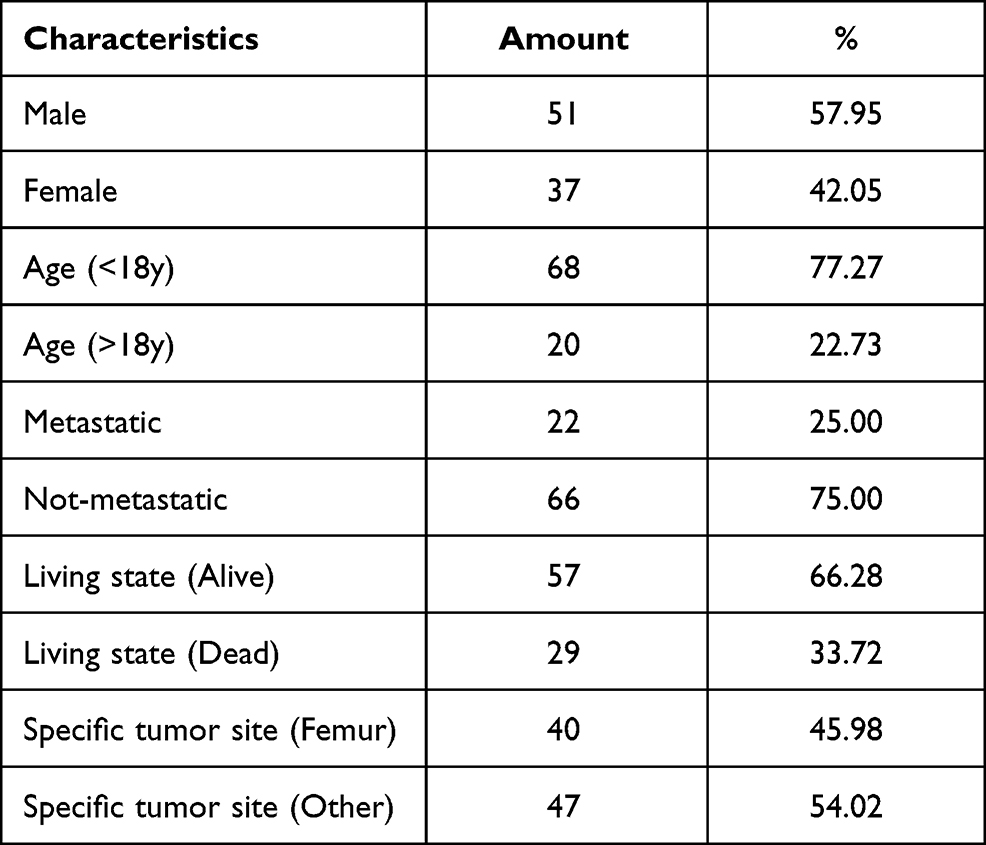 |
Table 1 Clinicopathological Characteristic of OS Patients from TARGET Database |
Cell Culture and Treatment
Human OS cell lines, MG63 (ATCC: CRL-1427), 143B (ATCC: CRL-8303), MNNG (ATCC: CRL-1547), and HOS (ATCC: HTB-96TM) were purchased from the American Type Culture Collection (ATCC, Manassas, VA, USA). The HOS and MG63 cell lines were identified as non-metastatic OS cells, whereas MNNG and 143B cell lines were identified as metastatic OS cells.21 The cells were cultured in Dulbecco’s modified Eagle’s medium (DMEM, Gibco, Shanghai, China) containing 10% foetal bovine serum (FBS, Tianhang, Zhejiang, China), and supplemented with 2 kinds of antibiotics, 100 µg/mL streptomycin and 100 U/mL penicillin (Solarbio, Beijing, China). All the cells were placed in an incubator containing humidified air with 5% carbon dioxide at 37 °C, and the medium was replaced with fresh medium once every 3 days.
Screening for OS-Associated Genes and Module Analysis by WGCNA
WGCNA22 was used to explore co-expression modules related to OS and its clinical characteristics. Genes with a variance above 30% were screened using this algorithm for subsequent analysis. Sample clustering was then performed to detect and eliminate the outliers in the sample. In order to obtain the appropriate module, we set the minimal gene module size to 30 and the other arguments were fixed to default values, and the power parameters were pre-calculated using the pickSoftThreshold function of WGCNA. In modules with disparate power values, we performed scale independence and average connectivity analysis after reclassification of removing outliers to determine soft thresholds in the module analysis. Subsequently, the effect of power values on scale independence and average connectivity was examined employing the softConnectivity function from the WGCNA package. By calculating scale-free topological fit indices of multiple powers, an appropriate soft threshold power was obtained for the construction of the network. At a power below 30, if the scale-free topologic fit index of the chosen dataset reaches a value greater than 0.9, it means that the topology of the network is scale-free and has no batch effects.23 In addition, to identify the central gene of a given module, the gene significance (GS) and module members (MM) were evaluated. GS and MM represent the correlation between the gene and trait, and the correlation of gene expression profile and the module intrinsic genes, respectively. The pivotal genes of the vital modules were chosen based on the conditions GS > 0.2 and MM > 0.8.
Screening for DEGs
The limma R package was used to carry out DEG analysis. Genes with a threshold |log2(fold-change)| > 1 and p-value < 0.05 were regarded as DEGs between metastatic and non-metastatic OS.
Construction of VennDiagram
VennDiagram, a package for the construction of highly customizable Venn and Euler diagrams in R,24 was used to obtain WGCNA genes that are shared with differentially expressed genes.
GO Analysis
The clusterProfiler package was used for GO term enrichment analysis of candidate genes.25 The R visualisation package GO-Plot26 was used to better visualise the relationships between genes and selected functional categories.
Survival Analysis
A survival analysis model was established according to the survival information of 88 patients with OS in the TARGET database. To distinguish the genes related to survival, we performed a single-factor Cox regression analysis. The Kaplan–Meier graph was used to display the survival probability of each group. In the survival curve for prognosis, a p-value < 0.05 was set as the threshold.
PPI Network Construction
The PPI network of candidate genes was generated based on the String online tool27 (https://string-db.org/), and K-means clustering (number of clusters = 3) was performed and visualised in the network using Cytoscape software (version 3.8.0).
Evaluation of Infiltrating Immune Cells
The standardised TARGET-OS gene expression data were subjected to CIBERSORT analysis to deduce the relative proportions of the 22 infiltrating immune cells.28 By applying CIBERSORT, we first estimated the proportion of immune cell types for each OS sample. We then calculated the percentage of 22 immune cells associated with all samples, including metastatic and non-metastatic OS. Differential analysis (metastatic OS versus non-metastatic OS) of 22 immune cells was performed, and significant differences were identified by the criterion of p-value < 0.05. Finally, Pearson correlation analysis was used to explore the correlation between screened candidate genes and differentially expressed immune cells.
Western Blot
OS cells were lysed using RIPA Lysis Buffer (Biosharp, Beijing, China). The proteins were electrophoretically separated on a 10% SDS-PAGE gel and transferred to a PVDF membrane (Biosharp, Beijing, China). After blocking with 5% evaporated skimmed milk, the membranes were incubated with each primary antibody, including anti-GAPDH, anti-C1QA, anti-C1QB, and anti-C1QC (Proteintech, Wuhan, China; 1:2000 dilution) for 10 h, and the respective secondary antibodies (Sangon Biotech, Shanghai, China). After the membranes were washed 3 times with Tris-buffered saline Tween (TBST), the target bands were detected using a high sensitivity plus ECL luminescence reagent (Sangon Biotech, Shanghai, China).
qRT-PCR Analysis
An RNA-extraction agent, HiPure Total RNA Mini Kit (Magen, Guangzhou, China) was used to extract total mRNA from OS cells. cDNA was synthesised from 1 μg of mRNA using a PrimeScriptTM RT reagent kit (Takara, Beijing, China). qRT-PCR was carried out to detect the target gene expression using the cDNA in a Roche LightCycler® 96 SW PCR instrument (Basel, Switzerland). The thermocycling sequence was set at 95 °C for 30 s, followed by 45 cycles of 95 °C for 10 s, then 55 °C for 1 min. Glyceraldehyde phosphate dehydrogenase (GAPDH) expression was used as a control. The relative expression of the final screened genes was calculated using a comparative method, 2−ΔCt. The PCR primers used in our study are listed in Table 2.
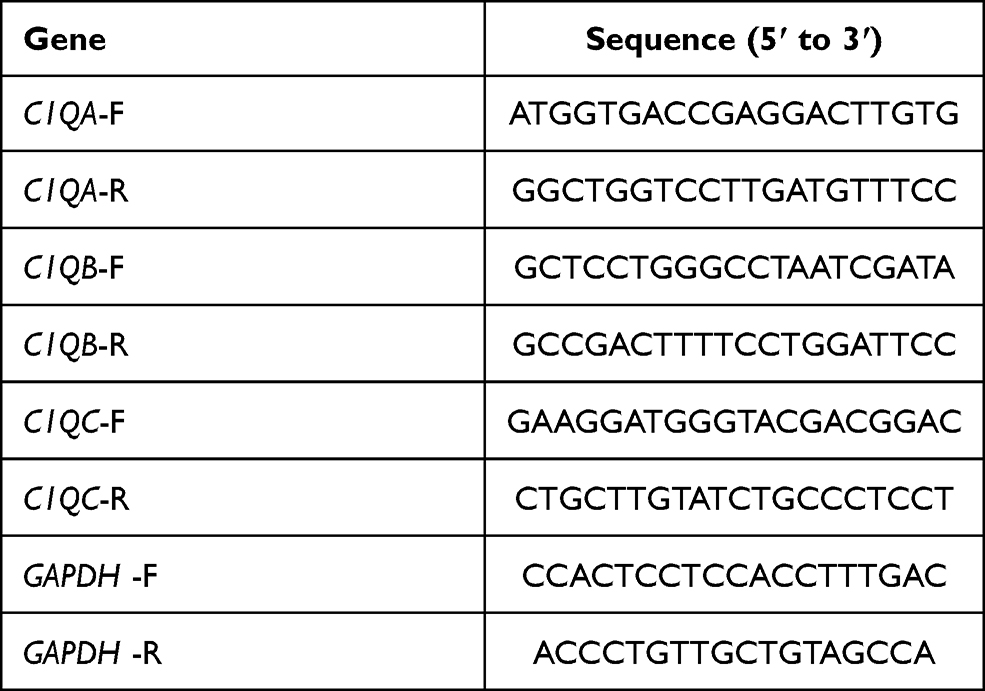 |
Table 2 The PCR Primers Utilized in This Study |
Statistical Analysis
Experimental results are expressed as the mean ± standard deviation (SD) from 3 independent experiments. Statistical analysis and bar charting were performed using GraphPad Prism 8 software (San Diego, CA, USA). One-way analysis of variance with unpaired student’s test was employed to evaluate the differences, and P < 0.05 was considered statistically significant.
Results
Data Integration and Removal of Batch Effects
To select prognostic markers of OS, datasets of metastatic OS-associated gene expression profiles were analysed using several bioinformatics methods (see Figure 1 for details of the experimental design). First, the datasets GSE21257 (34 metastatic and 19 non-metastatic samples) and GSE33383 (34 metastatic and 19 non-metastatic samples) were acquired from the GEO database. The 2 sets of data were merged and standardised to obtain a dataset with a total of 106 samples (68 metastatic and 38 non-metastatic samples). The merged dataset was processed to remove the batch effect and normalised using the R “SVA” package (Figure 2A and B).
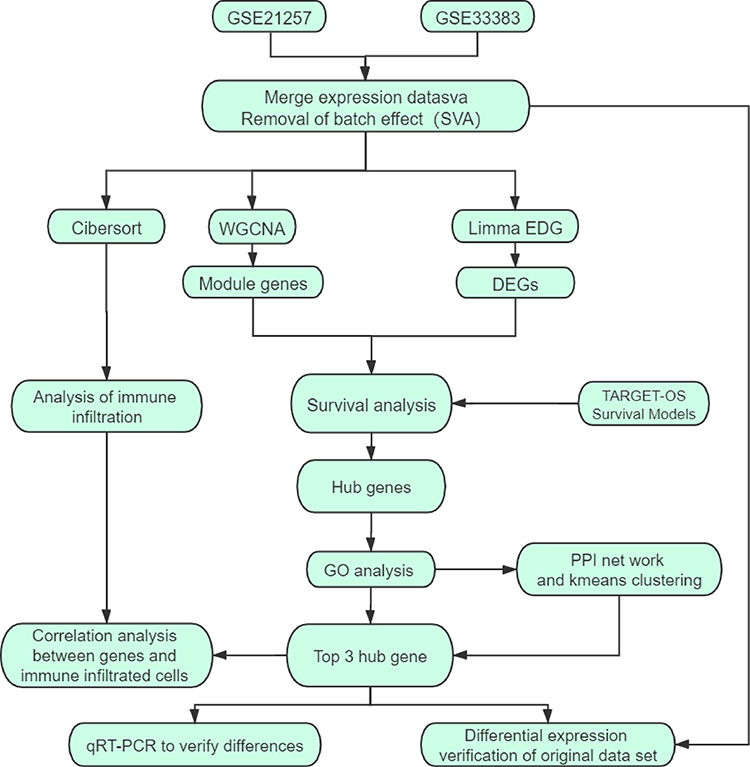 |
Figure 1 Schematic diagram of the methods. |
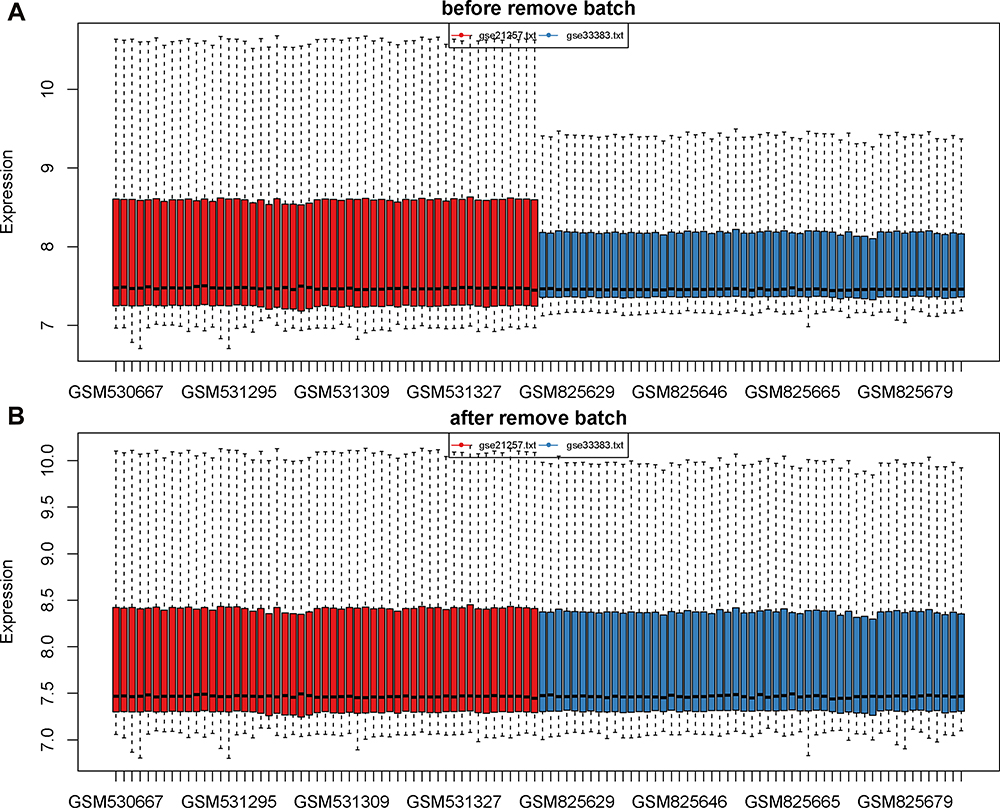 |
Figure 2 Data consolidation and removal of batch effects. (A) The data before removal of batch effects. (B) The data after removal of batch effects and normalization. The sample is exhibited on the X-axis and the relative expression is exhibited on the Y-axis. |
Screening for Genes Associated with Metastatic Modules
To identify the genes associated with OS metastasis modules, we performed WGCNA. First, the gene expression files of the combined 106 OS samples were analysed and 24,981 genes were obtained. Among these genes, 6245 genes with variance greater than all quartiles were selected for subsequent analysis. In addition, the 106 samples were then subjected to cluster analysis and we noticed that 2 outliers on the far left needed to be eliminated because they did not belong to the same broad category as the other samples (Figure 3A). Therefore, we deleted these 2 outliers by setting the height line at 80; new clusters were obtained and a characteristic heat map was exhibited according to the features of metastasis, gender, age, and grade (Figure 3B). Next, we obtained scale-free topology fit indices of multiple powers based on the different soft thresholds using the WGCNA algorithm. The results showed that the most appropriate soft threshold was 3 (Figure 3C). Subsequently, we obtained a total of 8 modules using module partitioning based on the cluster analysis of modules (Figure 3D). Furthermore, the number of genes in each colour module was calculated, as shown in Figure 3E. In further analysis, a heat map of gene correlation with clinical characteristics of each module was obtained. As shown in Figure 3F, we found that the blue module had the largest negative relationship with metastasis (coefficient of correlation: −0.50; p-values: 6e−08). Therefore, we focused on the 1557 genes that appeared in the blue module in subsequent analyses.
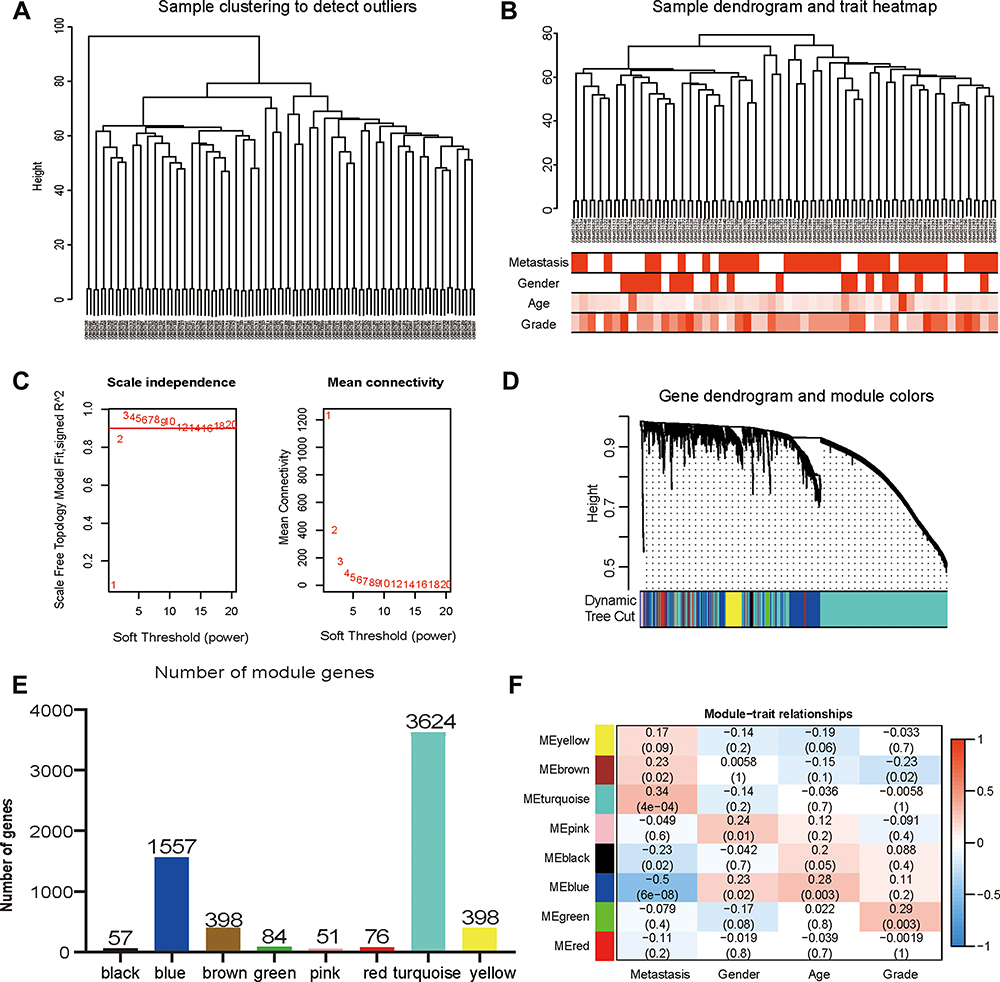 |
Figure 3 Construction and identification of the clinical characteristics-related modules. (A) The clustering dendrogram combined 106 cases of OS samples. (B) The clustering dendrogram of samples setting a height red line of 80 and the clinical trait heatmap. White represents the low value and red represents the high value in the traits of age and grade. While white represents non-metastasis or female and red represents metastasis or male in the traits of metastasis and gender. (C) The network topologic analysis of different soft thresholds (power). The chart on the left shows the effect of soft threshold power (X-axis) on the scale-free fit index (Y-axis). The chart on the right exhibits the effect of the soft threshold power (X-axis) on the average connectivity (degree, Y-axis). (D) Gene dendrogram and modules partition. Each colour represents a module. (E) The number of genes was measured in different gene co-expression modules. (F) Heatmap analysis for the correlation between clinical features and module eigengenes. Each row and column indicate the module’s characteristic gene and clinical trait, respectively; the corresponding coefficient of correlation and p-value are listed in each cell. According to the colour legend, the table is color-coded through correlation. |
Screening for Marker Genes That Significantly Affect Prognosis
To further screen key marker genes, we explored the blue module and further examined the relationship between MM and GS (Figure 4A). In this module, a total of 114 genes with highly significant correlations were obtained under the thresholds of MM > 0.8 and GS > 0.2. As shown in Figure 4B, 44 downregulated genes were identified in the DEGs comparing 38 non-metastatic OS with 68 metastatic OS samples, based on a threshold P-value < 0.05, and |log2(fold-change)| > 1. After the intersection of 114 genes with a highly significant correlation in the blue module and 44 downregulated genes in DEGs, we obtained 25 overlapping candidate genes (Figure 4C). Subsequently, a single-factor prognostic analysis was performed for these 25 candidate genes. Among them, 12 genes, C1QB, CD74, C1QA, FCER1G, C1QC, HLA-DMA, CD14, LYZ, HLA-DRA, TYROBP, CXCL10, and HLA-DMB, were negatively correlated with the prognosis of patients with OS (Figure 4D).
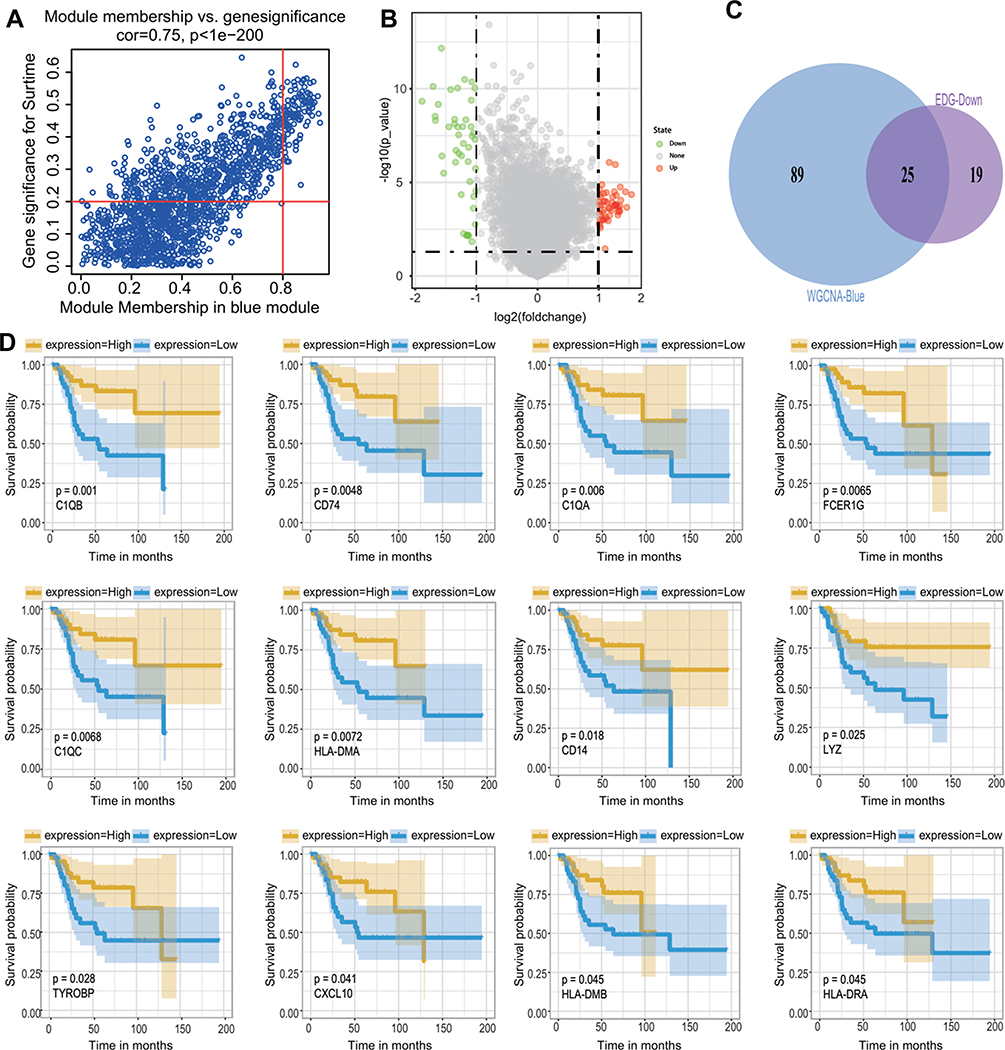 |
Figure 4 Screening of candidate genes. (A) The scatter chart of GS relative to MM in the blue module. (B) The volcano plot of DEGs of metastatic OS and non-metastatic OS with a threshold p-value < 0.05 and |log2(fold-change)| > 1. (C) The intersection of 114 genes with a highly significant correlation in the module and 44 downregulated genes in DEGs. (D) Survival analysis of candidate genes obtained from intersections. Note that only 12 genes are significantly associated with the overall survival of patients with OS (p < 0.05). The blue line means a low expression group, the yellow line means a high expression group. Representative gene names and P-values are listed in the lower-left corner of each figure. |
Hub Gene Screening
To examine the potential biological functions of 12 genes that were negatively correlated with prognosis, GO term enrichment analysis was performed using the clusterProfiler package. The results of the GO term enrichment analysis revealed that significant enrichment of biological processes was associated with immune regulation. Among these, the regulation of the immune effector process was the most significant biological process, which involved 6 genes: C1QB, CD74, C1QA, FCER1G, C1QC, and HLA-DMB (Figure 5A). Thus, these genes were chosen for further PPI network analysis using the String webpage. As shown in Figure 5B, we found that C1QA, C1QB, and C1QC were the 3 most significant hub genes with the highest node degrees and were clustered into one group in the interaction network. To explore the expression levels of C1QA, C1QB, and C1QC in non-metastatic and metastatic OS, significant box line plots of the expression levels of these three key genes were constructed in the combined dataset of 106 samples. As shown in Figure 5C, compared to non-metastatic OS, the expression levels of these 3 key genes were significantly downregulated in metastatic OS. Taken together, C1QA, C1QB, and C1QC may be pivotal genes in the prognosis of OS.
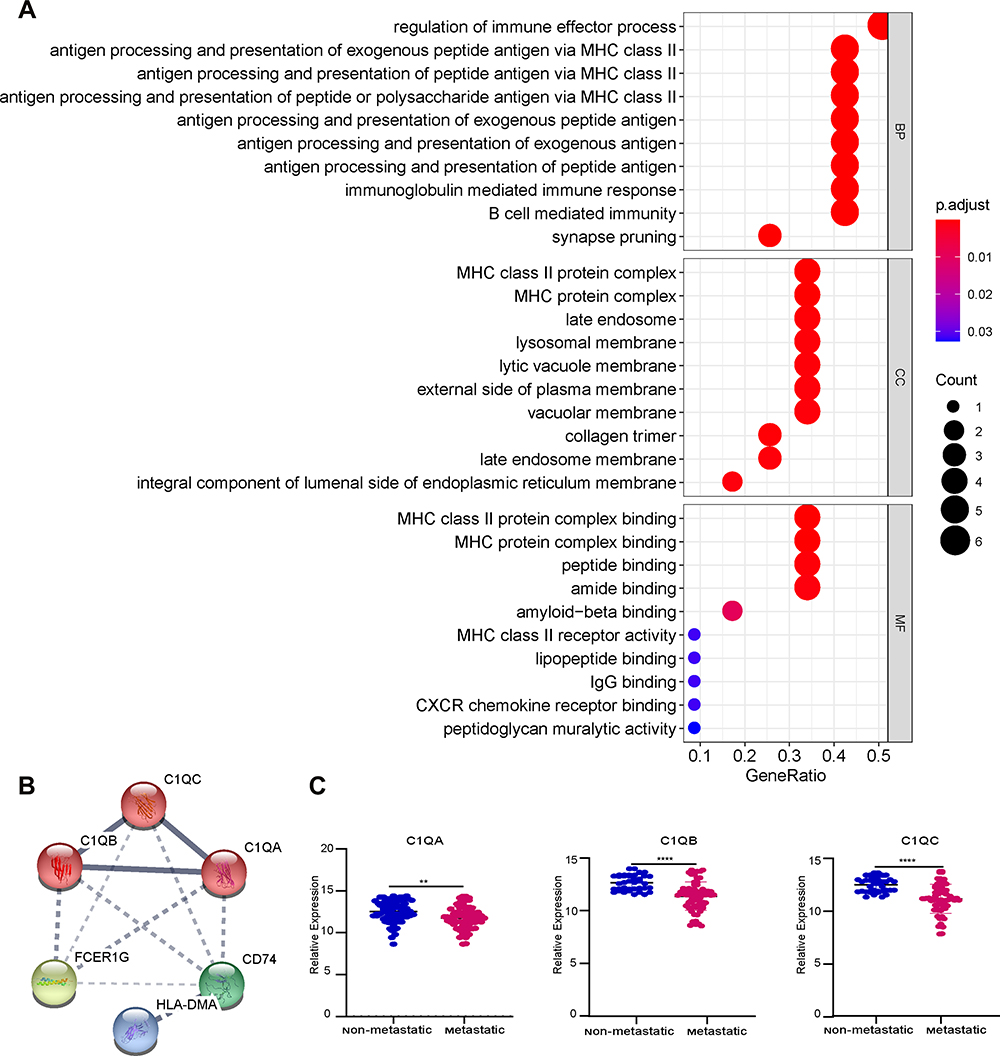 |
Figure 5 Hub gene screening. (A) The GO analysis of candidate genes. (B) Networks of interactions between 6 genes and K-means clustering. The solid line represents the stronger interaction between the 2 proteins and was clustered into one group, the dashed line represents the not-clustered group. (C) The expression level of 3 genes, C1QA, C1QB, and C1QC, in the combined dataset of 106 samples; blue represents the non-metastatic OS and red represents the metastatic OS. **p < 0.01, ****p < 0.0001. |
Results of Immune Infiltration Analysis
To predict immune cell infiltration in OS, we calculated the scores and percentage of the 22 immune cells in the combined OS dataset (n = 106) using the CIBERSORT algorithm. As shown in Figure 6A, the resting mast cells, macrophages M2, and macrophages M0 comprise a large proportion of the 22 immune cells in each sample. However, the difference between the immune scores of the 68 metastatic and 38 non-metastatic OS samples showed that only 3 types of immune cells, follicular helper T cells, memory B cells, and CD8 T cells were significantly lower in metastatic OS than in non-metastatic OS (p < 0.05) (Figure 6B). Subsequently, the correlation of C1QA, C1QB, and C1QC with follicular helper T cells, memory B cells, and CD8 T cells was analysed. As shown in Figure 7, follicular helper T cell, memory B cell, and CD8 T cells all exhibited a positive relationship with the expression of C1QA (Figure 7A), C1QB (Figure 7B), and C1QC (Figure 7C). These results suggest that C1QA, C1QB, and C1QC may be implicated in the regulation of immune infiltration in metastatic OS through follicular helper T cells, memory B cells, and CD8 T cells.
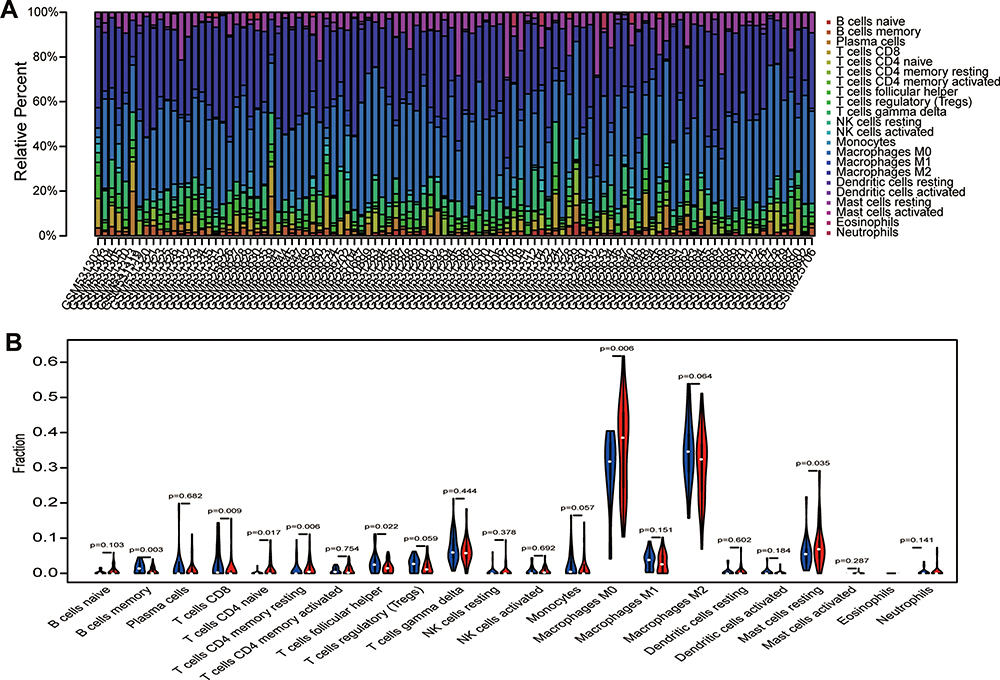 |
Figure 6 Analysis of immune infiltration. (A) 22 immune cell components were evaluated in the combined OS dataset (n = 106) using CIBERSORT. The X-axis and Y-axis indicate the sample and percentage, respectively; the colour represents the type of immune cell. (B) The varied proportions of 22 kinds of immune cells in non-metastatic and metastatic OS samples. Red represents the metastatic OS samples and blue represents the non-metastatic OS samples. |
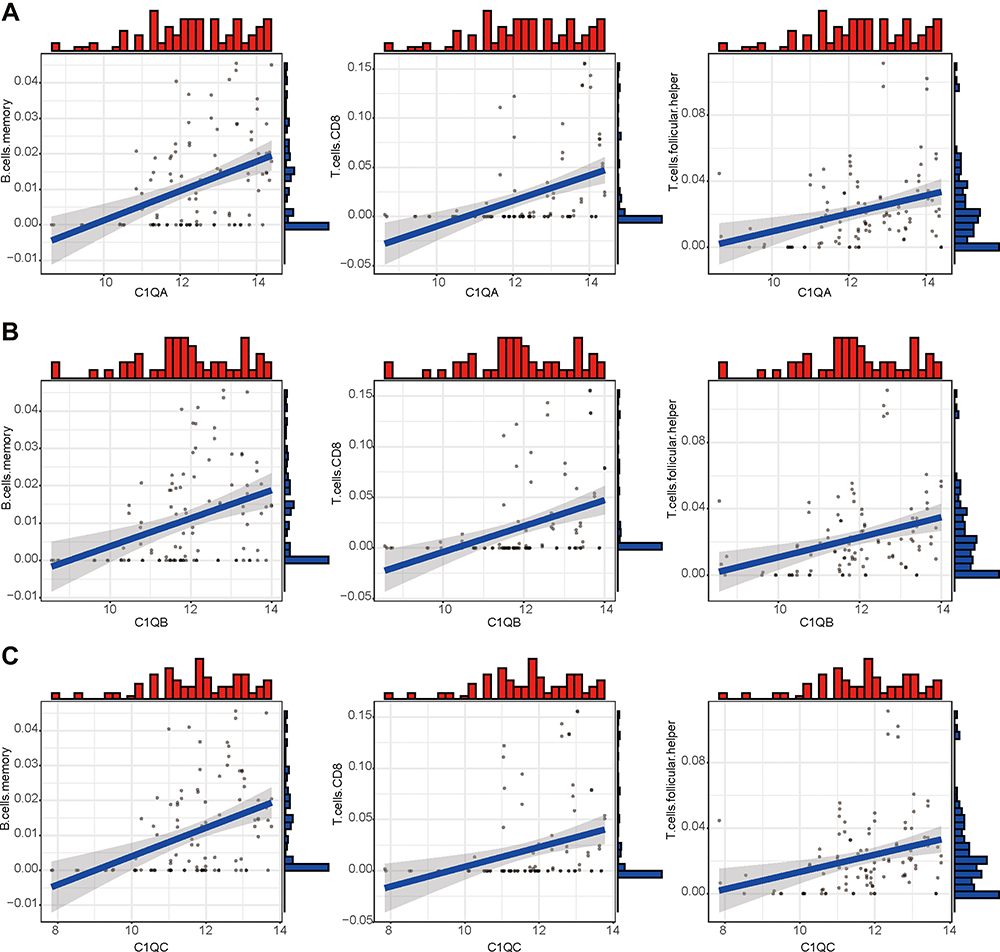 |
Figure 7 The correlation between expression of C1QA, C1QB, and C1QC and proportion of immune cells. Linear regression relationship of the 3 immune cells, memory B cells, CD8 T cells and follicular helper T cells with C1QA (A), C1QB (B), and C1QC (C). |
Validation of Key Gene Expression
To verify the expression levels of 3 key genes, C1QA, C1QB, and C1QC, in non-metastatic and metastatic OS, we performed quantitative RT-PCR analysis. As shown in Figure 8, compared with non-metastatic OS cells (MG63 and HOS cell lines), mRNA expression of the 3 key genes, C1QA (Figure 8A), C1QB (Figure 8B), and C1QC (Figure 8C) were all decreased in metastatic OS cells (143B and MNNG cell lines). In addition, Western blot analysis also showed the same results, in which the protein expression of these 3 genes was lower in metastatic OS cells than in non-metastatic OS cells (Figure 8D).
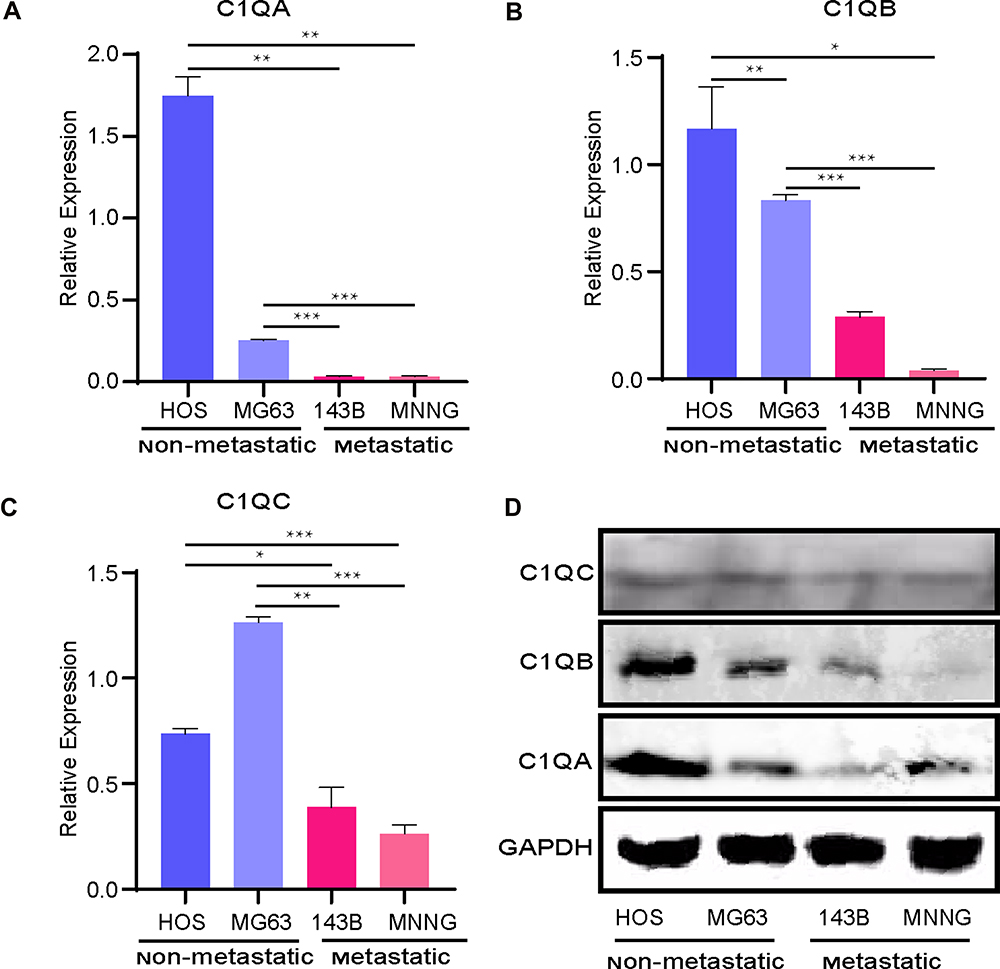 |
Figure 8 Relative mRNA expression of the key genes C1QA (A), C1QB (B), and C1QC (C) was determined in metastatic and non-metastatic OS cell lines by quantitative RT-PCR analysis. *p < 0.05, **p < 0.01, ***p < 0.001. (D) C1QA, C1QB, and C1QC protein expressions were detected in metastatic and non-metastatic OS cell lines by Western blot analysis. GAPDH was the loading control. |
Discussion
In this study, DEGs and key modules between non-metastatic and metastatic OS samples were determined using the WGCNA algorithm. Survival analysis and GO and PPI network analyses were performed to obtain the key genes. Finally, we identified 3 key genes, C1QA, C1QB, and C1QC, associated with OS metastasis and prognosis. Based on these results, we also revealed the association of these 3 pivotal genes with tumour immune infiltration and experimentally verified that the expression of C1Q is significantly downregulated in metastatic OS cell lines.
It is well known that C1QA, C1QB, and C1QC encode 3 polypeptide chains of the complement protein C1Q, which is the recognition subcomponent of the classical complement pathway during complement activation. Binding of C1Q to aggregated IgG molecules results in activation of the classical complement pathway.29 C1Q is implicated not only in the clearance of immune complexes and pathogens invading the body in immunoreaction but also in several pathological and physiological processes, such as cancer.30–32 A growing body of evidence demonstrates that C1Q plays a vital role in anti-tumorigenic processes. C1Q has been reported to be markedly reduced in several cancers, such as multiple myeloma33 and prostate cancer.34 Moreover, a recent study reported that C1Q is decreased significantly in prostatic cancer and benign prostatic hyperplasia compared with age-matched normal prostatic tissue samples. Downregulation of C1Q augments prostatic hyperplasia and cancer formation, and C1Q treatment induces apoptosis and growth suppression of prostatic cancer cells through induction of WW domain-containing oxidoreductase (WWOX), which is a tumour suppressor and destabilizer of cell adhesion.34 Furthermore, there are obvious differences in carcinogenesis progression between normal mice and mice with C1Q loss, in which C1Q-deficient mice exhibit rapid tumour growth related to a higher number of intratumoural vessels and accelerated spontaneous lung metastasis occurrence compared with wild-type mice.35 Donghu Yu’s results also showed that the expression of 3 genes, C1QA, C1QB, and C1QC, were significantly degraded in oesophageal squamous cell carcinoma compared with normal tissues by bioinformatics analysis.36 Interestingly, C1Q-mediated tumour-promoting functions have also been reported in other cancers. It has recently been found that C1Q can promote the proliferation, migration, and adhesion of primary cells in patients with malignant pleural mesothelioma.31 Bulla et al37 also found that C1Q contributes to the progression and invasion of melanoma tumours by promoting cancer cell growth and angiogenesis. These findings indicate that C1Q plays a dichotomous role in different types of carcinomas. In our study, the expression levels of 3 key genes, C1QA, C1QB, and C1QC, were significantly downregulated in metastatic OS, and GO term enrichment analysis revealed that these genes principally participate in lymphocyte-mediated immunity, lymphocyte response, synapse pruning, and regulation of acute inflammatory response, which is notably related to immune infiltrates in the OS microenvironment.
The carcinogenic process leading to the generation of OS is distinguished by multifaceted events and cellular heterogeneity of the OS microenvironment, and immune infiltrates are the main components of the OS microenvironment. Recent research has demonstrated that C1Q is indispensable for maintaining autoimmune tolerance and normal immunoreaction because it is a critical cofactor of non-specific immunity closely linked to the immune system. C1Q deficiency likely results in the emergence of an immunodeficient state, which causes abnormal physiological and pathological processes. For instance, several autoimmune diseases are strongly associated with C1Q defects, such as glomerulonephritis38 and systemic lupus erythematosus (SLE),39 and C1Q deficiency is by far the most penetrating cause of the disease.40–43 Thus, the downregulation of C1Q in metastatic OS patients likely results in abnormalities in physiological processes and serious outcomes. In addition, C1Q has been reported to promote tumour growth and metastasis.31,44 However, the development of C1Q and tumour metastasis in OS has not yet been reported. Although tumour metastasis is related to immunoreaction and is involved in immune infiltration, which is made up of numerous cell populations of immunity, and has been reported in OS,45,46 the relationship between C1Q and immune cell populations in the metastatic process of OS has not yet been fully elucidated. In the present study, we analysed 22 immune cells in OS samples by differential gene expression analysis and found that the ratio of only 3 kinds of immune cells, follicular helper T cells, memory B cells, and CD8 T cells, were significantly lower in metastatic OS samples. Equally important, we investigated the association between C1Q expression and immune infiltration levels in OS using CIBERSORT and found a positive correlation between C1QA, C1QB, and C1QC and CD8T cells, memory B cells, and follicular helper T cells, respectively. These results suggest that C1QA, C1QB, and C1QC are involved in the regulation of follicular helper T cells, memory B cells, and CD8 T cells in the immune infiltrates of OS.
In summary, we integrated several datasets of OS with sufficient samples to effectively increase the risk prediction models for bioinformatic analysis stability and accuracy. Next, we used OS cell lines for experimental validation instead of bioinformatics analysis alone, which further validated the accuracy and reliability of our analysis. We herein proposed for the first time, to our knowledge, that C1QA, C1QB, and C1QC are novel biomarkers of prognostic impact for OS, and identification of these 3 key genes may provide a new direction for the prediction and therapy of metastatic OS. Additionally, the relationship between these 3 genes and tumour immune infiltration may contribute to elucidating the role of C1QA, C1QB, and C1QC in immune cell infiltration, as well as the role of proteins that regulate these processes in the development of metastatic OS. Our results provide a cluster of biomarkers for further study of the underlying molecular mechanisms of metastatic OS. However, the effects of C1QA, C1QB, and C1QC on the process of OS and more in-depth molecular mechanisms are still unclear and need to be studied more thoroughly. Although our study identified 3 genes that may play a key role in OS metastasis and prognosis, there are some limitations to our research. For instance, the study is mainly based on bioinformatics analysis, and we need to accumulate more comprehensive experimental evidence, including in vitro and in vivo experiments. Additionally, only OS cell lines were used to compare the expression of key genes and the study lacked relevant OS tissue specimens.
Conclusions
We identified 3 crucial genes, C1QA, C1QB, and C1QC, which are downregulated in metastatic OS, related to tumour immune infiltration, and possibly good prognostic factors for predicting metastasis and prognosis of OS patients through bioinformatics analysis and experimental validation.
Ethical Approval
This article does not contain any studies with human participants or animals performed by any of the authors.
Acknowledgments
This study was financially supported by the National Key R&D Program of China (Grant No. 2018YFC1105900), the National Natural Science Fund of China (Grant No. 81972120), the Guangxi Science and Technology Base and Talent Special Project (Grant No. GuikeAD17129012), and the Guangxi Natural Science Foundation Program (Grant No. 2019GXNSFAA185004).
Author Contributions
H.H. and M.T. conceived the research, designed and conducted the experiments, analysed data, and wrote the manuscript; D.L. guided the cell experiments, provided financial and instrumental support, and provided final approval of the manuscript; B.Z. participated in the design and implementation of the experiments, revised drafts of the manuscript, and provided final approval of the manuscript; L.Z., G.Y., K.L, D.L., X.C., S.H., and J.Z. analysed data and implemented the experiments. All authors contributed to data analysis, drafting or revising the article, agreed on the journal to which the article will be submitted, gave final approval of the version to be published, and agreed to be accountable for all aspects of the work.
Disclosure
The authors declare no potential conflicts of interest.
References
1. International osteosarcoma incidence patterns in children and adolescents, middle ages and elderly persons - PubMed. Available from: https://pubmed.ncbi.nlm.nih.gov/19330840/.
2. Steffner RJ, Jang ES. Staging of bone and soft-tissue sarcomas. J Am Acad Orthop Surg. 2018;26:e269–e278. doi:10.5435/JAAOS-D-17-00055
3. The relationship between metastatic potential and in vitro mechanical properties of osteosarcoma cells | molecular biology of the cell. Available from: https://www.molbiolcell.org/doi/10.1091/mbc.E18-08-0545.
4. Anninga JK, Gelderblom H, Fiocco M, et al. Chemotherapeutic adjuvant treatment for osteosarcoma: where do we stand? Eur J Cancer. 2011;47:2431–2445. doi:10.1016/j.ejca.2011.05.030
5. Smeland S, Bielack SS, Whelan J, et al. Survival and prognosis with osteosarcoma: outcomes in more than 2000 patients in the EURAMOS-1 (European and American Osteosarcoma Study) cohort. Eur J Cancer. 2019;109:36–50. doi:10.1016/j.ejca.2018.11.027
6. Wedekind MF, Wagner LM, Cripe TP. Immunotherapy for osteosarcoma: where do we go from here? Pediatr Blood Cancer. 2018;65:e27227. doi:10.1002/pbc.27227
7. Hou J, Zhang H, Sun B, Karin M. The immunobiology of hepatocellular carcinoma in humans and mice: basic concepts and therapeutic implications. J Hepatol. 2020;72:167–182. doi:10.1016/j.jhep.2019.08.014
8. Casey SC, Amedei A, Aquilano K, et al. Cancer prevention and therapy through the modulation of the tumor microenvironment. Semin Cancer Biol. 2015;35(Suppl):S199–S223.
9. Steidl C, Lee T, Shah SP, et al. Tumor-associated macrophages and survival in classic Hodgkin’s lymphoma. N Engl J Med. 2010;362:875–885. doi:10.1056/NEJMoa0905680
10. Regulatory T cells in cancer immunotherapy - pubMed. Available from: https://pubmed.ncbi.nlm.nih.gov/27995907/.
11. Zhou Z-J, Xin H-Y, Li J, et al. Intratumoral plasmacytoid dendritic cells as a poor prognostic factor for hepatocellular carcinoma following curative resection. Cancer Immunol Immunother. 2019;68:1223–1233. doi:10.1007/s00262-019-02355-3
12. Qiu Y. Construction of a circRNA-miRNA-mRNA network based on competitive endogenous RNA reveals the function of circRNAs in osteosarcoma. Cancer Cell Int. 2020;12.
13. Wang J-Y, Wang J-Q, Lu S-B. miR-628-5p promotes growth and migration of osteosarcoma by targeting IFI44L. Biochem Cell Biol. 2020;98:99–105. doi:10.1139/bcb-2019-0001
14. Zhang W, Wei L, Sheng W, et al. miR-1225-5p functions as a tumor suppressor in osteosarcoma by targeting Sox9. DNA Cell Biol. 2020;39:78–91. doi:10.1089/dna.2019.5105
15. Chen B, Khodadoust MS, Liu CL, Newman AM, Alizadeh AA. Profiling tumor infiltrating immune cells with CIBERSORT. Methods Mol Biol. 2018;1711:243–259.
16. Vidotto T, Nersesian S, Graham C, Siemens DR, Koti M. DNA damage repair gene mutations and their association with tumor immune regulatory gene expression in muscle invasive bladder cancer subtypes. J Immunother Cancer. 2019;7:148. doi:10.1186/s40425-019-0619-8
17. Chen H, Chong W, Teng C, et al. The immune response-related mutational signatures and driver genes in non-small-cell lung cancer. Cancer Sci. 2019;110:2348–2356. doi:10.1111/cas.14113
18. Ali HR, Chlon L, Pharoah PDP, Markowetz F, Caldas C, Ladanyi M. Patterns of immune infiltration in breast cancer and their clinical implications: a gene-expression-based retrospective study. PLoS Med. 2016;13:e1002194. doi:10.1371/journal.pmed.1002194
19. Buddingh EP, Kuijjer ML, Duim RAJ, et al. Tumor-infiltrating macrophages are associated with metastasis suppression in high-grade osteosarcoma: a rationale for treatment with macrophage activating agents. Clin Cancer Res. 2011;17:2110–2119. doi:10.1158/1078-0432.CCR-10-2047
20. Kuijjer ML, van den Akker BE, Hilhorst R, et al. Kinome and mRNA expression profiling of high-grade osteosarcoma cell lines implies Akt signaling as possible target for therapy. BMC Med Genomics. 2014;7:4. doi:10.1186/1755-8794-7-4
21. Ren L, Mendoza A, Zhu J, et al. Characterization of the metastatic phenotype of a panel of established osteosarcoma cells. Oncotarget. 2015;6:29469–29481. doi:10.18632/oncotarget.5177
22. Langfelder P, Horvath S. WGCNA: an R package for weighted correlation network analysis. BMC Bioinform. 2008;9:559. doi:10.1186/1471-2105-9-559
23. Liu X, Hu AX, Zhao JL, et al. Identification of Key Gene Modules for in Human Osteosarcoma by Co-expression Analysis weighted gene coexpression network analysis (WGCNA). J Cell Biochem. 2017;118:3953–3959. doi:10.1002/jcb.26050.
24. Chen H, Boutros PC. VennDiagram: a package for the generation of highly-customizable Venn and Euler diagrams in R. BMC Bioinform. 2011;12:35. doi:10.1186/1471-2105-12-35
25. Yu G, Wang L-G, Han Y, He Q-Y. clusterProfiler: an R package for comparing biological themes among gene clusters. OMICS. 2012;16:284–287. doi:10.1089/omi.2011.0118
26. Walter W, Sánchez-Cabo F, Ricote M. GOplot: an R package for visually combining expression data with functional analysis. Bioinformatics. 2015;31:2912–2914. doi:10.1093/bioinformatics/btv300
27. Szklarczyk D, Gable AL, Lyon D, et al. STRING v11: protein-protein association networks with increased coverage, supporting functional discovery in genome-wide experimental datasets. Nucleic Acids Res. 2019;47:D607–D613. doi:10.1093/nar/gky1131
28. Newman AM, Liu CL, Green MR, et al. Robust enumeration of cell subsets from tissue expression profiles. Nat Methods. 2015;12:453–457. doi:10.1038/nmeth.3337
29. Sim RB, Laich A. Serine proteases of the complement system. Biochem Soc Trans. 2000;28:545–550. doi:10.1042/bst0280545
30. Kaur A, Sultan SHA, Murugaiah V, et al. Human C1q induces apoptosis in an ovarian cancer cell line via tumor necrosis factor pathway. Front Immunol. 2016;7:599. doi:10.3389/fimmu.2016.00599
31. Agostinis C, Vidergar R, Belmonte B, et al. Complement protein C1q binds to hyaluronic acid in the malignant pleural mesothelioma microenvironment and promotes tumor growth. Front Immunol. 2017;8:1559. doi:10.3389/fimmu.2017.01559
32. Son M, Diamond B, Santiago-Schwarz F. Fundamental role of C1q in autoimmunity and inflammation. Immunol Res. 2015;63:101–106. doi:10.1007/s12026-015-8705-6
33. Yang R, Huang J, Ma H, et al. Is complement C1q a potential marker for tumor burden and immunodeficiency in multiple myeloma? Leuk Lymphoma. 2019;60:1812–1818. doi:10.1080/10428194.2018.1543883
34. Hong Q, Sze C-I, Lin S-R, et al. Complement C1q activates tumor suppressor WWOX to induce apoptosis in prostate cancer cells. PLoS One. 2009;4:e5755. doi:10.1371/journal.pone.0005755
35. Bandini S, Macagno M, Hysi A, et al. The non-inflammatory role of C1q during Her2/neu-driven mammary carcinogenesis. Oncoimmunology. 2016;5:e1253653. doi:10.1080/2162402X.2016.1253653
36. Yu D, Ruan X, Huang J, et al. Comprehensive analysis of competitive endogenous RNAs network, being associated with esophageal squamous cell carcinoma and its emerging role in head and neck squamous cell carcinoma. Front Oncol. 2019;9:1474. doi:10.3389/fonc.2019.01474
37. Bulla R, Tripodo C, Rami D, et al. C1q acts in the tumour microenvironment as a cancer-promoting factor independently of complement activation. Nat Commun. 2016;7:10346. doi:10.1038/ncomms10346
38. PTX3, anti-PTX3, and anti-C1q autoantibodies in lupus glomerulonephritis - PubMed. Available from: https://pubmed.ncbi.nlm.nih.gov/25805362/.
39. Guo J, Gao Y, Wang Y, et al. Investigation of C1-complex regions reveals new C1Q variants associated with protection from systemic lupus erythematosus, and affect its transcript abundance. Sci Rep. 2018;8:8048. doi:10.1038/s41598-018-26380-x
40. Jlajla H, Sellami MK, Sfar I, et al. New C1q mutation in a Tunisian family. Immunobiology. 2014;219:241–246. doi:10.1016/j.imbio.2013.10.010
41. Walport MJ, Davies KA, Botto M. C1q and systemic lupus erythematosus. Immunobiology. 1998;199:265–285. doi:10.1016/S0171-2985(98)80032-6
42. Stegert M, Bock M, Trendelenburg M. Clinical presentation of human C1q deficiency: how much of a lupus? Mol Immunol. 2015;67:3–11. doi:10.1016/j.molimm.2015.03.007
43. van Schaarenburg RA, Schejbel L, Truedsson L, et al. Marked variability in clinical presentation and outcome of patients with C1q immunodeficiency. J Autoimmun. 2015;62:39–44. doi:10.1016/j.jaut.2015.06.002
44. Kim K-B, Yi J-S, Nguyen N, et al. Cell-surface receptor for complement component C1q (gC1qR) is a key regulator for lamellipodia formation and cancer metastasis. J Biol Chem. 2011;286:23093–23101. doi:10.1074/jbc.M111.233304
45. Liu T, Fang X-C, Ding Z, et al. Pre-operative lymphocyte-to-monocyte ratio as a predictor of overall survival in patients suffering from osteosarcoma. FEBS Open Bio. 2015;5:682–687. doi:10.1016/j.fob.2015.08.002
46. Inagaki Y, Hookway E, Williams KA, et al. Dendritic and mast cell involvement in the inflammatory response to primary malignant bone tumours. Clin Sarcoma Res. 2016;6:13. doi:10.1186/s13569-016-0053-3
 © 2021 The Author(s). This work is published and licensed by Dove Medical Press Limited. The full terms of this license are available at https://www.dovepress.com/terms.php and incorporate the Creative Commons Attribution - Non Commercial (unported, v3.0) License.
By accessing the work you hereby accept the Terms. Non-commercial uses of the work are permitted without any further permission from Dove Medical Press Limited, provided the work is properly attributed. For permission for commercial use of this work, please see paragraphs 4.2 and 5 of our Terms.
© 2021 The Author(s). This work is published and licensed by Dove Medical Press Limited. The full terms of this license are available at https://www.dovepress.com/terms.php and incorporate the Creative Commons Attribution - Non Commercial (unported, v3.0) License.
By accessing the work you hereby accept the Terms. Non-commercial uses of the work are permitted without any further permission from Dove Medical Press Limited, provided the work is properly attributed. For permission for commercial use of this work, please see paragraphs 4.2 and 5 of our Terms.