")
Back to Journals » Clinical Interventions in Aging » Volume 13
Prognostic ability of cystatin C and homocysteine plasma levels for long-term outcomes in very old acute myocardial infarction patients
Authors Fu Z , Yang X, Shen M, Xue H, Qian G, Cao F, Guo J, Dong W, Chen Y
Received 8 September 2017
Accepted for publication 17 April 2018
Published 3 July 2018 Volume 2018:13 Pages 1201—1209
DOI https://doi.org/10.2147/CIA.S151211
Checked for plagiarism Yes
Review by Single anonymous peer review
Peer reviewer comments 3
Editor who approved publication: Dr Zhi-Ying Wu
Zhenhong Fu,1,* Xia Yang,1,* Mingzhi Shen,2,* Hao Xue,1,* Geng Qian,1 Feng Cao,1 Jun Guo,1 Wei Dong,1 Yundai Chen1
1Department of Cardiology, Chinese People’s Liberation Army General Hospital, Beijing, China; 2Department of Cardiology, Hainan Branch of Chinese People’s Liberation Army General Hospital, Sanya, Hainan, China
*These authors contributed equally to this work
Background and aims: This study sought to evaluate the prognostic powers of combined use of cystatin C (Cys C) and homocysteine (Hcy) at predicting adverse events of patients >80 years old with acute myocardial infarction (AMI).
Patients and methods: The analysis involved 753 patients >80 years old undergoing coronary angiography for chest pain in China from January 2006 to December 2012. Kaplan–Meier method was used for survival and major adverse cardiac events (MACE) rates. Multivariate Cox regression was performed to identify mortality predictors. Receiver operating characteristic curve analysis was performed to predict the cutoff values of Cys C and Hcy for all-cause mortality.
Results: The duration of follow-up was 40–116 months (median, 63 months; interquartile range, 51–74 months). The long-term survival and event-free survival rates of AMI patients were significantly lower than those of unstable angina pectoris patients (P<0.05), and were significantly different according to the tertile concentration of Cys C of AMI patients (P<0.01). Cys C and Hcy were independent risk factors for long-term all-cause mortality (odds ratio [OR] =3.72 [2.27–6.09]; OR =1.59 [1.04–2.61]) and MACE (OR =2.83 [1.82–4.40]; OR =1.09 [1.04–1.21]) of AMI patients. The predictive cutoff value of Cys C was 1.815 mg/L (82.8%, 86.4%) and that of Hcy was 15.06 µmol/L (84.4%, 83.1%) in AMI patients. Combined use of both biomarker’s cutoff values further increased the sensitivity and specificity of all-cause mortality.
Conclusion: Cys C is a strong independent predictor of long-term all-cause death and MACE in very old AMI patients. The combined use of Cys C and Hcy further improves the predictive accuracy.
Keywords: cystatin C, homocysteine, very old, acute myocardial infarction, prognosis
Introduction
In 2015, the leading cause of death due to a noncommunicable disease was cardiovascular disease (17.9 million). The global cardiovascular death rate rose by 12.5% from 2005 to 2015, and during this same period, deaths due to ischemic heart disease increased by 16.6% to 8.9 million deaths.1 The incidence of acute myocardial infarction (AMI) continues to rise and the situation in China is becoming increasingly severe. There are over 290 million Chinese patients with cardiovascular disease with AMI accounting for 2.5 million of those. The morbidity and mortality of AMI are still rising rapidly. The proportion of elderly patients is increasing rapidly. By the end of 2050, the elderly population will exceed 100 million. Age is an independent risk factor for poor prognosis of AMI.
Cystatin C (Cys C) is a small 13-kDa cysteine protease inhibitor. It is freely filtered, neither secreted nor reabsorbed into the bloodstream. The general consensus has been accepted that Cys C is a more sensitive marker of early renal insufficiency.2–4 Cys C is a novel biomarker of cardiovascular disease. Several studies have suggested that increased plasma levels of Cys C are associated with the increased risk of cardiovascular disease and mortality5,6 in the elderly7 and in different patient populations.8,9 Serum Cys C may be a predictor of disease severity in elderly hypertensive patients with coronary heart disease.10 In addition, baseline Cys C levels play a prognostic role in long-term adverse outcomes of coronary artery disease (CAD) and heart failure.11 Serum Cys C has also been shown to correlate with angiographic coronary collateralization in patients with stable CAD12 and associated with CAD and its severity.13 However, some other studies have confirmed that there is no causal relationship between plasma Cys C and CAD.14
Homocysteine (Hcy) is a nonessential amino acid that is known as a marker of endothelial injury. Elevated total Hcy is known to be able to increase oxidative stress, diminish vasodilation, stimulate the proliferation of vascular smooth muscle cells, alter the elastic properties of the vascular wall, and thus increase the risk for atherosclerosis. There is a direct association between total Hcy and coronary heart disease in the general population.15–17
Our earlier studies indicated that Cys C is an independent risk factor for the prognosis of old acute coronary syndrome (ACS) patients with diabetes,18 and Hcy is an independent risk factor for the outcome of old ACS patients too.19
However, prior studies were limited by sample size, follow-up time, study population, and differences in the cutoff values. There were no novel markers associated with very long-term outcomes of very old AMI patients. We hypothesized that Cys C and Hcy were independent risk factors for very long-term prognosis of Chinese very old AMI patients, and the combined evaluation may provide stronger diagnostic power.
Patients and methods
Study population
We performed a prospective cohort study in Chinese People’s Liberation Army (PLA) General Hospital cardiac center from January 2006 to December 2012. A total of 720 patients who were >80 years old, hospitalized for ACS, and underwent coronary angiography examination were enrolled by 10 cardiologists. A total of 100 patients who were >80 years old, hospitalized for chest tightness or chest pain, but whose coronary angiography revealed nonobstructive stenosis were enrolled in the control group. Exclusion criteria included malignancy, severe valvular heart disease, primary pulmonary hypertension, severe liver dysfunction, metabolic diseases, and rheumatic immune diseases. The study was approved by Chinese PLA General Hospital Ethics Service. All patients provided written informed consent for this study including to undergo coronary angiography examination and treatments and to be followed up for outcomes in the longer term.
Clinical data
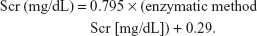
Demographic characteristics, cardiovascular risk factors (primary hypertension, diabetes, hyperlipidemia, previous myocardial infarction [MI], previous stroke, chronic renal failure [CRF], and smoking), baseline blood features (total cholesterol, low density lipoprotein-C, fasting blood glucose, uric acid, Hcy, and Cys C), and clinical and treatment data were collected by trained doctors after patient admission. Renal function was assessed using the baseline estimated glomerular filtration rate (eGFR). Impaired renal function was defined as an eGFR <60 mL/min/1.73 m2. Creatinine was standardized using a calibration equation called Jaffe’s kinetic method:
|
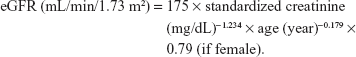
eGFR was calculated using the Chinese modified Modification of Diet in Renal Disease equation:
|
Coronary angiogram acquisition and analysis, and selection of treatment
Coronary angiograms were acquired during usual care with cardiac catheter laboratory X-ray and information technology equipment. All coronary angiograms were analyzed on a single image analysis software platform. Quantitative coronary analysis of the culprit vessel was performed by trained observers using standard methods.
The severity of coronary stenosis was expressed by Gensini score. The locations of coronary artery lesions and proportion of those with multivessel disease were recorded. According to the results of coronary angiography, intensive drug therapy, percutaneous coronary intervention (PCI), or coronary artery bypass grafting (CABG) were performed.
Patient grouping and study outcomes
Patients were divided into the unstable angina pectoris (UAP) and the AMI groups according to the guidelines of American College of Cardiology. Patients with chest pain and normal angiography were enrolled as the control group. Patients were followed up once every 12 months after discharge and major adverse cardiac events (MACE) were recorded. The primary outcomes of this study were all-cause death, MACE (including recurrent MI, repeat revascularization [PCI or CABG]). All-cause death was defined as death from any reason including cardiovascular and non-cardiovascular causes. Recurrent MI was defined as recurrent clinical features with new electrocardiographic findings that were compatible with MI, or increased levels of biochemical markers.
Statistical analysis
All statistical analyses were performed using SPSS software version 19.0 (IBM Corporation, Armonk, NY, USA). A P-value <0.05 was considered to be statistically significant. Categorical variables were expressed as number and percentage. Most continuous variables followed a normal distribution and were therefore presented as means together with SDs. Those variables that did not follow a normal distribution were presented as medians with interquartile range (IQR). Differences in continuous variables between groups were assessed by Student’s t-test or analysis of variance for continuous data with normal distribution, or otherwise the nonparametric Mann–Whitney test or Kruskal–Wallis H test. Differences in categorical variables between groups were assessed using the chi-square test. Multiple Cox proportional regression analysis (odds ratio [OR], 95% CI) was used to identify potential clinical predictors of all-cause death and MACE. Survival analysis was performed using Kaplan–Meier method. Survival curves were used to investigate the effect of different diagnoses and Cys C on long-term all-cause death and MACE. Receiver operating characteristic (ROC) curves were constructed for discrimination between surviving and dead patients. The areas under the curve (AUC) were compared by using Hanley and McNeil method.
Results
Baseline characteristics for the overall population
Of the 720 patients in this cohort, 580 patients had UAP, 140 patients had AMI, and 699 patients (699/720, 97.08%) provided informed consent and agreed to participate in the study. A total of 100 patients were enrolled in the control group, 93 of whom provided informed consent and agreed to participate in the study (93/100, 93%).
Compared with the UAP and control groups, the AMI group had lower systolic blood pressure (SBP), diastolic blood pressure (DBP), and eGFR (P<0.01) but higher heart rate, plasma fasting blood glucose, uric acid, Hcy, and Cys C levels (P<0.01). The proportion of previous MI in the UAP group was significantly higher than that in the AMI group (P<0.01). There were no significant differences in the above indicators between the UAP group and the control group (P>0.05).
In the AMI group, the Cys C level and Hcy level were decreased with eGFR level (P<0.01). Further analysis indicated that the Hcy level was positively correlated with Cys C level (r=0.720, P=0.001) and negatively correlated with eGFR (r=−0.531, P=0.001), and the Cys C level was negatively correlated with eGFR (r=−0.743, P=0.001).
The left ventricular ejection fraction (LVEF) in the AMI group was significantly lower than that in the UAP group (P<0.01) and the LVEF of the UAP group was significantly lower than that of the control group (P<0.01). No significant differences were found in other general conditions and clinical data (Table 1).
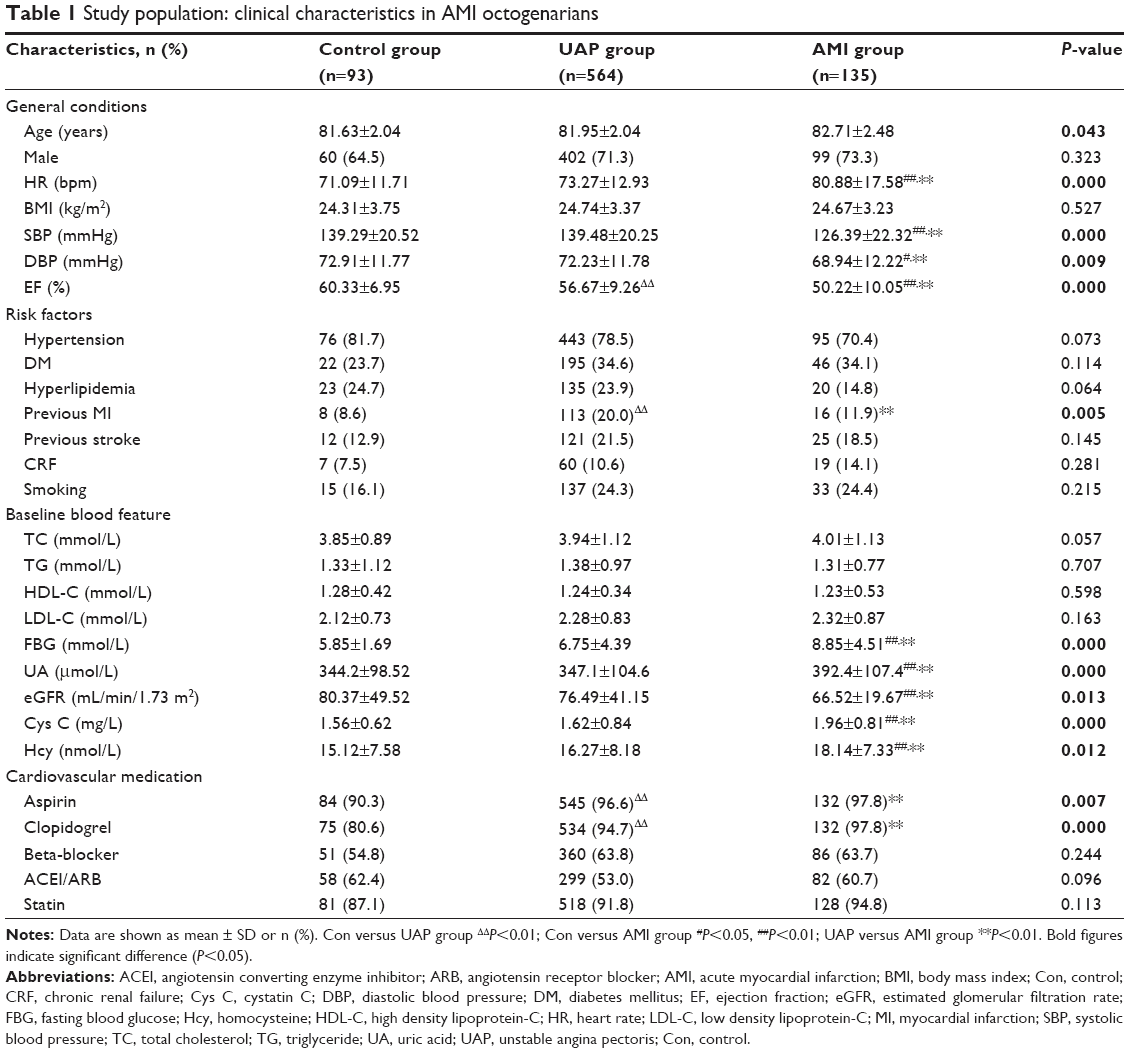 | Table 1 Study population: clinical characteristics in AMI octogenarians |
Severity of CAD and choice of treatment strategy
We compared the severity of CAD and the choice of clinical treatment strategy between the UAP and AMI groups. The proportion of lesions in the left anterior descending (LAD) artery, left circumflex (LCX) artery, and right coronary artery (RCA) in the AMI group was significantly higher than those in the UAP group (P<0.01). The proportion of patients with multivessel disease and the severity of coronary artery stenosis (Gensini score) were also significantly higher in the AMI group than those in the UAP group (P<0.01). There was no significant difference in the proportion of left main (LM) lesion between the two groups (P>0.05).
All patients accepted to undertake intensive medication. The proportion of PCI in the AMI group was higher than that in the UAP group (P<0.01), and the proportion of only intensive drug therapy in the AMI group was lower than that in the UAP group (P<0.01). The proportion of CABG in the two groups was similar (P>0.05).
For the selection of the PCI target vessel, the proportion of LAD interventions in the AMI group was higher than that in the UAP group (P<0.01). There were no significant differences between the two groups in the proportions of LM, LCX, and RCA interventions (P>0.05). The ratio of stent implantation in the AMI group was higher than that in the UAP group (P<0.05). There was no significant difference in the number of stents implanted between the two groups (P>0.05) (Table 2).
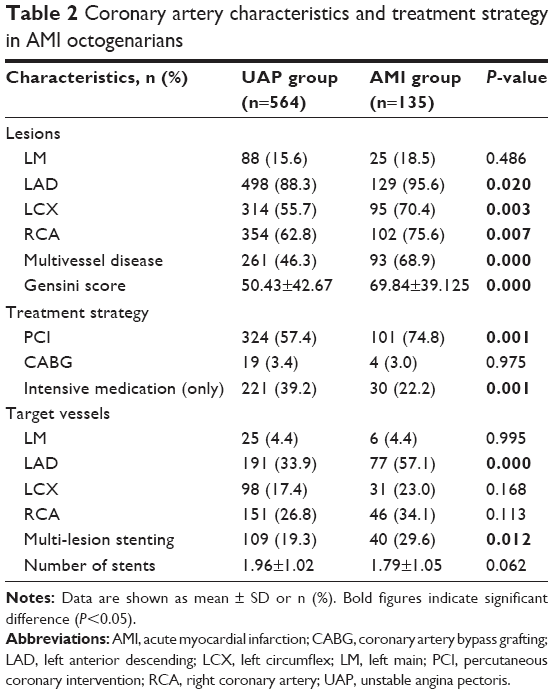 | Table 2 Coronary artery characteristics and treatment strategy in AMI octogenarians |
Long-term prognosis of patients
One hundred and thirty patients with AMI, 534 patients with UAP, and 89 cases in the control group had long-term follow-up data completed.
The duration of follow-up was 40–116 months (median, 63 months; IQR, 51–74 months). The all-cause mortality rates were 50.0% (65/130), 25.47% (136/534), and 12.36% (11/89) for the AMI, UAP, and control groups (P<0.0001), respectively. For cardiovascular mortality, the long-term rates were 34.62% (45/130) for AMI patients, 12.92% (69/534) for UAP patients, and 5.62% (5/89) for control group patients (P<0.0001). For non-cardiovascular mortality, the long-term rates were 15.38% (20/130) for AMI patients, 12.55% (67/534) for UAP patients, and 6.74% (6/89) for control group patients. The ratios of cardiovascular mortality to non-cardiovascular mortality were 2.25, 1.03, and 0.83 for AMI, UAP, and control group patients (P<0.0001), respectively. The recurrence of MI and repeat PCI was 4.62% (6/130) and 3.85% (5/130) for AMI patients, 3.56% (19/534) and 9.36% (50/534) for UAP patients, 1.12% (1/89) and 0% (0/89) for control group patients. The MACE rates were 58.46% (76/130), 38.39% (205/534), and 13.48% (12/89) for AMI, UAP, and control group patients (P<0.0001), respectively. There was a significant difference in the incidence of MACE, all-cause mortality, cardiovascular mortality, non-cardiovascular mortality, and repeat PCI between the three groups.
Kaplan–Meier survival curves analysis showed that long-term survival (P<0.0001) and event-free survival (P<0.0001) rates were significantly different between the three groups. The long-term survival and event-free survival rates of AMI patients were significantly lower than those of UAP patients (P<0.05) (Figure 1A and B).
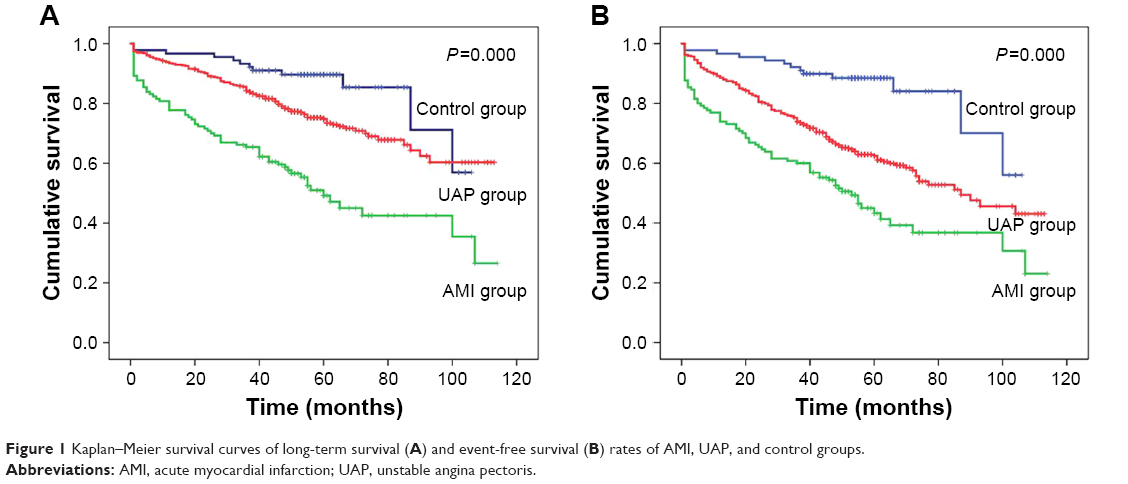 | Figure 1 Kaplan–Meier survival curves of long-term survival (A) and event-free survival (B) rates of AMI, UAP, and control groups. |
Long-term prognostic independent risk factors
Cox regression analysis was performed to determine the factors that were associated with all-cause death and MACE at the end of follow-up. After being adjusted for general conditions (sex, body mass index, SBP, DBP, and LVEF), risk factors (diabetes mellitus [DM], hypertension, hyperlipidemia, previous MI, stroke, and CRF), and blood biochemistry indicators (triglyceride, total cholesterol, high density lipoprotein-C, low density lipoprotein-C, fasting blood glucose, and uric acid), age, heart rate, eGFR, Hcy, and Cys C were found to be independent risk factors for all-cause mortality in AMI patients. Age, heart rate, DBP, eGFR, Hcy, and Cys C were independent risk factors for MACE in AMI patients. Heart rate, eGFR, Hcy, and Cys C were independent risk factors for all-cause mortality in UAP patients. Cys C was an independent risk factor for MACE in UAP patients (Table 3).
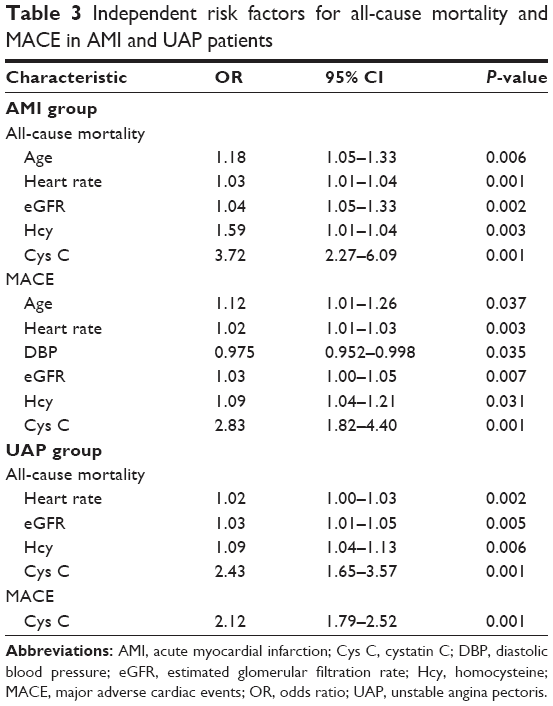 | Table 3 Independent risk factors for all-cause mortality and MACE in AMI and UAP patients |
The concentration of Cys C related to all-cause death according to tertile was compared between the AMI and the UAP groups. According to the triplicate of plasma Cys C, patients were divided into three groups. Tertiles (T) ranges of Cys C were group T1: 0.99 (0.46–1.22) mg/L, group T2: 1.37 (1.23–1.63) mg/L, and group T3: 2.10 (1.64–7.69) mg/L. There were 34 AMI patients and 184 UAP patients in group T1, 26 AMI patients and 196 UAP patients in group T2, 70 AMI patients and 154 UAP patients in group T3. All-cause mortalities in the T3 group were significantly higher than those in T1 and T2 groups for both AMI and UAP patients (Figure 2).
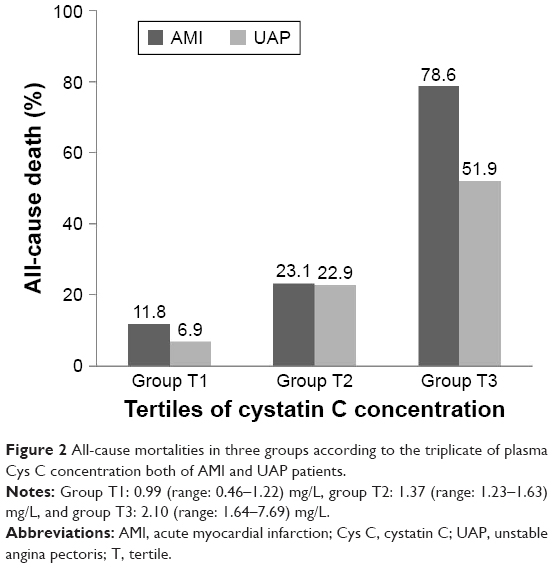 | Figure 2 All-cause mortalities in three groups according to the triplicate of plasma Cys C concentration both of AMI and UAP patients. |
Cox regression analysis showed that Cys C was an independent risk factor for all-cause mortality in the T2 group (OR =2.28, 95% CI =1.89–2.62, P=0.003) and the T3 group (OR =5.23, 95% CI =2.52–10.87, P=0.000) of AMI patients and in the T3 group (OR =2.59, 95% CI =2.12–3.16, P=0.001) of UAP patients.
Kaplan–Meier survival curves analysis showed that long-term survival (P<0.0001) and event-free survival (P<0.0001) rates were significantly different according to the tertile concentration of Cys C in AMI patients. Group T3 showed the lowest long-term survival and event-free survival rates (Figure 3A and B).
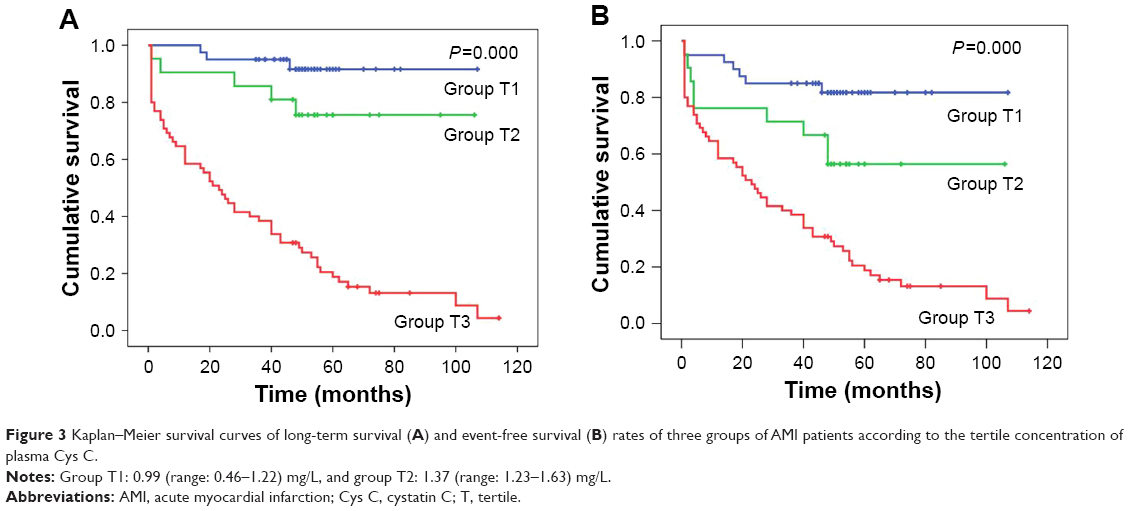 | Figure 3 Kaplan–Meier survival curves of long-term survival (A) and event-free survival (B) rates of three groups of AMI patients according to the tertile concentration of plasma Cys C. |
Diagnostic powers of Cys C and Hcy for long-term all-cause death
The respective predictive cutoff values were constructed according to the ROC curves of Cys C and Hcy for discrimination between surviving and dead patients in the AMI group (Figure 4). The AUC of Cys C was 0.892 (95% CI =0.836–0.948, P=0.0001) and the predictive cutoff value for all-cause mortality was 1.815 mg/L (sensitivity 82.8%, specificity 86.4%). The AUC of Hcy was 0.904 (95% CI =0.849–0.958, P=0.0001) and predictive cutoff value for all-cause mortality was 15.06 μmol/L (sensitivity 84.4%, specificity 83.1%).
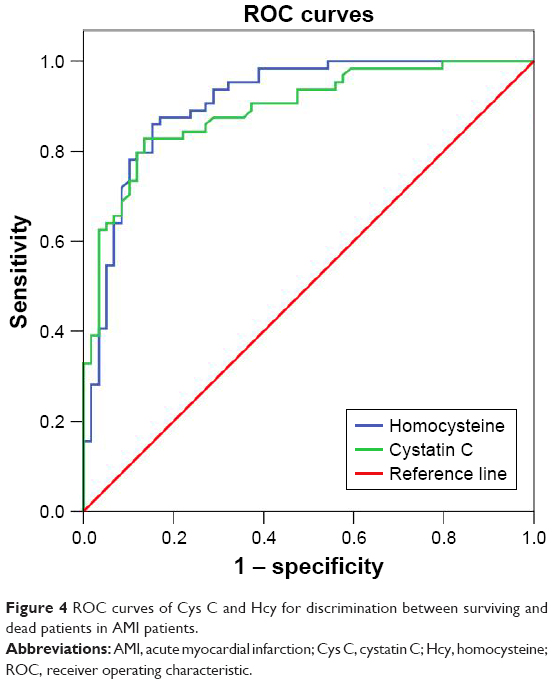 | Figure 4 ROC curves of Cys C and Hcy for discrimination between surviving and dead patients in AMI patients. |
According to the cutoff values of Cys C and Hcy, AMI patients were divided into three groups: group 1 (Cys C ≤1.815 mg/L and Hcy ≤15.06 μmol/L), group 2 (Cys C >1.815 mg/L and Hcy ≤15.06 μmol/L or Cys C ≤1.815 mg/L and Hcy >15.06 μmol/L), and group3 (Cys C >1.815 mg/L and Hcy >15.06 μmol/L). The mortality rates were 10.7% (6/56), 56.3% (9/16), and 86.2% (50/58), respectively, in groups 1, 2, and 3 (P<0.0001). A further rise in mortality was noted if the patients presented with two biomarkers higher than the cutoff values derived from the ROC analysis (group 3). This result implied that elevation of the biomarkers was helpful for discriminating the development of all-cause death.
Discussion
The key findings of this study are as follows: 1) baseline Cys C is a strong predictor of all-cause death and MACE in elderly patients admitted with both AMI and UAP; 2) the predictive ability of Cys C in elderly AMI patients is far higher than that in elderly UAP patients; 3) the predictive ability of Cys C in elderly AMI patients increases with increasing concentrations of Cys C; 4) the predictive ability of the combined use of Cys C and Hcy in elderly AMI patients is stronger than Cys C or Hcy alone; and 5) with the extension of follow-up time, the effect of Cys C on prognosis is more obvious in elderly AMI patients.
Accurate screening and assessment of the risk factors for the long-term outcomes play a major role in AMI patients, especially for very old patients. In recent years, a number of large, randomized, controlled clinical trials have been conducted. The GRACE20 study showed that eight factors were predictors of death for ACS, wherein age was the most powerful one. Some of our results were consistent with results of the GRACE study; for example, the heart rate was higher, and the SBP and the ejection fraction were lower in the AMI group than those in the UAP group, so that the number of all-cause deaths in the AMI group was higher than that in the UAP group. However, since age was the most important factor and all of the patients in our study were older than 80, the GRACE scores were all higher than 140, and thus were in the very high-risk group. Therefore, there is a need for some new variables to further help the risk stratification for death and MACE.
Some new biomarkers have showed improved GRACE risk score prediction of clinical outcomes21–26 and some new risk assessment tools incorporating new biomarkers for cardiovascular events in ACSs have been created too.27–31 All of the improvements of these risk prediction tools were mainly to improve the accuracy of the prognosis of ACS. However, until now, there is no assessment tool for the long-term prognosis of AMI patients over 80 years old.
Our study suggests that, in addition to the traditional factors in the GRACE score, plasma Cys C and Hcy are independent risk factors for extremely long-term all-cause mortality and MACE in elderly AMI patients, and their combined use resulted in better evaluation. There was a strong positive relation between Cys C and Hcy.
DM is a traditional risk factor for poor prognosis of ACS. Our study found that, although the proportion of DM in the AMI group was similar to that in the UAP group, the fasting blood glucose level in the AMI group was significantly higher than that in the UAP group. These results indicated that firstly AMI was a stressful condition, which may cause acute hyperglycemia; secondly, poor control of the blood glucose level may aggravate poor prognosis in old AMI patients. Our results were in agreement with another recent study that indicated that blood glucose level on admission ≥160 mg/dL was an independent predictor of mortality in ACS patients.32
The ratios of multivessel disease and coronary artery severe stenosis in the AMI group were higher than those in UAP patients. In the real world, for elderly AMI patients, the ratio of partial revascularization is higher than total revascularization, and the number of implanted stents was relatively less. During the procedure of PCI, as the critical artery, LAD was more often chosen as the target vessel and implanted stents. Similarly, the proportion of CABG remained low in the selection of revascularization strategy in elderly AMI patients, which may be related to the prevalence of more cardiovascular risk factors in very old patients.
Plasma Cys C concentrations in the AMI group were significantly higher than that of the UAP or the control group, and no significant difference was found between the latter two groups, although coronary artery stenosis was severe in the UAP group. In this study, the level of Cys C in the control group was significantly higher than that in 60-year-old AMI and stable coronary heart disease patients.33–35
These results suggest that in the elderly population, the plasma Cys C level generally increased, but there was no obvious correlation between the severity of coronary artery stenosis and the Cys C level. Cys C was associated with coronary plaque instability. When AMI occurred, due to coronary plaque rupture, local inflammatory factors and platelets were activated, and the Cys C level increased quickly. This may explain why Cys C was closely related with AMI, and more obvious in the elderly population. However, the causal relationship between the two aspects needs to be confirmed by further study.
Previous studies of our group found that Cys C was an independent risk factor for prognosis in old ACS patients with DM18 and Hcy was an independent risk factor for prognosis in old ACS patients. In this study, the study population was further refined and the follow-up time was extended. The results showed that the predictive ability for all-cause death and MACE of Cys C in old AMI patients was far higher than that in old UAP patients and the predictive ability of Cys C increased with increasing concentration of Cys C in old AMI patients. Hcy was also an independent risk factor for all-cause death and MACE in old AMI patients. The combined use of Cys C and Hcy improved the accuracy for long-term outcomes evaluation.
This study analyzed the incidences of all-cause death, cardiovascular death, and non-cardiovascular death among the three groups. The results showed that not only all-cause death but also death from cardiovascular versus non-cardiovascular causes of the AMI group was twice as high as those of the UAP and control groups. More patients in the AMI group died of cardiovascular disease with direct risk factors. Our results were also significantly higher than a recent large scale study (wherein the 10-year all-cause mortality rate in Chinese AMI patients was 44.7%).36
Limitations
This study had several limitations that should be discussed. The first is sample size. Although our study enrolled over 800 very old patients, the AMI groups contained only 135 patients; additional validation in the AMI group with larger samples might be needed. The second limitation is that our study was based on a single center registry that offered observational data on nonrandomized patients. The third limitation is that this study analyzed systolic function only; we did not collect diastolic function data.
Conclusion
Baseline Cys C is a strong independent predictor of long-term all-cause death and MACE in very old patients admitted with both AMI and UAP; the predictive ability of Cys C in very old AMI patients increases with increasing concentrations of Cys C; the combined use of Cys C and Hcy improves the predictive accuracy in very old AMI patients. Cys C and Hcy may thus represent novel biomarkers for long-term outcomes in very old AMI patients.
Acknowledgments
This study was supported by the Chinese PLA Medical Science and Technology Youth Cultivate Project (fund number 2014QNP104) and National Natural Science Foundation of China (fund numbers 81500269, 81500202, and 81570383).
Disclosure
The authors report no conflicts of interest in this work.
References
Wang H, Naghavi M, Allen C, et al. Global, regional, and national life expectancy, all-cause mortality, and cause-specific mortality for 249 causes of death, 1980–2015: a systematic analysis for the Global Burden of Disease Study. Lancet. 2015;388(2016):1459–1544. | ||
Coll E, Botey A, Alvarez L, et al. Serum cystatin C as a new marker for noninvasive estimation of glomerular filtration rate and as a marker for early renal impairment. Am J Kidney Dis. 2000;36:29–34. | ||
Shlipak MG, Matsushita K, Arnlov J, et al. Cystatin C versus creatinine in determining risk based on kidney function. N Engl J Med. 2013;369:932–943. | ||
Inker LA, Schmid CH, Tighiouart H, et al. Estimating glomerular filtration rate from serum creatinine and cystatin C. N Engl J Med. 2012;367:20–29. | ||
Sai E, Shimada K, Miyauchi K, et al. Increased cystatin C levels as a risk factor of cardiovascular events in patients with preserved estimated glomerular filtration rate after elective percutaneous coronary intervention with drug-eluting stents. Heart Vessels. 2016;31:694–701. | ||
Svensson-Farbom P, Ohlson Andersson M, Almgren P, et al. Cystatin C identifies cardiovascular risk better than creatinine-based estimates of glomerular filtration in middle-aged individuals without a history of cardiovascular disease. J Intern Med. 2014;275:506–521. | ||
Luo J, Wang LP, Hu HF, et al. Cystatin C and cardiovascular or all-cause mortality risk in the general population: a meta-analysis. Clin Chim Acta. 2015;450:39–45. | ||
Lee SN, Shin DI, Jung MH, et al. Impact of cystatin-C level on the prevalence and angiographic characteristics of vasospastic angina in Korean patients. Int Heart J. 2015;56:49–55. | ||
Ito R, Yamakage H, Kotani K, et al. Comparison of cystatin C- and creatinine-based estimated glomerular filtration rate to predict coronary heart disease risk in Japanese patients with obesity and diabetes. Endocr J. 2015;62:201–207. | ||
Wang Y, Su X, Zhang W, Yang W, Wang Y, He Y. Correlation between serum cystatin C level and elderly hypertensive patients combined coronary heart disease. Int J Clin Exp Med. 2015;8:6287–6290. | ||
Tang WH, Dupont M, Hernandez AF, et al. Comparative assessment of short-term adverse events in acute heart failure with cystatin C and other estimates of renal function: results from the ASCEND-HF trial. JACC Heart Fail. 2015;3:40–49. | ||
Shen Y, Ding FH, Zhang RY, Zhang Q, Lu L, Shen WF. Serum cystatin C reflects angiographic coronary collateralization in stable coronary artery disease patients with chronic total occlusion. PLoS One. 2015;10:e0137253. | ||
Wang GN, Sun K, Hu DL, Wu HH, Wang XZ, Zhang JS. Serum cystatin C levels are associated with coronary artery disease and its severity. Clin Biochem. 2014;47:176–181. | ||
Svensson-Farbom P, Almgren P, Hedblad B, et al. Cystatin C is not causally related to coronary artery disease. PLoS One. 2015;10:e0129269. | ||
Hassan A, Dohi T, Miyauchi K, et al. Prognostic impact of homocysteine levels and homocysteine thiolactonase activity on long-term clinical outcomes in patients undergoing percutaneous coronary intervention. J Cardiol. 2017;69:830–835. | ||
Han TW, Zhou SS, Li JT, et al. Homocysteine is associated with the progression of non-culprit coronary lesions in elderly acute coronary syndrome patients after percutaneous coronary intervention. J Geriatr Cardiol. 2016;13:299–305. | ||
Schaffer A, Verdoia M, Cassetti E, et al. Relationship between homocysteine and coronary artery disease. Results from a large prospective cohort study. Thromb Res. 2014;134:288–293. | ||
Fu Z, Xue H, Guo J, et al. Long-term prognostic impact of cystatin C on acute coronary syndrome octogenarians with diabetes mellitus. Cardiovasc Diabetol. 2013;12:157. | ||
Fu Z, Qian G, Xue H, et al. Hyperhomocysteinemia is an independent predictor of long-term clinical outcomes in Chinese octogenarians with acute coronary syndrome. Clin Interv Aging. 2015;10:1467–1474. | ||
Fox KA, Dabbous OH, Goldberg RJ, et al. Prediction of risk of death and myocardial infarction in the six months after presentation with acute coronary syndrome: prospective multinational observational study (GRACE). BMJ. 2006;333:1091. | ||
Hagstrom E, James SK, Bertilsson M, et al. Growth differentiation factor-15 level predicts major bleeding and cardiovascular events in patients with acute coronary syndromes: results from the PLATO study. Eur Heart J. 2016;37:1325–1333. | ||
Zhang S, Wan Z, Zhang Y, et al. Neutrophil count improves the GRACE risk score prediction of clinical outcomes in patients with ST-elevation myocardial infarction. Atherosclerosis. 2015;241:723–728. | ||
Lin H, Liu T, Xiao J, et al. Hourly peak PM2.5 concentration associated with increased cardiovascular mortality in Guangzhou, China. J Expo Sci Environ Epidemiol. 2017;27:333–338. | ||
Laaksonen R, Ekroos K, Sysi-Aho M, et al. Plasma ceramides predict cardiovascular death in patients with stable coronary artery disease and acute coronary syndromes beyond LDL-cholesterol. Eur Heart J. 2016;37:1967–1976. | ||
Tang WH, Topol EJ, Fan Y, et al. Prognostic value of estimated functional capacity incremental to cardiac biomarkers in stable cardiac patients. J Am Heart Assoc. 2014;3:e000960. | ||
Xue H, Fu Z, Zhu H, et al. High-density lipoprotein cholesterol and risk of cardiovascular events in octogenarian patients with acute coronary syndrome: long-term follow-up study. Int J Cardiol. 2014;174:133–134. | ||
Mehta SR, Eikelboom JW, Rao-Melacini P, et al. A risk assessment tool incorporating new biomarkers for cardiovascular events in acute coronary syndromes: the organization to assess strategies in ischemic syndromes (OASIS) risk score. Can J Cardiol. 2016;32:1332–1339. | ||
Vaara S, Tikkanen E, Parkkonen O, et al. Genetic risk scores predict recurrence of acute coronary syndrome. Circ Cardiovasc Genet. 2016;9:172–178. | ||
Panagiotakos DB, Pitsavos C, Georgousopoulou EN, Notara V, Stefanadis C; GREECS Study Investigators. Greek acute coronary syndrome score for the prediction of in-hospital and 30-day mortality of patients with an acute coronary syndrome. J Cardiovasc Nurs. 2015;30:456–463. | ||
Kunadian V, Neely RD, Sinclair H, et al. Study to Improve Cardiovascular Outcomes in high-risk older patieNts (ICON1) with acute coronary syndrome: study design and protocol of a prospective observational study. BMJ Open. 2016;6:e012091. | ||
Angeli F, Verdecchia P, Savonitto S, et al. Cystatin C and risk of mortality among patients undergoing percutaneous coronary intervention. EuroIntervention. 2015;11:757–764. | ||
Timoteo AT, Papoila AL, Rio P, Miranda F, Ferreira ML, Ferreira RC. Prognostic impact of admission blood glucose for all-cause mortality in patients with acute coronary syndromes: added value on top of GRACE risk score. Eur Heart J Acute Cardiovasc Care. 2014;3:257–263. | ||
Xing K, Fu X, Wang Y, et al. Effect of rhBNP on renal function in STEMI-HF patients with mild renal insufficiency undergoing primary PCI. Heart Vessels. 2015;31:490–498. | ||
Tung YC, Chang CH, Chen YC, Chu PH. Combined biomarker analysis for risk of acute kidney injury in patients with ST-segment elevation myocardial infarction. PLoS One. 2015;10:e0125282. | ||
Tonkin AM, Blankenberg S, Kirby A, et al. Biomarkers in stable coronary heart disease, their modulation and cardiovascular risk: the LIPID biomarker study. Int J Cardiol. 2015;201:499–507. | ||
Gao F, Lam CS, Yeo KK, et al. Influence of ethnicity, age, and time on sex disparities in long-term cause-specific mortality after acute myocardial infarction. J Am Heart Assoc. 2016;5:e003760. |
 © 2018 The Author(s). This work is published and licensed by Dove Medical Press Limited. The full terms of this license are available at https://www.dovepress.com/terms.php and incorporate the Creative Commons Attribution - Non Commercial (unported, v3.0) License.
By accessing the work you hereby accept the Terms. Non-commercial uses of the work are permitted without any further permission from Dove Medical Press Limited, provided the work is properly attributed. For permission for commercial use of this work, please see paragraphs 4.2 and 5 of our Terms.
© 2018 The Author(s). This work is published and licensed by Dove Medical Press Limited. The full terms of this license are available at https://www.dovepress.com/terms.php and incorporate the Creative Commons Attribution - Non Commercial (unported, v3.0) License.
By accessing the work you hereby accept the Terms. Non-commercial uses of the work are permitted without any further permission from Dove Medical Press Limited, provided the work is properly attributed. For permission for commercial use of this work, please see paragraphs 4.2 and 5 of our Terms.