")
Back to Journals » Drug Design, Development and Therapy » Volume 9
Pro-apoptotic and pro-autophagic effects of the Aurora kinase A inhibitor alisertib (MLN8237) on human osteosarcoma U-2 OS and MG-63 cells through the activation of mitochondria-mediated pathway and inhibition of p38 MAPK/PI3K/Akt/mTOR signaling pathway
Authors Niu N, Wang Z, Pan S, Ding H, Au G, He Z, Zhou Z, Xiao G, Yang Y, Zhang X, Yang T, Chen X, Qiu J, Zhou S
Received 12 September 2014
Accepted for publication 22 October 2014
Published 12 March 2015 Volume 2015:9 Pages 1555—1584
DOI https://doi.org/10.2147/DDDT.S74197
Checked for plagiarism Yes
Review by Single anonymous peer review
Peer reviewer comments 4
Editor who approved publication: Prof. Dr. Wei Duan
Ning-Kui Niu,1–3 Zi-Li Wang,1 Shu-Ting Pan,2,4 Hui-Qiang Ding,1 Giang HT Au,2 Zhi-Xu He,5 Zhi-Wei Zhou,2,5 Guozhi Xiao,6 Yin-Xue Yang,7 Xueji Zhang,8 Tianxin Yang,9 Xiao-Wu Chen,10 Jia-Xuan Qiu,4 Shu-Feng Zhou2
1Department of Spinal Surgery, General Hospital of Ningxia Medical University, Yinchuan, People’s Republic of China; 2Department of Pharmaceutical Sciences, College of Pharmacy, University of South Florida, Tampa, FL, USA; 3Department of Orthopedics, General Hospital of Tianjin Medical University, Tianjin, 4Department of Oral and Maxillofacial Surgery, The First Affiliated Hospital of Nanchang University, Nanchang, Jiangxi, 5Guizhou Provincial Key Laboratory for Regenerative Medicine, Stem Cell and Tissue Engineering Research Center and Sino-US Joint Laboratory for Medical Sciences, Guizhou Medical University, Guiyang, Guizhou, People’s Republic of China; 6Department of Biochemistry, Medical Center, Rush University, Chicago, IL, USA; 7Department of Colorectal Surgery, General Hospital of Ningxia Medical University, Yinchuan, 8Research Center for Bioengineering and Sensing Technology, University of Science and Technology Beijing, Beijing, People’s Republic of China; 9Department of Internal Medicine, University of Utah and Salt Lake Veterans Affairs Medical Center, Salt Lake City, UT, USA; 10Department of General Surgery, The First People’s Hospital of Shunde affiliated to Southern Medical University, Foshan, Guangdong, People’s Republic of China
Abstract: Osteosarcoma (OS) is the most common malignant bone tumor occurring mostly in children and adolescents between 10 and 20 years of age with poor response to current therapeutics. Alisertib (ALS, MLN8237) is a selective Aurora kinase A inhibitor that displays anticancer effects on several types of cancer. However, the role of ALS in the treatment of OS remains unknown. This study aimed to investigate the effects of ALS on the cell growth, apoptosis, autophagy, and epithelial to mesenchymal transition (EMT) and the underlying mechanisms in two human OS cell lines U-2 OS and MG-63. The results showed that ALS had potent growth inhibitory, pro-apoptotic, pro-autophagic, and EMT inhibitory effects on U-2 OS and MG-63 cells. ALS remarkably induced G2/M arrest and down-regulated the expression levels of cyclin-dependent kinases 1 and 2 and cyclin B1 in both U-2 OS and MG-63 cells. ALS markedly induced mitochondria-mediated apoptosis with a significant increase in the expression of key pro-apoptotic proteins and a decrease in main anti-apoptotic proteins. Furthermore, ALS promoted autophagic cell death via the inhibition of phosphatidylinositol 3-kinase (PI3K)/protein kinase B (Akt)/mammalian target of rapamycin (mTOR) and p38 mitogen-activated protein kinase (p38 MAPK) signaling pathways, and activation of 5'-AMP-dependent kinase (AMPK) signaling pathway. Inducers or inhibitors of apoptosis or autophagy simultaneously altered ALS-induced apoptotic and autophagic death in both U-2 OS and MG-63 cells, suggesting a crosstalk between these two primary modes of programmed cell death. Moreover, ALS suppressed EMT-like phenotypes with a marked increase in the expression of E-cadherin but a decrease in N-cadherin in U-2 OS and MG-63 cells. ALS treatment also induced reactive oxygen species (ROS) generation but inhibited the expression levels of sirtuin 1 and nuclear factor-erythroid-2-related factor 2 (Nrf2) in both cell lines. Taken together, these findings show that ALS promotes apoptosis and autophagy but inhibits EMT via PI3K/Akt/mTOR, p38 MAPK, and AMPK signaling pathways with involvement of ROS- and sirtuin 1-associated pathways in U-2 OS and MG-63 cells. ALS is a promising anticancer agent in OS treatment and further studies are needed to confirm its efficacy and safety in OS chemotherapy.
Keywords: ALS, autophagy, apoptosis, osteosarcoma, PI3K/Akt/mTOR pathway, EMT
Introduction
Osteosarcoma (OS) is the most common primary bone malignancy and mainly affects children and adolescents.1,2 Although the incidence rate is 2–3/million/year in general population, the rate is higher in 0–14 year age group (3.5–4.6/million/year).3,4 Progression of the disease is inexorable. Poor response to the current preferred treatment of preoperative adjuvant chemotherapy followed by surgery leads to fewer than 50% of patients living beyond 10 years. In addition, there are no reliable predictors to guide the choice or the intensity of the chemotherapy.2,5 Radiotherapy has a limited role and should be reserved for inoperable situations.6 Currently, doxorubicin, cisplatin, high-dose methotrexate with leucovorin rescue and ifosfamide are considered the most effective agents against OS, but the ideal combination remains to be defined.3 Compared with surgery alone, multimodal treatment of high-grade OS increases disease-free survival probabilities from only 10%–20% to >60%.6 Effective regimens employ several of the aforementioned drugs, usually over a period of 6–12 months.6 Despite surgical and chemotherapeutic success, death from lung metastases occurs in 30% of patients with OS.7 Only one third of patients with detectable metastases is curable. These survival trends have been stagnant over the past 20 years using the conventional chemotherapies.8 Therefore, new effective drugs and other forms of therapy for OS are certainly needed to improve the efficacy and to reduce side effects.5,8
Targeting programmed cell death has become a promising approach in the fight against OS, which mainly includes the manipulation of apoptosis and autophagy.9,10 Apoptosis and autophagy are two catabolic pathways essential for organismal homeostasis. They are also the two primary morphologically distinctive modes of programmed cell death. The interconnectivity of apoptosis and autophagy is essential for the development of effective cancer therapeutics. The mammalian target of rapamycin (mTOR) complex has been known as a key regulator of autophagy for more than a decade.11 The classic autophagic pathway acts downstream of the mTOR- mediated cell death, involving a number of autophagy-related (Atg) proteins and other regulating molecules. Autophagy also has a complex relationship with apoptotic cell death, and apoptosis-associated proteins have a complex relationship with autophagy.12 For example, p53 up-regulated modulator of apoptosis (PUMA) is a pro-apoptotic protein that functions through Bcl-associated X protein (Bax) to induce mitochondrial autophagy in response to mitochondrial perturbations. It is clear that apoptosis and autophagy are strictly interconnected and the two pathways share key molecular regulators.13 One example is the complex formed by the autophagy protein, beclin 1, and anti-apoptotic protein B cell lymphoma 2 (Bcl-2), and both of which are key regulators of apoptosis and autophagy.14,15
Aurora kinases, which contain Aurora kinase A/B/C (AURKA/B/C), are a family of oncogenic serine/threonine kinases that regulate multiple phases of the mitotic signaling cascade.16–18 Abnormalities in mitosis can provide a source of the genomic instability that is typically associated with tumorigenesis. Aurora kinases have been recently identified as potential targets in anticancer therapy, and in vivo anti-tumor activity of AURKA/B inhibitors has been reported from various groups.16–18 Overexpression of AURKA has been noted in various types of cancer including laryngeal, breast, colon, pancreas, ovaries, bladder, liver, and gastric cancers.12 It exhibits an oncogenic activity.19 AURKA is a key regulatory component of the p53 pathway and that overexpression of AURKA leads to increased degradation of p53.20 Modulation of the tumor suppressor p53 has substantial effects on the alteration of cell cycle distribution and the initiation of apoptosis and autophagy.21,22 AURKA interacts with the p53 pathway at multiple levels, suggesting that these proteins form part of an integrated functional network in the regulation of cell survival and cell death. AURKA activity and expression both increase from late G2 to M phase, with peak activity in pro-metaphase. Application of inhibitors against Aurora kinases as anticancer molecules can lead to chromosomal instability, derangement of multiple tumor suppressors, and alteration in oncoprotein-regulated pathways.
Alisertib (ALS; also called MLN8237) (Figure 1A) is a small molecule inhibitor of AURKA that plays a pivotal role in centrosome maturation and spindle formation during mitosis.23 Inhibition of AURKA leads to mitotic errors, followed by aneuploidy, apoptosis, and senescence.18 In vitro studies by our laboratory have shown that ALS induces cancer cell apoptosis and autophagy and inhibits epithelial to mesenchymal transition (EMT) via activation of mitochondrial pathway, up-regulation of p53, and inhibition of phosphatidylinositol 3-kinase (PI3K)/protein kinase B (Akt)/mTOR signaling pathway in breast, pancreatic, ovarian, and gastric cancer.24,25 However, the role of ALS in the treatment of OS is unclear.
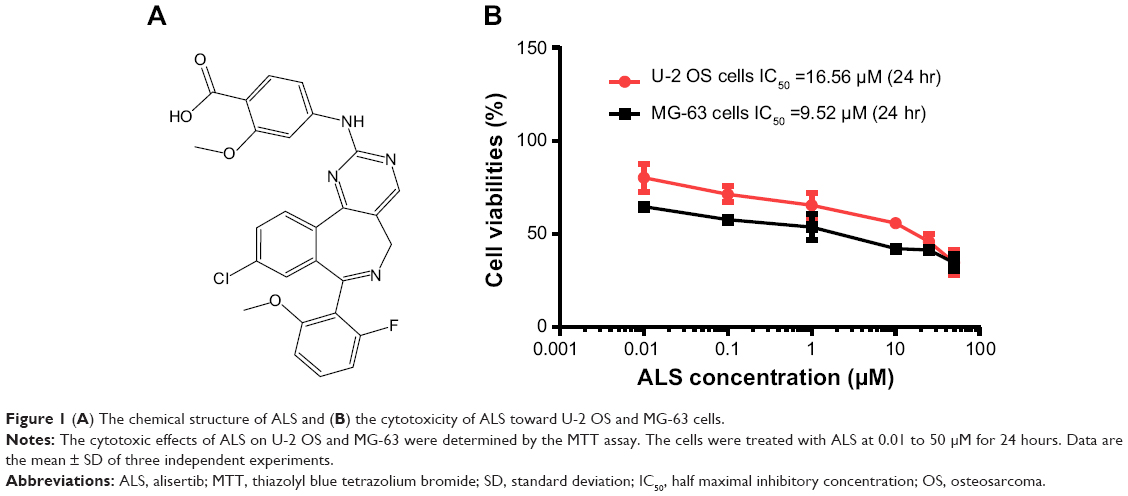 | Figure 1 (A) The chemical structure of ALS and (B) the cytotoxicity of ALS toward U-2 OS and MG-63 cells. |
On the other hand, emerging evidence has suggested that the EMT process is activated during cancer development, growth, progression, and metastasis.26 EMT is a normal physiologic process by which cells of epithelial origin convert into cells bearing mesenchymal characteristics. Recently, there has been an increasing interest in the role of sirtuin (Sirt) family in the regulation of EMT, growth, and metastasis of cancer. The Sirt protein family (Sirt1-7) encodes a group of evolutionarily conserved, class III, and nicotinamide adenine dinucleotide-dependent histone deacetylases, which are involved in many critical cellular processes including cell cycle regulation, cell differentiation, genomic stability, tumor genesis, oxidative stress response, aging, and energy metabolism.27 Sirt1 deacetylates histones, p300, p53, forkhead box class O family members, and nuclear factor-κB, which regulates cellular stress response and cell survival. It also regulates peroxisome proliferator-activated receptor-γ, AMP-activated protein kinase (AMPK), and mTOR, which plays a role in cellular energy metabolism and autophagy.27 It has been reported that Sirt1 induces EMT by cooperating with EMT transcription factors to enhance cell migration and metastasis.28 In the present study, in order to explore the anticancer effect and the possible mechanisms of ALS in OS therapy, we have examined the cell proliferation inhibiting, pro-apoptotic, pro-autophagic, and EMT suppressing effects of ALS using two human OS cell lines U-2 OS and MG-63.
Materials and methods
Chemicals and reagents
Dulbecco’s phosphate buffered saline (PBS), fetal bovine serum (FBS), propidium iodide (PI), ribonuclease A, ethylenediaminetetraacetic acid, and thiazolyl blue tetrazolium bromide (MTT) were purchased from Sigma-Aldrich Co. (St Louis, MO, USA). Dulbecco’s Modified Eagle’s Medium (DMEM) was obtained from Corning Inc. (Corning, NY, USA). Bafilomycin A1 (an autophagy inhibitor), chloroquine (an autophagy inhibitor), SB202190 [4-(4-fluorophenyl)-2-(4-hydroxyphenyl)-5-(4-pyridyl)1H-imidazole], and wortmannin (WM, a PI3K inhibitor) were bought from InvivoGen Inc. (San Diego, CA, USA). ALS and FK866 (a highly specific noncompetitive inhibitor of nicotinamide phosphoribosyltransferase, (E)-N-(4-(1-benzoylpiperidin-4-yl)butyl)-3-(pyridin-3-yl)acrylamide) were purchased from Selleckchem Inc. (Houston, TX, USA). 5-(and 6)-Chloromethyl-2′,7′-dichlorodihy-drofluorescein diacetate (CM-H2DCFDA) was bought from Invitrogen Inc. (Carlsbad, CA, USA). Z-VAD(OMe)-FMK (methyl 5-fluoro-3-[2-[[3-methyl-2-(phenylmethoxycarbonylamino)butanoyl]amino]propanoylamino]-4-oxopentanoate) was obtained from Santa Cruz Biotechnology Inc. (Dallas, TX, USA). The annexin V:phycoerythrin (PE) apoptosis detection kit was purchased from BD Biosciences Inc. (San Jose, CA, USA). The Cyto-ID® Autophagy detection kit was bought from Enzo Life Sciences Inc. (Farmingdale, NY, USA). Polyvinylidene difluoride membrane was purchased from EMD Millipore Inc. (Billerica, MA, USA). Western blotting substrate was obtained from Thermo Fisher Scientific Inc. (Waltham, MA, USA). Primary antibodies against human p53, p21 Waf1/Cip1, cyclin B1, cyclin-dependent kinase 1 (CDK1/CDC2/CDKN1), CDK2, PUMA, Bax, Bcl-2, cytochrome c, cleave caspase-3 and 9, beclin 1, Sirt1, nuclear factor-erythroid-2-related factor 2 (Nrf2), microtubule-associated protein 1A/1B-light chain 3 (LC3-I), LC3-II, phosphatase and tensin homolog (PTEN) PI3K, phosphorylated PI3K (p-PI3K/p85 at Tyr458), AMPK, p-AMPK at Thr172, p38 mitogen-activated protein kinase (MAPK), p-p38 MAPK at Thr180/Tyr182, Akt, p-Akt at Ser473, mTOR, p-mTOR at Ser2448, and EMT antibody sampler kit (No: #9782) were all purchased from Cell Signaling Technology Inc. (Beverly, MA, USA). The EMT antibody sampler kit contains primary antibodies to N-cadherin, E-cadherin, zona occludens protein 1 (ZO-1), vimentin, slug, snail, zinc finger E-box-binding homeobox 1 (TCF8/ZEB1), and β-catenin, and the antibody against human β-actin was obtained from Santa Cruz Biotechnology Inc.
Cell lines and cell culture
The human OS U-2 OS and MG-63 cells were obtained from American Type Culture Collection (Manassas, VA, USA) and cultured in DMEM containing L-glutamine, phenol red, L-cysteine, L-methionine, and sodium bicarbonate and supplemented with 10% heat-inactivated FBS and 1% penicillin/streptomycin. The cells were incubated at 37°C in a 5% CO2 humidified incubator. ALS was dissolved in dimethyl sulfoxide (DMSO) at a stock concentration of 25 mM and stored at −20°C. It was freshly diluted to the desired concentration with culture medium. The final concentration of DMSO was at 0.05% (v/v). The control cells were treated with 0.05% DMSO only.
Cell viability assay
The MTT assay was performed to examine the effect of ALS on cell viability. Briefly, U-2 OS and MG-63 cells were seeded into a 96-well culture plate at a density of 8,000 cells/well. After 24-hour incubation, the cells were treated with ALS at concentrations ranging from 0.01 to 50 μM for a further 24 hours. Cell viability was determined by the reduction of MTT. The absorbance was measured using a Synergy™ H4 Hybrid microplate reader (BioTek, Winooski, VT, USA) at wavelengths of 560 nm (MTT formazan) and 670 nm (background). The 50% inhibition of the growth (IC50) value was determined using the relative viability over ALS concentration curve. The experiment was conducted in triplicate.
Cell cycle distribution analysis
The effect of ALS on cell cycle distribution of U-2 OS and MG-63 cells was determined by flow cytometry. Briefly, U-2 OS and MG-63 cells were treated with ALS at concentrations of 0.1, 1, and 5 μM for 24 hours. Cells were trypsinized and fixed in 70% ethanol at −20°C overnight. The cells were washed with PBS and stained using 1 mg/mL ribonuclease A and 50 μg/mL PI. Cells were incubated in the dark for 30 minutes at room temperature. A total number of 1×10⁴ events were subjected to cell cycle analysis using a flow cytometer (BD Biosciences Inc.).
Quantification of cellular apoptosis using flow cytometry
Apoptotic cells were quantitated using the annexin V:PE apoptosis detection kit after cells were treated with ALS at 0.1, 1, and 5 μM for 24 hours. In order to investigate the mechanisms for ALS-induced apoptosis, cells were pre-treated with 20 μM Z-VAD(OMe)-FMK, 10 μM WM, 0.1 μM bafilomycin A1, 30 μM chloroquine, 20 μM SB202190, or 25 nM FK866 for 1 hour, then treated with 5 μM ALS for a further 24 hours. Groups of cells treated with each of these compounds alone were also included. All compounds were dissolved in 0.05% DMSO (v/v). Following the treatment, U-2 OS and MG-63 cells were trypsinized and washed twice with cold PBS, then cells were re-suspended in 1× binding buffer with 5 μL annexin V:PE and 5 μL 7-amino-actinomycin D (7-AAD) at 1×10⁴ cells/mL in a total volume of 100 μL. The cells were gently mixed and incubated in the dark for 15 minutes at room temperature. The binding buffer (250 μL) was then added to the samples and the number of apoptotic cells was quantified using a flow cytometer that collected 10,000 events for analysis.
Quantification of cellular autophagy
The cells were treated with fresh medium alone, control vehicle alone (0.05% DMSO, v/v), or ALS at 0.1, 1, and 5 μM for 24 hours at 37°C. To investigate the mechanisms for ALS-induced autophagy, cells were pre-treated with 20 μM Z-VAD(OMe)-FMK, 10 μM WM, 0.1 μM bafilomycin A1, 30 μM chloroquine, 20 μM SB202190, or 25 nM FK866 for 1 hour, then treated with 5 μM ALS for a further 24 hours. Groups of cells treated with each of these compounds alone were also included. All inducers and inhibitors were dissolved in 0.05% DMSO. After ALS treatment, cells were re-suspended in 250 μL of phenol red-free culture medium (Invitrogen Inc.) containing 5% FBS, and 250 μL of the diluted Cyto-ID® green stain solution (Enzo Life Sciences Inc.) was added to each sample and mixed well. Cells were incubated for 30 minutes at 37°C in the dark, collected by centrifugation, washed with 1× assay buffer, and re-suspended in 250 μL fresh 1× assay buffer. Cells were finally analyzed using the fluorescein isothiocyanate channel of a flow cytometer that collected 10,000 events for analysis.
Confocal fluorescence microscopy for autophagy detection
To further detect the autophagy-inducing effect of ALS on U-2 OS and MG-63 cells, the confocal microscopic examination was performed. U-2 OS and MG-63 cells were seeded into 8-well chamber slides and treated with different inducers and inhibitors. After incubation for 24 hours, cells reached ~70% confluence and were washed with 1× assay buffer, following incubation with 100 μL microscopy dual detection reagent for 30 minutes at 37°C in the dark. After the incubation, the cells were washed with 1× assay buffer to remove unbound detection reagent and were examined using a Leica TCS SP2 laser scanning confocal microscope (Leica Microsystems, Wetzlar, Germany) using a standard fluorescein isothiocyanate filter set for imaging the autophagic signal at wavelengths of 405/488 nm.
Western blotting analysis
U-2 OS and MG-63 cells were washed with PBS after 24-hour treatment with ALS, lysed with the radioimmunoprecipitation assay buffer 50 mmol 4-(2-hydroxyethyl)piperazine-1-ethanesulfonic acid at pH 7.5, 150 mM sodium chloride, 10% glycerol, 1.5 mM magnesium chloride, 1% Triton™ X-100, 1 mM ethylenediaminetetraacetic acid at pH 8.0, 10 mM sodium pyrophosphate, and 10 mM sodium fluoride and the protease and phosphatase inhibitor cocktails and centrifuged at 3,000× g for 10 minutes at 4°C. Protein concentrations were measured using Pierce™ bicinchoninic acid protein assay kit (Thermo Fisher Scientific Inc.) and then the protein sample was denatured at 95°C for 5 minutes. Equal amounts of protein sample (30 μg) were loaded onto 7%–12% sodium dodecyl sulfate polyacrylamide gel electrophoresis mini-gels. Proteins were transferred onto polyvinylidene difluoride membranes at 400 mA for 2 hours at 4°C. Then, the membranes were blocked with skim milk for 1 hour and subsequently probed with indicated primary antibody overnight at 4°C and then incubated with respective secondary antibody. Visualization was performed using Bio-Rad ChemiDoc™ XRS system (Bio-Rad Laboratories Inc., Hercules, CA, USA) and blots were analyzed using Image Lab 3.0 (Bio-Rad Laboratories Inc.). Protein level was normalized to the matching densitometric value of β-actin.
Measurement of intracellular reactive oxygen species (ROS) level
CM-H2DCFDA was used to measure the intracellular ROS level according to the manufacturer’s instruction. Briefly, cells were seeded into 96-well plates (1×10⁴ cells/well) and treated with ALS at 0.1, 1, and 5 μM for 24 hours. Following that, the cells were incubated with 5 μM CM-H2DCFDA in PBS for 30 minutes at 37°C. The fluorescence intensity was detected at 485 nm excitation and 530 nm emission using a Synergy™ H4 Hybrid microplate reader (BioTek Inc.).
Statistical analysis
Data are presented as the mean ± standard deviation (SD). Multiple comparisons were evaluated by one-way analysis of variance (ANOVA) followed by Tukey’s multiple comparison. A value of P<0.05 was considered statistically significant. Experiments were performed at least three times independently.
Results
ALS inhibits the proliferation of U-2 OS and MG-63 cells
First, we conducted the MTT assay to examine the effects of ALS on the growth and proliferation of U-2 OS and MG-63 cells. The concentration-dependent inhibitory effect of ALS on the growth of U-2 OS and MG-63 cells are shown in Figure 1B. The cellular viability of U-2 OS cells over the control cells (100%) was 80.2%, 71.3%, 65.5%, 55.8%, 45.9%, and 34.6%, and the cellular viability of MG-63 cells over the control cells (100%) was 64.7%, 57.7%, 53.7%, 42.2%, 41.5%, and 34.5%, as ALS concentration increased from 0.01 to 50 μM. The IC50 value was 16.6 μM for U-2 OS cells and 9.5 μM for MG-63 cells after 24 hour treatment with ALS. These results demonstrate that ALS induces a concentration-dependent inhibitory effect on the growth of U-2 OS and MG-63 cells.
ALS induces G2/M arrest in U-2 OS and MG-63 cells via regulation of the expression of cyclin B1, cyclin D1, CDK1/CDC2, CDK2, p21 Waf1/Cip1, and p53
Following the test of cell viability, the effects of ALS on cell cycle distribution are shown in Figure 2. Incubation of cells with ALS induced G2/M phase arrest and decreased the percentage of cell numbers in G1 and S phases in both U-2 OS and MG-63 cells (P<0.001; Figure 2A). When U-2 OS cells were incubated with ALS at 0.1, 1, and 5 μM, the percentage of cells in G2/M phase was 33.9%, 90.9%, and 91.6%, respectively; the percentage of cells in G1 phase was 46.6%, 3.1%, and 3.7%, respectively; and the percentage of cells in S phase was 20.5%, 6.1%, and 4.8%, respectively. Similarly, compared with the control cells (22.4%), the percentage of MG-63 cells in G2/M phase was increased in a concentration-dependent manner after ALS treatment (P<0.001; Figure 2A). When MG-63 cells were treated with ALS at 0.1, 1, and 5 μM, the percentage of cells in G2/M phase was 33.9%, 90.9%, and 91.6%, respectively. The percentage of cells in G1 phase was decreased from 23.7% at basal level to 20.5%, 6.1%, and 4.8%, and the percentage of MG-63 cells in S phase was reduced from 54.7% at basal level to 46.6%, 3.1%, and 3.7%, when cells were treated with ALS at 0.1, 1, and 5 μM for 24 hours, respectively. There was no significant difference observed in the number of cells in G1, S, and G2/M phases in both U-2 OS and MG-63 cells between the non-treated control cells and the 0.05% DMSO treated cells.
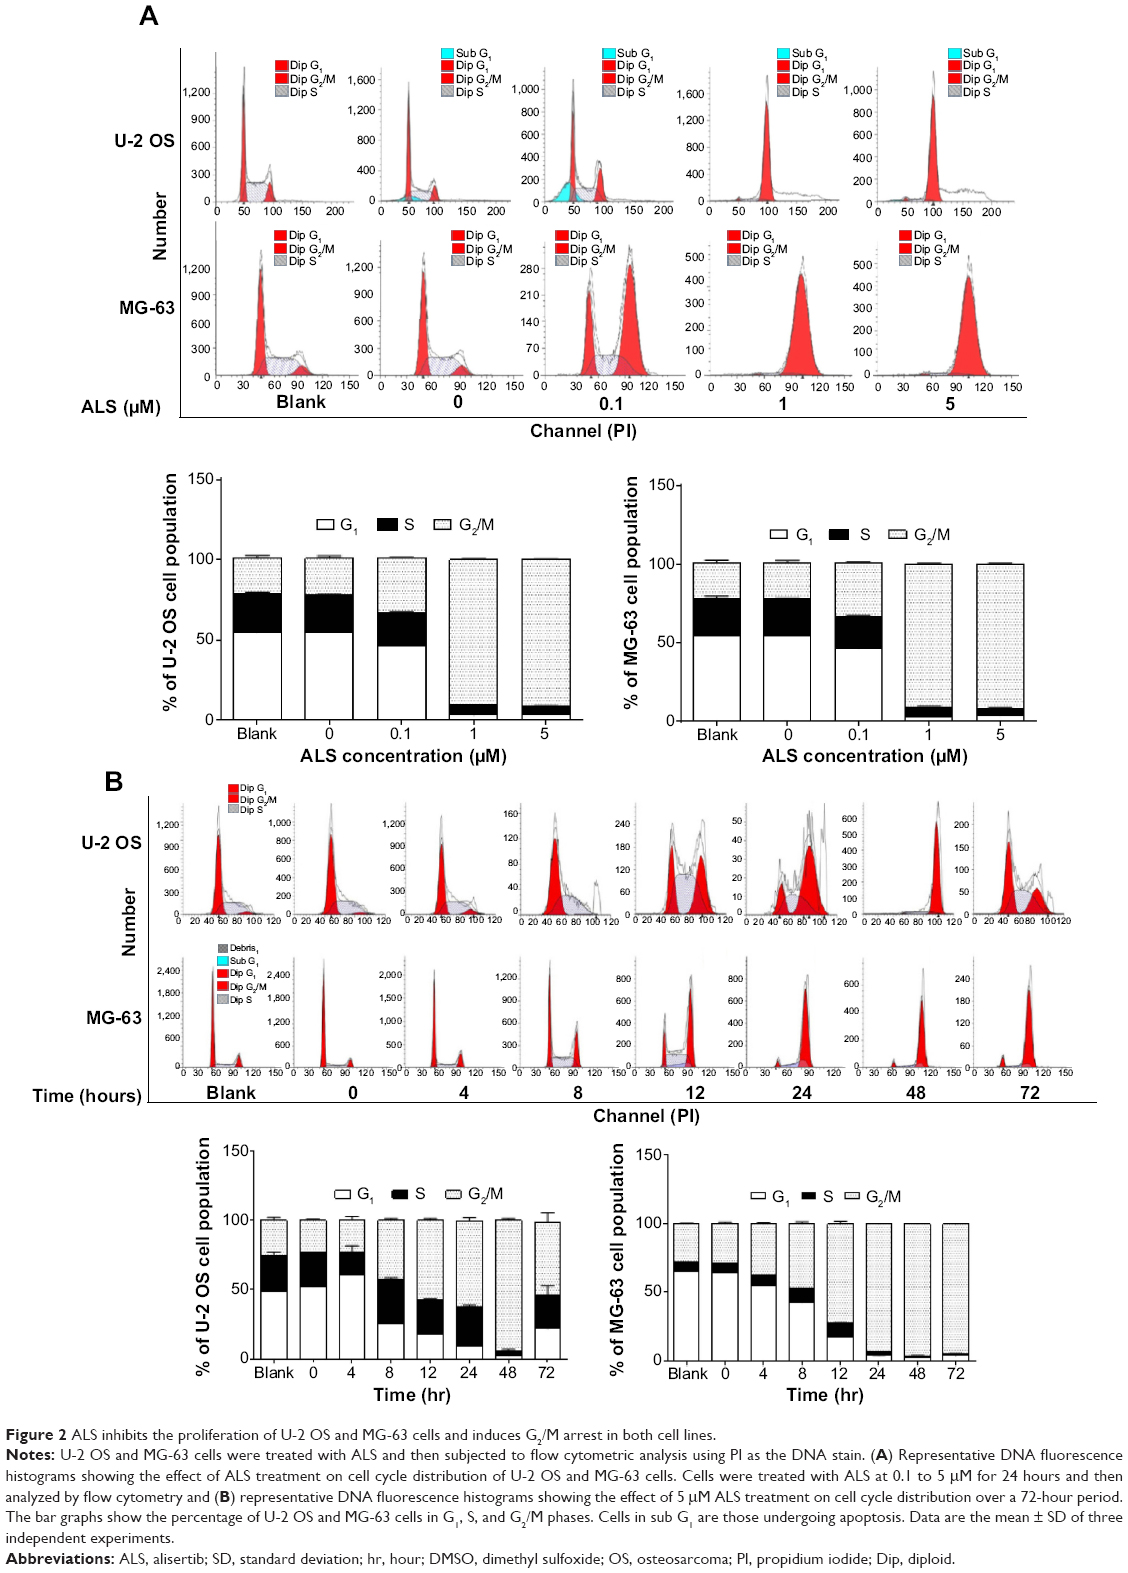 | Figure 2 ALS inhibits the proliferation of U-2 OS and MG-63 cells and induces G2/M arrest in both cell lines. |
We further evaluated the effect of ALS treatment at 5 μM on cell cycle distribution over a 72-hour period. Compared to the control cells, the percentage of U-2 OS cells in G2/M phase was increased from 25.2% at basal level to 22.9%, 42.1%, 57.2%, 62.3%, 93.8%, and 52.6% after 4, 8, 12, 24, 48, and 72 hour treatment, respectively (P<0.05 or 0.001; Figure 2B). While 5 μM ALS treatment increased the percentage of U-2 OS cells in G1 phase from 48.8% at basal level to 60.5% after 4 hour treatment but was decreased to 25.5%, 17.9%, 9.4%, 2.1%, and 21.7% after 4, 8, 12, 24, 48, and 72 hour treatment, respectively (P<0.001; Figure 2B). There was a marked decrease in the percentage of U-2 OS cells in S phase after treatment with ALS for 48 hours (P<0.001; Figure 2B).
In addition, treatment of MG-63 cells with 5 μM ALS for 4, 8, 12, 24, 48, and 72 hours decreased the percentage of cells in G1 phase from 65.4% at basal level to 55.2%, 42.5%, 17.4%, 4.0%, 3.0%, and 3.9%, respectively (P<0.001; Figure 2B). While the percentage of MG-63 cells in S phase increased from 6.7% at basal level to 7.3%, 10.3%, and 10.4% after 4, 8, and 12 hour treatment but was decreased to 2.8%, 0.9%, and 1.5% after 24, 48, and 72 hour treatment, respectively (P<0.05, 0.01, or 0.001; Figure 2B). Compared to the control cells, the percentage of MG-63 cells in G2/M phase was increased from 27.8% at basal level to 37.3%, 47.0%, 71.9%, 93.0%, 96%, and 94.3% after 4, 8, 12, 24, 48, and 72 hour treatment, respectively (P<0.001; Figure 2B).
To further understand the mechanism for ALS-induced effects on cell cycle arrest, the expression levels of key regulators of cell cycle were examined. Cyclin B1 and CDC2 are two key regulators for G2 to M phase transition.30 The expression of cyclin B1 was significantly suppressed in both cell lines with the treatment of ALS at concentrations of 0.1, 1, and 5 μM for 24 hours (Figure 3A). For U-2 OS cells, the cyclin B1 expression level was decreased to 21.3%, 43.4%, and 25.2% when cells were treated with ALS at 0.1, 1, and 5 μM for 24 hours, respectively. There was no significant alteration in CDC2 expression level at 0.1 and 1 μM ALS. There was a 27.6% reduction in the expression level of CDC2 with 5 μM ALS treatment for 24 hours (Figure 3B). Similarly, treatment of MG-63 cells with ALS at 0.1, 1, and 5 μM for 24 hours decreased to 17.3%, 22.3%, and 48.6% in the expression level of cyclin B1, respectively (P<0.05, 0.01, or 0.001; Figure 3B). Treatment with ALS at 0.1 and 5 μM also suppressed the expression level of CDC2 by 31.7% and 31.8%, respectively (P<0.05; Figure 3B).
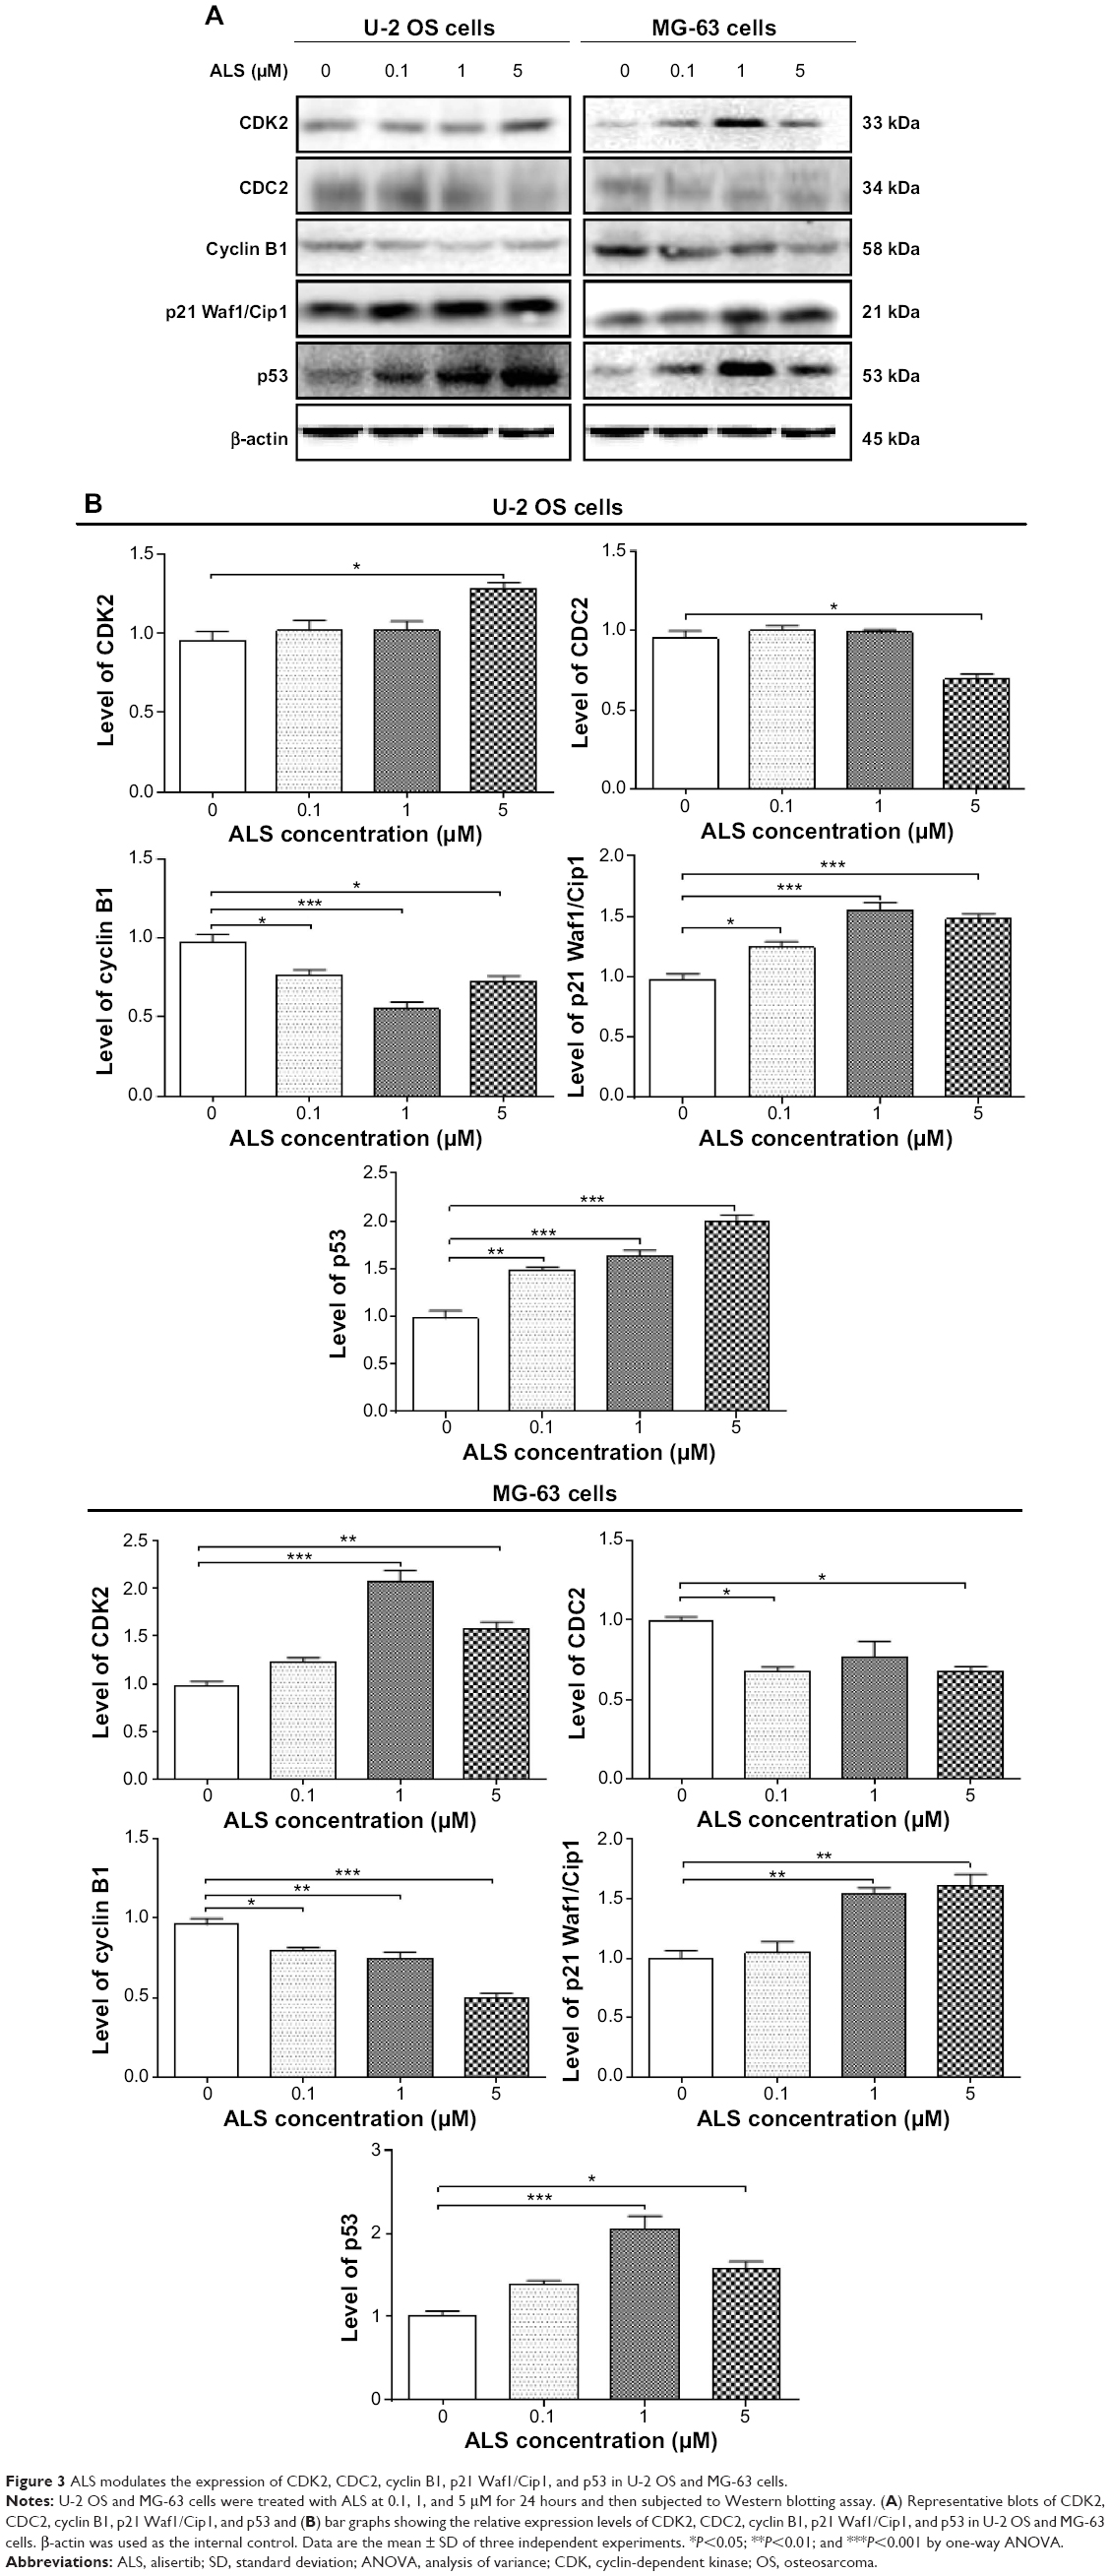 | Figure 3 ALS modulates the expression of CDK2, CDC2, cyclin B1, p21 Waf1/Cip1, and p53 in U-2 OS and MG-63 cells. |
Furthermore, p21 Waf1/Cip1 and p53 are another two important factors that contribute to the regulation of cell cycle. The tumor suppressor protein p21 Waf1/Cip1 acts as an inhibitor of cell cycle progression, and serves to inhibit kinase activity and block progression through G1/S in association with CDK2 complexes.31 Phosphorylated p53 up-regulates p21 Waf1/Cip1 transcription via a p53-responsive element and activation of p53 leads to either cell cycle arrest and DNA repair or apoptosis. As shown in Figure 3A and B, the expression levels of CDK2, p21 Waf1/Cip1, and p53 were increased in U-2 OS cells 24 hours post-treatment with ALS. In comparison to the control cells, 5 μM ALS treatment led to a 1.34-fold rise in the expression level of CDK2 in U-2 OS cells, and there was a 1.3-, 1.6-, and 1.5-fold increase in the expression of p21 Waf1/Cip1 and 1.51-, 1.7-, and 2.6-fold increase in the expression level of p53 in U-2 OS cells when treated with ALS at 0.1, 1, and 5 μM for 24 hours, respectively (Figure 3B). Similarly, there was a 2.1- and 1.6-fold increase in the expression level of CDK2, a 1.6- and 1.6-fold increase in the expression level of p21 Waf1/Cip1, and a 2.0- and 1.6-fold elevation in the expression level of p53 in MG-63 cells when treated with ALS at 1 and 5 μM for 24 hours, respectively (Figure 3). These results indicate that ALS significantly down-regulates CDC2 and cyclin B1, but up-regulates p21 Waf1/Cip1, CDK2, and p53 in both U-2 OS and MG-63 cells, contributing to the observed cell cycle arrest in both cell lines.
ALS induces the apoptosis of U-2 OS and MG-63 cells via activation of mitochondrial pathway
To further examine the anticancer effect of ALS in U-2 OS and MG-63 cells, cellular apoptosis was quantified by flow cytometric analysis using the double stain assay. Figure 4 shows the number of apoptotic cells after ALS treatment. The percentage of apoptotic cells was 6% in U-2 OS cells treated with the control vehicle only (0.05% DMSO, v/v). Treatment of U-2 OS cells with ALS at 0.1, 1, and 5 μM for 24 hours increased the total percentage of apoptotic cells (early + late apoptosis) to 9.7%, 9.5%, and 11.2%, respectively, with a 1.6- to 1.9-fold increase compared to the control vehicle (Figure 4A and B). In MG-63 cells, the percentage of apoptotic cells was 2.1% in cells treated with the control vehicle only (0.05% DMSO, v/v). When MG-63 cells were treated with ALS at 5 μM for 24 hours, the total percentage of apoptotic cells increased 3.8-fold compared to the control vehicle (Figure 4B). The results clearly show that ALS induces apoptotic cell death of both U-2 OS and MG-63 cells in a concentration-dependent manner.
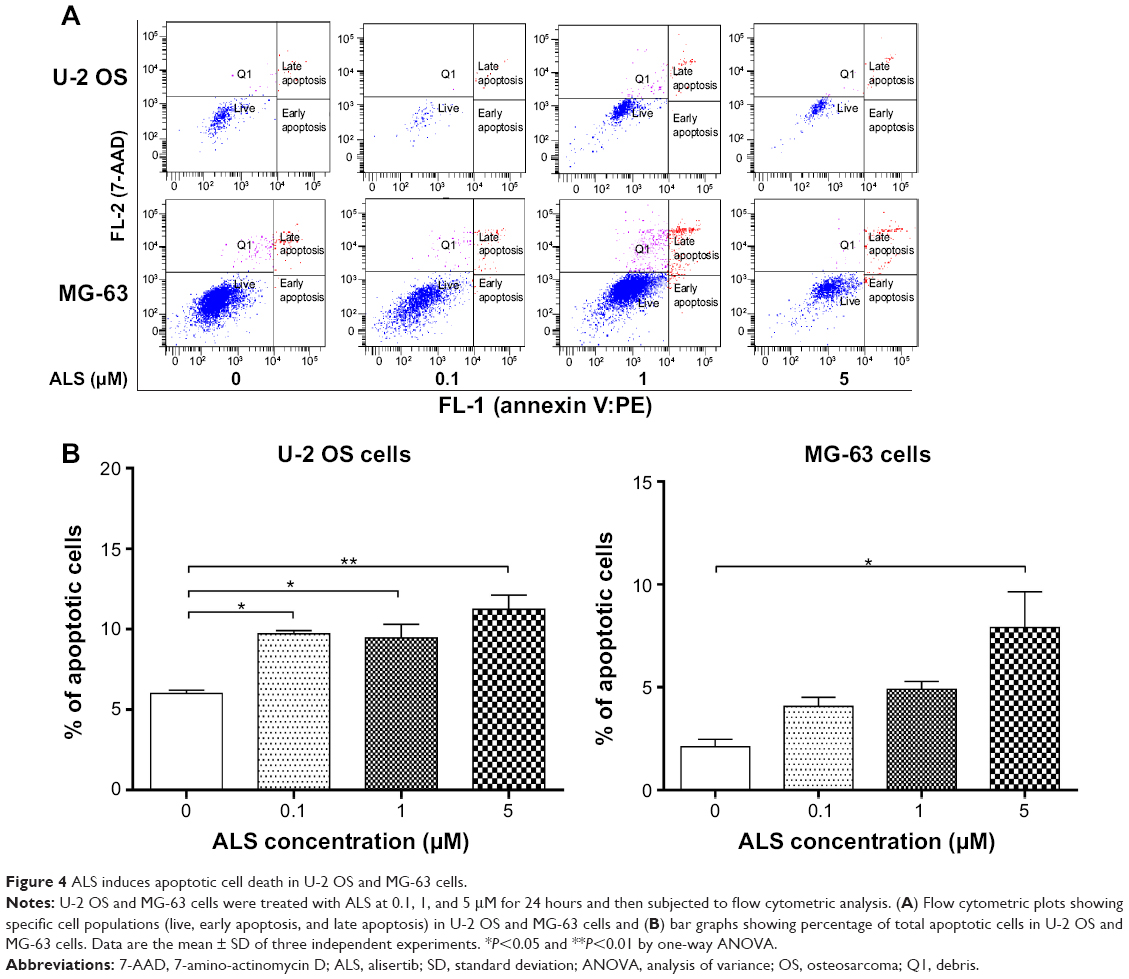 | Figure 4 ALS induces apoptotic cell death in U-2 OS and MG-63 cells. |
In the mitochondria/cytochrome c-mediated apoptotic pathway, various stimuli converge on mitochondria and activate one or more members of the BH3-only protein family, which are tightly regulated by Bcl-2 family members. This promotes the assembly of Bcl-2-antagonist/killer-1 (Bak) and Bax oligomers within mitochondrial outer membranes, leading to cytochrome c release to cytosol, which in turn induces the apoptotic protease-activating factor-1 to generate apoptosome and activates caspase-9 and subsequently activates the downstream caspase-2, 3, 6–8, and 10.32 In order to elucidate the mechanism for the pro-apoptotic effect of ALS on U-2 OS and MG-63 cells, we evaluated the expression levels of the pro-apoptotic protein Bax, anti-apoptotic protein Bcl-2, PUMA, and the cleaved caspase-3 and 9 with different ALS concentrations of 0.1, 1, and 5 μM for 24 hour treatment. The expression level of Bax was significantly increased in both cell lines treated with ALS at 0.1 and 5 μM for 24 hours (Figure 5A). Incubation of U-2 OS cells with 0.1 and 5 μM ALS resulted in a remarkable increase of 1.5- and 1.6-fold in the expression of Bax, respectively (P<0.01 or 0.001; Figure 5B). Treatment of MG-63 cells with 0.1 and 5 μM of ALS resulted in a 1.48- and 1.84-fold increase in the expression of Bax, respectively (P<0.01 or 0.001; Figure 5B). In contrast, the expression level of Bcl-2 was decreased by 33.2% and 44.3% in U-2 OS cells when treated with ALS at 1 and 5 μM, and 40.5% in MG-63 cells when treated with 5 μM ALS (Figure 5B). A significant increase in the expression level of Bax and reduction of Bcl-2 resulted in a significant decrease in the Bcl-2/Bax ratio in both cell lines with a 32.2%, 37.2%, and 65.9% reduction in U-2 OS cells and 30.7%, 21.0%, and 67.7% decline in MG-63 cells when treated with ALS at 0.1, 1, and 5 μM for 24 hours, respectively. Moreover, the effect of ALS on the expression of PUMA was also examined due to its important role in the regulation of anti-apoptotic proteins. Treatment of 1 and 5 μM ALS remarkably increased the expression level of PUMA 2.0- and 2.1-fold in U-2 OS cells (P<0.001; Figure 5B). In MG-63 cells, the PUMA expression level was also increased to 1.3- and 2.0-fold when treated with ALS at 1 and 5 μM, respectively (P<0.05 or 0.001; Figure 5B).
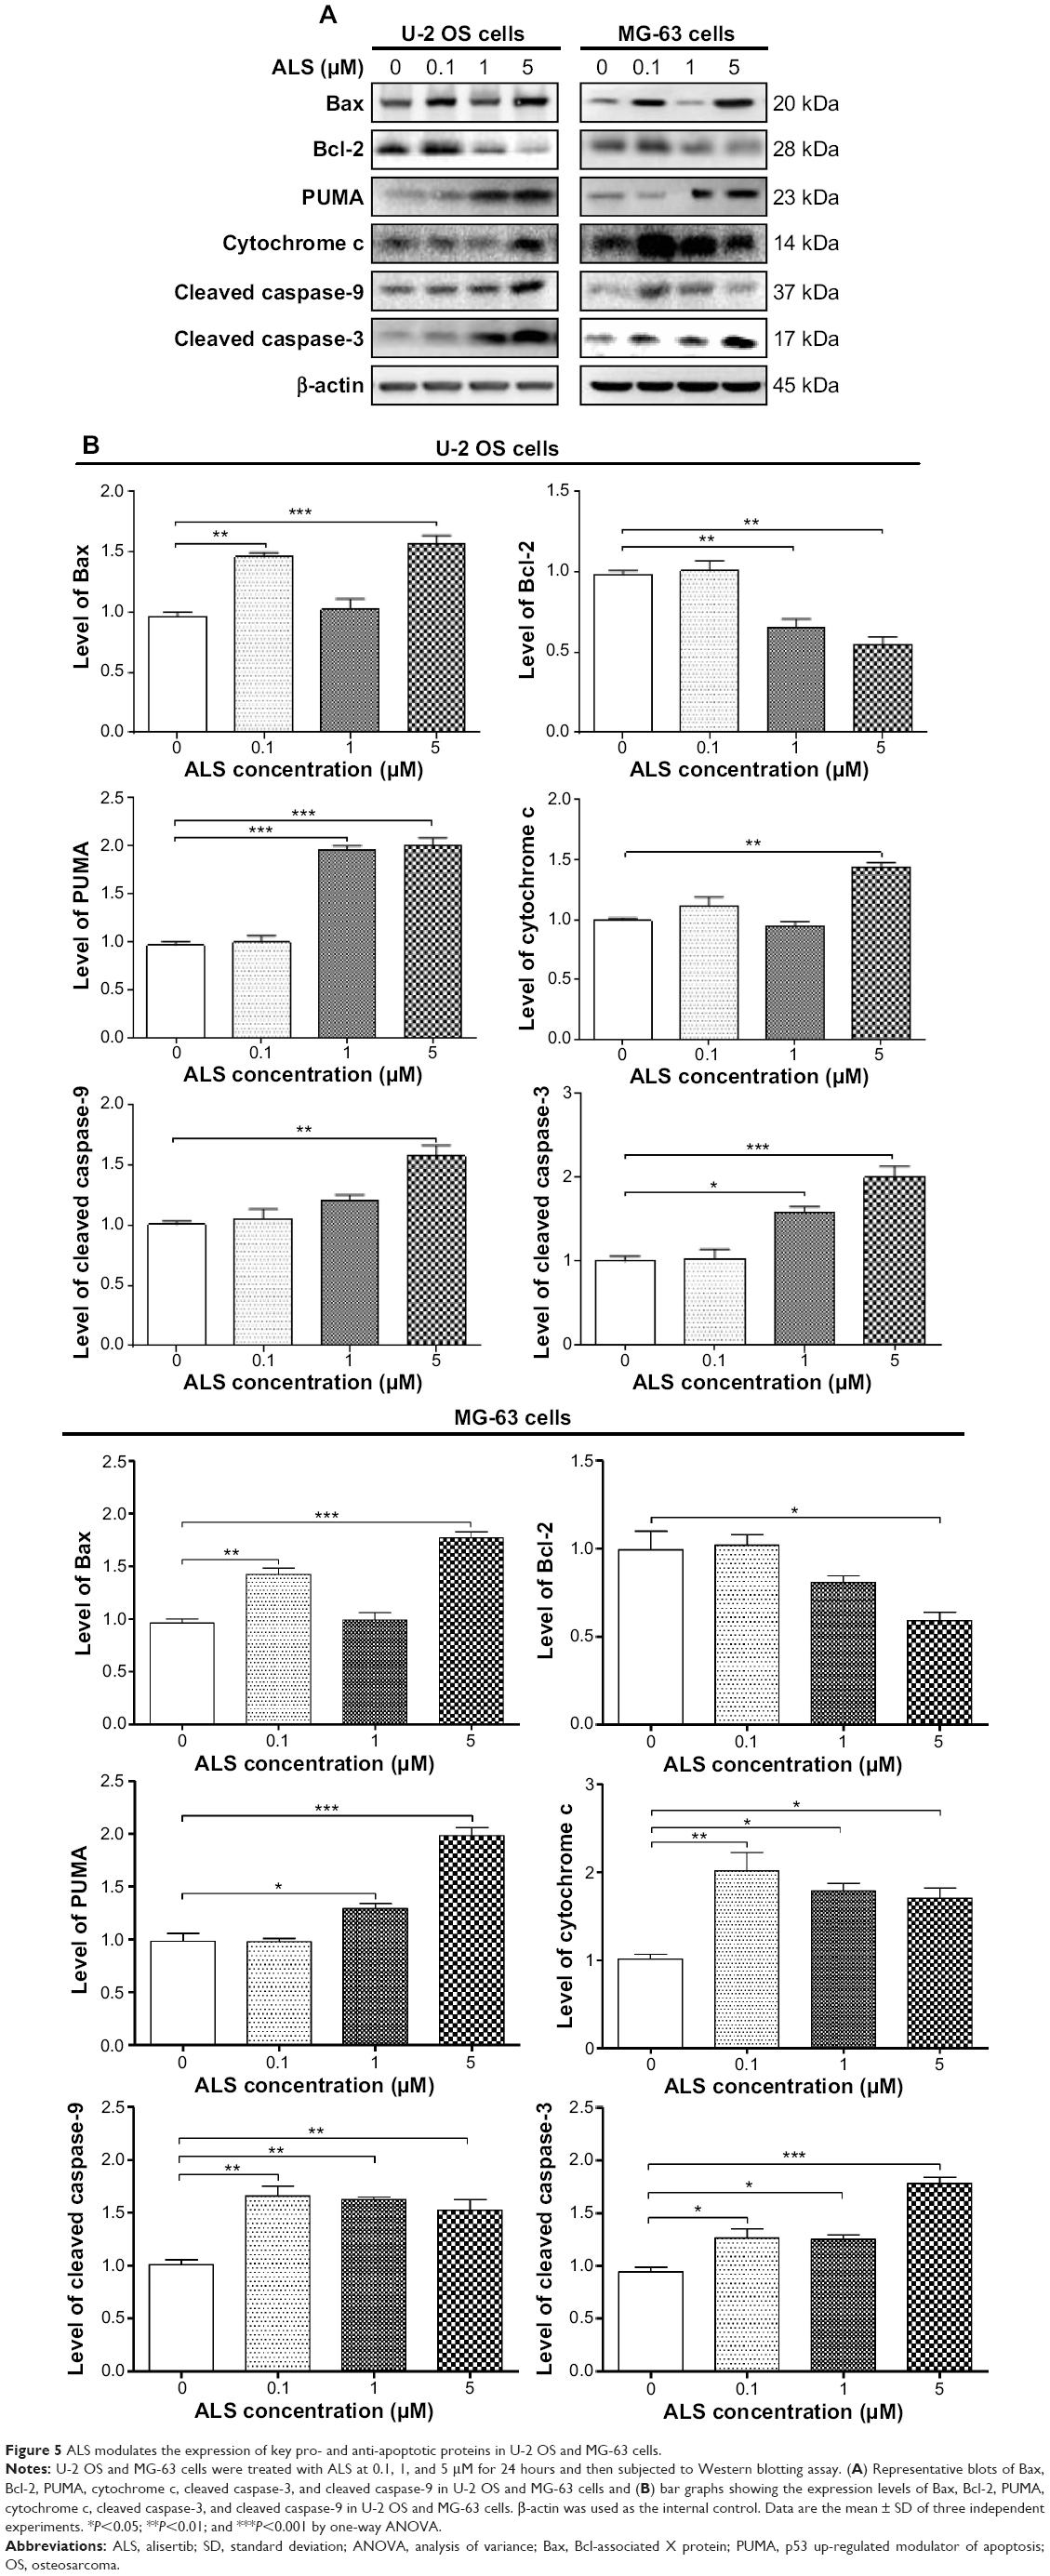 | Figure 5 ALS modulates the expression of key pro- and anti-apoptotic proteins in U-2 OS and MG-63 cells. |
The release of cytochrome c from mitochondria to cytosol initiates the caspase-dependent apoptotic cascade. The release of cytochrome c from the mitochondrial inter-membrane space takes place during the early stages of apoptotic cell death.33 Upon apoptotic stimulation, cytochrome c released from mitochondria associates with procaspase-9/Apaf 1 to form a complex that processes caspase-9 from inactive pro-enzyme to its active form, eventually triggering caspase-3 activation and apoptosis.33 Therefore, we evaluated the effect of ALS treatment on the release of cytochrome c in both U-2 OS and MG-63 cells. Treatment of U-2 OS and MG-63 cells with ALS for 24 hours significantly increased the release of cytochrome c from mitochondria as the concentration of ALS increased (Figure 5B). Subsequently, we also observed a significant increase in the activation of caspase-9 and 3.These results indicate that ALS induces a remarkable activation of caspase-9 and 3 and eventually leads to apoptotic death of both U-2 OS and MG-63 cells.
ALS induces autophagy in both U-2 OS and MG-63 cells via inhibition of the PI3K/Akt/mTOR signaling pathway
Since we have observed ALS-induced apoptosis in U-2 OS and MG-63 cells, we next examined the effect of ALS on autophagy of U-2 OS and MG-63 cells using flow cytometric analysis and confocal microscopic examination. The percentage of autophagic cells at basal level was 3.1% and 1.6% for U-2 OS and MG-63 cells, respectively (Figure 6A and B). Incubation of U-2 OS and MG-63 cells with ALS significantly increased the percentage of autophagic cells. In U-2 OS cells, there was a 6.1-, 9.7-, and 14.8-fold increase in the percentage of autophagic cells when treated with 0.1, 1, and 5 μM ALS for 24 hours compared to the control cells, respectively (Figure 6A and B). Similarly, treatment of MG-63 cells with 0.1, 1, and 5 μM ALS for 24 hours resulted in a 7.2-, 25.7-, and 24.8-fold increase in the percentage of autophagic cells (Figure 6A and B).
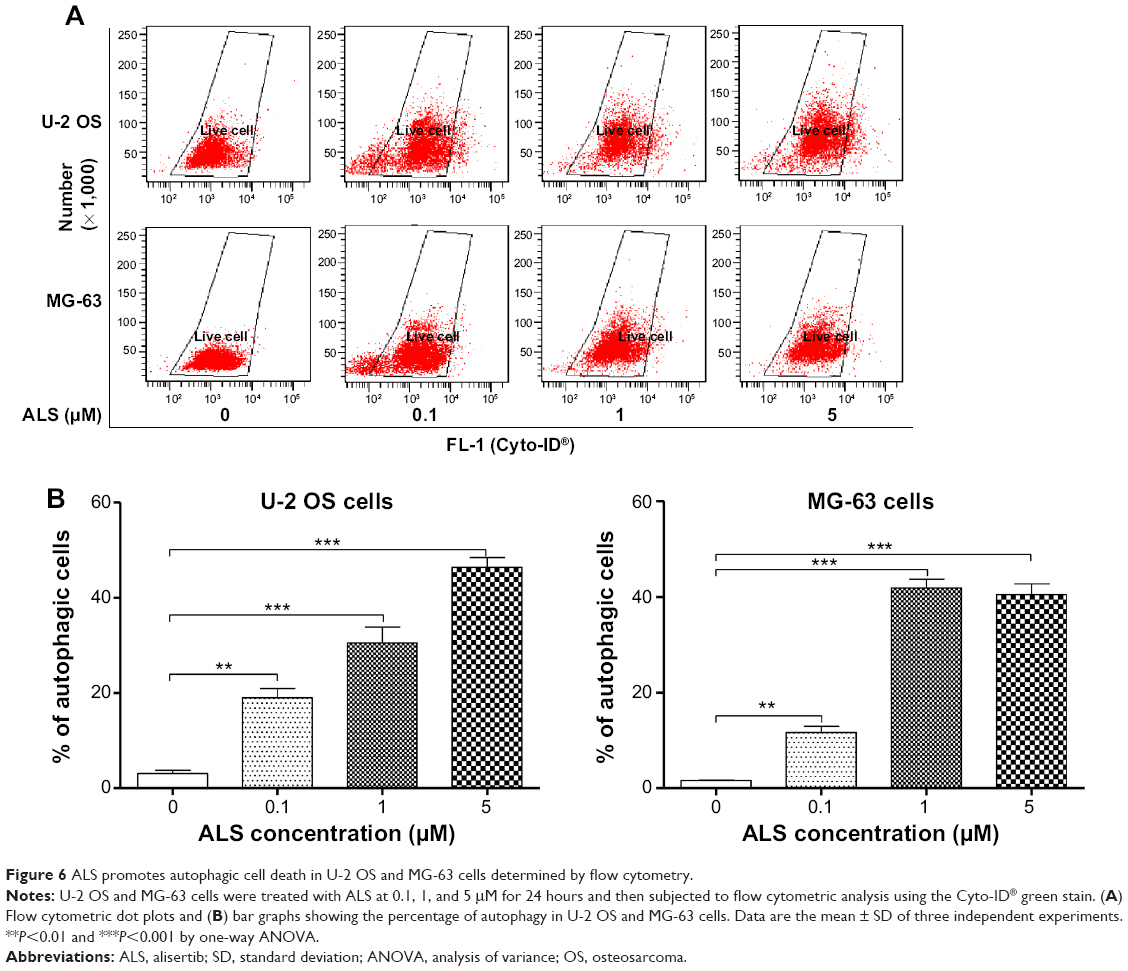 | Figure 6 ALS promotes autophagic cell death in U-2 OS and MG-63 cells determined by flow cytometry. |
We further confirmed the autophagy-inducing effects of ALS on U-2 OS and MG-63 cells using confocal microscopic examination. In comparison to the control cells, ALS treatment caused a significant increase in the autophagy as the concentration increased in U-2 OS and MG-63 cells (Figure 7A and B). There was a 1.1- and 1.2-fold increase in the autophagic death of U-2 OS cells when treated with ALS at 1 and 5 μM for 24 hours, respectively (Figure 7A and B). In MG-63 cells, there was a 12.1% increase in autophagy when treated with 5 μM ALS (Figure 7A and B). A lower concentration of 0.1 μM ALS did not significantly affect the autophagy in both U-2 OS and MG-63 cells. These results indicate that ALS induces autophagy in both U-2 OS and MG-63 cells at concentrations higher than 1 μM.
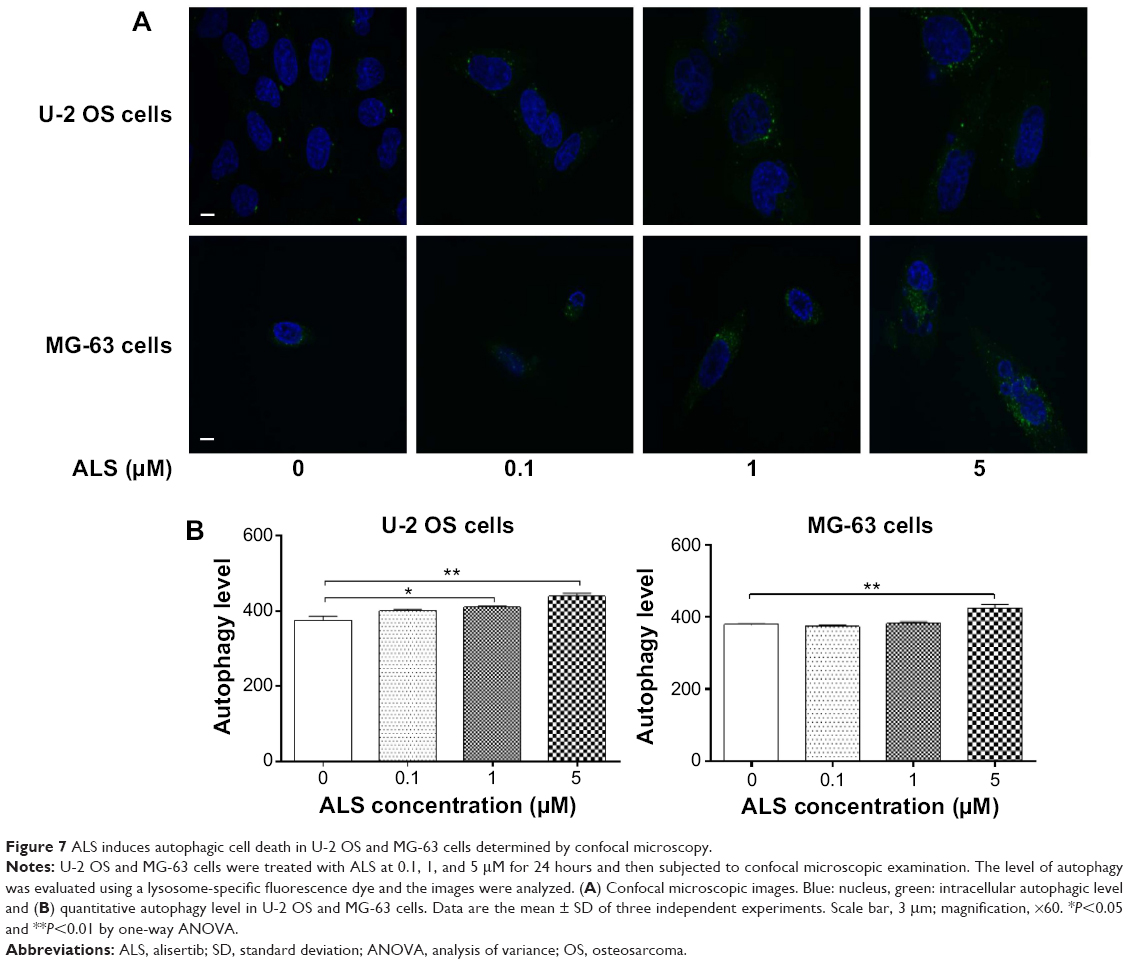 | Figure 7 ALS induces autophagic cell death in U-2 OS and MG-63 cells determined by confocal microscopy. |
Next, we investigated the mechanisms for the autophagy-inducing effect of ALS in U-2 OS and MG-63 cells. We examined the phosphorylation levels of PI3K at Tyr199, AMPK at Thr172, and p38 MAPK at Thr180/Tyr182 which are the upstream signaling molecules of Akt/mTOR pathway and play an important role in regulating cell proliferation and cell death.34 PI3K catalyzes the formation of phosphatidylinositol-3, 4, 5-triphosphate via phosphorylation of phosphatidylinositol, phosphatidylinositol-4-phosphate, and phosphatidylinositol-4, 5-bisphosphate.29 Growth factors and hormones trigger this phosphorylation event, which in turn coordinates cell growth, cell cycle, cell migration, and cell survival. Incubation of cells with ALS significantly inhibited the phosphorylation of PI3K at Tyr199 in both cell lines in a concentration-dependent manner (Figure 8A). In MG-63 cells, there was a significant decrease in expression level of total PI3K when treated with 5 μM ALS (Figure 8A). However, ALS did not significantly affect the expression of total PI3K in U-2 OS cells. The ratio of p-PI3K over total PI3K was decreased in both cell lines. In U-2 OS cells, the p-PI3K/PI3K ratio was decreased by 42.3% when treated with 5 μM ALS (P<0.001; Figure 8B). In MG-63 cells, 1 and 5 μM ALS decreased the ratio of p-PI3K/PI3K by 53.7% and 30.8%, respectively (P<0.01 or 0.001; Figure 8B).
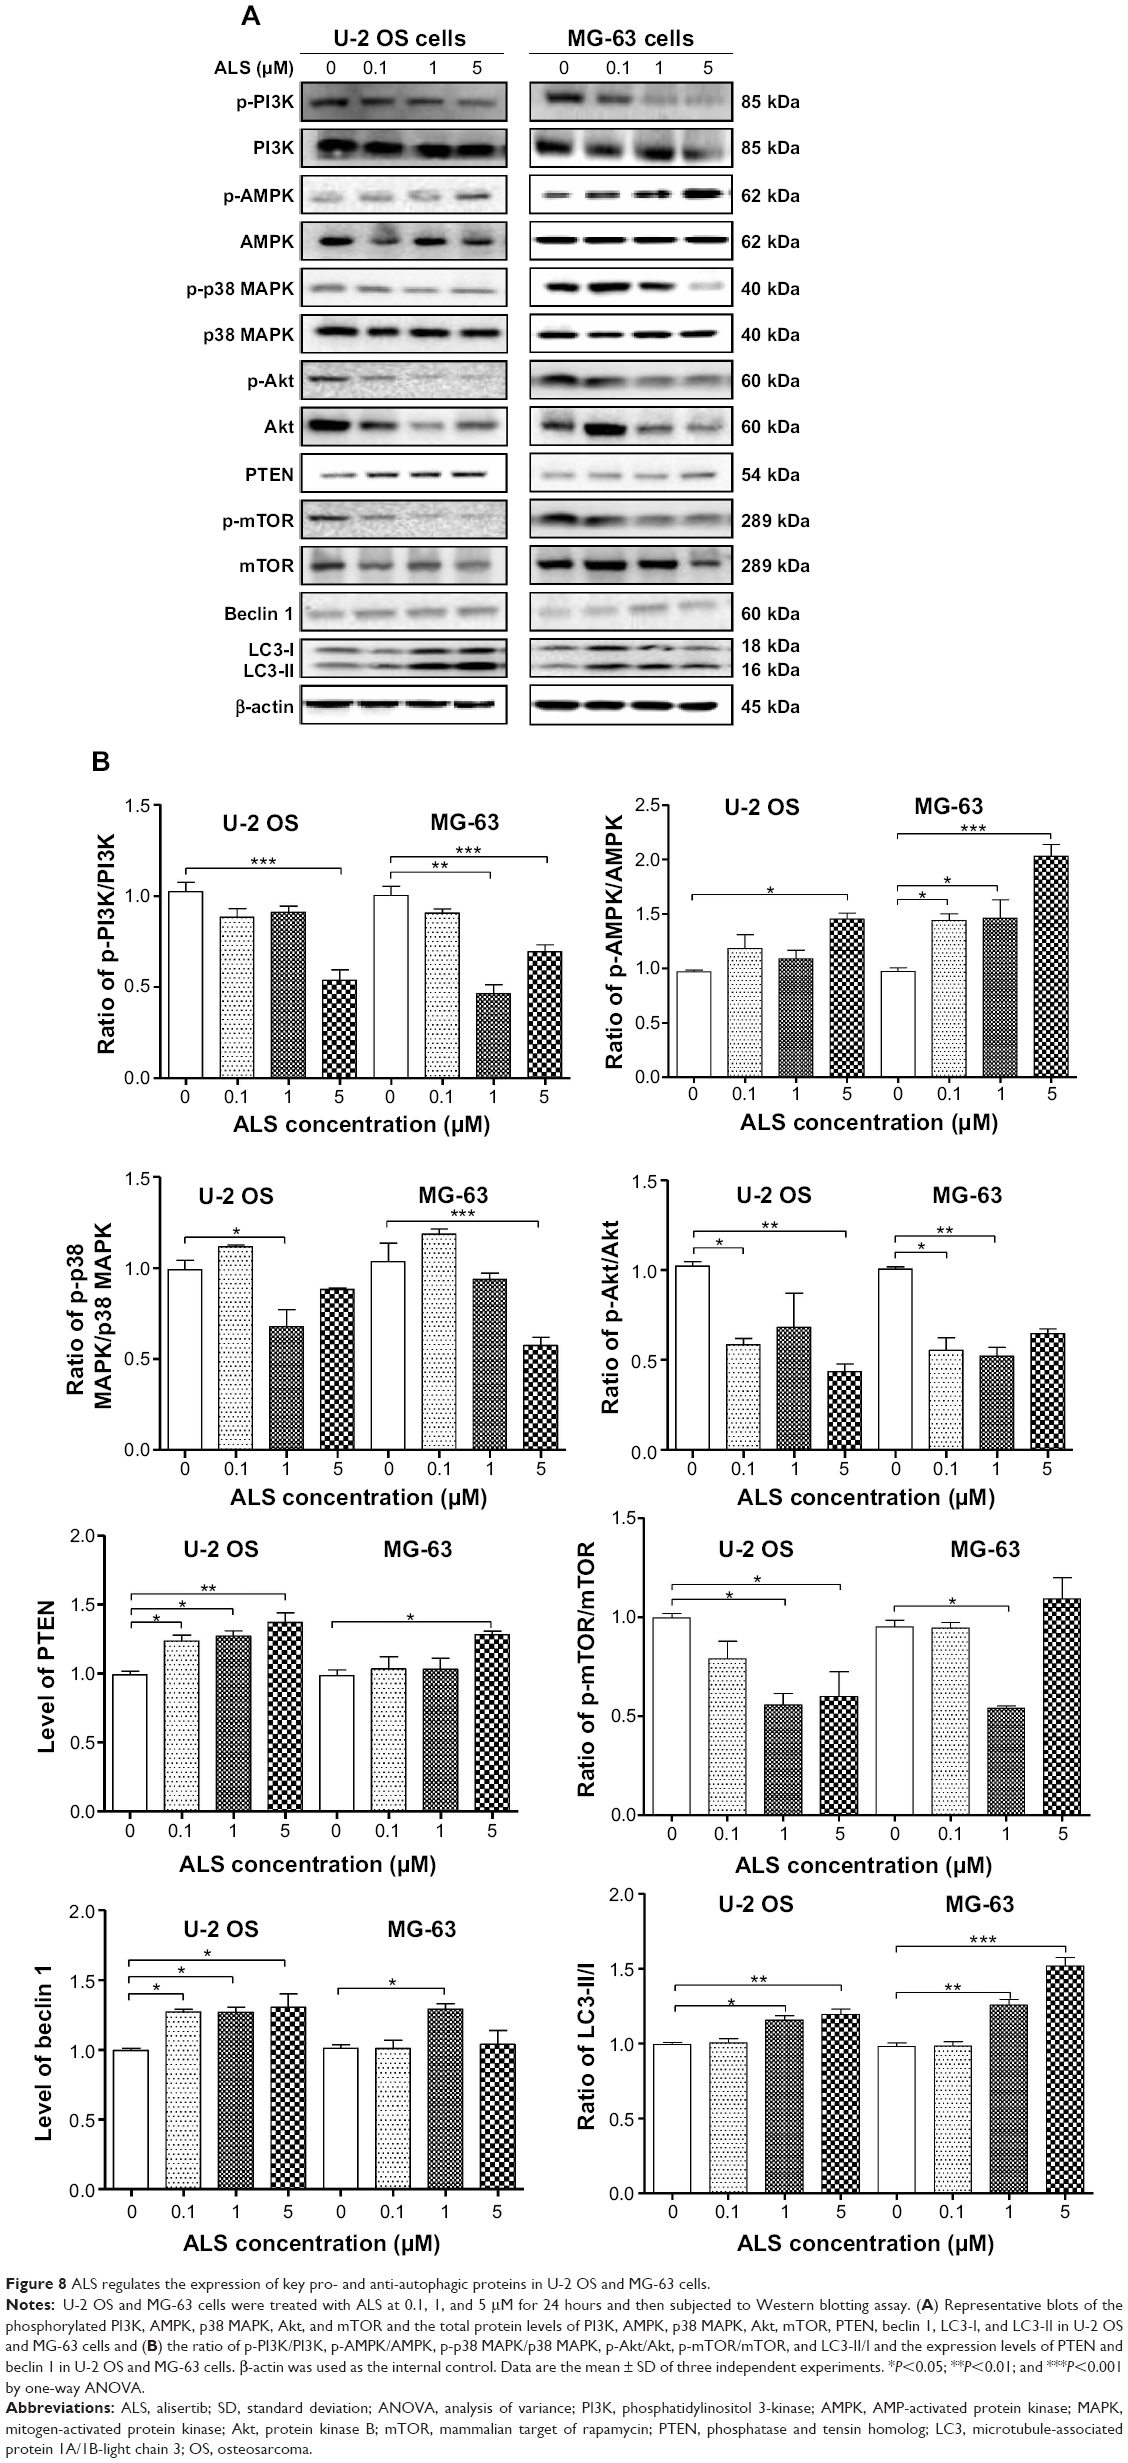 | Figure 8 ALS regulates the expression of key pro- and anti-autophagic proteins in U-2 OS and MG-63 cells. |
Under certain circumstances, AMPK has been proposed to be a positive regulator of autophagy by directly activating Unc-51-like kinase 1 (ULK1, a homolog of yeast Atg1) through phosphorylation of Ser317 and Ser777. Under nutrient sufficiency, high mTOR activity prevents ULK1 activation by phosphorylating ULK1 Ser757 and disrupting the interaction between ULK1 and AMPK. ALS treatment promoted the phosphorylation of AMPK at Thr172 in both cell lines (Figure 8A). Incubation of U-2 OS and MG-63 cells with ALS for 24 hours activated the phosphorylation of AMPK at Thr172 in a concentration-dependent manner (Figure 8A). There was no significant change in the expression of total AMPK compared to the control cells. Notably, there was an increased ratio of p-AMPK/AMPK in both cell lines. In U-2 OS cells, the p-AMPK/AMPK ratio was increased from 0.97 at basal level to 1.2, 1.1, and 1.5 when treated with ALS at 0.1, 1, and 5 μM, respectively (P<0.05; Figure 8B). Similarly, treatment of MG-63 cells with ALS at 0.1, 1, and 5 μM resulted in an increase in the ratio of p-AMPK/AMPK from 0.97 at basal level to 1.4, 1.5, and 2.0, respectively (P<0.05 or 0.01; Figure 8B).
p38 MAPK regulates cellular responses to cytokines and stress and thus controls cell differentiation, cell death, cell migration and invasion,35 and can be activated by a variety of cellular stresses including osmotic shock, inflammatory cytokines, lipopolysaccharide, UV light, and growth factors. Activated p38 MAPK can phosphorylate MAP kinase-activated protein kinase 2, several transcription factors including activating transcription factor, Myc-associated factor X, and myocyte enhancer factor-2, and induce the expression of a number of target genes.35,36 In contrast to the promoting effects on AMPK phosphorylation at Thr172 by ALS exposure, we observed an inhibitory effect of ALS on the activation of p38 MAPK at Thr180/Tyr182 in both U-2 OS and MG-63 cells (Figure 8A). However, there was no significant change in the expression level of total p38 MAPK in both cell lines. Notably, a decreased ratio of p-p38 MAPK/p38 MAPK was observed in both cell lines when treated with ALS at 1 and 5 μM. In comparison to the control cells, the ratio of p-p38 MAPK/p38 MAPK was decreased by 31.5% when U-2 OS cells were treated with ALS at 1 μM (P<0.05; Figure 8B). Incubation of MG-63 cells with 5 μM ALS resulted in a 44.6% decrease in the ratio of p-p38 MAPK/p38 MAPK (P<0.001; Figure 8B). These findings demonstrate that ALS inhibits the phosphorylation of PI3K Tyr199 and p38 MAPK Thr180/Tyr182 but enhances the phosphorylation of AMPK Thr172 in U-2 OS and MG-63 cells, contributing to the increase in autophagy.
We further examined the regulatory effect of ALS on the phosphorylation of Akt at Ser473 and mTOR at Ser2448 and the expression level of PTEN in U-2 OS and MG-63 cells. Akt is involved in regulating the various signaling downstream pathways including metabolism, cell proliferation, survival, growth, and angiogenesis.37 As a downstream effector of PI3K, Akt can activate mTOR, while mTORC2 phosphorylates Akt at Ser473, which stimulates Akt phosphorylation at Thr308 by 3-phosphoinositide dependent protein kinase-1 and leads to full Akt activation.37 mTOR plays a key role in cell growth, autophagic cell death, and homeostasis.38 mTOR is phosphorylated at Ser2448 via the PI3K/Akt signaling pathway and autophosphorylated at Ser2481. mTOR inhibition promotes dissociation of mTOR from the complex of Atg13 with ULK1 and ULK2. This releases ULK1/2 to activate FIP200, a protein critical for autophagosome formation and autophagy initiation.38 PTEN inhibits Akt/mTOR and MAPK signaling, leading to cell death and growth regulation.39 In comparison to the control cells, the phosphorylation level of Akt at Ser473 was decreased in U-2 OS and MG-63 cells with the treatment of ALS and there was a significant reduction in the expression of Akt in both cell lines treated with 1 and 5 μM ALS for 24 hours (Figure 8A). The ratio of p-Akt/Akt was significantly decreased in both cell lines treated with ALS. In U-2 OS cells, the ratio of p-Akt/Akt was decreased from 1.0 at basal level to 0.58, 0.68, and 0.43 when cells were treated with ALS at 0.1, 1, and 5 μM for 24 hours, respectively (P<0.05 or 0.01; Figure 8B). In MG-63 cells, the ratio of p-Akt/Akt was decreased from 1.0 at basal level to 0.56, 0.52, and 0.65 with the treatment of ALS at 0.1, 1, and 5 μM, respectively (P<0.05 or 0.01; Figure 8B).
In addition, the expression level of PTEN was significantly increased when U-2 OS and MG-63 cells were treated with ALS for 24 hours. There was a 1.3-, 1.3-, and 1.4-fold increase in the autophagic death of U-2 OS cells when treated with ALS at 0.1, 1, and 5 μM for 24 hours, respectively (P<0.05 or 0.01; Figure 8A and B). In MG-63 cells, there was a 1.3-fold increase in autophagy when treated with 5 μM ALS (P<0.05; Figure 8B). Exposure of U-2 OS cells to ALS resulted in a decrease in the phosphorylation level of mTOR at Ser2448 (Figure 8A). In MG-63 cells, there was a reduction in the phosphorylation level of mTOR at Ser2448 when treated with 1 μM ALS for 24 hours (Figure 8A). There was no significant change in the expression of total mTOR in both cell lines when treated with ALS for 24 hours, except for a decrease in the expression level of mTOR in MG-63 cells treated with 5 μM ALS for 24 hours (Figure 8A). However, a decreased ratio of p-mTOR/mTOR was observed in both cell lines when treated with increasing concentrations of ALS. In U-2 OS cells, the ratio of p-mTOR/mTOR was decreased from 1.0 at basal level to 0.79, 0.56, and 0.60 when treated with 0.1, 1, and 5 μM ALS, respectively (P<0.05; Figure 8B). In MG-63 cells, the ratio of p-mTOR/mTOR was decreased from 0.95 at basal level to 0.94 and 0.54 with treatment of ALS at 0.1 and 1 μM, respectively (P<0.05; Figure 8B).
Finally, we examined the effect of ALS on the expression level of beclin 1 and LC3-II/I. Upon autophagy initiation, LC3 is cleaved at the C-terminus by Atg4 to form the cytosolic LC3-I. LC3-I is consequently proteolytically cleaved and lipidated by Atg3 and Atg7 to form LC3-II, which localizes to the autophagosome membrane. LC3-I is consequently proteolytically cleaved and lipidated by Atg3 and Atg7 to form LC3-II, which localizes to the autophagosome membrane. Treatment of U-2 OS and MG-63 cells with 1 and 5 μM ALS for 24 hours significantly increased the expression of beclin 1 (Figure 8A). After 24 hour treatment with ALS, there was a concentration-dependent increase in the expression of both LC3-I and LC3-II in U-2 OS and MG-63 cells (Figure 8A). The ratio of LC3-II over LC3-I was remarkably increased to 1.1- and 1.2-fold in U-2 OS cells and 1.3- and 1.5-fold in MG-63 cells with treatment of ALS at 1 and 5 μM, respectively (P<0.05, 0.01, or 0.001; Figure 8B). These findings demonstrate a strong autophagy-inducing effect of ALS on U-2 OS and MG-63 cells via inhibition of the PI3K/Akt/mTOR pathway.
To further explore the mechanisms and potential crosslink between ALS-induced apoptosis and autophagy, we employed several chemical regulators of apoptosis and autophagy in both cell lines. Incubation of U-2 OS and MG-63 cells with 25 nM of FK866 did not affect the basal apoptosis and autophagy compared to the control cells (Figure 9). However, compared to the control cells, when U-2 OS and MG-63 cells were treated with ALS at 5 μM, the total percentage of apoptotic and autophagic cells were both increased (P<0.05, 0.01, or 0.001; Figure 9A and B). Treatment with FK866 did not significantly enhance ALS-induced apoptosis and autophagy in both cell lines. Furthermore, we evaluated the effect of SB202190 (a selective p38 inhibitor and autophagy inducer), WM (a PI3K inhibitor and autophagy blocker), chloroquine (an autophagy inhibitor), bafilomycin A1 (an autophagy inhibitor), and Z-VAD(OMe)-FMK (a pan-caspase inhibitor) on basal and ALS-induced apoptosis in U-2 OS and MG-63 cells (Figure 10A). It was obvious that ALS significantly induced apoptosis compared with the controls in both U-2 OS and MG-63 cells. While only 100 μM bafilomycin A1 significantly reduced ALS-induced apoptosis by 54.6% in U-2 OS cells. Next, we evaluated the effect of autophagy inducers or inhibitors on basal and ALS-induced autophagy in U-2 OS and MG-63 cells. In U-2 OS cells, treatment with 20 μM SB202190 or 10 μM chloroquine for 24 hours induced a 3.7- and 10.0-fold increase in basal autophagy compared to the control cells, respectively (P<0.05 or 0.001; Figure 10B). Bafilomycin A1 at 100 μM, WM at 10 μM, and Z-VAD(OMe)-FMK at 20 μM did not change basal autophagy in U-2 OS cells. Co-incubation of U-2 OS cells with 20 μM SB202190 plus ALS enhanced ALS-induced autophagy by 11.5% (P<0.01; Figure 10B). While 10 μM chloroquine, 100 μM bafilomycin A1, 10 μM WM, and 20 μM Z-VAD(OMe)-FMK reduced ALS-induced autophagy in U-2 OS cells (24.0%, 99.3%, 58.9%, and 41.8%, respectively, P<0.05 or 0.001; Figure 10B). In MG-63 cells, a similar inducing effect of 20 μM SB202190 and 100 μM bafilomycin A1 on basal autophagy was observed. Ten micromolar chloroquine, 10 μM WM, and 20 μM Z-VAD(OMe)-FMK did not affect the basal autophagy. Notably, WM reduced ALS-induced autophagy by 87.4% in MG-63 cells (P<0.001; Figure 10B). Z-VAD(OMe)-FMK at 20 μM did not significantly change ALS-induced autophagy. However, 20 μM SB202190, 100 μM bafilomycin A1, and 10 μM chloroquine increased ALS-induced autophagy (1.6-, 1.4-, and 1.4-fold, respectively, P<0.05 or 0.001; Figure 10B).
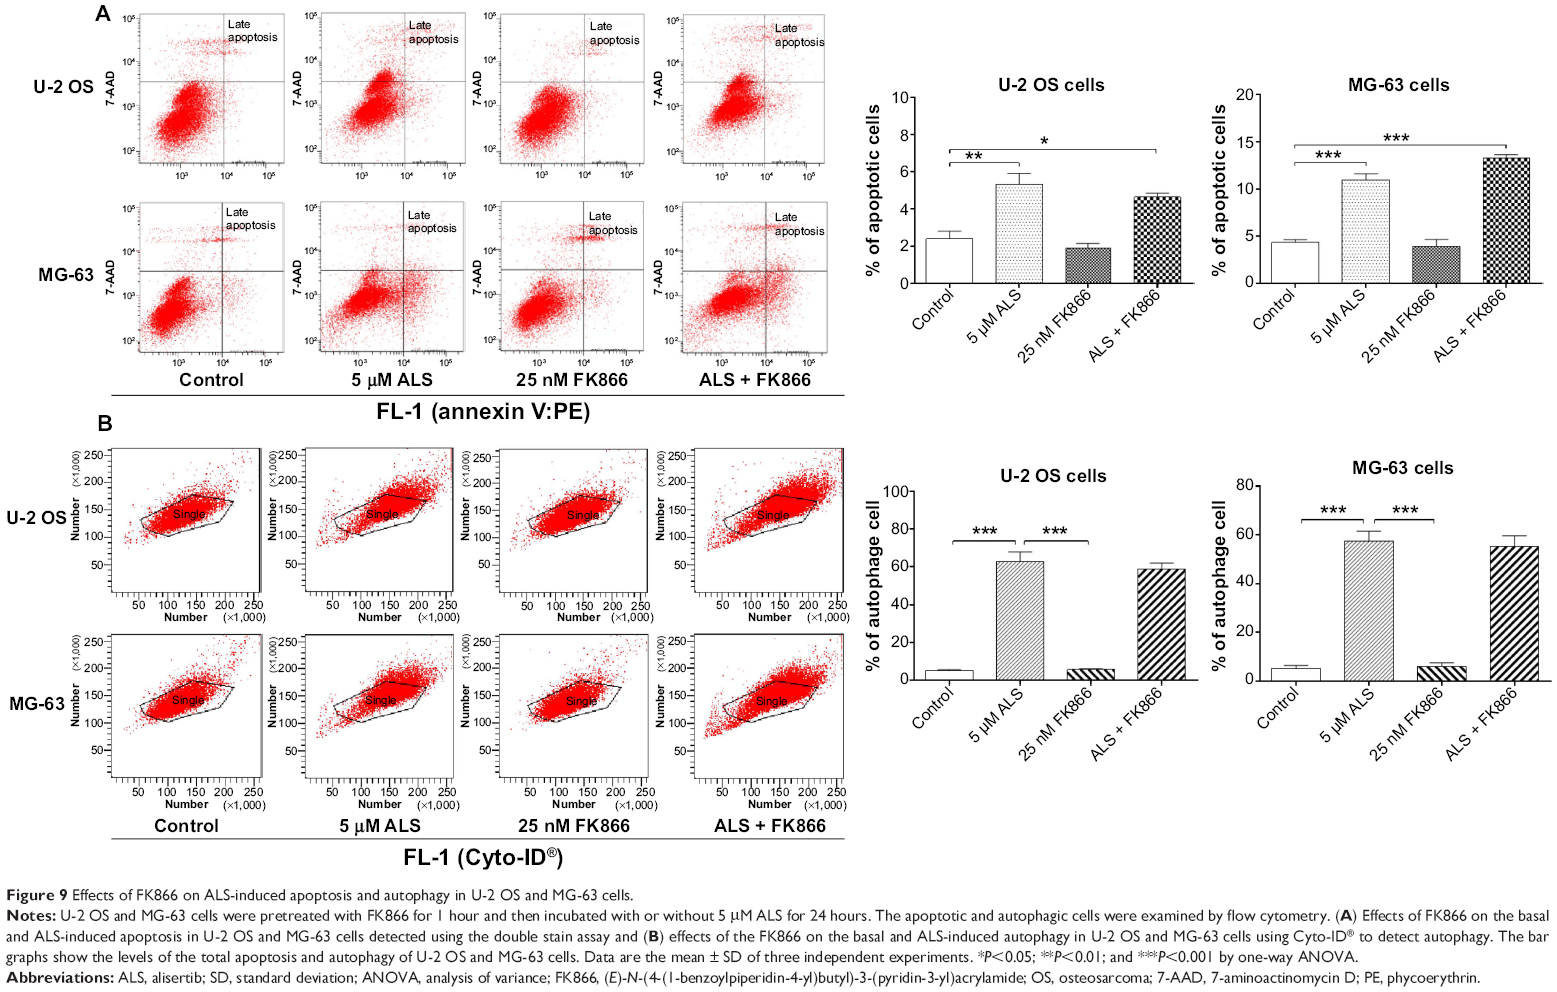 | Figure 9 Effects of FK866 on ALS-induced apoptosis and autophagy in U-2 OS and MG-63 cells. |
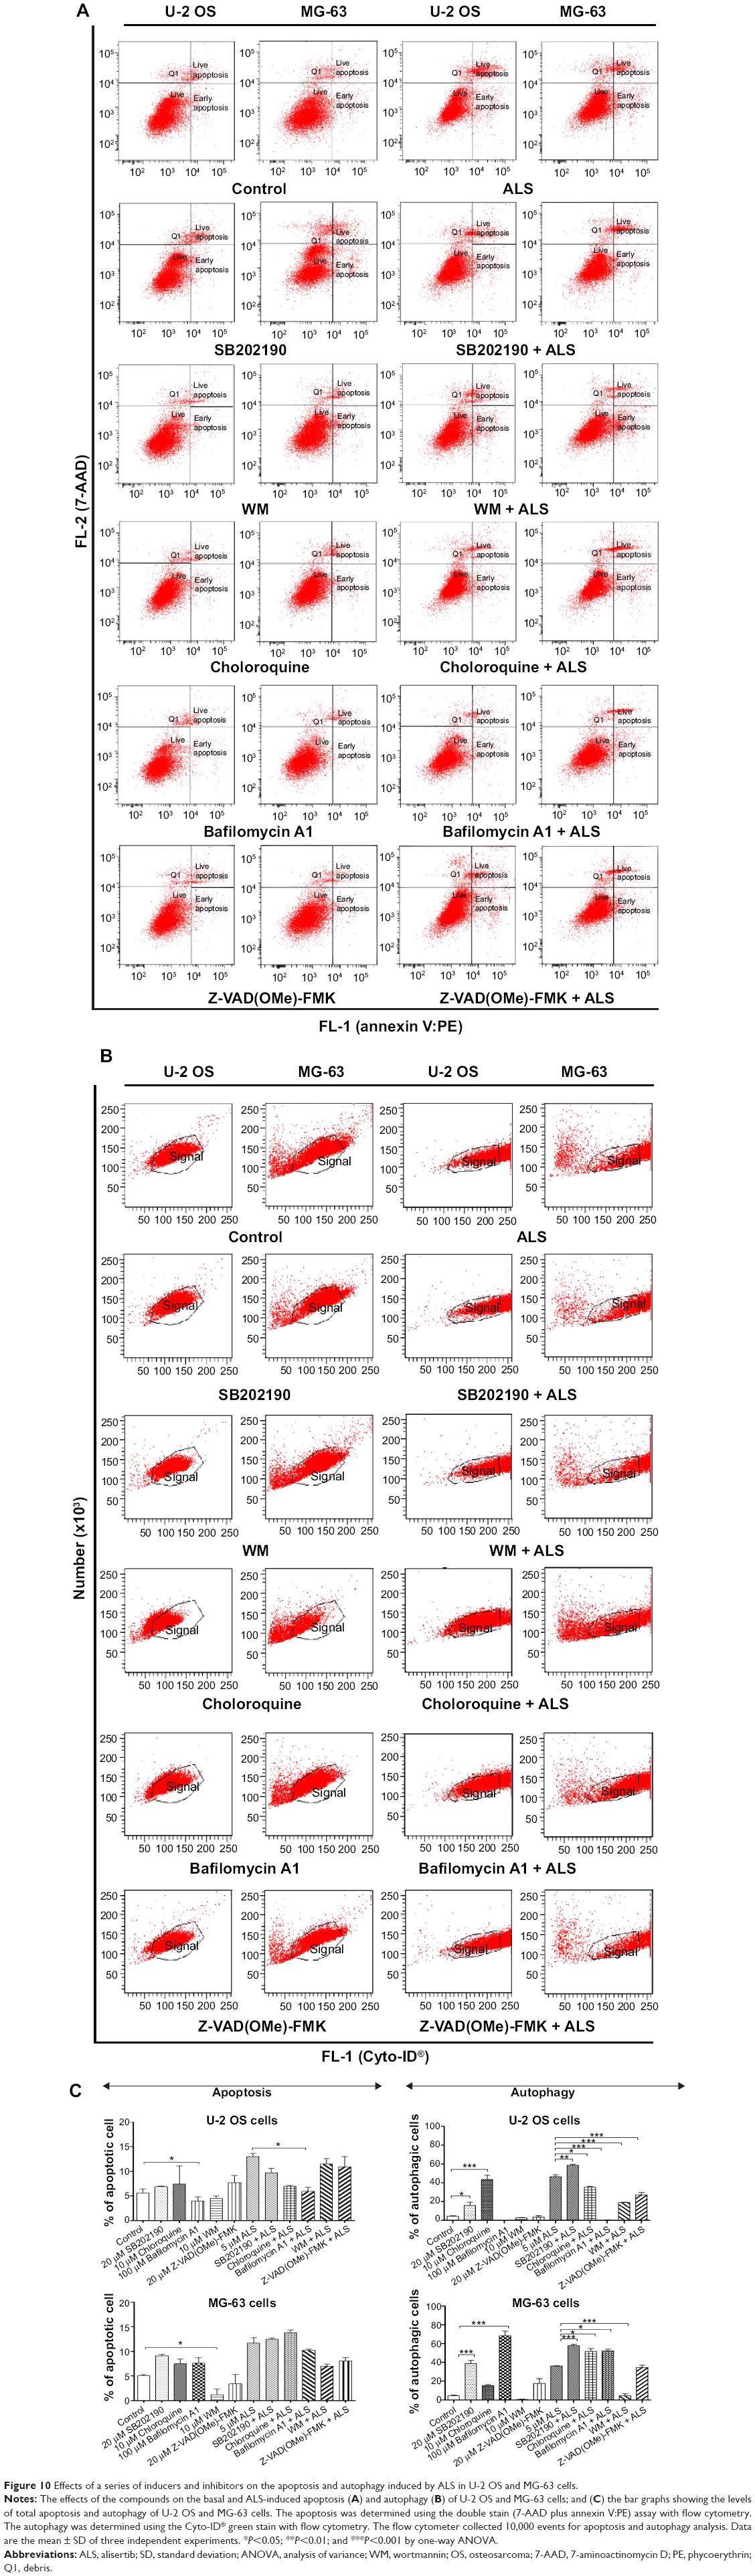 | Figure 10 Effects of a series of inducers and inhibitors on the apoptosis and autophagy induced by ALS in U-2 OS and MG-63 cells. |
We further confirmed the autophagy inducing effect of ALS with the modulation of p38 MAPK by SB202190 and PI3K by WM on U-2 OS and MG-63 cells using confocal microscopic examination. Treatment with 20 μM SB202190 for 24 hours induced a 1.5- and 1.7-fold increase in basal autophagy in U-2 OS and MG-63 cells, respectively (P<0.001; Figure 11A and B). While 10 μM WM did not affect the basal autophagy (Figure 11). In U-2 OS cells, co-incubation of SB202190 at 20 μM with ALS significantly enhanced ALS-induced autophagy by 28.5%, compared to the control cells receiving ALS alone. However, 10 μM WM did not affect the basal autophagy. In MG-63 cells, a similar effect of 20 μM SB202190 and 10 μM WM on ALS-induced autophagy was observed. There was a 39.1% and 23.5% increase in ALS-induced autophagy when treated with 20 μM SB202190 and 10 μM WM, respectively (P<0.001; Figure 11A and B). These findings show that modulation of p38 MAPK by SB202190 and PI3K by WM alter ALS-induced autophagy and apoptosis in both U-2 OS and MG-63 cells with differential effects depending on the cell type. Both U-2 OS and MG-63 cells responded well to the autophagy inducer SB202190, while the autophagy blocker WM increased ALS-induced autophagy in MG-63 cells but no change was observed in U-2 OS cells. There is a clear cell type-dependent response to ALS treatment.
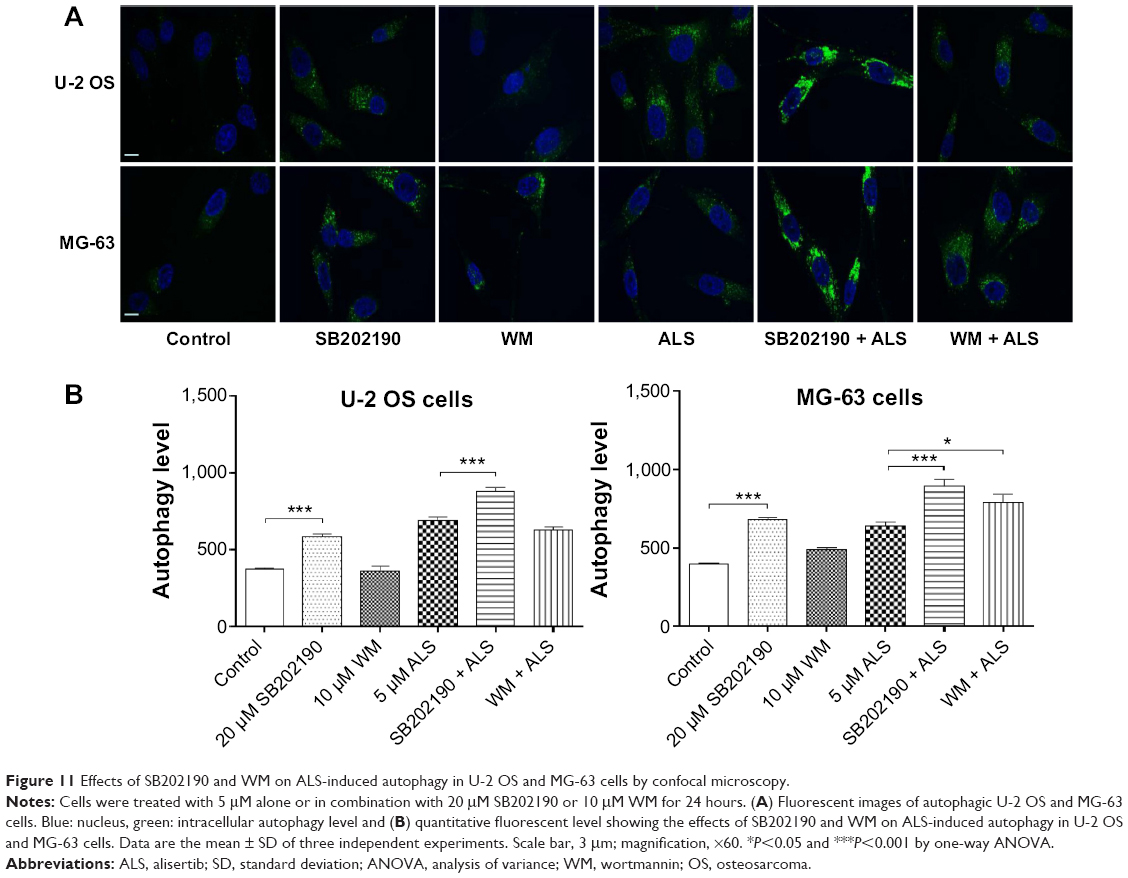 | Figure 11 Effects of SB202190 and WM on ALS-induced autophagy in U-2 OS and MG-63 cells by confocal microscopy. |
ALS inhibits EMT in U-2 OS and MG-63 cells
EMT is a critical process involving the initiation, growth, invasion, and metastasis of cancer.40 EMT depends on a reduction in expression of cell adhesion molecules. Herein, we examined the effect of ALS treatment on the expression of key EMT-associated markers in U-2 OS and MG-63 cells using Western blotting assay. As shown in Figure 12, the E-cadherin expression level was increased and N-cadherin expression level was decreased after ALS treatment in both cell lines. In U-2 OS cells, there was a 1.2- and 1.3-fold increase in the expression of E-cadherin, whereas N-cadherin expression level was suppressed by 19.9% and 20.6%, when treated with 1 and 5 μM ALS for 24 hours, respectively; (P<0.05; Figure 12A and B). In MG-63 cells, there was a 1.2-fold increase in the expression of E-cadherin when cells were treated with 5 μM ALS (P<0.05; Figure 12A and B). Meanwhile, treatment of MG-63 cells with ALS at 0.1, 1, and 5 μM for 24 hours decreased the expression of N-cadherin by 39.4%, 61.7%, and 58.6%, respectively (P<0.01 or 0.001; Figure 12A and B).
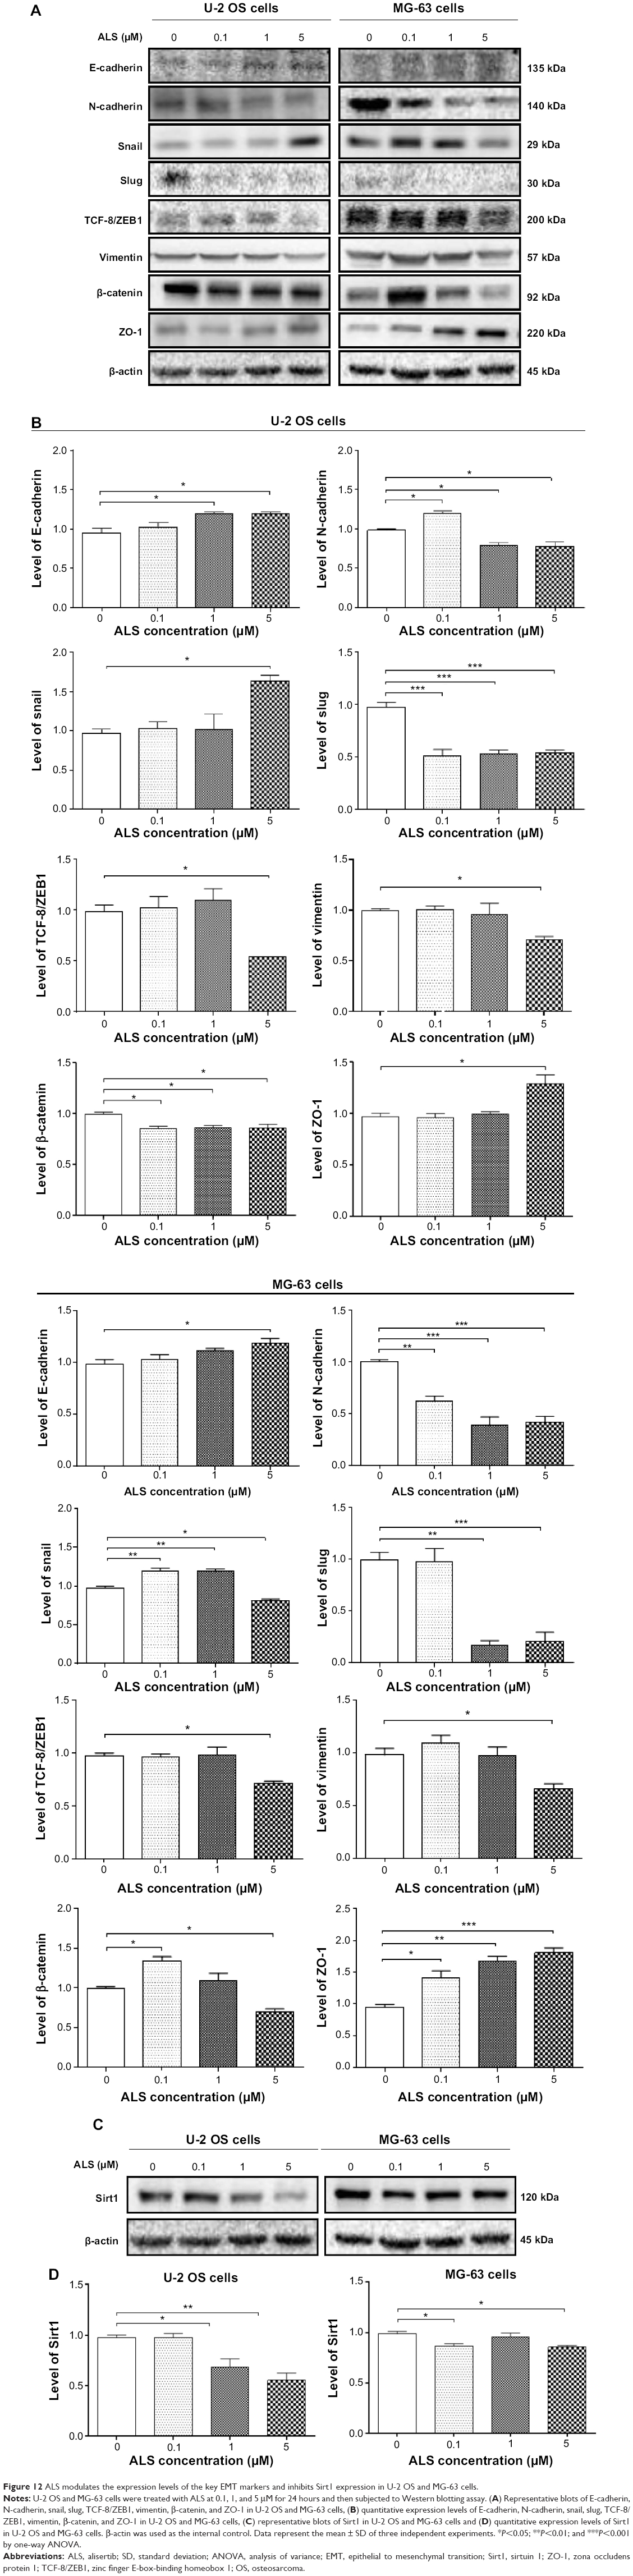 | Figure 12 ALS modulates the expression levels of the key EMT markers and inhibits Sirt1 expression in U-2 OS and MG-63 cells. |
In order to further examine the effect of ALS on EMT in U-2 OS and MG-63 cells, we tested the expression levels of several key regulators of E-cadherin (Figure 12). Snail and slug (both zinc finger transcriptional factors) together with TCF8/ZEB1 are suppressors of E-cadherin in EMT.26 In addition, snail blocks the cell cycle and confers resistance to cell death, and slug protects damaged cells from apoptosis by repressing p53-induced transcription of the pro-apoptotic Bcl-2 family protein PUMA.26 ALS significantly reduced the expression level of snail in MG-63 cells and slug in both cell lines. In U-2 OS cells, ALS increased the expression level of snail by1.7-fold when treated with 5 μM ALS for 24 hours (P<0.05; Figure 12A and B). ALS suppressed the expression level of slug by 48.1%, 45.8%, and 44.5% when treated with 0.1, 1, and 5 μM ALS for 24 hours, respectively (P<0.05; Figure 12A and B). In MG-63 cells, 0.1 and 1 μM ALS increased the expression level of snail by 1.2- and 1.2-fold, respectively (P<0.01; Figure 12A and B); but 5 μM ALS reduced expression level of snail by 16.9% (P<0.05; Figure 12A and B). The expression of slug was reduced by 82.6% and 78.9% when treated with 1 and 5 μM ALS for 24 hours, respectively (P<0.01 or 0.001; Figure 12A and B). Furthermore, in U-2 OS cells, 5 μM ALS suppressed the expression level of TCF-8/ZEB1 by 45.6% (P<0.05; Figure 12A and B). Similarly, there was a 26.5% reduction in the expression of TCF-8/ZEB1 in MG-63 cells treated with 5 μM ALS (P<0.05; Figure 12A and B).
Vimentin is a type III intermediate filament protein that is expressed in mesenchymal cells.26 β-catenin can act as an integral component of a protein complex in adherent junctions that helps cells maintain epithelial layers as well as participating in the Wnt signaling pathway as a downstream target.26 Cells treated with 5 μM ALS suppressed the expression level of vimentin by 28.8% in U-2 OS cells and 32.5% in MG-63 cells (P<0.05; Figure 12A and B). ALS at 0.1, 1, and 5 μM decreased the expression level of β-catenin by 14.2%, 13.4%, and 13.6% in U-2 OS cells (P<0.05; Figure 12A and B). However, 0.1 μM ALS increased β-catenin expression by 1.3-fold and 5 μM ALS reduced β-catenin expression by 30.1% in MG-63 cells (P<0.05; Figure 12A and B).
Finally, the expression of ZO-1 was examined in U-2 OS and MG-63 cells exposed to ALS. ZO-1 and -2 are required for tight junction formation and function. In sub-confluent proliferating cells, ZO-1 and ZO-2 have been shown to localize to the nucleus and play a role in transcriptional regulation, possibly through facilitating nuclear import/export of transcriptional regulators. There was a significant effect of ALS on the expression of ZO-1 observed in both cell lines (Figure 12A and B). Treatment of U-2 OS cells with 5 μM ALS for 24 hours increased ZO-1 expression by 1.3-fold (P<0.05; Figure 12A and B). Incubation of MG-63 cells with ALS at 0.1, 1, and 5 μM for 24 hours resulted in a 1.5-, 1.7-, and 1.9-fold increase in the expression level of ZO-1, respectively (P<0.05, 0.01, or 0.001; Figure 12A and B).
Sirt1 plays a role in ALS-induced apoptosis, autophagy, and EMT inhibition in U-2 OS and MG-63 cells
Sirt1 plays an important role in the regulation of cellular autophagy. Nucleus-localized Sirt1 is also known to induce the expression of autophagy pathway components through the activation of FoxO transcription factor family members.41 Therefore, we proposed that ALS might affect the Sirt1 expression level in U-2 OS and MG-63 cells. As shown in Figure 12C, there was a significant reduction in the expression of Sirt1 in both cell lines when treated with ALS. Incubation of U-2 OS cells with ALS at 1 and 5 μM for 24 hours reduced the expression of Sirt1 by 30.1% and 43.3%, respectively (P<0.05 or 0.01; Figure 12D). In MG-63 cells, treatment with ALS at 0.1 and 5 μM for 24 hours significantly suppressed the expression level of Sirt1 by 12.1% and 13.2%, respectively (P<0.05; Figure 12D).
ALS induces ROS generation and modulates redox pathways
Increased intracellular ROS level can cause cell death through various mechanisms, including mitochondria-mediated apoptosis and modulation of autophagy.42–44 Following the observation and verification of pro-apoptotic effect of ALS in U-2 OS and MG-63 cells, we examined the effect of ALS on ROS production in both cell lines. The intracellular level of ROS was significantly increased 1.6- and 1.8-fold in U-2 OS cells and 1.7- and 1.9-fold in MG-63 cells when treated with 1 and 5 μM ALS, respectively (P<0.05 or 0.01; Figure 13). The induced ROS generation contributes, at least in part, to the cancer cell killing effect of ALS in U-2 OS and MG-63 cells.
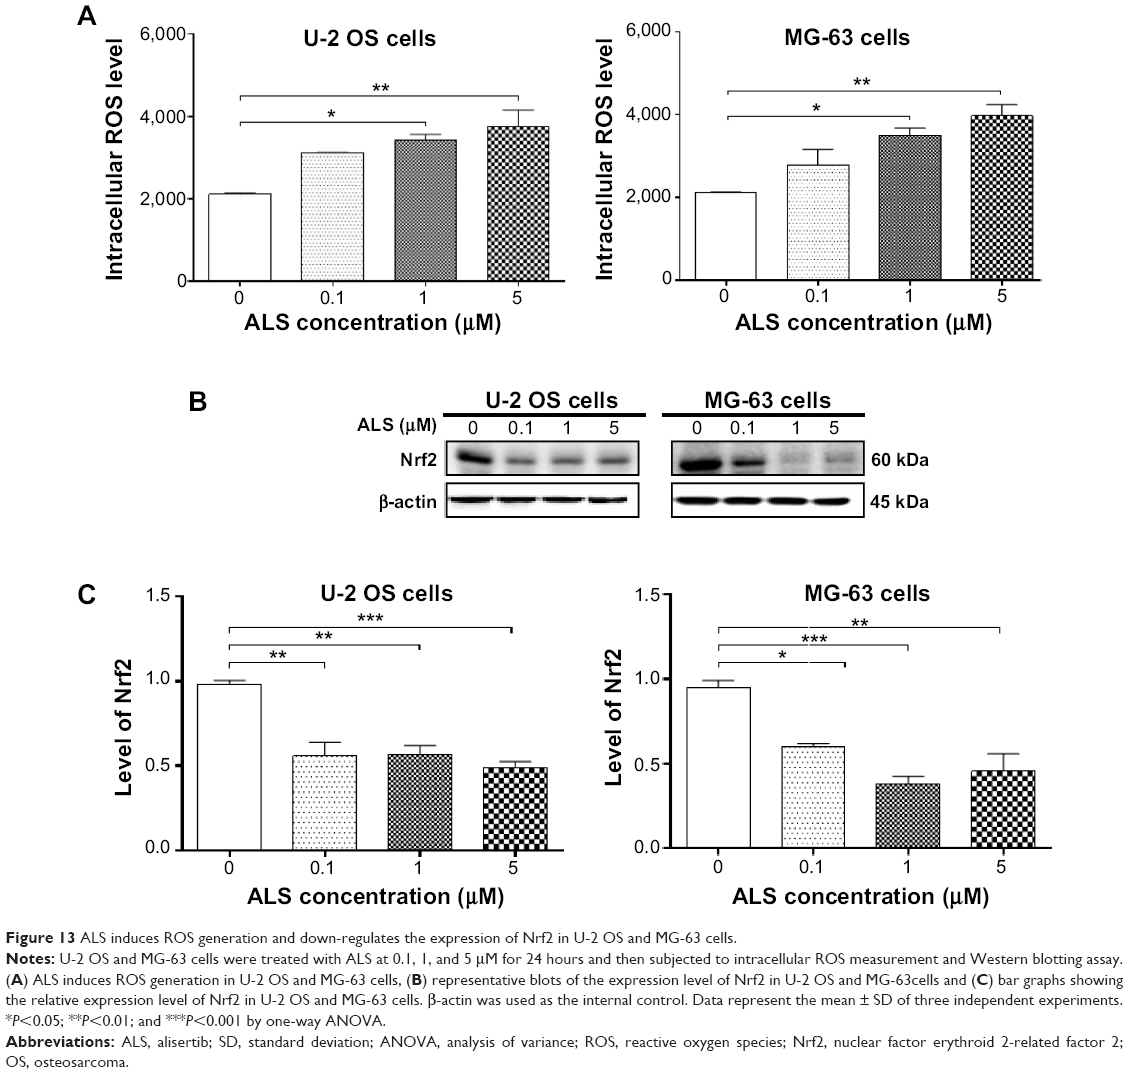 | Figure 13 ALS induces ROS generation and down-regulates the expression of Nrf2 in U-2 OS and MG-63 cells. |
Since Nrf2 controls the basal and induced expression of a wide array of antioxidant response element dependent genes to regulate the physiological and pathophysiological outcomes of oxidant exposure,45–47 we further determined the effects of ALS on its expression. As shown in Figure 13B, there was a remarkable reduction in the expression of Nrf2 in both cell lines. Incubation of U-2 OS cells with ALS at 0.1, 1, and 5 μM for 24 hours reduced the expression of Nrf2 by 43.1%, 42.3%, and 50.4%, respectively (P<0.01 or 0.001; Figure 13C). Similarly, in MG-63 cells, treatment with ALS at 0.1, 1, and 5 μM for 24 hours suppressed the expression level of Nrf2 by 36.7%, 60.1%, and 52.0%, respectively (P<0.05, 0.01, or 0.001; Figure 13C). These results suggest that the beneficial effects of ALS on U-2 OS and MG-63 cells may be associated with the redox homeostasis with the involvement of Nrf2-mediated signaling pathway.
Discussion
OS is still the most common primary malignancy of bone, and accounts for about 5% of pediatric cancers in the United States.1,2 The long-term survival trend has been stagnant over the past 20 years using conventional chemotherapy treatment.8 Treatment of advanced OS remains a major challenge because of poor efficacy of current therapies. There is an increased interest in seeking new effective drugs for OS. Aurora kinases have gained increasing attention as a potential target in anticancer therapy with AURKA overexpression in various cancer types. ALS is a small molecule inhibitor of AURKA that can lead to mitotic errors, followed by aneuploidy, apoptosis, and senescence.18 ALS has been found to exhibit anticancer activities in vitro and in vivo, which are attributed to its effects on multiple signaling pathways related to cell cycle arrest, apoptosis, and autophagy.16–18 In the present study, we observed a potent inhibitory effect of ALS on cell proliferation of U-2 OS and MG-63 cells. We found that ALS induced cell cycle arrest, promoted cell apoptosis and autophagy in U-2 OS and MG-63 cells. Furthermore, we observed that ALS inhibited EMT in both cell lines. Sirt1 and redox signaling might be involved in the anticancer effect of ALS in U-2 OS and MG-63 cells.
In this study, we found that ALS concentration-dependently arrested U-2 OS and MG-63 cells in G2/M as ALS concentration increased. We further explored the effect of ALS on the key regulators in cell cycle checkpoints including CDC2, cyclin B1, CDK2, and cyclin D. The CDC2-cyclin B1 complex is pivotal in regulating the G2/M phase transition and mitosis. We observed a significant decrease in the expression level of cyclin B1 and CDC2 in U-2 OS and MG-63 cells treated with ALS, providing an explanation for the effect of ALS on G2/M phase arrest. It has been reported that p21 Waf1/Cip1, a cyclin-dependent kinase inhibitor regulated by p53, can bind to the CDK1/CDC2-cyclin B1 complex thereby inducing cell cycle arrest. We observed that the expression of p53 and p21 Waf1/Cip1 was increased in U-2 OS and MG-63 cells treated with ALS, which probably contributes to the inhibitory effect of ALS on cell proliferation and inducing effect on cell cycle arrest in U-2 OS and MG-63 cells.
Apoptosis is executed by members of the caspase family of cysteine proteases, which can be activated by two main pathways, namely the extrinsic death receptor pathway and the intrinsic mitochondria/cytochrome c-mediated pathway.21,32 The two pathways are linked and both triggered by the activation of caspase-3, 6, and 7. In the death receptor pathway, binding of extracellular death ligands to members of the tumor necrosis factor and nerve growth factor receptor superfamily induces activation of caspase-8, which in turn activates caspase-3 and 7, resulting in further caspase activation events and finally cell death.21,32 In this study, we observed a concentration-dependent apoptosis induced by ALS. It is known that mitochondrial disruption and the subsequent release of cytochrome c initiates the process of apoptosis.21,32 The release of cytochrome c from the mitochondria was initiated by pro-apoptotic members of the Bcl-2 family but antagonized by anti-apoptotic members of this family. Anti-apoptotic members of Bcl-2 can be inhibited by post-translational modification and/or by increased expression of PUMA, which is an essential regulator of p53-mediated cell apoptosis.21,32 In addition, the cytosolic cytochrome c released from mitochondria following an apoptotic stimulus serves as a main trigger of caspase enzyme activation.21,32 In our study, we found that the cytosolic level of cytochrome c was significantly increased after ALS treatment, which subsequently activated caspase-9. Activated caspase-9 in turn activated caspase-3. The activated caspase-3 ultimately induced apoptosis with a decrease in Bcl-2 level. Moreover, we noted a concentration-dependent increase in the expression of PUMA. These results indicated that ALS induces mitochondria-dependent apoptosis in both U-2 OS and MG-63 cells with the involvement of p53.
Autophagy is a primary morphologically distinctive mode of programmed cell death, which is an important, conserved catabolic process involving the engulfment and degradation of non-essential or abnormal cellular organelles and proteins in living cells.34,48 Autophagy has been known to promote cellular survival during nutrient depletion and is essential for maintaining cellular hemostasis by degrading damaged organelles and proteins.34,48,49 This complicated process is executed through multi-step intracellular membrane/vesicle reorganization to form double-membraned autophagosomes that fuse with lysosome to form autophagolysosomes, which in turn degrade the contents via acidic lysosomal hydrolases. The PI3K/Akt/mTOR signaling pathway is a central pathway promoting cell growth, motility, protein synthesis, survival, and metabolism in response to hormones, growth factors, and nutrients.32,50 PI3K activates the serine/threonine kinase Akt, which in turn through a cascade of regulators results in the phosphorylation and activation of the serine/threonine kinase mTOR.50 In this study, ALS induced autophagy in both U-2 OS and MG-63 cells, which may contribute to its anticancer activity. We also observed that the autophagy-inducing effect of ALS overweighed the apoptosis-inducing effect of ALS. The inhibition of PI3K/Akt/mTOR contributes to the autophagy-inducing effect of ALS.
AMPK, the master energy sensor, is an important regulator of cell death under various conditions, through activation of c-Jun N-terminal kinase and p53 and inhibition of mTOR.48 In the present study, there was a significant activation of AMPK with ALS treatment which may contribute to the inhibition of mTOR. ROS is known to activate AMPK. In our study, we observed a concentration-dependent increase in intracellular ROS generation, which may be a contributing factor to the activation of AMPK. Furthermore, ALS significantly suppressed the phosphorylation of p38 MAPK. p38 MAPK is responsive to stress stimuli, such as cytokines, ultraviolet irradiation, heat shock, and osmotic shock, and regulates cell differentiation, apoptosis, and autophagy.48 Taken together, both AMPK and p38 MAPK play an important role in ALS-induced OS cells autophagy.
OS has a high tendency of metastases and the most common site for metastasis is the lung. The potential metastasis in OS is caused by migration and invasion of tumor cells throughout metastasis and the establishment of cell–cell adhesions by connecting the metastatic cell to its new environment.7 EMT is characterized as epithelial cells that lose their polarization and specialized junction structures, undergoing cytoskeleton reorganization and acquiring morphological and functional features of mesenchymal-like cells.26 The understanding of detailed pathogenic mechanism of tumor formation and metastasis is essential to develop the potential treatment strategies of OS.51,52 E-cadherin is considered an active suppressor of invasion and growth of many epithelial cancers. Tight junctions, or zonula occludens, form a continuous barrier to fluids across the epithelium and endothelium. They regulate the paracellular permeability, maintain cell polarity, and block the movement of transmembrane proteins between the apical and the basolateral cell surfaces. Tight junctions are composed of claudin and occludin proteins, which join the junctions to the cytoskeleton. ZO-1, 2, and 3 are peripheral membrane adaptor proteins that link junctional transmembrane proteins such as occludin and claudin to the actin cytoskeleton.26 By regulating the activities of the inducers of EMT, it is an obvious strategy to inhibit OS progression.7 In the present study, ALS significantly increased the ratio of E-cadherin over N-cadherin which would result in an EMT inhibition in OS. The slug expression was increased in U-2 OS cells, but suppressed in MG-63 cells by ALS treatment. Snail and slug are master regulators of EMT down-regulating E-cadherin by silencing gene expression.26 TCF8/ZEB1 functions as an activator of EMT process through down-regulation of epithelial genes.26 Moreover, ALS significantly increased the expression level of ZO-1, but decreased the expression level of vimentin. ZO-1 is required for tight junction formation and function involving the regulation of paracellular permeability and the maintenance of cell polarity, blocking the movement of transmembrane proteins between the apical and the basolateral cell surfaces,53 whereas vimentin is a marker expressed in mesenchymal cells.26 The role of Sirt1 in the development of EMT was also examined in this study. It has been reported that silencing Sirt1 can promote the shift to an epithelial morphology.28 In agreement with the previous study, we found that inhibition of Sirt1 increased the ratio of E-cadherin over N-cadherin in U-2 OS and MG-63 cells. The results showed that suppression of Sirt1 prevented EMT progress in OS cells. This may indicate that ALS inhibited EMT through a Sirt1-mediated pathway.
Additionally, we found a significant inducing effect of ALS on ROS generation in U-2 OS and MG-63 cells. However, the mechanism of how ALS induces ROS generation is unclear. Nicotinamide adenine dinucleotide phosphate oxidase is the major intracellular enzymatic source of ROS, which can be a potential target of ALS. Nrf2 is a nuclear transcription factor playing a pivotal role in the regulation of oxidative stress by modulating the transcription of antioxidant response elements.46 It indicates that ALS may induce oxidative stress through Nrf2-mediated signaling pathway. The results may indicate that ROS has an important role in ALS-induced apoptosis and autophagy in U-2 OS and MG-63 cells. However, further studies are needed to elucidate how ALS induces ROS generation and modulates redox homeostasis.
Conclusion
ALS inhibited cell proliferation, increased intracellular level of ROS, activated mitochondria-dependent apoptotic pathway, and induced autophagy in human U-2 OS and MG-63 cells. ALS induced the inhibition of PI3K/Akt/mTOR and p38 MAPK pathways and activation of AMPK, contributing to the autophagy-inducing activities of ALS. Modulation of autophagy altered basal and ALS-induced apoptosis in both cell lines. In addition, ALS suppressed EMT via the regulation of E-cadherin suppressor with the involvement of Sirt1. Moreover, induction of intracellular ROS level may contribute to the apoptosis- and autophagy-inducing effects of ALS on both U-2 OS and MG-63 cells. Taken together, ALS may represent a new anticancer drug that can kill OS cells and prevent EMT. More functional and mechanistic studies are warranted to elucidate the role and underlying mechanisms of ALS in the treatment of OS.
Acknowledgments
The authors appreciate the support from the College of Pharmacy and Morsani College of Medicine, University of South Florida, Tampa, FL, USA. Drs Giang HT Au and Zhi-Wei Zhou are holders of postdoctoral scholarship from College of Pharmacy, University of South Florida, Tampa, FL, USA.
Disclosure
The authors have no conflicts of interest to disclose.
References
Marulanda GA, Henderson ER, Johnson DA, Letson GD, Cheong D. Orthopedic surgery options for the treatment of primary osteosarcoma. Cancer Control. 2008;15(1):13–20. | ||
Mirabello L, Troisi RJ, Savage SA. Osteosarcoma incidence and survival rates from 1973 to 2004: data from the Surveillance, Epidemiology, and End Results Program. Cancer. 2009;115(7):1531–1543. | ||
Ritter J, Bielack SS. Osteosarcoma. Ann Oncol. 2010;21 Suppl 7:vii320–5. | ||
Ottaviani G, Jaffe N. The epidemiology of osteosarcoma. In: Jaffe, Bruland OS, Bielack S, editors. Pediatric and Adolescent Osteosarcoma. Springer; 2010:3–13. | ||
Ta HT, Dass CR, Choong PF, Dunstan DE. Osteosarcoma treatment: state of the art. Cancer Metastasis Rev. 2009;28(1–2):247–263. | ||
Bielack S, Carrle D, Casali PG; ESMO Guidelines Working Group. Osteosarcoma: ESMO clinical recommendations for diagnosis, treatment and follow-up. Ann Oncol. 2009;20 Suppl 4:137–139. | ||
Yang G, Yuan J, Li K. EMT transcription factors: implication in osteosarcoma. Med Oncol. 2013;30(4):697. | ||
Gill J, Ahluwalia MK, Geller D, Gorlick R. New targets and approaches in osteosarcoma. Pharmacol Ther. 2013;137(1):89–99. | ||
Chaabane W, User SD, El-Gazzah M, et al. Autophagy, apoptosis, mitoptosis and necrosis: interdependence between those pathways and effects on cancer. Arch Immunol Ther Exp (Warsz). 2013;61(1):43–58. | ||
Su M, Mei Y, Sinha S. Role of the crosstalk between autophagy and apoptosis in cancer. J Oncol. 2013;2013:102735. | ||
Xie X, White EP, Mehnert JM. Coordinate autophagy and mTOR pathway inhibition enhances cell death in melanoma. PLoS One. 2013;8(1):e55096. | ||
Zou Z, Yuan Z, Zhang Q, et al. Aurora kinase A inhibition-induced autophagy triggers drug resistance in breast cancer cells. Autophagy. 2012;8(12):1798–1810. | ||
Fimia GM, Piacentini M. Regulation of autophagy in mammals and its interplay with apoptosis. Cell Mol Life Sci. 2010;67(10):1581–1588. | ||
Marquez RT, Xu L. Bcl-2: Beclin 1 complex: multiple, mechanisms regulating autophagy/apoptosis toggle switch. Am J Cancer Res. 2012;2(2):214–221. | ||
Erlich S, Mizrachy L, Segev O, et al. Differential interactions between Beclin 1 and bcl-2 family members. Autophagy. 2007;3(6):561–568. | ||
Yan A, Wang L, Xu S, Xu J. Aurora-A kinase inhibitor scaffolds and binding modes. Drug Discov Today. 2011;16(5–6):260–269. | ||
Kitzen JJ, de Jonge MJ, Verweij J. Aurora kinase inhibitors. Crit Rev Oncol Hematol. 2010;73(2):99–110. | ||
Friedberg JW, Mahadevan D, Cebula E, et al. Phase II study of alisertib, a selective Aurora A kinase inhibitor, in relapsed and refractory aggressive B- and T-cell non-Hodgkin lymphomas. J Clin Oncol. 2014;32(1):44–50. | ||
Vader G, Lens SM. The Aurora kinase family in cell division and cancer. Biochim Biophys Acta. 2008;1786(1):60–72. | ||
Kruse JP, Gu W. Modes of p53 regulation. Cell. 2009;137(4):609–622. | ||
Tasdemir E, Maiuri MC, Galluzzi L, et al. Regulation of autophagy by cytoplasmic p53. Nat Cell Biol. 2008;10(6):676–687. | ||
Maiuri MC, Galluzzi L, Morselli E, Kepp O, Malik SA, Kroemer G. Autophagy regulation by p53. Curr Opin Cell Biol. 2010;22(2):181–185. | ||
Maris JM, Morton CL, Gorlick R, et al. Initial testing of the aurora kinase A inhibitor MLN8237 by the Pediatric Preclinical Testing Program (PPTP). Pediatr Blood Cancer. 2010;55(1):26–34. | ||
Yuan CX, Zhou ZW, Yang YX, et al. Inhibition of mitotic Aurora kinase A by alisertib induces apoptosis and autophagy of human gastric cancer AGS and NCI-N78 cells. Drug Des Devel Ther. 2015;9:487–508. | ||
Ding YH, Zhou ZW, Ha CF, et al. Alisertib, an Aurora kinase A inhibitor, induces apoptosis and autophagy but inhibits epithelial to mesenchymal transition in human epithelial ovarian cancer cells. Drug Des Devel Ther. 2015;9:425–464. | ||
Tsai JH and Yang J. Epithelial-mesenchymal plasticity in carcinoma metastasis. Genes Dev. 2013;27(20):2192–2206. | ||
Houtkooper RH, Pirinen E, Auwerx J. Sirtuins as regulators of metabolism and healthspan. Nat Rev Mol Cell Biol. 2012;13(4):225–238. | ||
Byles V, Zhu L, Lovaas JD, et al. SIRT1 induces EMT by cooperating with EMT transcription factors and enhances prostate cancer cell migration and metastasis. Oncogene. 2012;31(43):4619–4629. | ||
Cantley LC. The phosphoinositide 3-kinase pathway. Science. 2002;296(5573):1655–1657. | ||
Hu X, Moscinski LC. Cdc2: a monopotent or pluripotent CDK? Cell Prolif. 2011;44(3):205–211. | ||
Warfel NA, El-Deiry WS. p21WAF1 and tumourigenesis: 20 years after. Curr Opin Oncol. 2013;25(1):52–58. | ||
Estaquier J, Vallette F, Vayssiere J-L, Mignotte B. The mitochondrial pathways of apoptosis. Adv Exp Med Biol. 2012;942:157–183. | ||
Li P, Nijhawan D, Budihardjo I, et al. Cytochrome c and dATP-dependent formation of Apaf-1/caspase-9 complex initiates an apoptotic protease cascade. Cell. 1997;91(4):479–489. | ||
Klionsky DJ, Emr SD. Cell biology – Autophagy as a regulated pathway of cellular degradation. Science. 2000;290(5497):1717–1721. | ||
Arthur JS, Ley SC. Mitogen-activated protein kinases in innate immunity. Nat Rev Immunol. 2013;13(9):679–692. | ||
Koul HK, Pal M, Koul S. Role of p38 MAP kinase signal transduction in solid tumors. Genes Cancer. 2013;4(9–10):342–359. | ||
Zhang X, Tang N, Hadden TJ, Rishi AK. Rishi, Akt, FoxO and regulation of apoptosis. Biochim Biophys Acta. 2011;1813(11):1978–1986. | ||
Rabinowitz JD, White E. Autophagy and metabolism. Science. 2010;330(6009):1344–1348. | ||
Mester J, Eng C. When overgrowth bumps into cancer: the PTEN-opathies. Am J Med Genet C Semin Med Genet. 2013;163C(2):114–121. | ||
Cannito S, Novo E, di Bonzo LV, Busletta C, Colombatto S, Parola M. Epithelial-mesenchymal transition: from molecular mechanisms, redox regulation to implications in human health and disease. Antioxid Redox Signal. 2010;12(12):1383–1430. | ||
Ng F, Tang BL. Sirtuins’ modulation of autophagy. J Cell Physiol. 2013;228(12):2262–2270. | ||
Bellot GL, Liu D, Pervaiz S. ROS, autophagy, mitochondria and cancer: Ras, the hidden master? Mitochondrion. 2013;13(3):155–162. | ||
Dodson M, Darley-Usmar V, Zhang J. Cellular metabolic and autophagic pathways: traffic control by redox signaling. Free Radic Biol Med. 2013;63:207–221. | ||
Kaminskyy VO, Zhivotovsky B. Free radicals in cross talk between autophagy and apoptosis. Antioxid Redox Signal. 2014;21(1):86–102. | ||
Suzuki T, Motohashi H, Yamamoto M. Toward clinical application of the Keap1-Nrf2 pathway. Trends Pharmacol Sci. 2013;34(6):340–346. | ||
Ma Q. Role of nrf2 in oxidative stress and toxicity. Annu Rev Pharmacol Toxicol. 2013;53:401–426. | ||
Kensler TW, Wakabayashi N, Biswal S. Cell survival responses to environmental stresses via the Keap1-Nrf2-ARE pathway. Annu Rev Pharmacol Toxicol. 2007;47:89–116. | ||
Denton D, Nicolson S, Kumar S. Cell death by autophagy: facts and apparent artefacts. Cell Death Differ. 2012;19(1):87–95. | ||
Chen Y, Yu L. Autophagic lysosome reformation. Exp Cell Res. 2013;319(2):142–146. | ||
Rodon J, Dienstmann R, Serra V, Tabernero J. Development of PI3K inhibitors: lessons learned from early clinical trials. Nat Rev Clin Oncol. 2013;10(3):143–153. | ||
Ferguson WS, Goorin AM. Current treatment of osteosarcoma. Cancer Invest. 2001;19(3):292–315. | ||
Yang J, Mani SA, Donaher JL, et al. Twist, a master regulator of morphogenesis, plays an essential role in tumor metastasis. Cell. 2004;117(7):927–939. | ||
Shin K, Margolis B. ZOning out tight junctions. Cell. 2006;126(4):647–649. |
 © 2015 The Author(s). This work is published and licensed by Dove Medical Press Limited. The full terms of this license are available at https://www.dovepress.com/terms.php and incorporate the Creative Commons Attribution - Non Commercial (unported, v3.0) License.
By accessing the work you hereby accept the Terms. Non-commercial uses of the work are permitted without any further permission from Dove Medical Press Limited, provided the work is properly attributed. For permission for commercial use of this work, please see paragraphs 4.2 and 5 of our Terms.
© 2015 The Author(s). This work is published and licensed by Dove Medical Press Limited. The full terms of this license are available at https://www.dovepress.com/terms.php and incorporate the Creative Commons Attribution - Non Commercial (unported, v3.0) License.
By accessing the work you hereby accept the Terms. Non-commercial uses of the work are permitted without any further permission from Dove Medical Press Limited, provided the work is properly attributed. For permission for commercial use of this work, please see paragraphs 4.2 and 5 of our Terms.