")
Back to Journals » ClinicoEconomics and Outcomes Research » Volume 8
Prioritizing health system and disease burden factors: an evaluation of the net benefit of transferring health technology interventions to different districts in Zimbabwe
Authors Shamu S, Rusakaniko S, Hongoro C
Received 24 August 2015
Accepted for publication 2 May 2016
Published 24 November 2016 Volume 2016:8 Pages 695—705
DOI https://doi.org/10.2147/CEOR.S95037
Checked for plagiarism Yes
Review by Single anonymous peer review
Peer reviewer comments 3
Editor who approved publication: Professor Giorgio Colombo
Shepherd Shamu,1 Simbarashe Rusakaniko,1 Charles Hongoro,2
1Department of Community Medicine, College of Health Sciences, University of Zimbabwe, Harare, Zimbabwe; 2Human Sciences Research Council of South Africa
Introduction: Health-care technologies (HCTs) play an important role in any country’s health-care system. Zimbabwe’s health-care system uses a lot of HCTs developed in other countries. However, a number of local factors have affected the absorption and use of these technologies. We therefore set out to test the hypothesis that the net benefit regression framework (NBRF) could be a helpful benefit testing model that enables assessment of intra-national variables in HCT transfer.
Method: We used an NBRF model to assess the benefits of transferring cost-effective technologies to different jurisdictions. We used the country’s 57 administrative districts to proxy different jurisdictions. For the dependent variable, we combined the cost and effectiveness ratios with the districts’ per capita health expenditure. The cost and effectiveness ratios were obtained from HIV/AIDS and malaria randomized controlled trials, which did either a prospective or retrospective cost-effectiveness analysis. The independent variables were district demographic and socioeconomic determinants of health.
Results: The study showed that intra-national variation resulted in different net benefits of the same health technology intervention if implemented in different districts in Zimbabwe. The study showed that population data, health data, infrastructure, demographic and health-seeking behavior had significant effects on the net margin benefit for the different districts. The net benefits also differed in terms of magnitude as a result of the local factors.
Conclusion: Net benefit testing using local data is a very useful tool for assessing the transferability and further adoption of HCTs developed elsewhere. However, adopting interventions with a positive net benefit should also not be an end in itself. Information on positive or negative net benefit could also be used to ascertain either the level of future savings that a technology can realize or the level of investment needed for the particular technology to become beneficial.
Keywords: net benefit, benefit testing, health technology, transferability, prioritization, resource allocation
Introduction
Health-care technologies (HCTs) are an integral part of health-care delivery globally and play an important role in any country’s health-care system. Low-income countries (LICs) such as Zimbabwe do not have the resources to develop health technologies de novo, hence use technologies developed elsewhere. At the same time, these LICs and other emerging economies present a largely underserved HCT market. Zimbabwe operates a four-level tier health-care system, where the first level of care is made up of more than 1,300 rural health centers and urban clinics that provide first-level primary care. The second level of care consists of about 58 rural and urban district hospitals, most of which are hybrid hospitals that provide both primary and secondary level care. It is at the district level that patients have first contact with doctors, although for urban clinics doctors do have designated days on which they offer their services to patients. The third level of care is serviced by about 8 provincial hospitals and the last level of care is serviced by 5 central hospitals, which provide more sophisticated care and some also act as teaching hospitals. However, all levels of care do require HCTs that are relevant to their needs. Logically, the level of sophistication of the technologies should increase by level of care.
Use of medical technologies
Arasaratnam and Humphreys1 in their paper on how emerging economies are driving frugal innovation, noted that there was a high concentration (76%) of medical device usage in developed countries catering for only 13% of the global population, the emergence of developing countries such as China and India as major global markets for medical technologies has necessitated the need for the development of appropriate, cost-effective, affordable and accessible medical equipment for low-income people. In the baseline survey of medical technologies by the World Health Organization (WHO) for a total of 161 countries which responded, the results of the survey showed that there were are about 1.5 million medical devices in use in those countries. However, out of those 161 countries, WHO estimated that a total of 55 of the countries had no regulatory authority to regulate the medical devices. A total of 87 of the countries did not have a national health technology policy, while 93 of the countries did not have an approved list of medical devices for procurement and reimbursement.1
The WHO baseline survey also noted that Zimbabwe did not have a national policy on health technology and a regulatory agency for health technology. While the country has national level procurement policy guidelines, for the medical devices incorporation policy guidelines for donations it uses the WHO guidelines. The list of approved medical devices for procurement or reimbursement is available, but only as a recommendation, while there are no national lists of recommended medical devices for specific procedures and official nomenclature system for medical devices. The lack of these facets pose a challenge for the adoption and implementation of locally relevant and cost-effective medical
devices.
A country’s needs drive frugal innovation which involves “smart” adoption of global HCTs that are originally developed and tested elsewhere to address local health-care needs. Existing barriers toward successful adoption or transfer of global HCTs are documented by Osika et al2 and Humphreys et al.1 In a Health System Assessment done in 2010 by Osika et al2 a number of regional areas in the country had less than the expected availability levels for key HCTs as a result of a number of barriers. The main barriers included lack of finance, lack of human resources to use and maintain HCTs, unavailability of proper infrastructure and nonfunctionality of some of the equipment. Naturally, such problems force countries to make decisions based not only on the efficacy and cost-effectiveness of the HCT but also based on factors listed earlier, including disease burden and equity.
Transferability of health technologies
The huge costs associated with clinical trials make it imperative that researchers generalize their results to be implementable in as many countries and as many settings as possible. Countries that have no capacity to run their own trials have to rely on HCTs developed in countries, whose efficacy and cost-effectiveness may not be suitable to their local conditions. Generalizability of HCT evaluations results alone is not necessarily a sufficient condition for implementing health technologies in other jurisdictions, specifically for HCTs evaluated under trial conditions. Different settings have different characteristics associated with them.
According to Drummond et al,3 data from economic evaluations are generally assumed not generalizable as a result of factors that vary from place to place. In cases where data for economic evaluation is collected alongside a clinical trial, the problem of generalizability becomes even more significant. Instead of relying on generalizability, countries have to first assess the transferability of HCTs before they can implement them in their settings. Cambon et al4 also concluded in their review that research in the area of transferability needed to be developed in order to better inform stakeholders so that they can implement transferable and evidence-based interventions. According to Manca and Willan,5 decision making is inherently country specific, and decision makers are only concerned with implementing interventions that are relevant to their settings.
Generalizability of results is not synonymous with transferability per se. Ryan6 described transferability as referring to whether a “trial, study or model has transportability that can produce unbiased inferences if used in another healthcare system.” Cambon et al,4 who did an extensive literature review on the definition of transferability of interventions with a focus on health education, found out that the terms used for transferability varied and that sometimes transferability was used to refer to general applicability. Their conclusion was that transferability should be used when one is assessing the results of an intervention in relation to the original location where the experiment took place. A systematic review on transferability of economic evaluation by Goeree et al7 identified 77 possible factors that could potentially affect the transferability of economic evaluations.
Rationale for the study
A classic example of why benefit testing of HCTs is vital in resource limited settings came in the form of a story of how Zimbabwe’s Ministry of Health and Child Care (MoHCC), in 2012, acquired about 60,000 malaria testing kits known as Para-Check for US$100,000.8 The acquisition of the test kits by the MoHCC malaria program was based on the validation of their specificity and sensitivity and overall cost-effectiveness in other countries. For example, studies in Tanzania by Mboeri et al9 on the cost effectiveness of Para-Check compared to microscopy had confirmed that Para-Check performed well above average, with a sensitivity of 90%, a specificity of 96.6%, a positive predictive value of 88.9% and a negative predictive value of 97%. At a cost of US$0.62 per test, Para-Check was deemed to be cost-effective in confirming Plasmodium falciparum. A follow-up study in 2008 in Tanzania’s eastern district also confirmed the effectiveness of Para-Check P. falciparum in malaria diagnosis with a sensitivity of 93.1% and specificity of 98.9%.10 However, when the Para-Check was deployed by the MoHCC in the various districts of Zimbabwe, clinicians on the ground complained about the ineffectiveness of the malaria test. The clinicians stated that the test had a sensitivity of about 50%.
While the study by Mboera et al9 concluded that Para-Check was more cost-effective as compared to microscopy, they found some variation in effectiveness across the participating districts. The test performed poorly where the kits had been stored for 12 months in room temperature of 23.5 ± 3.5 degrees Celsius, showing the effect of storage and temperature on the effectiveness of the malaria testing technology.
Another good example pertains to the implementation of the Gene Xpert MTB for detecting multi-drug resistant tuberculosis; while it was found to be cost-effective, issues of access and sustainability as a result of the huge cost and infrastructure requirements have hindered its full implementation in some settings.11 A follow-up study in Nigeria found out that the country needed to invest between US$2,622 and US$9,716 per lab for the installation of the Xpert machines.12
A study by Kriza et al13 on health technology assessment in Sub-Saharan Africa concluded that there was a lack of tools to systematically evaluate the benefits of HCTs in Sub-Saharan. A systematic review on the use of economic evaluation in research and decision making in Zimbabwe done by Gavaza et al,14 also showed little use of economic evaluation for decision making purposes in Zimbabwe. Therefore the main focus of our study was to show that benefit testing of HCTs elsewhere should be an important part of informing decision makers about adopting them in Zimbabwe.
Methods
The information used in this study was taken from publicly available, institutional data and not patient level data. However, we sought ethical approval from the Ministry of Health and Child Care, which then granted us permission to use these data for our study, and confirmed that informed consent was not required.
We set out to test the hypothesis that the NBRF could be a helpful decision analytical model that enables assessment of HCT transfer using intra-national variables. We also tested the hypothesis that HCT intervention technologies developed and assessed elsewhere generated the same marginal benefit in different jurisdictions. Different jurisdictions were proxied by the country’s 57 districts. In testing the hypothesis we used the net benefit regression framework (NBRF) that was developed by Tambour et al,15 Stinnett and Mullahy,16 Briggs et al,17 and later refined by Hoch and Dewa.18 The NBRF enabled us to combine the cost and effectiveness ratios from cost-effective randomized controlled studies with jurisdiction specific indicators such as per capita health expenditure, health indicators, demographic indicators and socioeconomic indicators into a multiple regression equation. The studies from which cost and effectiveness ratios were extracted were selected from a systematic review of randomized controlled trials which were further assessed for suitability of transfer using a Euronheed transferability checklist.19 Figure 1 provides a schematic summary of the methods process that was used.
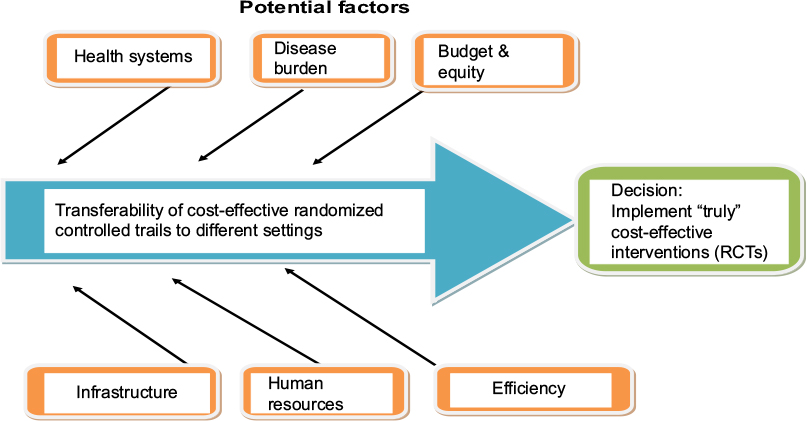 | Figure 1 Methods process. Abbreviation: RCTs, randomized controlled trials. |
We used studies19,20 that were selected based on an earlier “systematic” review of cost-effective HCTs. The systematic review focused on such issues as objectives of the study, setting, methodology and study design, the type of economic evaluation, significance of the results, and disaggregation and description of the data used for costs and effectiveness parameters and the generalizability of the final results. The review further used a Euronheed transferability checklist that was developed by Boulenger et al19 to finally select appropriate studies to be transferred. A study was regarded as transferable to a jurisdiction of interest if it scored above a threshold of 66.7%.19 Our 2 selected case studies had transferability scores of more than 80%, which were over and above the threshold score. The case studies focused on interventions in the areas of HIV and AIDS and malaria testing and monitoring technologies. These disease conditions are particularly important for Zimbabwe, since they currently account for most of the burden of disease in the country.20 While passing the transferability stage was a necessary condition for suitability of transfer, it was however, not a sufficient condition for the final adoption and use of the HCT in the jurisdictions of interest. We therefore combined the cost and effectiveness ratios from these studies together with the district per capita expenditures and local area factors. The local factors were derived from a study that was done earlier by Shamu et al.21 In the study, Shamu constructed 10 composite indices for each of the 57 districts using a method called principal component analysis. Principal component analysis is a data reduction technique that can be used to construct fewer and more concise indicators from multiple variables. Table 1 shows the 10 composite indices representing specific local area factors were then used as the independent variables in the final NBRF.
 | Table 1 Composite indices and sources of data Note: Reproduced from Shamu et al.21 Copyright © 2013–2015 A2 Publications. |
The 10 composite indices showed cross-variation across the 57 districts and hence were good candidates for use in characterizing the 57 districts. The cost and effectiveness ratios, the per capita health expenditure and the 10 composite indicators were then combined in an NBRF model.
Net marginal benefit framework
The net benefit approach starts from the basic assumption that the incremental cost-effectiveness ratio is of little benefit for the decision maker without taking into account the local context. It is only when a decision maker takes account of local factors and makes a judgement to either accept or reject an intervention that it becomes more
relevant.
In the general net benefit approach, the main aim is to link the decision maker’s willingness to pay coefficient  with the cost and effectiveness ratios. In mathematical terms, the decision maker is willing to pay
  units of money to obtain one unit of effectiveness. Using this approach by Tambour et al15 and Stinnett and Mullahy,16 one can represent the net benefit of an intervention for a district as:
|
|
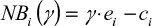
where  and
and  are data for the ith district’s effect and cost, respectively. This equation expresses the net benefit of an intervention in any district on a monetary scale by converting e units of effectiveness into
  units of money before subtracting the cost
  . Decision makers are generally reluctant to explicitly state the value of the willingness to pay coefficient (
 ) and would normally want to use a range of values based on the following approaches: willingness to pay per se (most common being US$30,000 per quality adjusted life year, the final decision being to fund an intervention with a cost per quality adjusted life year below this threshold); fixed budget (where one determines the shadow price of the budget); a threshold approach (select a threshold and fund any project whose cost falls below the selected threshold); and budget reallocation approach (where one compares the potential benefits of investment or disinvestment). In our study, we used the districts’ annual per capita health expenditure as a proxy for willingness to pay.
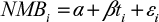
We then adopted Briggs et al’s17 and Hoch and Dewa’s18 expanded NBRF model as shown in Equation 2 to combine our data from selected cost-effective HCTs and composite indices constructed using local data sets.
|
|
This model was expanded to include a vector ![]() of district level composite indices
of district level composite indices ![]() that were deemed to depict important variations across districts as shown in Equation 3. We also allowed the model to have interactive terms, which enabled us to obtain marginal net benefits instead of average net benefits.17,18
that were deemed to depict important variations across districts as shown in Equation 3. We also allowed the model to have interactive terms, which enabled us to obtain marginal net benefits instead of average net benefits.17,18
|
|
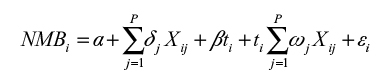
where the net marginal benefit (NMB) for each district is a product of the interaction between the intervention variable and the district level composite indices, which is given by the second summation in the above equation. Since in our model we did not use patient level data, we therefore did not have an intervention dummy. We replaced the intervention dummy with a disease index weighting variable, which was related to the technology of interest (for example, a malaria index for any technology related to malaria and an HIV index for an intervention related to HIV). The intervention variable was then entered in the model as an importance or analytic weighting variable, which reflected the importance of the intervention variable in the model. However, since the dependent variable (NMB) was a cost variable and had observations greater than zero, we used a generalized linear model (GLM) for the regression analysis.
Regression of cost data has always proved very difficult because of the skewness of cost data. GLM models are some of the models that have a potential of providing a better analysis of such data. Unlike ordinary least squares regression, the GLM models make interpretations about the mean directly. In the final analysis if a district had a net positive benefit (adjusted NMB >0), then the HCT was overall beneficial to that district, while if the district had a negative net benefit (adjusted NMB <0), then the HCT was not overall beneficial to the district.
Results
Using Equation 3, we combined the cost and effectiveness ratios from 2 case studies with the district per capita health expenditures for our dependent variable (NMB). We then used the 10 composite indicators as our independent covariates and ran our GLM regression model.
Study 1
The case study referred to a study that was carried out by Batwala et al22 that assessed the cost-effectiveness of malaria microscopy and rapid diagnostic tests (RDTs) versus the presumptive diagnosis. The study was carried out in Uganda. The results from the study showed that the RDT was more cost-effective than the microscopy. The incremental cost of the RDT was US$1.17 versus US$1.48 for the microscopy. The incremental effectiveness for the RDT was 0.234 versus 0.154 for the microscopy. The results from the study showed that the RDT was more cost-effective than the microscopy. Using Boulenger et al’s transferability checklist,19 the study was found to be initially testable for full transfer to Zimbabwe. We then ran the NBRF using the GLM family of models to assess how higher order local factors would affect the overall cost-effectiveness and implementation of this study within Zimbabwe’s 57 districts. Tables 2 and 3 show the results from the GLM model with net marginal benefit as the dependent variable and district composite indices as independent variables.
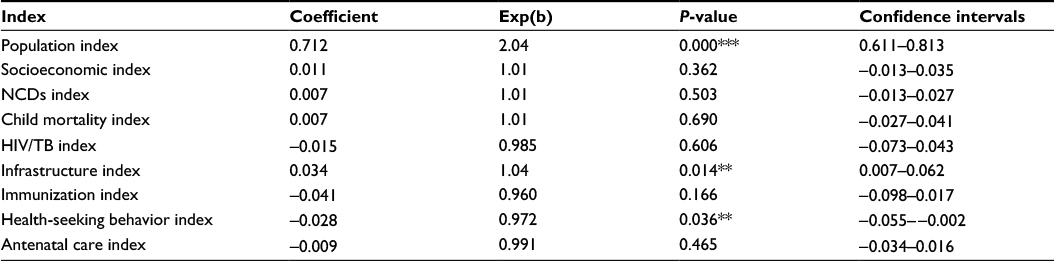 | Table 2 GLM model results for RDT technology Notes: Deviance = 90832; log likelihood = -291.03; scale parameter = 1932.6. *** Significant at 0.01 and ** significant at 0.05. Abbreviations: GLM, generalized linear model; RDT, rapid diagnostic test; NCDs, non-communicable diseases; Exp, exponential function. |
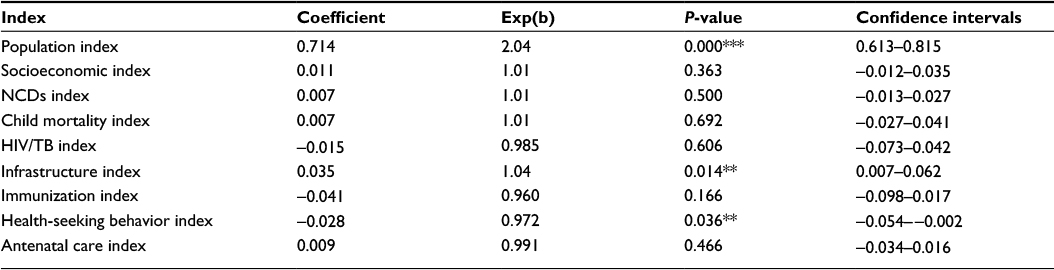 | Table 3 GLM model results for microscopy technology Notes: Deviance = 39057; log likelihood = –266.98; scale parameter = 831. *** Significant at 0.01 and ** significant at 0.05. Abbreviations: GLM, generalized linear model; NCDs. |
Of the 10 composite indices that were used as independent variables, the population index, the infrastructure index, and health-seeking behavior index were found to be significantly associated with net marginal benefit. For example, a 1 unit change in the infrastructure index would lead to a 4% increase in a district’s net marginal benefit of using the RDT or microscopy technology. An increase in the health-seeking behavior would lead to 0.97% decrease in the net marginal benefit of using the RDT or microscopy technology. This index was weighed down by people not seeking care at all. However, the magnitude of the net benefit from using either of the 2 technologies would differ across the 57 districts given their different characteristics and different per capita health expenditures as shown in Figure 2. Using the simple decision analysis framework of transferring the technology where the net marginal benefit is positive, all the districts whose NMB >0 would implement the health technology, while those with NMB <0 would not. A total of 32 districts had positive net benefits from implementing the microscopy and RDT technologies. The net benefits also differed in terms of magnitude as a result of the different demographic, disease burden and health systems.
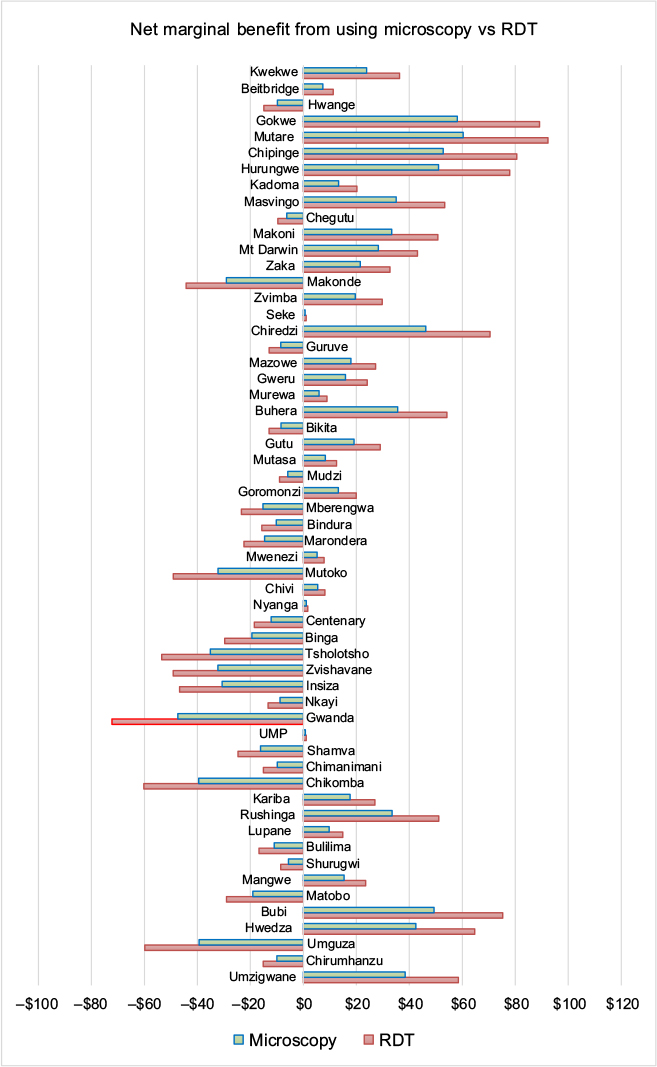 | Figure 2 Net benefit of microscopy versus rapid diagnostic tests (RDTs). Note: Currency is in US$. |
For example, the districts of Gokwe, Mutare, Chipinge and Hurungwe could implement both RDT and microscopy technologies, but would gain more by implementing the RDT technology. Examples of districts that would not have a net marginal benefit in implementing the technology are Gwanda, Binga and Zvishavane.
Study 2
The case study referred to a study that was carried out by Koenig et al,23 which assessed the cost-effectiveness of early treatment versus standard antiretroviral therapy in HIV-infected adults in Haiti. Early treatment was defined as treatment initiated when CD4 count was less than 350 and standard treatment as initiated when CD4 count was less than 200. The study was done from the perspective of the provider. The results from the study showed that early treatment was more cost-effective than standard treatment. Early treatment had an incremental cost of US$400 and incremental effectiveness of 37. Using Boulenger et al’s transferability checklist,19 the study was found to be initially transferable to Zimbabwe. We again applied the NBRF and the GLM family of models (Table 4) to assess how the district composite factors would affect the NMB and hence the overall transferability and adoption of the study within Zimbabwe’s 57 districts.
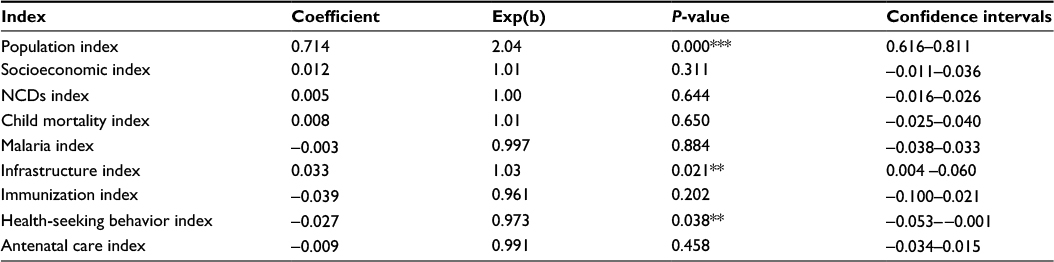 | Table 4 GLM model results for CD4 count technology Notes: Deviance = 2220063908; log likelihood = -579. *** Significant at 0.01 and ** significant at 0.05. Abbreviations: GLM, generalized linear model; NCDs. |
The magnitude of the net benefit of early HIV treatment differs across the 57 districts given their different characteristics and their per capita health expenditures as shown in Figure 3. All the districts whose NMB >0 would implement the health technology, while those with NMB <0 would not. A total of 30 districts had positive net benefits from implementing the early HIV treatment technology. For example, the districts of Gokwe, Mutare, Chipinge and Hurungwe would benefit from early HIV treatment, while the districts of Makonde, Mutoko and Zvishavane would not.
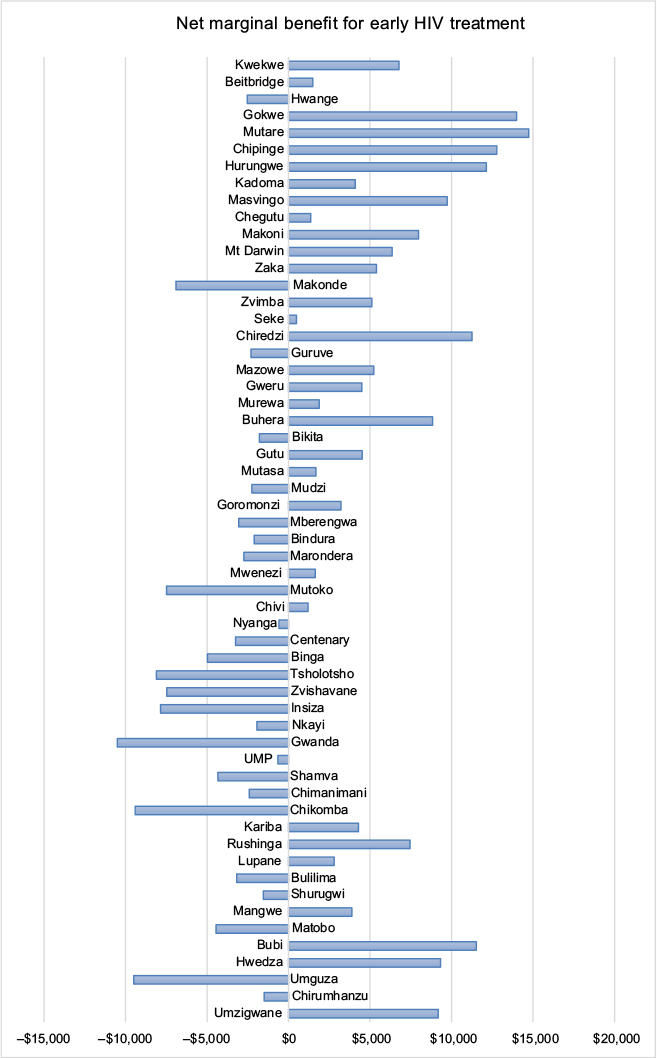 | Figure 3 Net benefit of early HIV treatment. Note: Currency is in US$. |
If one were to look at this analysis in terms of savings and investment; districts with NMB >0 would make a saving which could be invested in other disease priority areas, while districts with NMB <0, but with some burden of either malaria or HIV/AIDS would require some investment for them to realize the benefits of implementing the respective technology. The decision makers would then have to set a per capita investment threshold above which they would not consider any investment even if the district has some burden of the disease. The premise being that the current technology being used could not be displaced since the new technologies would not increase the district’s marginal benefit.
Discussion
Literature has shown that there are differences in terms of net benefits for different jurisdictions when the same health technology is used. These differences could be as a result of cost of inputs, unit costs, demographic factors and other socioeconomic factors as a result of geographical locations. Results shown in Tables 2–4 also buttress this observation and indicate that 3 composite indices, population, infrastructure and health-seeking behavior have a significant effect on the net marginal benefit of adopting either HIV, RDT or microscopy health technology interventions. This finding is very important because in resource limited settings like Zimbabwe, quality, outcomes and resources are key to health care policy making. This study has shown that population numbers, infrastructure and the population’s health-seeking behavior play a very critical role in the transferability of health technologies. Without the numbers and better infrastructure that complements any transfer of health technologies, implementation or adoption of HCTs becomes a waste of resources. However, while the use of the willingness to pay in the dependent variable has been the standard, in recent years the WHO has been promoting the use of per capita Gross Domestic Product (GDP).24 In our study, we could not find GDP data disaggregated to the district level, hence our use of the per capita health expenditure as a proxy for the per capita GDP for the 57 districts.
In other studies, resource input costs and unit costs have been cited as some of the more apparent factors that affect the transferability of HCTs. Grieve et al found out that the cost for stroke management varied between countries because of differences in input costs and unit costs.25 Mugford et al26 tested the same hypothesis of homogeneity of economic costs on Bangladesh, Gambia, Indonesia, South Africa and Zimbabwe by collecting additional data outside of the trial to extend the economic results from a trial done in Argentina, Cuba, Saudi Arabia and Thailand and showed the effects of country specific factors such as government laws and policies and health-seeking behavior. Stalhammar et al27 observed that using country specific data resulted in substantial changes in the cost-effectiveness of omeprazole and ranitidine when used as initial therapy in the treatment and management of gastro-esophageal reflex disease.
Leese et al28 found out that the costs and benefits in treatment of patients with anemia arising from chronic renal failure using recombinant human erythropoietin were affected by the country’s health financing system, which led to different costs and treatment schedules. Other studies have considered other factors apart from the obvious clinical and patient level factors that have caused variations in cost and cost-effectiveness.29
We found substantial changes also in the net benefit that accrues in different districts in Zimbabwe when local factors are taken into account. It is important to note that information on net benefits can be equally useful in indicating the magnitude of differences in net benefit across the various districts in Zimbabwe. This information can also be used for future investment purposes for districts with negative net marginal benefits but with genuine need for the HCT. The results could also be used for reprioritization of resources to other disease areas or districts. The idea is also not necessarily to challenge the cost-effectiveness of the technologies per se, but to offer decision analytical models that can assist the decision makers in selecting areas where HCTs can have a better value for money. The NBRF opens the possibility of inclusion and fusion of all data that could be useful in decision making when it comes to implementing HCTs. The NBRF can also lead to mutually exclusive decision making for districts with huge cross variations, but for those with the same characteristics the final decision may be the same. NBRF is a model than can be used at both national and subnational levels.30 However, as Hounton and Newlands30 pointed out, the method requires appropriate data sets and timeliness for better decision making. For LICs, the NBRF may be a more feasible and less costly method for decision making.
Conclusion
Using a simple model, we showed how intra-national variation can lead to different conclusions about the net benefit of the same HCT when used in different jurisdictions. This study considered some of the most important so-called higher order local factors that could potentially affect the transferability and use of HCTs in different locations. We found noticeable differences in the net benefit to the districts as a result of their different demographic, disease burden and health systems characteristics.
While the simple decision for the policy maker may be to accept or reject the transfer and adoption of HCTs with positive or negative marginal benefit respectively, they could also use the same information to decide on the level of future savings that a technology can realize or the level of investment needed for the particular technology to become beneficial. The fact that the composite indices which characterized the 57 districts were built using locally available databases and data sets makes it more appealing to consider such data as additional information for decision making local HCT assessments.
Acknowledgments
We would like to thank the Ministry of Health and Child Care for allowing us to access their database. We also like to thank the University of Zimbabwe, College of Health Sciences Research Support Centre for supporting this work through a grant fellowship.
Funding
This research was supported with funding from the Wellcome Trust (UK).
Disclosure
The authors report no conflicts of interest in this work.
References
Arasaratnam A, Humphreys G. Emerging economies drive frugal innovation. Bull World Health Organ. 2013;91(1):6–7. | ||
Osika J, Altman D, Ekbladh L, Katz I, Nguyen H, Rosenfeld J, Williamson T, Tapera S. Zimbabwe health system assessment. Bethesda, MD: Health Systems 20/20 Project, Abt Associates Inc; 2010. | ||
Drummond M, Manca A, Sculpher M. Increasing the generalizability of economic valuations: recommendations for the design, analysis, and reporting of studies. Int J Technol Assess Health Care. 2005;21(2):165–171. | ||
Cambon L, Minary L, Ridde V, Alla F. Transferability of interventions in health education: a review. BMC Public Health. 2012;12:497. | ||
Manca A, Willan AR. ‘Lost in translation’: accounting for between country differences in the analysis of multinational cost effectiveness data. Pharmacoeconomics. 2006;24(11):1101–1119. | ||
Guidelines for the Economic Evaluation of Health technologies in Ireland [webpage on the Internet]. Health Information and Quality Authority; 2010. Available from: https://www.hiqa.ie/publication/guidelines-economic-evaluation-health-technologies-ireland. Accessed September 1, 2016. | ||
Goeree R, Burke N, O’Reilly D, Manca A, Blackhouse G, Tarride JE. Transferability of economic evaluations: approaches and factors to consider when using results from one geographic area for another. Curr Med Res Opin. 2007;23(4):671–682. | ||
herald.co.zw [homepage on the Internet]. Ministry defends procurement of Para-Check malaria tests kits. The Herald; 2012 [cited November 4, 2012]. Available from: http://www.herald.co.zw/ministry-defends-procurement-of-para-check-malaria-test-kits/. Accessed September 1, 2016. | ||
Mboera LE, Fanello CI, Malima RC, Talbert A, Fogliati P, Bobbio F, Molteni F. Comparison of the Paracheck-Pf test with microscopy for the confirmation of Plasmodium falciparum malaria in Tanzania. Ann Trop Med Parasitol. 2006;100(2):115–122. | ||
Kamugisha ML, Msangeni H, Beale E, Malecela EK, Akida J, Ishengoma DR, Lemnge MM. Paracheck Pf compared with microscopy for diagnosis of Plasmodium falciparum malaria among children in Tanga City north-eastern Tanzania. Tanzan J Health Res. 2008;10(1):14–19. | ||
McNerney R, Cunningham J, Hepple P, Zumla A. New tuberculosis diagnostics and rollout. Int J Infect Dis. 2015;32:81–86. | ||
Abdurrahman ST, Emenyonu N, Obasanye OJ, et al. The hidden costs of installing Xpert machines in a tuberculosis high-burden country: experiences from Nigeria. Pan Afr Med J. 2014;18:277. | ||
Kriza C, Hanass-Hancocck J, Odame EA, et al. A systematic review of health technology assessment tools in sub-Saharan Africa: methodological issues and implications. Health Res Policy Syst. 2014;12:66. | ||
Gavaza P, Rascati K, Brown C, Lawson K, Mann T. The state of health economic and pharmacoeconomic evaluation research in Zimbabwe: a review. Curr Ther Res Clin Exp. 2008;69(3):268–285. | ||
Tambour M, Zethraeus N, Johannesson M. A note on confidence intervals in cost-effectiveness analysis. Int J Technol Assess Health Care. 1998;14(3):467–471. | ||
Stinnett AA, Mullahy J. Net health benefits: a new framework for the analysis of uncertainty in cost-effectiveness analysis. Med Decis Making.1998;18(2 Suppl):S68–S80. | ||
Briggs AH, Goeree R, Blackhouse G, O’Brien BJ. Probabilistic analysis of cost effectiveness models: choosing between treatment strategies for gastroesophageal reflux disease. Med Decis Making. 2002;22(4):290–308. | ||
Hoch JS, Dewa CS. Advantages of the net benefit regression framework for economic evaluation of interventions in the workplace. a case study of the cost-effectiveness of a collaborative mental health care program for people receiving short-term disability benefits for psychiatric disorders. J Occup Environ Med. 2014;56(4):441–445. | ||
Boulenger S, Nixon J, Drummond M, Ulmann P, Rice S, de Pouvourville G. Can economic evaluations be made more transferable? Eur J Health Econ. 2005;6(4):334–346. | ||
Hansen KS, Chapman G. Setting priorities for the health care sector in Zimbabwe using cost effectiveness analysis and estimates of disease burden. Cost Eff Resour Alloc. 2008;6:14. | ||
Shamu S, Rusakaniko S, Hongoro C. A characterisation and profiling of District health indicators in Zimbabwe. An application of Principal Component Analysis in a data limited setting. Journal of Health Economics and Outcomes Research. 2015;3(2): 162–179. | ||
Batwala V, Magnussen P, Hansen K, Nuwaha F. Cost-effectiveness of malaria microscopy and rapid diagnostic tests versus presumptive diagnosis: implications for malaria control in Uganda. Mal J. 2011;10:372. | ||
Koenig SP, Bang H, Severe P, et al. Cost-effectiveness of early versus standard antiretroviral therapy in HIV-infected adults in Haiti. PLoS Med. 2011;8(9):e1001095. | ||
Grieve R, Nixon R, Thompson SG, Cairns J. Multilevel models for estimating incremental net benefits in multinational studies. Health Econ. 2007;16(8):815–826. | ||
Marseille E, Larson B, Kazi DS, Kahn JG, Rosen S. Thresholds for the cost effectiveness of interventions: alternative approaches. Bull World Health Organ. 2015;93(2):118–124. | ||
Mugford M, Hutton G, Fox-Rushby J. Methods for economic evaluation alongside a multicentre trial in developing countries: a case study from the WHO Antenatal Care Randomised Controlled Trial. Paediatr Perinat Epidemiol. 1998;12 Suppl 2:75–97. | ||
Stalhammar NO, Carlson J, Peacock R, et al. Cost effectiveness of omeprazole and ranitidine in intermittent treatment of symptomatic gastro-oesophageal reflux disease. Pharmacoeconomics. 1999;16(5 Pt 1):483–497. | ||
Leese B, Hutton J, Maynard A. A Comparison of the costs and benefits of recombinant human erythropoietin (epoetin) in the treatment of chronic renal failure in 5 European countries. Pharmacoeconomics. 1992;1(5):346–356. | ||
Sculpher MJ, Pang FS, Manca A, et al. Generalisability in economic evaluation studies in healthcare: a review and case studies. Health Technol Assess. 2004;8(49):iii–iv,1–192. | ||
Hounton S, Newlands D. Applying the net-benefit framework for analysing and presenting cost effectiveness analysis of a maternal and newborn health intervention. Plos One. 2012;7(7):e40995. |
 © 2016 The Author(s). This work is published and licensed by Dove Medical Press Limited. The full terms of this license are available at https://www.dovepress.com/terms.php and incorporate the Creative Commons Attribution - Non Commercial (unported, v3.0) License.
By accessing the work you hereby accept the Terms. Non-commercial uses of the work are permitted without any further permission from Dove Medical Press Limited, provided the work is properly attributed. For permission for commercial use of this work, please see paragraphs 4.2 and 5 of our Terms.
© 2016 The Author(s). This work is published and licensed by Dove Medical Press Limited. The full terms of this license are available at https://www.dovepress.com/terms.php and incorporate the Creative Commons Attribution - Non Commercial (unported, v3.0) License.
By accessing the work you hereby accept the Terms. Non-commercial uses of the work are permitted without any further permission from Dove Medical Press Limited, provided the work is properly attributed. For permission for commercial use of this work, please see paragraphs 4.2 and 5 of our Terms.