")
Back to Journals » Neuropsychiatric Disease and Treatment » Volume 13
Primary angle-closure glaucomas disturb regional spontaneous brain activity in the visual pathway: an fMRI study
Authors Chen W, Zhang L, Xu YG, Zhu K, Luo M
Received 8 February 2017
Accepted for publication 18 April 2017
Published 25 May 2017 Volume 2017:13 Pages 1409—1417
DOI https://doi.org/10.2147/NDT.S134258
Checked for plagiarism Yes
Review by Single anonymous peer review
Peer reviewer comments 2
Editor who approved publication: Professor Wai Kwong Tang
Wei Chen, Li Zhang, Yong-gen Xu, Kai Zhu, Man Luo
Department of Ophthalmology, Shaoxing People’s Hospital, Shaoxing, Zhejiang, People’s Republic of China
Objective: To explore the underlying regional brain activity deficits in the visual cortex in patients with primary angle-closure glaucoma (PACG) relative to normal controls (NCs) using regional homogeneity (ReHo) method, and its relationship with behavioral performances.
Patients: Twenty PACG patients (10 females, 10 males; mean age ± standard deviation [SD]: 54.42±9.46 years) and 20 age-, and sex status-matched NCs (10 females, 10 males; mean age ± SD: 53.75±9.16 years) were included in this study.
Measurements and results: Compared with NCs, patients with PACG showed significant atrophic peripapillary retinal nerve fiber layer (pRNFL) and neuroretinal rim area, increased optic disk cup-to-disc ratio (CDR) and optic disk volume (P<0.05), higher ReHo value in the left fusiform gyrus, left cerebellum anterior lobe, right frontal-temporal space, and right insula, and lower ReHo value in the bilateral middle occipital gyrus, left claustrum, and right paracentral lobule lobe. The receiver operating characteristic analysis revealed these different areas with high value of area under curve, and high degree of sensitivity and specificity. The mean beta values of these different areas were extracted. In PACG, the duration of disease showed a negative correlation with the mean beta value of left cerebellum anterior lobe (r=-0.453, P=0.045) and a positive correlation with right middle occipital gyrus (r=0.586, P=0.007); left middle occipital gyrus showed positive correlations with duration of disease (r=0.562, P=0.01) and left pRNFL (r=0.49, P=0.028); left claustrum had a positive correlation with left CDR (r=0.515, P=0.02); and right paracentral lobule lobe demonstrated a positive correlation with left pRNFL (r=0.623, P=0.003).
Conclusion: PACG is involved in abnormal spontaneous brain activity in multiple brain areas, and such changes are associated with clinical performances, which may reflect the underlying pathologic mechanism and play important roles in the initiation and progression of PACG.
Keywords: primary angle-closure glaucoma, regional homogeneity, retinal nerve fiber layer, functional magnetic resonance imaging
Introduction
Glaucoma is the leading cause of irreversible blindness worldwide.1 To date, no comprehensive theory to explain its clinical features has been found. Primary angle-closure glaucoma (PACG), a neurodegenerative optic disease, is characterized by progressive visual field defect, optic nerve rim loss, and retinal ganglion cells loss, and affects Asians more frequently than other races.
Previous studies found that primary open-angle glaucoma (POAG) showed altered diffusion tensor imaging parameters of fractional anisotropy, mean diffusivity, and radial diffusivity in the chiasm, optic nerve, and optic radiations.2–5 Voxel-based morphometry (VBM) studies have shown that neural degeneration extends to and beyond the visual pathway.6–9 However, these studies only focus on morphological changes in POAG, and there is lack of direct evidence regarding PACG.
Resting-state functional magnetic resonance imaging (rsfMRI), a popular topic that is currently receiving a lot of interest in neuroimaging and one that is suitable for central neuronal mechanism studies, permits visualization of intrinsic functional spontaneous neuronal activity of the human brain in vivo and can provide new insights into the pathophysiology of disease, because of its advantage in not requiring exposure to radioactive tracers.10 Song et al found that POAG relative to normal controls (NCs) had significant higher regional homogeneity (ReHo) values in the right dorsal anterior cingulate cortex, bilateral medial frontal gyrus, and right cerebellar anterior lobe, and lower ReHo values in the bilateral calcarine, bilateral precuneus, bilateral precentral/postcentral gyrus, left inferior parietal lobule, and left cerebellar posterior lobe.11 Li et al observed that POAG relative to NCs demonstrated significant decreased amplitude of low-frequency fluctuation (ALFF)/fractional ALFF (fALFF) values in the visual cortices, posterior regions of the default-mode network, and motor and sensory cortices, and showed significant increased ALFF/fALFF values in the prefrontal cortex, left superior temporal gyrus, right middle cingulate cortex, and left inferior parietal lobule.12 Furthermore, only one study explored the regional spontaneous brain changes in PACG relative to NCs, showing significant lower ALFF values in the left precentral gyrus, bilateral middle frontal gyrus, bilateral superior frontal gyrus, right precuneus, and right angular gyrus, and higher ALFF value in the right precentral gyrus.13 Although these rsfMRI studies provided evidence for the fact that glaucoma is associated with abundant disturbed regional brain activity, a fundamental understanding of the underlying neural mechanism of optic neuropathy and regional spontaneous brain changes caused by glaucoma remains to be further explored, especially for PACG.
Glaucoma has been considered as damage associated with post-retinal mechanisms, including the visual cortex.14–16 Some evidence has demonstrated the relationships between the degree of visual field loss and the altered blood flow of the visual cortex, or blood perfusion of the primary visual cortex in POAG.17 However, it has not been studied in PACG.
The ReHo method, considered as a potential and useful measurement for investigating intrinsic brain activities for diseases because of its simple calculation and reliable characterization, has been used to assess the functional consistency and similarity for each individual by calculating Kendall’s coefficient concordance (KCC) of the time series of a given voxel with its nearest neighbors.18,19 Recently, it has been successfully applied to sleep problems,18,20 mood/emotional changes,21 and POAG.11 However, PACG has not been studied. The present study is the first to apply the ReHo method to characterize and investigate whether PACG also demonstrated disturbed regional spontaneous brain activity in the visual cortex, and its relationship with behavioral parameters.
Materials and methods
Subjects
Twenty PACG (10 females, 10 males; age: 54.42±9.46 years) and 20 NCs (10 females, 10 males; age: 53.75±9.16 years) were recruited in this study. All PACG met the following criteria: 1) slit lamp and gonioscopy examinations found shallow anterior chamber and narrow corner signs; 2) intraocular pressure values measured at least twice were all >21 mmHg (1 mmHg =0.133 kPa); 3) funduscopic examination showed a higher cup-to-disc ratio (CDR) in the optic disk than 0.6, together with visual field injury, including tubular vision, bow scotoma, central scotoma, annular scotoma, temporal side guide, or nasal side of ladder; 4) no other intraocular diseases such as optic neuropathy; 5) no history of inborn or other acquired diseases, and foreign implants in the body; 6) no history of ocular operation; 7) no history of psychiatric disorder, hypertension, diabetes mellitus, coronary artery disease, drug addiction, and sleep disorder. Twenty NCs met the following criteria: 1) no history of intraocular diseases and brain parenchymal lesions; 2) two naked eye, or corrected visual acuity ≥4.9 on the vision chart; 3) met criteria 4–7 in PACG. The mean duration of PACG was 72.37±34.76 days.
This study was approved by the Human Research Ethics Committee of Shaoxing Hospital of Zhejiang University. During the MRI scan, all subjects were asked to wear a black blinder and sponge earplugs and close their eyes. All subjects participated voluntarily. Each of them signed an informed consent form, and was informed of the purposes, potential risks, and methods of this study.
Data acquisition
MRI scans were conducted on a 3.0-Tesla magnetic resonance scanner (Prisma, Trio, Spectra; Siemens, Munich, Germany). The MRI data contain 240 rsfMRI brain volumes with Gradient-Recalled Echo-Planar Imaging pulse sequence and 144 high-resolution three-dimensional T1-weighted images with spoiled gradient-recalled sequence. The parameters of rsfMRI images were repetition time (TR) =2,000 ms, echo time (TE) =30 ms, thickness =3.0 mm, gap =0.9 mm, acquisition matrix =64×64, flip angle =90°, field of view (FOV) =220×220 mm, 32 axial slices with eyes closed. The parameters of T1 images were TR =1,730 ms, TE =2.26 ms, thickness =1.0 mm, gap =0 mm, acquisition matrix =256×256, FOV =250×250 mm, flip angle =9°.
Clinical measurements of PACG and NCs were recorded in both eyes, including peripapillary retinal nerve fiber layer (pRNFL), neuroretinal rim area (NRA), optic disk CDR, and optic disk volume (ODV). In this study, 32 PACG patients with incomplete data were excluded.
Data analysis
Data preprocessing was conducted using DPABI software (http://rfmri.org/dpabi) which is based on MATLAB2010a (MathWorks, Natick, MA, USA). Preprocessing included five steps as follows: 1) Digital Imaging and Communications in Medicine data form transformation. 2) Removing the first 10 time points of the functional images because of lack of adaptation to the scan environment and possible instability of the initial MRI signal. 3) Slice timing. 4) Head motion correction: motion time courses were obtained by estimating the values for translation (mm) and rotation (degrees) for each subject. A linear regression process was used to remove the effects of head motion and other possible sources of artifacts, including Friston six motion parameters, whole brain signal averaged over the entire brain, white matter signal, and cerebrospinal fluid signal. Five subjects who had >1.5 mm maximum translation and (or) 1.5° maximum rotation motion in the x, y, or z axis have been excluded. 5) Next, the remaining data were spatially normalized to the Montreal Neurological Institute space by using echo planar imaging template and were resampled to 3×3×3 mm3 isotropic voxels.
After the preprocessing, the time course of each voxel was linearly detrended and temporally band-pass filtered (0.01–0.08 Hz) to reduce cardiac noise, and low-frequency drift and physiological high-frequency respiration. Individual ReHo maps were generated for each dataset by calculating the KCC of the time series of a given voxel with those of its nearest neighbors (26 voxels) in a voxel-wise analysis. To reduce the influence of individual variations in the KCC value, normalization of ReHo maps was carried out by dividing the KCC among each voxel by the averaged KCC of the whole brain. Finally, the remaining data were smoothed with a Gaussian kernel of 6×6×6 mm3 full-width at half-maximum.
Basic concept of ReHo method
ReHo analysis was performed to assess the consistency and similarity for each individual by calculating the KCC of the time series of one given voxel with those of its adjacent voxels in a voxel-wise analysis based on the assumption that a voxel was temporally similar to those of its neighbors. The computational formula22 of ReHo value for each cluster was
|
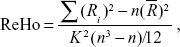
where ReHo is the KCC among the given voxels, ranging from 0 to 1; When a given cluster and its adjacent cluster in a time series are more consistent, the KCC value is closer to 1. K is the voxel number of the time series within a measured cluster (the smallest unit of measured ReHo, comprising more adjacent clusters); here, K=27 (one given voxel which was located in the cubic center plus its adjacent 26 voxels); n is the number of ranks; Ri is the sum rank of the ith time point, where  is the mean of the Ri’s. Standard ReHo value is the ReHo value of each cluster/the mean of the whole brain ReHo value. Thus, the individual ReHo map was generated for each dataset.
Pearson correlation and receiver operating characteristic (ROC) curve
The ReHo differences in brain regions were saved as regions of interest, and the mean signal values (beta value) of these brain regions were extracted by averaging ReHo values over all voxels using REST software (http://www.resting-fmri.Sourceforge.net). Next, the mean beta values of these brain regions and behavioral performances were entered into IBM Statistical Package for Social Sciences version 21.0 software (IBM Corporation, Armonk, NY, USA). ROC curve was used to explore the abilities of these brain regions to distinguish the PACG patients from the NCs. Furthermore, Pearson’s linear correlation analysis was used to explore the relationship between these specific brain regions and behavioral performances.
Statistical analysis
Two-sample t-test was used to study statistical differences between PACG and NCs with age and years of education as nuisance covariates of no interest. A corrected significance level of individual voxel two-tailed P<0.01 and cluster volume ≥1,080 mm3 using an AlphaSim corrected threshold of P<0.05 were used to determine the statistical significance between PACG and NCs. The final MRI results were presented by Xjview toolbox (http://www.alivelearn.net/xjview/) and REST. Behavioral analyses were performed using IBM SPSS 21.0 with a significant statistical threshold of P<0.05.
Results
Behavioral results
There were no significant differences in sex and age between PACG and NCs (P>0.05). Compared with NCs, PACG showed significant atrophic pRNFL and NRA in both sides and the average value of the sum of the two sides (P<0.05). Furthermore, PACG had significant increased CDR and ODV in both sides and the average value of the sum of the two sides relative to NCs (P<0.05). The details are presented in Table 1.
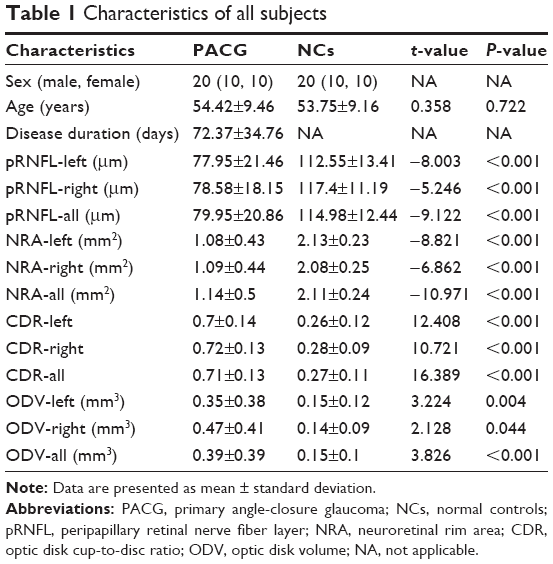 | Table 1 Characteristics of all subjects |
ReHo differences
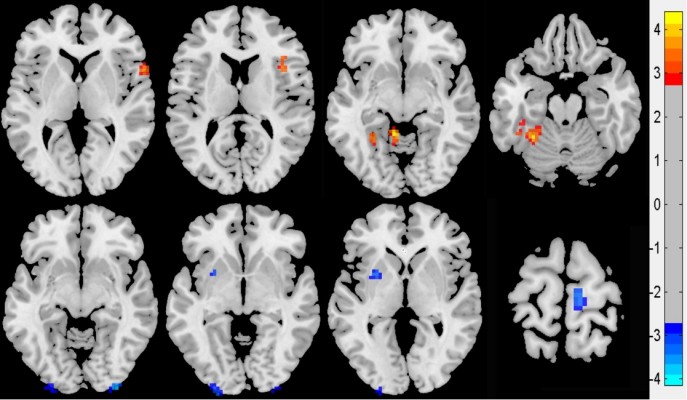
Compared with NCs, PACG showed higher ReHo value in the left fusiform gyrus (BA37), left cerebellum anterior lobe, right frontal-temporal space (BA48), and right insula (BA48), and lower ReHo value in the bilateral middle occipital gyrus (BA18), left claustrum, and right paracentral lobule lobe (BA4). The details are presented in Table 2 and Figure 1.
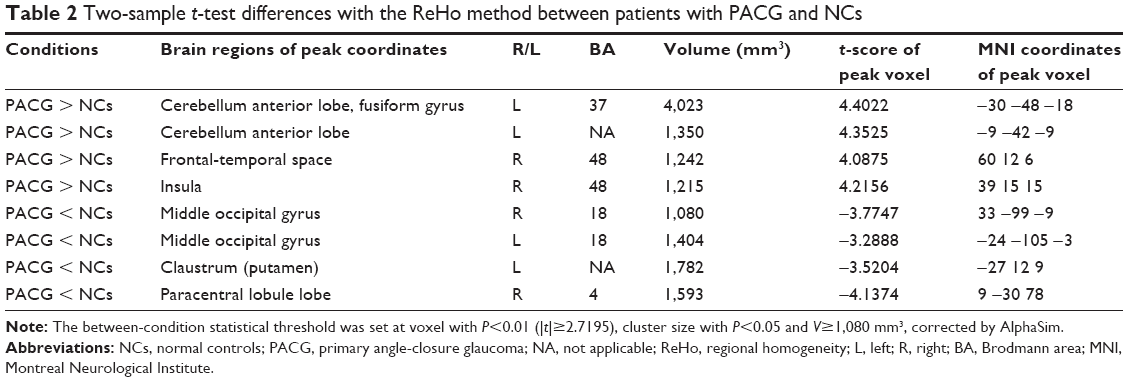 | Table 2 Two-sample t-test differences with the ReHo method between patients with PACG and NCs |
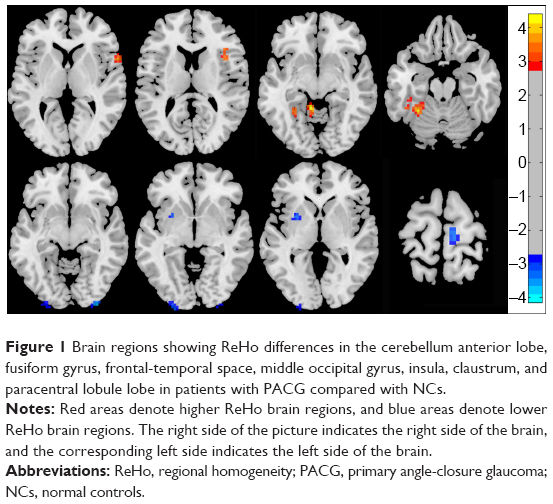 | Figure 1 Brain regions showing ReHo differences in the cerebellum anterior lobe, fusiform gyrus, frontal-temporal space, middle occipital gyrus, insula, claustrum, and paracentral lobule lobe in patients with PACG compared with NCs. |
Behavioral correlations
The mean beta values of these different brain regions were extracted (Figure 2). In PACG, the mean beta value of the left cerebellum anterior lobe had a negative correlation with duration of disease (r=−0.453, P=0.045); the mean beta value of the right middle occipital gyrus showed a positive correlation with duration of disease (r=0.586, P=0.007); the mean beta value of the left middle occipital gyrus demonstrated positive correlations with duration of disease (r=0.562, P=0.01) and left pRNFL (r=0.49, P=0.028); the mean beta value of the left claustrum indicated a positive correlation with left CDR (r=0.515, P=0.02); and the mean beta value of the right paracentral lobule lobe showed a positive correlation with left pRNFL (r=0.623, P=0.003). The details are presented in Figure 3.
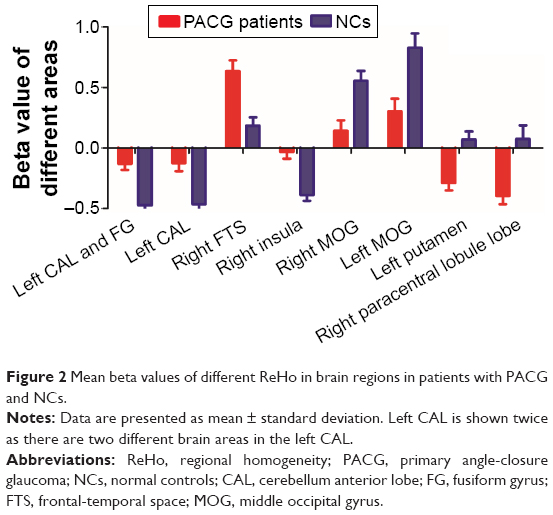 | Figure 2 Mean beta values of different ReHo in brain regions in patients with PACG and NCs. |
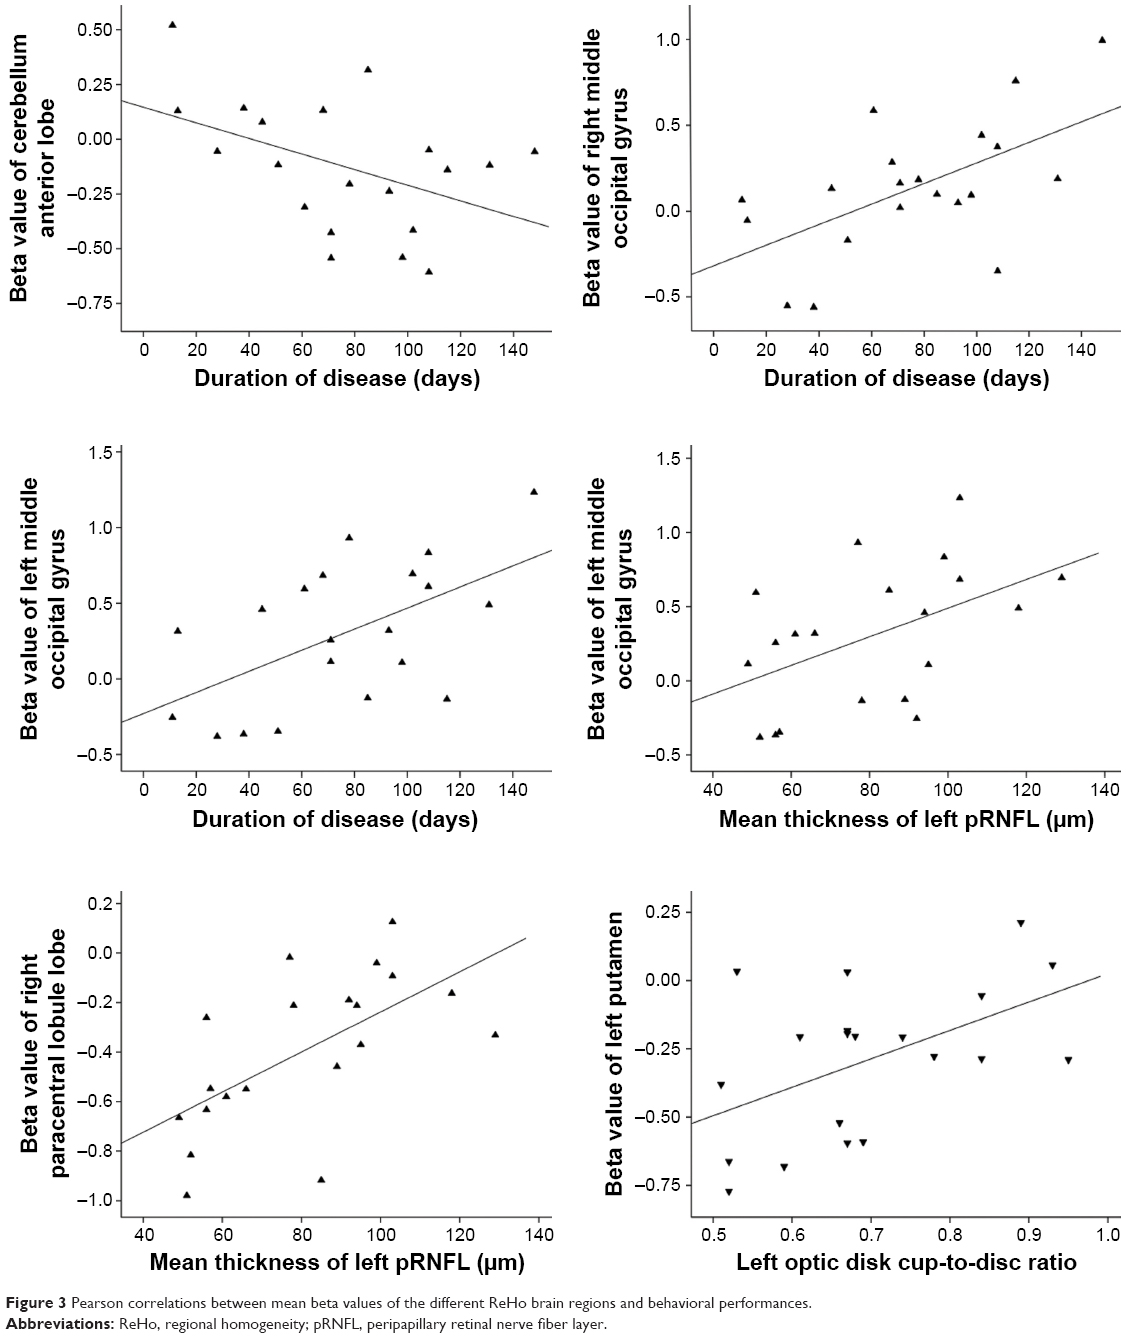 | Figure 3 Pearson correlations between mean beta values of the different ReHo brain regions and behavioral performances. |
ROC curve
ROC analysis revealed that all different ReHo areas showed high values of area under curve (AUC). Furthermore, further diagnosis analysis demonstrated that these important brain areas consistently had high degree of sensitivity and specificity. The details are presented in Table 3 and Figure 4.
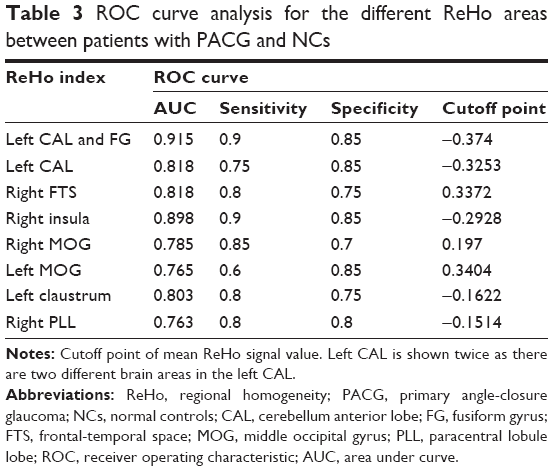 | Table 3 ROC curve analysis for the different ReHo areas between patients with PACG and NCs |
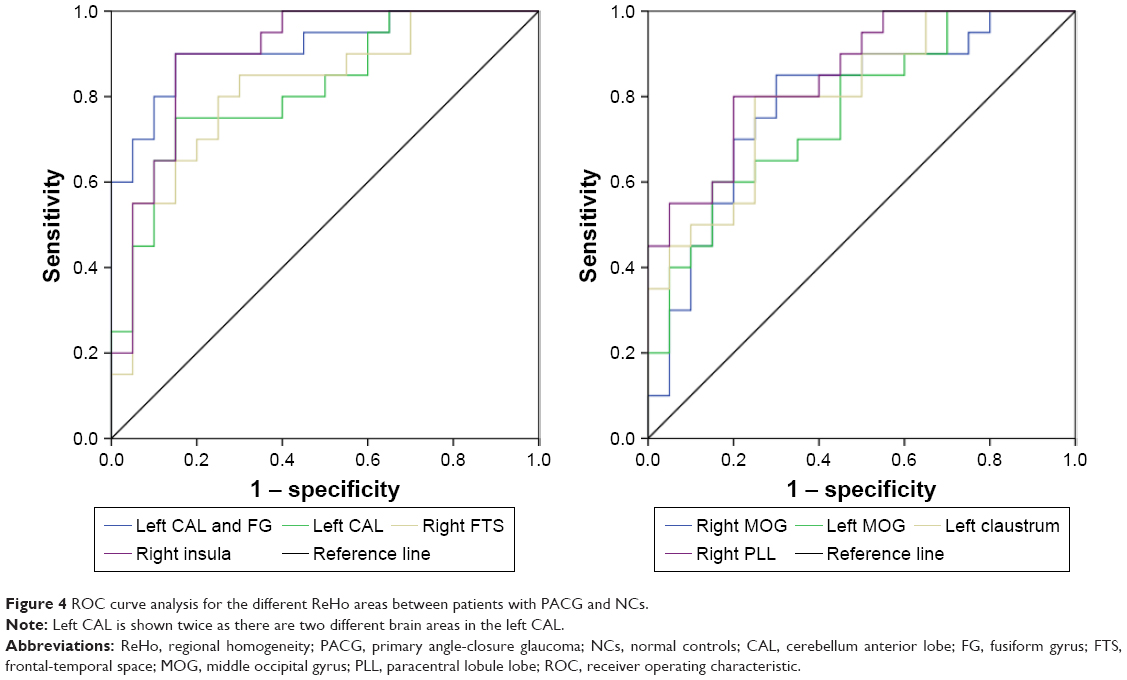 | Figure 4 ROC curve analysis for the different ReHo areas between patients with PACG and NCs. |
Discussion
PACG is well understood in damage at the level of the optic nerve and retina, but poorly understood at the whole brain level. Various mechanisms, such as dendrite disruption, endoplasmic reticulum stress, and astrogliosis activation, are associated with the plasticity of the neural system, resulting in functional deficits and reorganization of the whole brain network. To our knowledge, this is the first study that used ReHo measurement to assess the altered spontaneous neural activity in PACG relative to NCs. In our study, compared with NCs, PACG showed significant atrophic pRNFL and NRA in both sides and the average pRNFL value of the sum of the two sides (P<0.05), and significant increased CDR and ODV in both sides, and the average value of the sum of the two sides (P<0.05). The brain is a whole entity but not a single individual brain area. Once one region has problems, it will lead to dysfunctions in other brain regions. Therefore, this study found that PACG relative to NCs showed different ReHo values in several brain areas, including fusiform gyrus, cerebellum, frontal-temporal space, insula, occipital lobe, claustrum, and paracentral lobule lobe. The discrimination results are considered to be excellent for AUC values between 0.9 and 1, good for AUC values between 0.8 and 0.9, fair for AUC values between 0.7 and 0.8, poor for AUC values between 0.6 and 0.7, and failed for AUC values between 0.5 and 0.6.23 The ROC curve has been successfully applied to several neuroimaging studies.24–26 The present study found that the mean beta values of these important brain regions consistently showed high AUC values and high degree of sensitivity and specificity. These findings suggest that the ReHo analysis is an early biomarker for detecting altered brain activity, and these important brain regions may serve as potential markers to distinguish PACG from the NCs. Furthermore, the mean beta values of these important brain regions demonstrated significant correlations with the duration of disease, pRNFL, and CDR, which suggest that these brain regions could be useful for indexing clinical performances.
In a recent research using rsfMRI, Dai et al found that POAG showed decreased functional connectivity between the visual cortex and the right inferior temporal, left fusiform, left middle occipital, right superior occipital, left postcentral, right precentral gyri, and anterior lobe of the left cerebellum.27 Duncan et al demonstrated that POAG had decreased cerebral blood flow in the visual cortex,17 suggesting that regional metabolism and blood flow contribute to the phenomenon. Li et al also found significantly decreased ALFF/fALFF values in the visual cortices in POAG.12 A recent study of proton magnetic resonance spectroscopy revealed choline reduction in the visual cortex in an experimental model of chronic glaucoma.28 Boucard et al found that glaucoma patients showed a decreased cortical gray matter density in the anterior half of medial visual cortex.7 Chen et al demonstrated that POAG showed significant reduction of gray matter volumes in bilateral visual cortex using an optimized VBM analysis method.9 Qing et al found that glaucomatous neuropathy from POAG may lead to decreased cortical activity in the visual cortex even in the visual field defined as the normal central area.29 These patients may have greater difficulties in dealing with their daily visual tasks than that predicted by their visual field loss.30 In support of these findings of morphological atrophy and functional deterioration in the visual cortex in glaucoma patients, in the present study it was found that PACG displayed decreased ReHo values in the bilateral secondary visual cortex (BA 18); furthermore, the mean beta value of the right middle occipital gyrus showed a positive correlation with duration of disease, and the mean beta value of the left middle occipital gyrus showed positive correlations with duration of disease and ipsilateral pRNFL, indicating that the visual cortex gradually exacerbates as degree of atrophy in the pRNFL and PACG progresses.
Zikou et al observed that POAG demonstrated a significant unilateral decreased fractional anisotropy value in the left hemisphere in caudate nucleus, the fibers of which reach the inferior parietal lobule and the dorsal parietal and occipital areas.6 All these areas have been shown to play a role in visuospatial function.31 The present study found that PACG displayed decreased ReHo values in the left claustrum and right paracentral lobule lobe (BA4). Furthermore, the mean beta value of the left claustrum showed a positive correlation with left CDR (r=0.515, P=0.02). The mean beta value of the right paracentral lobule lobe showed a positive correlation with left pRNFL (r=0.623, P=0.003). These findings may indicate that the possible damage of the significant atrophic pRNFL and significant increased CDR cause impairment of the visuospatial function in the claustrum and paracentral lobule lobe.
Neurons in the central nervous system may undergo atrophy or cell shrinkage in response to a given insult, and persistence of the pathologic state may lead to neuronal death.6 As glaucoma is a type of progressive transsynaptic degeneration, characterized by the loss of retinal ganglion cells of the lateral geniculate nucleus,32 transsynaptic degeneration and input reduction may be the main reasons for the dysfunction of visual cortices.16 Consequently, PACG can cause retinal ganglion cells loss, neural cells loss in the claustrum, and to some extent in the paracentral lobule lobe, and even in the visual cortex as suggested by the findings in the present study. Furthermore, this study found that the pattern of cortical involvement is different in POAG and PACG, which may be related to different pathogenetic mechanisms in the two patterns of glaucoma. Future studies should provide sufficient evidence to explain the differences.
Conclusion
In this context, the ReHo method is a useful noninvasive imaging index for identifying and detecting regional spontaneous brain activity in PACG. PACG not only presents significant atrophic pRNFL and NRA, and significant increased CDR and ODV, but also showed regional spontaneous brain activity in the visual pathway and secondary degenerative changes in visuospatial function in brain areas related to the visual system. This study demonstrated that PACG is not only an ocular disorder, but also a neurodegenerative disease involved in the whole visual pathway, and clinical parameters may be important biological indicators for regional brain activity in the visual pathway. These findings provide important information to understand the underlying neural mechanisms of PACG.
Acknowledgment
This work was supported by Shaoxing Science and Technology Plan project (grant no 2014B70077).
Disclosure
The authors report no conflicts of interest in this work.
References
Quigley HA, Broman AT. The number of people with glaucoma worldwide in 2010 and 2020. Br J Ophthalmol. 2006;90(3):262–267. | ||
Chen Z, Lin F, Wang J, et al. Diffusion tensor magnetic resonance imaging reveals visual pathway damage that correlates with clinical severity in glaucoma. Clin Exp Ophthalmol. 2013;41:43–49. | ||
Dai H, Yin D, Hu C, et al. Whole-brain voxel-based analysis of diffusion tensor MRI parameters in patients with primary open angle glaucoma and correlation with clinical glaucoma stage. Neuroradiology. 2013;55:233–243. | ||
Nucci C, Mancino R, Martucci A, et al. 3T diffusion tensor imaging of the optic nerve in subjects with glaucoma: correlation with GDx-VCC, HRT-III and Stratus optical coherence tomography findings. Br J Ophthalmol. 2012;96:976–980. | ||
Nucci C, Martucci A, Cesareo M, et al. Brain involvement in glaucoma: advanced neuroimaging for understanding and monitoring a new target for therapy. Curr Opin Pharmacol. 2013;13:128–133. | ||
Zikou AK, Kitsos G, Tzarouchi LC, Astrakas L, Alexiou GA, Argyropoulou MI. Voxel-based morphometry and diffusion tensor imaging of the optic pathway in primary open-angle glaucoma: a preliminary study. AJNR Am J Neuroradiol. 2012;33:128–134. | ||
Boucard CC, Hernowo AT, Maguire RP, et al. Changes in cortical grey matter density associated with long-standing retinal visual field defects. Brain. 2009;132:1898–1906. | ||
Hernowo AT, Boucard CC, Jansonius NM, Hooymans JM, Cornelissen FW. Automated morphometry of the visual pathway in primary open-angle glaucoma. Invest Ophthalmol Vis Sci. 2011;52:2758–2766. | ||
Chen WW, Wang N, Cai S, et al. Structural brain abnormalities in patients with primary open-angle glaucoma: a study with 3T MR imaging. Invest Ophthalmol Vis Sci. 2013;54:545–554. | ||
Nie X, Li HJ, Wan AL, et al. Functional connectivity of paired default mode network subregions in primary insomnia. Neuropsychiatr Dis Treat. 2015;11:3085–3093. | ||
Song Y, Mu K, Wang J, et al. Altered spontaneous brain activity in primary open angle glaucoma: a resting-state functional magnetic resonance imaging study. PLoS One. 2014;9(2):e89493. | ||
Li T, Liu Z, Li J, et al. Altered amplitude of low-frequency fluctuation in primary open-angle glaucoma: a resting-state FMRI study. Invest Ophthalmol Vis Sci. 2014;56(1):322–329. | ||
Huang X, Zhong Y, Zeng X, et al. Disturbed spontaneous brain activity pattern in patients with primary angle-closure glaucoma using amplitude of low-frequency fluctuation: a fMRI study. Neuropsychiatr Dis Treat. 2015;11:1877–1883. | ||
Crawford ML, Harwerth RS, Smith EL 3rd, Mills S, Ewing B. Experimental glaucoma in primates: changes in cytochrome oxidase blobs in V1 cortex. Invest Ophthalmol Vis Sci. 2001;42(2):358–364. | ||
Gupta N, Greenberg G, de Tilly LN, Gray B, Polemidiotis M, Yücel YH. Atrophy of the lateral geniculate nucleus in human glaucoma detected by magnetic resonance imaging. Br J Ophthalmol. 2009;93(1):56–60. | ||
Gupta N, Ang LC, Noël de Tilly L, Bidaisee L, Yücel YH. Human glaucoma and neural degeneration in intracranial optic nerve, lateral geniculate nucleus, and visual cortex. Br J Ophthalmol. 2006;90(6):674–678. | ||
Duncan RO, Sample PA, Bowd C, Weinreb RN, Zangwill LM. Arterial spin labeling fMRI measurements of decreased blood flow in primary visual cortex correlates with decreased visual function in human glaucoma. Vision Res. 2012;60:51–60. | ||
Dai XJ, Peng DC, Gong HH, et al. Altered intrinsic regional brain spontaneous activity and subjective sleep quality in patients with chronic primary insomnia: a resting-state fMRI study. Neuropsychiatr Dis Treat. 2014;10:2163–2175. | ||
Peng DC, Dai XJ, Gong HH, Li HJ, Nie X, Zhang W. Altered intrinsic regional brain activity in male patients with severe obstructive sleep apnea: a resting-state functional magnetic resonance imaging study. Neuropsychiatr Dis Treat. 2014;10:1819–1826. | ||
Dai XJ, Gong HH, Wang YX, et al. Gender differences in brain regional homogeneity of healthy subjects after normal sleep and after sleep deprivation: a resting-state fMRI study. Sleep Med. 2012;13(6):720–727. | ||
Qiu C, Liao W, Ding J, et al. Regional homogeneity changes in social anxiety disorder: a resting-state fMRI study. Psychiatry Res. 2011;194:47–53. | ||
Zang Y, Jiang T, Lu Y, He Y, Tian L. Regional homogeneity approach to fMRI data analysis. Neuroimage. 2004;22(1):394–400. | ||
EI Khouli RH, Macura KJ, Barker PB, Habba MR, Jacobs MA, Bluemke DA. Relationship of temporal resolution to diagnostic performance for dynamic contrast enhanced MRI of the breast. J Magn Reson Imaging. 2009;30:999–1004. | ||
Dai XJ, Nie X, Liu X, et al. Gender differences in regional brain activity in patients with chronic primary insomnia: evidence from a resting-state fMRI study. J Clin Sleep Med. 2016;12(3):363–374. | ||
Li HJ, Dai XJ, Gong HH, Nie X, Zhang W, Peng DC. Aberrant spontaneous low-frequency brain activity in male patients with severe obstructive sleep apnea revealed by resting-state functional MRI. Neuropsychiatr Dis Treat. 2015;11:207–214. | ||
Dai XJ, Liu CL, Zhou RL, et al. Long-term sleep deprivation decreases the default spontaneous activity and connectivity pattern in healthy male subjects: a resting-state fMRI study. Neuropsychiatr Dis Treat. 2015;11:761–772. | ||
Dai H, Morelli JN, Ai F, et al. Resting-state functional MRI: functional connectivity analysis of the visual cortex in primary open-angle glaucoma patients. Hum Brain Mapp. 2013;34(10):2455–2463. | ||
Chan KC, So KF, Wu EX. Proton magnetic resonance spectroscopy revealed choline reduction in the visual cortex in an experimental model of chronic glaucoma. Exp Eye Res. 2009;88:65–70. | ||
Qing G, Zhang S, Wang B, Wang N. Functional MRI signal changes in primary visual cortex corresponding to the central normal visual field of patients with primary open-angle glaucoma. Invest Ophthalmol Vis Sci. 2010;51:4627–4634. | ||
Yucel YH, Zhang Q, Weinreb RN, Kaufman PL, Gupta N. Effects of retinal ganglion cell loss on magno-, parvo-, koniocellular pathways in the lateral geniculate nucleus and visual cortex in glaucoma. Prog Retin Eye Res. 2003;22:465–481. | ||
Makris N, Papadimitriou GM, Sorg S, Kennedy DN, Caviness VS, Pandya DN. The occipitofrontal fascicle in humans: a quantitative, in vivo, DT-MRI study. Neuroimage. 2007;37:1100–1111. | ||
Yucel Y, Gupta N. Glaucoma of the brain: a disease model for the study of transsynaptic neural degeneration. Prog Brain Res. 2008;173:465–478. |
 © 2017 The Author(s). This work is published and licensed by Dove Medical Press Limited. The full terms of this license are available at https://www.dovepress.com/terms.php and incorporate the Creative Commons Attribution - Non Commercial (unported, v3.0) License.
By accessing the work you hereby accept the Terms. Non-commercial uses of the work are permitted without any further permission from Dove Medical Press Limited, provided the work is properly attributed. For permission for commercial use of this work, please see paragraphs 4.2 and 5 of our Terms.
© 2017 The Author(s). This work is published and licensed by Dove Medical Press Limited. The full terms of this license are available at https://www.dovepress.com/terms.php and incorporate the Creative Commons Attribution - Non Commercial (unported, v3.0) License.
By accessing the work you hereby accept the Terms. Non-commercial uses of the work are permitted without any further permission from Dove Medical Press Limited, provided the work is properly attributed. For permission for commercial use of this work, please see paragraphs 4.2 and 5 of our Terms.