")
Back to Journals » Diabetes, Metabolic Syndrome and Obesity » Volume 15
Prevalence of Vitamin D Deficiency Between Type 2 Diabetes Mellitus Patients and Non-Diabetics in the Arab Gulf
Authors Nasr MH , Hassan BAR, Othman N, Karuppannan M , Abdulaziz N, Mohammed AH , Alsarani MA, Eskembaji MH, Aman AM , Othman G
Received 4 December 2021
Accepted for publication 15 February 2022
Published 28 February 2022 Volume 2022:15 Pages 647—657
DOI https://doi.org/10.2147/DMSO.S350626
Checked for plagiarism Yes
Review by Single anonymous peer review
Peer reviewer comments 3
Editor who approved publication: Professor Ming-Hui Zou
Muhammed Hassan Nasr,1 Bassam Abdul Rasool Hassan,2 Noordin Othman,3 Mahmathi Karuppannan,4 Noorizan binti Abdulaziz,5 Ali Haider Mohammed,2,6 Mohammed Ahmed Alsarani,7 Mohammed Husain Eskembaji,7 Abdelmannan Mohamed Aman,8 Gamil Othman9
1Clinical Pharmacy Department, Faculty of Health Sciences and Nursing, Al-Rayan Colleges, Al-Madinah Al-Munawarah, Saudi Arabia; 2Department of Pharmacy, Al Rafidain University College, Baghdad, 10001, Iraq; 3Quality Use of Medicines in Umrah and Hajj Pilgrimage Research Group, Department of Clinical and Hospital Pharmacy, Faculty of Pharmacy, Taibah University, Al-Madinah Al-Munawarah, Saudi Arabia; 4Department of Pharmacy Practice, Faculty of Pharmacy, Universiti Teknologi MARA, Puncak Alam Campus, Bandar Puncak Alam, 42300, Selangor, Malaysia; 5Clinical Pharmacy Department, Faculty of Pharmacy, Management and Science University, Shah Alam, Malaysia; 6School of Pharmacy, Monash University Malaysia, Bandar Sunway, 47500, Selangor, Malaysia; 7Laboratory Department, Medical Care Unit, Taibah University, Al-Madinah Al-Munawarah, Saudi Arabia; 8Family Medicine Department, Medical Care Unit, Taibah University, Al-Madinah Al-Munawarah, Saudi Arabia; 9Department of Clinical Pharmacy and Pharmacy Practice, Faculty of Pharmacy, University of Science and Technology, Sana’a, Yemen
Correspondence: Gamil Othman, Email [email protected]
Background: The link between the risk of type 2 diabetes mellitus (T2DM) and vitamin D deficiency has perplexed the medical society due to the controversy in the data available. Saudi Arabia (SA) is a sunny region; however, ample amount of data reported the increased prevalence of vitamin D deficiency along with T2DM. Thus, this study aimed to compare vitamin D deficiency between healthy and T2DM patients in SA, alongside with the risk factors associated with that.
Methods: A cross-sectional study was conducted in the Medical Unit, Taibah University in Al-Madinah Al-Munawarah, SA, from November 2017 to May 2018. The involved participants were non-diabetics and T2DM men. Measuring vitamin D for T2DM and non-diabetics group was done by trained technicians. Data analysis was done via SPSS.
Results: Sixty-four participants (T2DM group = 32; non-diabetics group = 32) were recruited, and the mean age of T2DM patients was 48.6 ± 10.4, while that of the non-diabetics was 42.4 ± 6.5. The mean of vitamin D level was found higher in the non-diabetic participants than in diabetic patients. There was statistically significant association between vitamin D deficiency and T2DM (P = 0.001). Besides, duration of diabetes was the only factor, found to be positively correlated with vitamin D deficiency in T2DM patients.
Conclusion: Early screening for vitamin D serum-level is recommended for T2DM patients in Saudi Arabia. Therefore, early correction of vitamin D levels should be considered, and medical and scientific societies, along with other sectors such as the media, should highlight and increase the awareness of the importance of vitamin D and the seriousness of its deficiency.
Keywords: T2DM, vitamin D deficiency, Saudi Arabia
Introduction
Worldwide, diabetes mellitus (DM) is now considered the most common metabolic non-communicable disease with accelerated morbidity, increased and premature mortality, and increased health-care costs.1 It is well known that countries with low- and middle-incomes have the highest load of type 2 diabetes mellitus (T2DM) internationally. This is most probably due to the rapid and progressive socioeconomic development in these countries that has resulted in urbanization of their lifestyle and westernization of their diets.2
The International Diabetes Federation (IDF) has ranked the region of Middle East and North Africa (MENA), as the highest global prevalence of diabetes in 2011 (12.5%). This is expected to reach 14.3% by the year 2030.3 It has been estimated that in MENA region, DM had reached 35.4 million cases in 2015, with the expectation that it will reach 72.1 million by the year 2040.4
In the Kingdom of Saudi Arabia (KSA), DM is considered as a serious public health problem rising along with the worldwide diabetes pandemic.2,5 The WHO classified KSA as the second highest in the Middle East and the seventh in the whole world in terms of diabetic incidence rate. Seven million people are estimated to have DM and another three million or more with prediabetes in KSA. If ignored, the prevalence of DM could reach 50% of the entire Saudi population.6 Considering the progression of the total number of individuals with prediabetes, their inclusion will tremendously raise this heavy disease burden to 43 billion Saudi Riyals. The Saudi population naturally tends to have a particular genetic predisposition for developing DM. Mutations in the gene GLIS3 and SLC2A2 were the most identified. Autosomal-recessive syndromes among which is Wolcott Rallison, in addition to neonatal diabetes and hypothyroidism were also documented.7 Furthermore, gene TCF7L2 was found to be greatly correlated with hyperglycaemia which increased the incidence of T2DM in the Saudi population.8 A previous systematic-review reported a total of 23 polymorphisms in 17 genes were found to be correlated with the increased risk of T2DM in the Saudi population; KCNJ11, PPARG2, IRS1, VDE, WFS1, JAZF1, CDKN2A/B, TCF7L2, KCNQ1, HNF4A, DUSP9, APOE, HNF1A, SLC30A8, APOC3, SNAP25, and ACE.9 This special predisposition is intensified by the increase in obesity rates, a high rate of kinship, physical inactivity and the presence of many other changeable factors leading to the syndrome of insulin resistance.10,11
Vitamin D, known as a “sunshine” vitamin, is one of the vitamins that is soluble in fat, and is considered as a prohormone steroid.12 It is documented that vitamin D has important functions in the endocrine, paracrine, autocrine systems, and has a significant role in sustaining calcium homeostasis and bone health.13,14
1, 25-dihydroxyvitamin D3 [1, 25-(OH)2 D3], the active form of vitamin D, also called calcitriol, was found to influence the β-cells in the pancreas, in addition to exerting some effects on insulin secretion.15 One of the reasons behind the association of vitamin D deficiency with insulin resistance is that vitamin D receptor (VDRs), in addition to the enzyme 1-α 27 hydroxylases, which is important for the synthesis of calcitriol, were found to be present in pancreatic β-cells.16,17
Several studies had documented a possible link between vitamin D and pancreatic β-cells function in which vitamin D deficiency can lead to prediabetes, and even diabetes itself.12 In the Longitudinal Aging Study Amsterdam, 1286 Dutch older participants with metabolic syndrome were assessed. The researchers have noted that deficiencies of the vitamin were associated with an increased occurrence of metabolic syndrome. So, they concluded that decreased vitamin D levels were associated with decreased insulin sensitivity, increased insulin resistance (IR), and high fast blood glucose (FBG).
Around a billion people in the world have been estimated to be vitamin D deficient.18,19 In addition, a dramatic rise in vitamin D deficiency has been reported in the MENA region despite the abundance of sunshine.20,21 A similar or even higher prevalence of vitamin D deficiency in Saudi Arabia has been reported. Therefore, vitamin D deficiency can negatively affect the β-cells function and reduce insulin synthesis and secretion which will finally lead to diabetes.
Since it has been documented that both T2DM and vitamin D deficiency are highly prevalent in Saudi Arabia, this study would aim to investigate the vitamin D deficiency between diabetic and non-diabetic patients and explore the factors that contribute to the difference in vitamin D deficiency between the T2DM and the non-diabetic, eg, genetic, environmental, and/or dietary factors.
Methods
Study Design and Setting
This was a cross-sectional study conducted to compare the prevalence of vitamin D deficiency between T2DM patients and non-diabetic participants living in Al-Madinah Al-Munawarah region, Saudi Arabia, and to assess the risk factors which might be associated with that condition. This study was carried out in the Medical Unit of Taibah University in Al-Madinah Al-Munawarah, KSA. The medical unit is a primary health-care unit, which is placed inside the main large campus of Taibah University. This unit is concerned to provide the out-patient medical care to all the academic and non-academic staff of the University, their families, and the students.
The participants collected were two groups, firstly male adults who are diagnosed by a physician according to American Diabetes Association criteria with T2DM, secondly adults who were non-diabetics, and from different nationalities including Saudi and non-Saudi. According to the latest evidence, it is proven that most of women in SA have vitamin D deficiency,22 therefore, they were exempted in the current study to avoid being a confounder.
Individuals who are consuming vitamin D supplementations, patients with renal, liver or cancer diseases, patients with thyroid or parathyroid disorders, and individuals receiving any drug interacting with vitamin D and affecting its metabolism. steroids, orlistat, cholestyramine, phenytoin and phenobarbital were also excluded from the study.
The researchers screened attendants of the medical unit and found a sample size of 64 participants: 33 in group one (T2DM patients) and 32 in group two (non-diabetics). Participants were recruited by direct approaching the individuals who were attending the medical unit for regular check-up or for diagnosis and treatment of acute diseases such as common cold, sinusitis, or performing dental procedures.
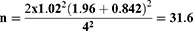
Estimated sample size was calculated by substituting the following formula:
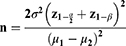
n = estimated sample size, α= level of significance of 5% (0.05), β= type II error, z1−α/2= 1.96, z 1−β= 0.842 when β= 20% (power is 80%), µ1 − µ2 = the estimated predicted difference between the two mean values of the 2 groups and estimated to be 4, α2 = the expected, population variance taken from a previous study23 and estimated to be 1.02
Data Collection, Laboratory, and Vitamin D Measurements
For the diabetic patients, the electronic list of T2DM patients, which has been included into the Medical Unit’s software was used to invite the patients by phone calls for the participation in the study. After their willingness, they were checked for eligibility to the inclusion criteria.
The participants who were found to be eligible according to the inclusion criteria (discussed below) signed the consent form, during a month run-in period, participants were screened for complications, patients were explained about the research process, and the participants’ adherence with the protocol was assessed. Each participant fulfilled the demographic data using a structured questionnaire which contained basic demographic data, risk factors, a detailed history of diabetes (if present), socio-economic data, information about intake of vitamin D-containing diets, exposure period to sunlight per day, and all the subjects were examined clinically. The questionnaire was validated by using face validation.
Five mL of blood was collected by trained technicians. This was done under the supervision and guidance of the primary care physician. Blood tubes were preserved in a cooler or refrigerator immediately. The time of preservation was not less than 30 minutes and did not exceed four hours before the technicians centrifuge them. The centrifugation process was done for about half an hour at 3000 RPM at 4°C. After this, the technicians immediately separated the serum from the whole blood and froze them at -20°C. This was done at the biochemistry laboratory at the Medical Unit, faculty of medicine, Taibah University, Al-Madinah.
Two readings of blood pressure were obtained and separated by two minutes of rest. Measuring blood pressure for each participant in both study groups was done in the physician-consulting clinic by using a standard mercury sphygmomanometer on the right arm. The participants were asked to sit calm for ten minutes. The two readings were averaged to the nearest 2 mmHg. Determination of the systolic blood pressure was by the level of appearance of the first Korotkoff sounds while for the diastolic blood pressure, phase five of Korotkoff sounds were considered.
The (25-hydroxyvitamin D) levels were measured by ECLIA assay by Cobas machine e 411. (25-hydroxyvitamin D) levels less than 20 ng/mL were considered as deficient, while levels between 20 and 30 ng/mL were considered inadequate, and levels greater than 30 ng/mL were considered adequate vitamin D.13 FBS and HbA1c were measured using photometric assay using Cobas machine c 311.
Data Analysis
The data were recorded on an “Investigation report form”. These data were tabulated, coded then analysed using SPSS version 25 to obtain descriptive statistics such as mean, standard deviation (±SD), and number and percentage. Independent t-test was used to compare between mean of two groups of numerical (parametric) data. For continuous non-parametric data, the Mann–Whitney U-test was used for inter-group analysis. Paired t-test and Wilcoxon signed rank test were used to compare between mean of two groups before and after intervention. Inter-group comparison of categorical data was performed by using chi square test and fisher’s exact test. Logistic regression was used for the association between socio-demographic and dietary habits with vitamin D deficiency. P value <0.05 was considered statistically significant (S) and a P value <0.0001 was considered highly significant (HS) in all analyses. Ethical Approval was obtained from the respective organisation.
Results
A total of sixty-four healthy participants were recruited in the study, subdivided into two groups, 32 T2DM patients and 32 non-diabetics (Table 1). The mean age of T2DM patients was 48.6 ± 10.4, while that of the non-diabetics was 42.4 ± 6.5. Majority of the diabetic and non-diabetic group were non-Saudis from Egypt followed by Sudan. In both groups, T2DM patients and non-diabetics were married (96.9%). Within the T2DM patients, 21.9% (n = 7) were current and active smokers compared to 15.6% (n = 5) of the non-diabetics, while 56.2% (n = 18) of the T2DM group in contrast to 81.2% (n = 26) of the non-diabetics had never smoked. Majority of the non-diabetic participants were postgraduates (n = 22, 68.8%), while only 43.8% (n = 14) in the T2DM group were postgraduates. Therefore, this variation in their education status was found to be significant (p < 0.01). The Governmental employees within the T2DM and the non-diabetic group were 71.9% (n = 23) and 75% (n = 24), respectively. 6.2% (n = 2) from the T2DM patients were working in private sectors compared to 18.8% (n = 6) in the non-diabetic group. While 6.2% (n = 2) in the T2DM patients and 3.1% (n = 1) in the non-diabetics were students. Statistically, there was no significant variation in the occupation status between the two groups (p = 0. 2).
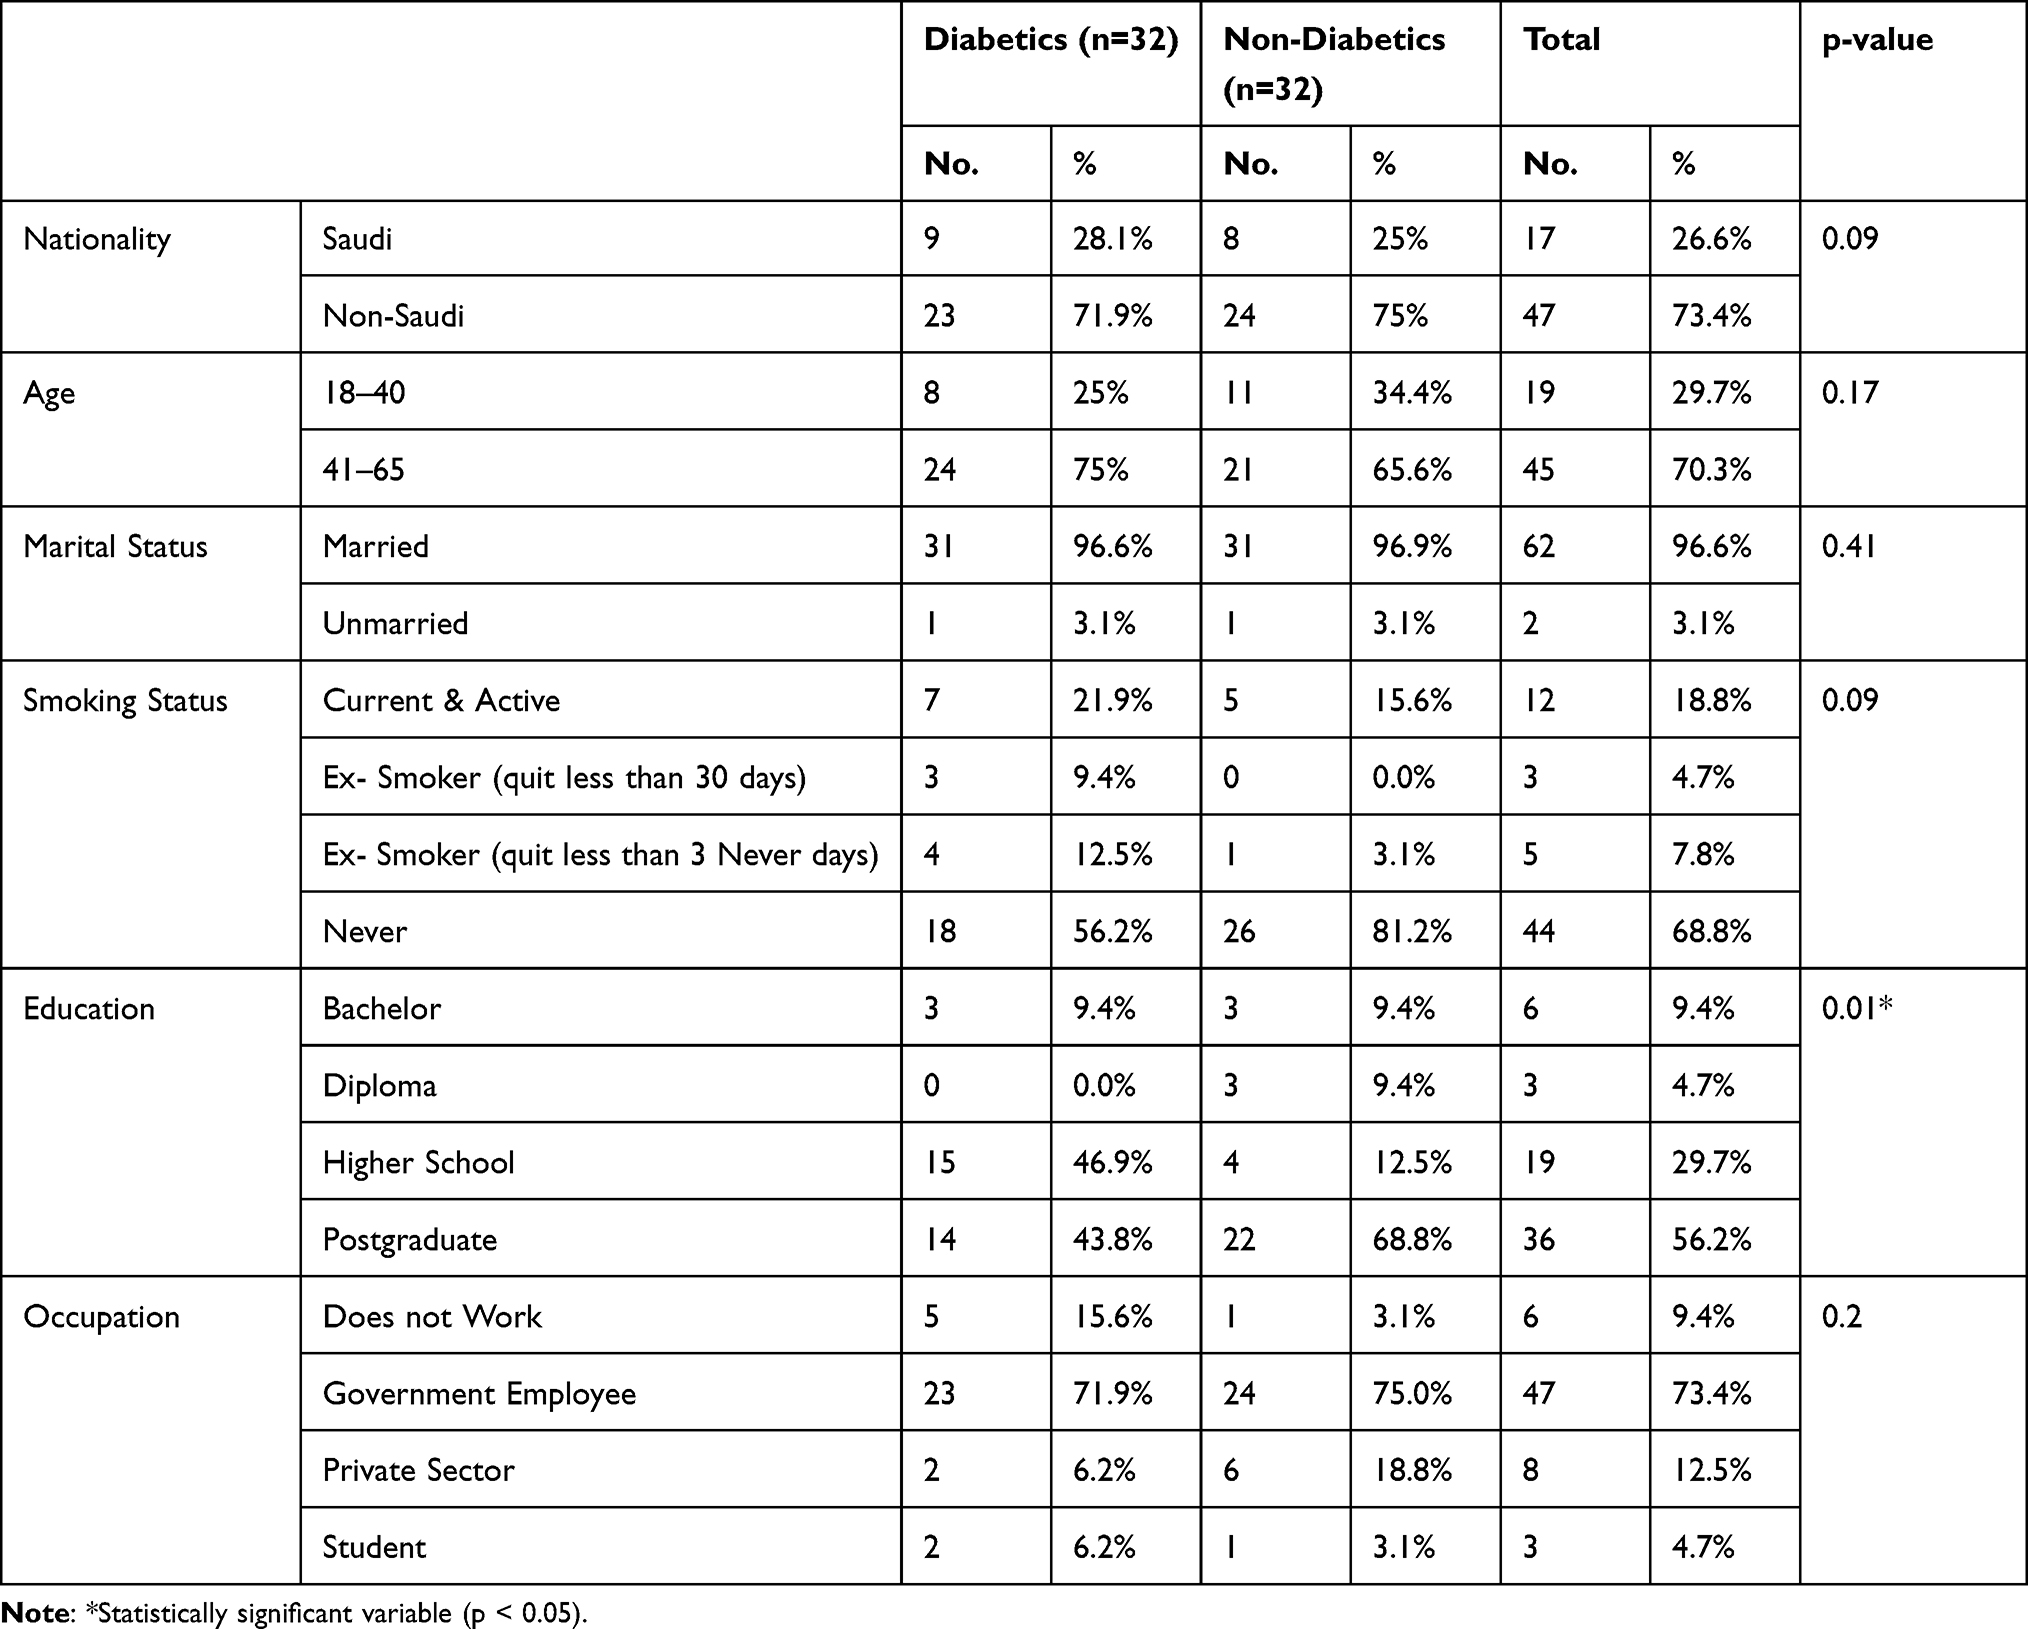 |
Table 1 Demographic Data Between Diabetics and Non-Diabetics Participants |
Dietary Pattern of Diabetic and Non-Diabetic Participants
Overall, the consumption of egg-yolk, oily-fish, liver, and red meat did not differ significantly between the T2DM patients and the non-diabetic group (Table 2). In contrast, the percentages of T2DM patients consuming Fortified Food (n = 2, 6.2% daily and n = 5, 15.6% three times/week) were significantly lower than that of the non-diabetics group (n = 12, 37.5% daily and n = 8, 25% three times/week) (p = 0. 003).
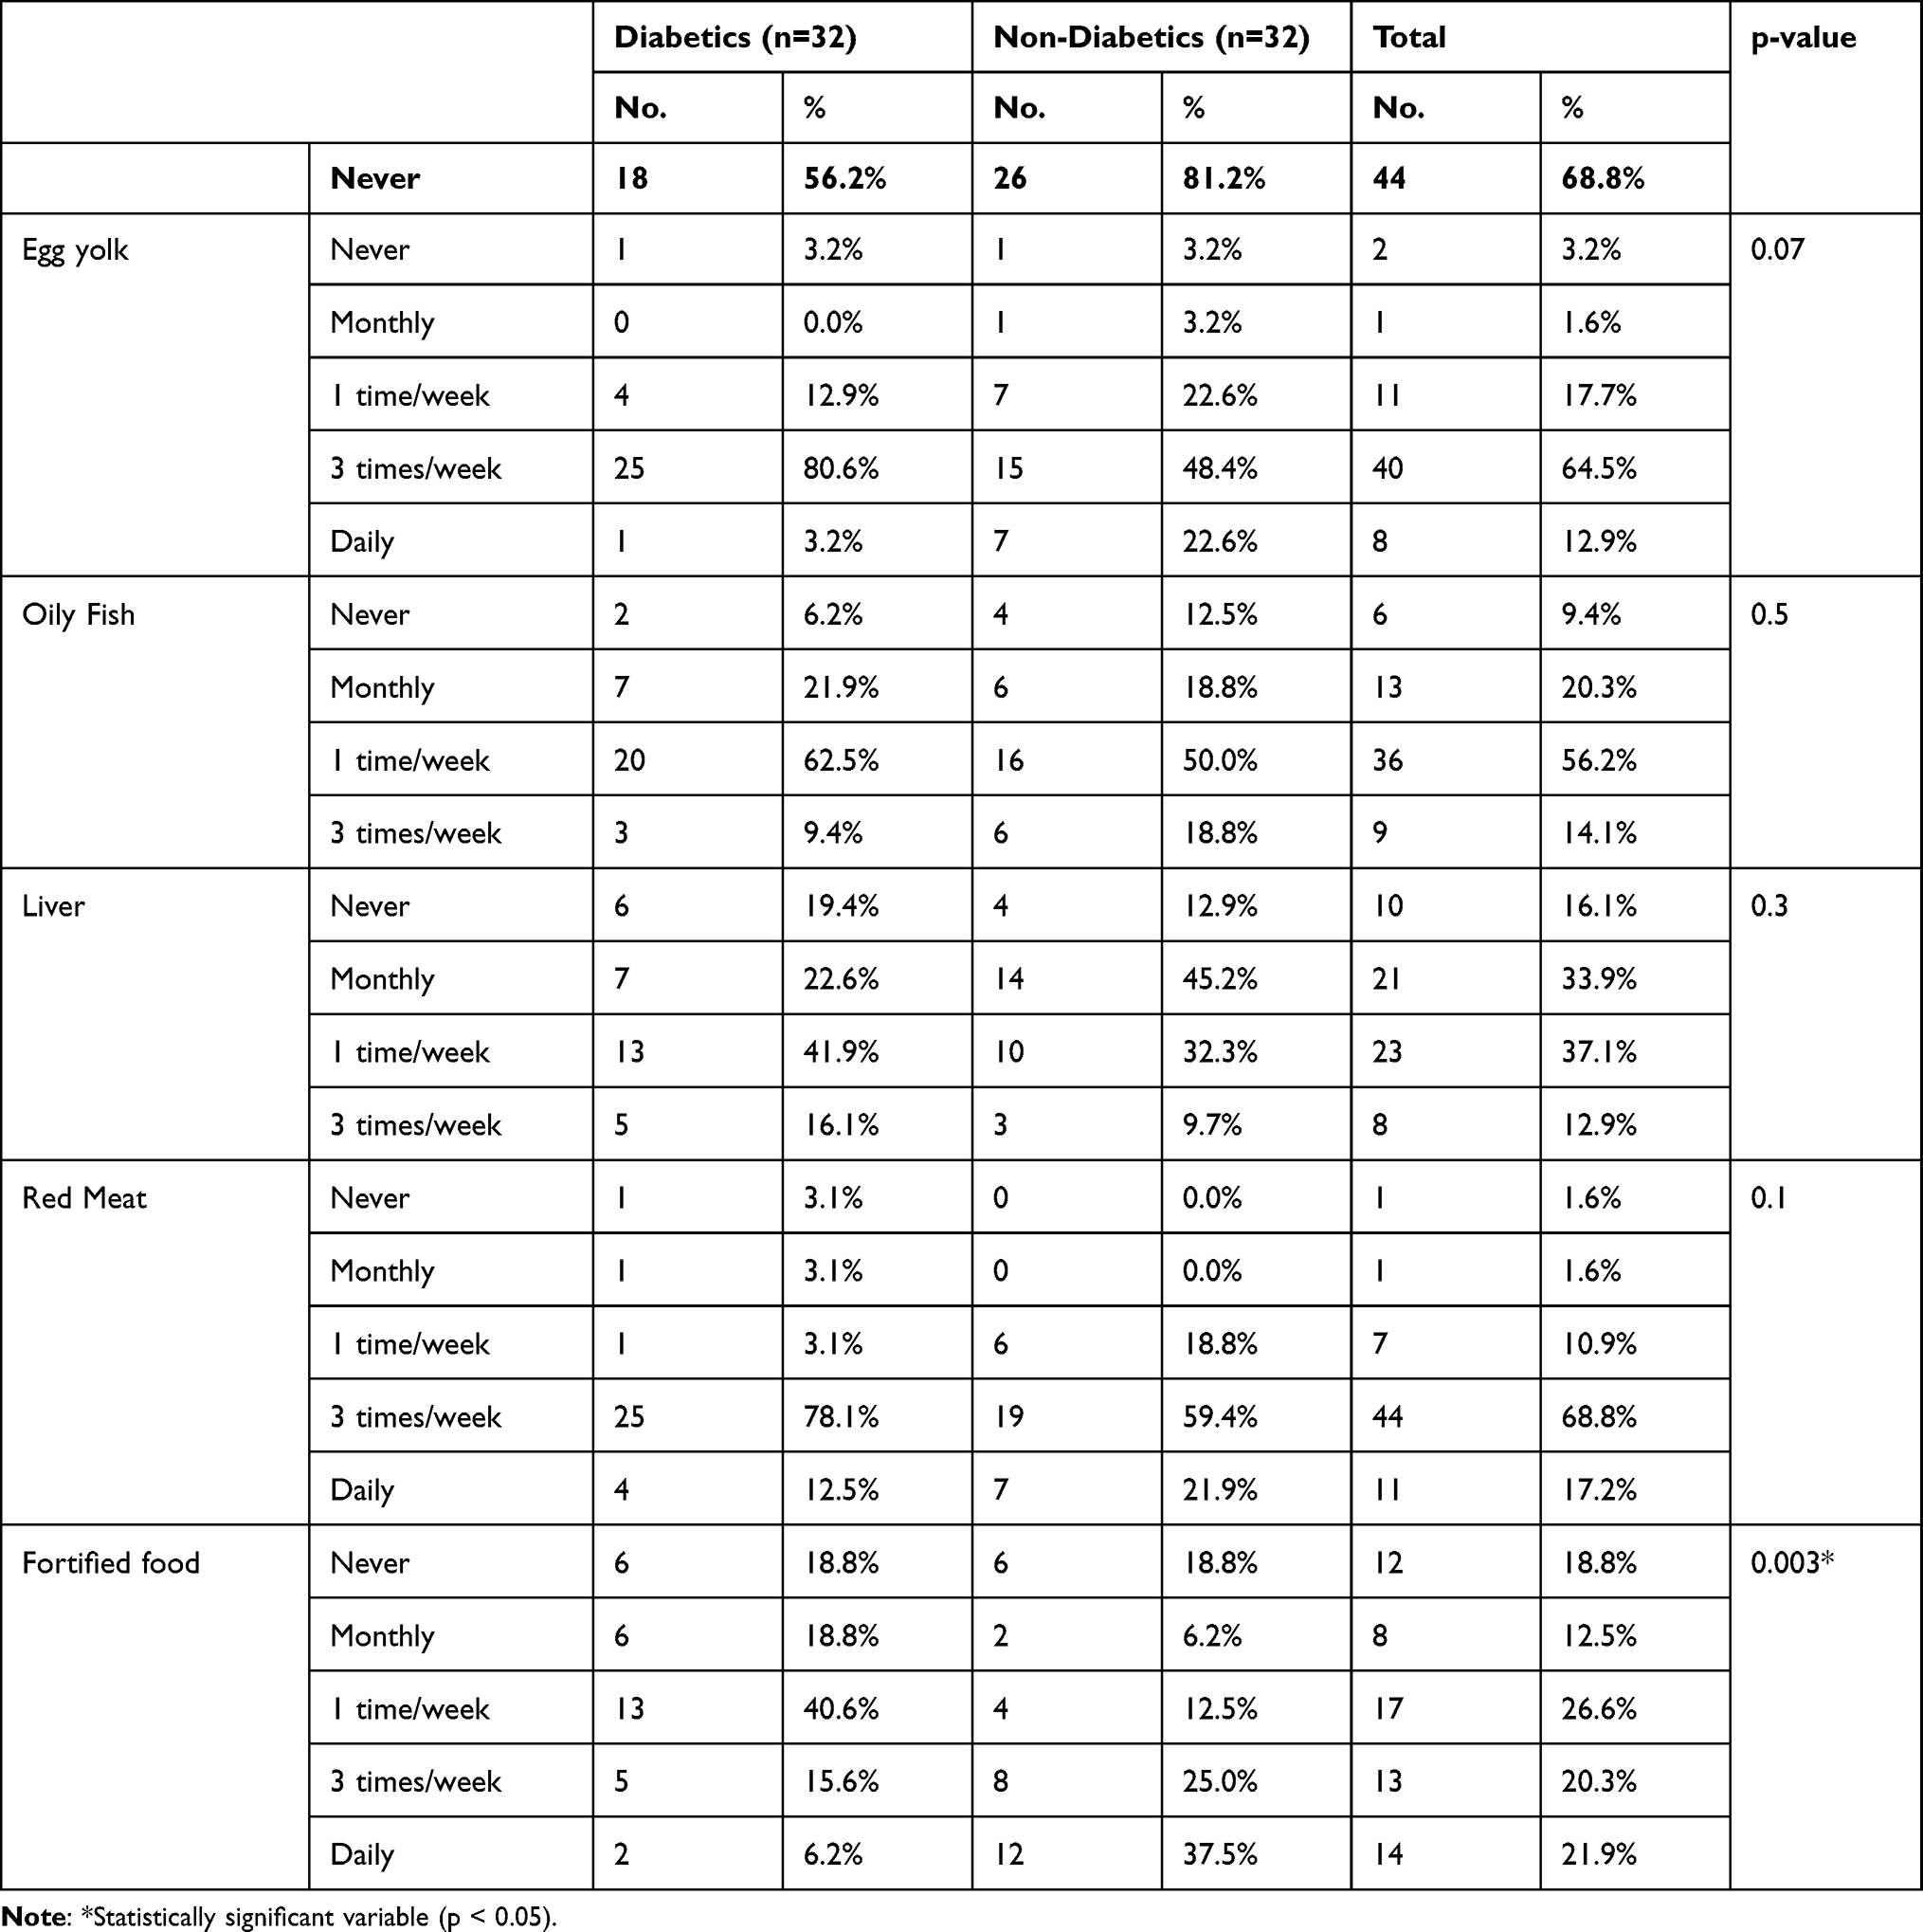 |
Table 2 Comparison Between Diabetics and Non-Diabetics Regarding Dietary Pattern |
Sunlight Exposure and Co-Existing Clinical Health Problems Among Respondents
In the T2DM patients 31.3% were exposed to sunlight for 30 minutes daily compared to 34.4% in the non-diabetic group and those who were exposed to sunlight for 15 minutes daily within the T2DM group were 53.1% versus 34.4% in the non-diabetics (Figures 1 and 2). However, there was no significant difference in the duration of sunlight exposure between the diabetic and non-diabetic group (P = 0.4).
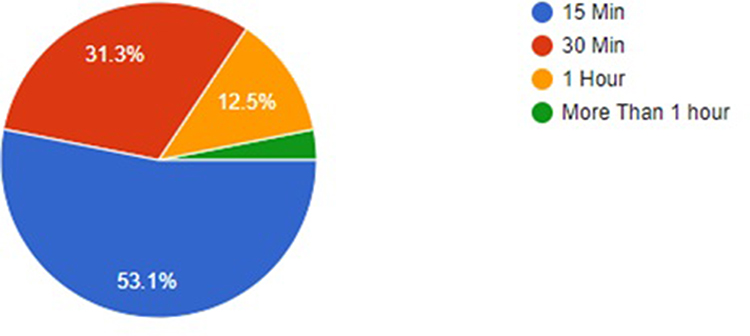 |
Figure 1 The duration of daily sunlight exposure among T2DM patients. |
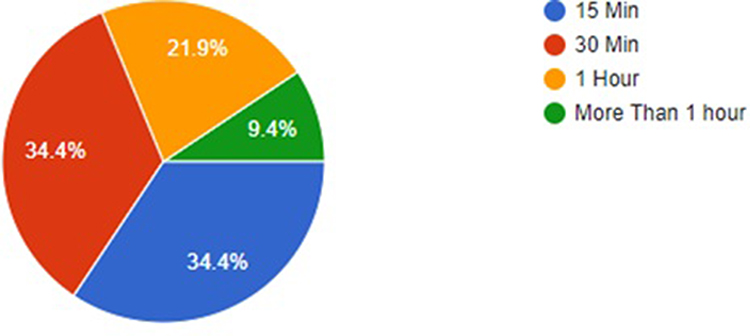 |
Figure 2 The duration of daily sunlight exposure among non-diabetics. |
Table 3 demonstrates that the main co-existing health problem in this study population was hypertension. The percentage (62.5%) of T2DM patients having hypertension was significantly higher than the non-diabetics group (21.9%) (p = 0. 001).
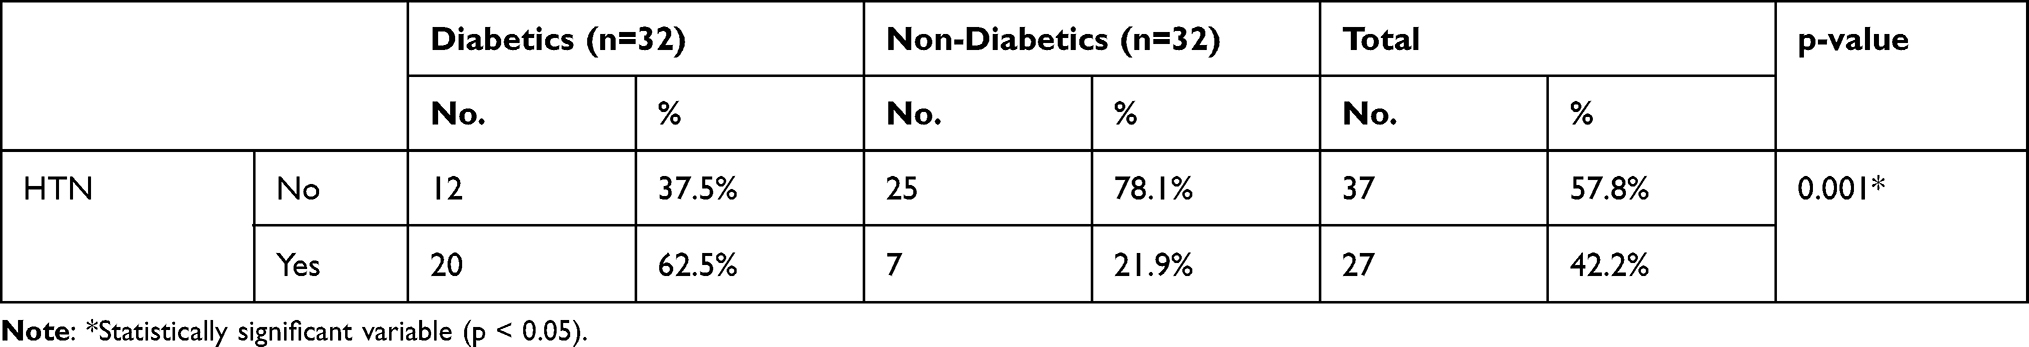 |
Table 3 Comparison Between Diabetics and Non-Diabetics Regarding HTN |
Vitamin D Serum-Levels Among Participants
According to the criteria previously illustrated in the “Data collection” section; (25-hydroxyvitamin D) levels less than 20 ng/mL were considered as deficient, while levels between 20 and 30 ng/mL were considered insufficient, and levels greater than 30 ng/mL were considered adequate vitamin D: Within the T2DM patients 93.75% were vitamin D deficient compared to 50% within the non-diabetic group. The mean of vitamin D level was found to be 13.51 ± 4.6 in the diabetic patients, while it was 21.09 ± 6.09 in the non-diabetics. Therefore, vitamin D deficiency was found to be significantly higher in the T2DM patients’ group than the non-diabetic group with P = 0.001 (Figure 3). In addition, logistic regression test reported that duration of diabetes was the only factor, found to be positively correlated with vitamin D deficiency in T2DM patients (Table 4). Thereby, it was the only factor observed to play an effective role in the incidence of vitamin D deficiency.
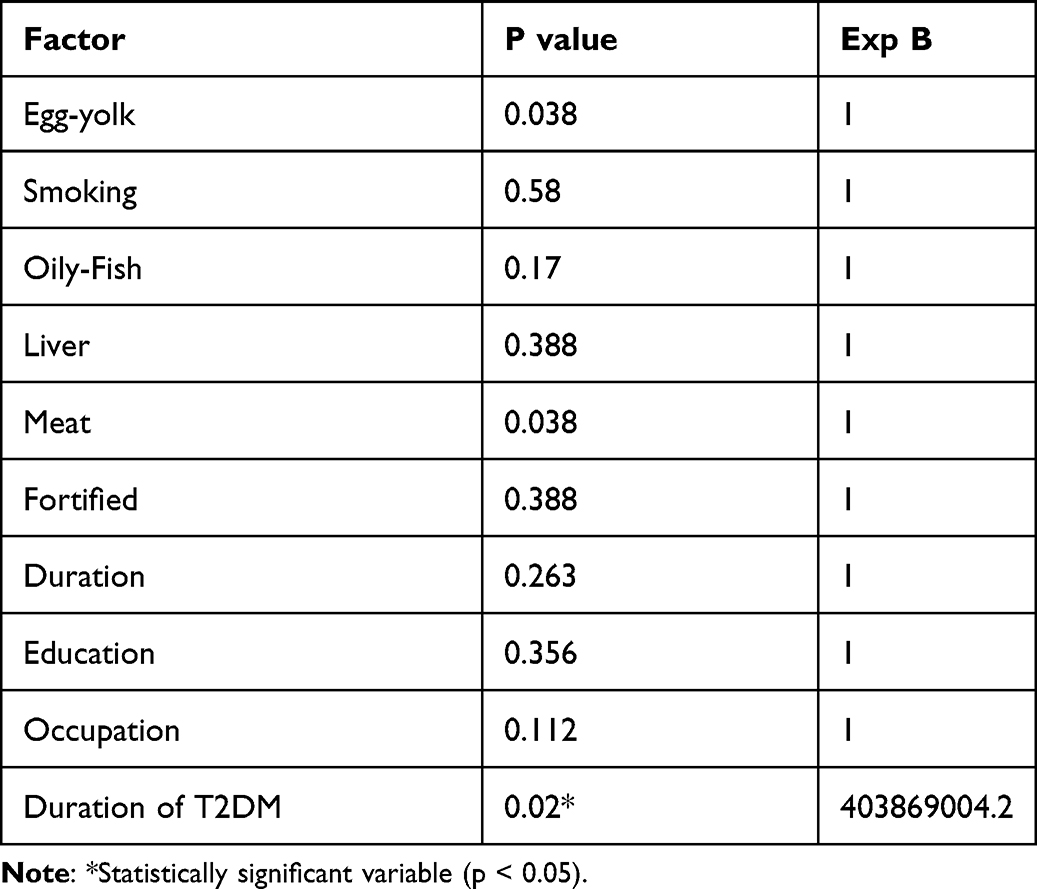 |
Table 4 Vitamin D Deficiency (Dependent Variable) with Socio-Demographic and Dietary Pattern Data (Independent Variables) for T2DM Patients |
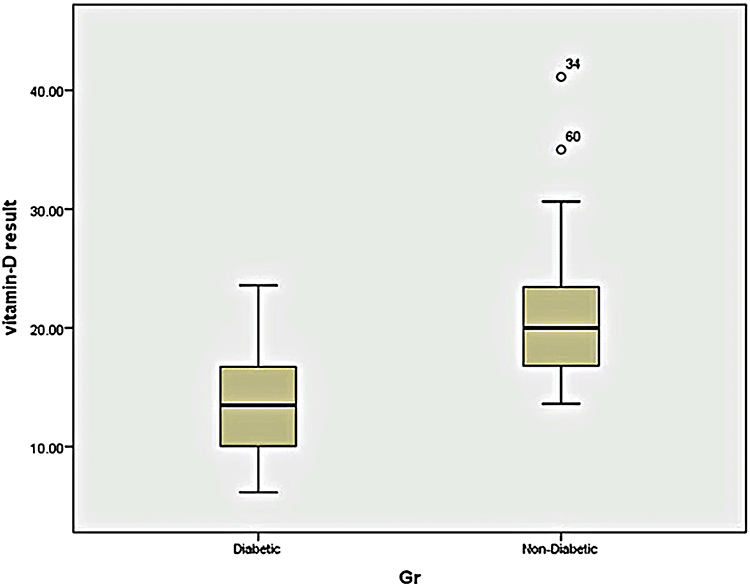 |
Figure 3 Vitamin D level among T2DM and non-diabetic participants. |
Discussion
To our knowledge, this present study was the first trial that studied the differences in the prevalence of vitamin D deficiency between male T2DM patients and non-diabetics in Saudi Arabia. The link between vitamin D deficiency and T2DM has attracted the attention of the medical society. Vitamin D deficiency can be caused by inefficient synthesis in the skin due to improper exposure to sunlight or type of skin or other factors (eg, inadequate dietary ingestion of vitamin D, enhanced vitamin D catabolism, and any health conditions leading to the reduction of the bioavailability of vitamin D) by decreasing its absorption or even conversion to the active form.12 It has been known that glucose-mediated secretion of insulin is enhanced by vitamin D in animal studies due to insulin receptor expression and the stimulation of insulin-mediated glucose transport.24 Based on the effects of vitamin D on insulin release and action, along with the other factors, it has been proposed that vitamin D could be linked to metabolic syndrome as well as T2DM.25,26
In this present study, the participants with higher education levels had higher vitamin D levels. The same observation has been noted in a number of previous studies. Bani-Issa et al concluded that the less-educated, employed Emirati’s participants had a significantly higher percentage of vitamin D deficiency than the higher-educated participants.20 This is probably because higher education people are more aware and knowledgeable about the benefits and importance of vitamin D by obtaining it either from the food, health supplements, or sunlight exposure. Moreover, the education level is influenced by the differences in the income amount of people. Regarding the differences in the dietary habits between the T2DM group and the non-diabetic group, this phase of the present trial has observed that there is a highly significant difference between the diabetic and non-diabetic groups in the consumption of fortified food. This finding might be attributed to the diabetic patients’ fear that the fortified food or drinks might contain added sugar that could increase their blood glucose levels.
Both hypertension and diabetes are chronic and common non-communicable diseases which are characterized by a dramatic increase in global incidence. Both diseases have the same risk factors, ie, physical inactivity, obesity, smoking, alcohol intake and unhealthy dietary habits; this can represent a possible cause for their coexistence. Among the proposed mechanisms for their coexistence are over-activation of the renin-angiotensin-aldosterone system, increase and expansion of blood volume as a result of hyperglycemia, oxidative stress, endothelial dysfunction, loss of circadian rhythm, and decreased baroreceptor buffering.27 Furthermore, insulin resistance impairs the production of the vasodilator Nitric Oxide (NO), hence leads to vasoconstriction and increases the total peripheral resistance which consequently raise the blood pressure. In addition, the increment in the sympathetic nervous system activity induced by the insulin resistance is among the possible factors which leads to the development of Hypertension.28
Notably, it has been documented in some studies that the association of vitamin D deficiency with hypertension and cardiovascular diseases was due to the presence of vitamin D receptors and the enzyme responsible for converting vitamin D to its active form in the cardiovascular system including the heart, endothelium, and vascular smooth muscles.29,30 Hence, vitamin D supplements were found to have a beneficial effect on cardiovascular diseases and hypertension.31,32 Therefore, it is not surprising that both hypertension and T2DM in the present study are statistically significant and they are coexisting among diabetic group.
Moreover, majority of T2DM patients were vitamin D-deficient (<20 ng/mL) indicating that vitamin D deficiency was significantly higher in the diabetic group than the non-diabetic. These findings, which have confirmed the vitamin D deficiency-T2DM link, were possibly due to the presence and distribution of vitamin D receptors in the β-cells of the pancreas as well as in the adipose tissue and skeletal muscle. There are also several theories that have clarified the relationship between vitamin D deficiency and incidence of T2DM. Another assumption has suggested that through its membranous receptors expressed on the β-cells, vitamin D increases calcium influx into β-cells. The changes in the concentration of intracellular calcium in beta cells represent an essential step that leads to glucose-induced insulin secretion. Thus, the net result is the enhancement of beta-cell functions, synthesis, and secretion of insulin.12 One explanation for this link might be due to some modifications in the protein that is responsible for binding vitamin D, as well as in vitamin D receptor gene that can negatively alter glucose tolerance and lead to insulin resistance.23 The findings of a study performed in North China suggested that CC genotype of VDR-FokI is considered a risk factor for T2DM patients with dyslipidemia in elderly males.33 In addition, a study conducted in Egypt concluded that the VDR BsmI gene polymorphism together with the deficiency in vitamin D are risk factors for type 2 diabetes and diabetic nephropathy.34 Moreover, a recent study found that the T allele of the two genes Apa1 and Taq1 was linked with the raised risk of T2DM.35
Furthermore, through its anti-inflammatory actions, vitamin D can increase insulin sensitivity and decrease insulin resistance causing diabetes.12 In previous cohort research, the association of the concentration of the vitamin with the incidence of T2DM has been described. Serum vitamin D levels of more than 30 ng/mL (which is considered the normal level; levels less than 20 ng/mL were considered as deficient, while levels between 20 and 30 ng/mL were considered insufficient) reduced the risk of developing diabetes by approximately 20–50%.12 The latest systematic review and meta-analysis concluded that hypovitaminosis D carried an increased risk in the incidence of T2DM in older individuals.36 A case-control study conducted by AlKadi, 2014; in Jeddah, Saudi Arabia, to evaluate the vitamin D levels of Saudi women T2DM patients. Although the results did not reach statistically significant difference, the authors have reported that vitamin D deficiency was more common in T2DM patients than non-diabetics.37 The author has also highlighted the need for more longitudinal studies to confirm the vitamin D deficiency-T2DM link which has been done and confirmed by this present study. Krul-Poel et al performed a double-blinded RCT on 275 T2DM adult patients in Netherlands in 2015 to evaluate the impact of vitamin D on the blood glucose control in T2DM patients. The authors have observed that for every 25 nmol/L (or 10 ng/mL) decrease in calcidiol level, type 2 diabetes mellitus risk was 1.01 (95% CI 0.75–1.36; P = 0.94). They have also stated that vitamin D deficiency was highly prevalent in this population.38 Lastly, by performing the logistic regression analysis, the current data have shown that the duration of diabetes was positively correlated with the reduction in serum vitamin D levels, so it was considered as a predictor of vitamin D deficiency.
Conclusion
In this study, vitamin D deficiency was significantly higher in T2DM patients than the non-diabetic individuals, and the only factor that positively correlated with vitamin D deficiency was the duration of diabetes. Therefore, early screening and treatment of vitamin D deficiency is recommended. Vitamin D must be added for individuals with high-risk features for diabetes, ie, with prediabetes to aid in preventing the incidence of the disease. Medical and scientific societies in Saudi Arabia, along with other sectors such as the media, should highlight and increase the awareness of the importance of vitamin D and the seriousness of its deficiency. In the current study, the main limitation is the small sample size so that further multi-centered randomized-controlled studies with large sample size are recommended to better illustrate the role of Vitamin D in T2DM.
Data Sharing Statement
The data that support the findings of this study are available from the author “Muhammed Hassan Nasr” upon reasonable request.
Ethical Approval
All procedures performed in this study were in accordance with the ethical standards of the institutional research committee and with the 1964 Helsinki Declaration and its later amendments or comparable ethical standards. Approval from Universiti Teknologi Mara (UiTM) postgraudate Ethics Committee and from Taibah University Research Committee in Al-Madinah Al-Munawarah, KSA were obtained.
Author Contributions
All authors made a significant contribution to the work reported, whether that is in the conception, study design, execution, acquisition of data, analysis and interpretation, or in all these areas; took part in drafting, revising or critically reviewing the article; gave final approval of the version to be published; have agreed on the journal to which the article has been submitted; and agree to be accountable for all aspects of the work.
Funding
The authors declare that there was no funding for this work.
Disclosure
The authors report no conflicts of interest for this work and declare that there is no conflict of interest regarding the publication of this paper.
References
1. Hameed I, Masoodi S, Nabi M, Ghazanfar K, Ganai BA, Ganai BA. Type 2 diabetes mellitus: from a metabolic disorder to an inflammatory condition. World J Diabetes. 2015;6:598–612. doi:10.4239/wjd.v6.i4.598
2. Alotaibi A, Perry L, Gholizadeh L, Al-Ganmi A. Incidence and prevalence rates of diabetes mellitus in Saudi Arabia: an overview. J Epidemiol Glob Health. 2017;7(4):211–218. doi:10.1016/j.jegh.2017.10.001
3. Whiting DR, Guariguata L, Weil C, Shaw J. IDF diabetes atlas: global estimates of the prevalence of diabetes for 2011 and 2030. Diabetes Res Clin Pract. 2011;94(3):311–321. doi:10.1016/j.diabres.2011.10.029
4. Atlas D. International Diabetes Federation. IDF Diabetes Atlas.
5. Elhadd TA, Al-Amoudi AA, Alzahrani AS. Epidemiology, clinical and complications profile of diabetes in Saudi Arabia: a review. Ann Saudi Med. 2007;27(4):241–250. doi:10.5144/0256-4947.2007.241
6. Alwin Robert A, Abdulaziz Al Dawish M, Braham R, Ali Musallam M, Abdullah Al Hayek A, Hazza Al Kahtany N. Type 2 diabetes mellitus in Saudi Arabia: major challenges and possible solutions. Curr Diabetes Rev. 2017;13(1):59–64. doi:10.2174/1573399812666160126142605
7. Habeb AM, Al‐Magamsi MS, Eid IM, et al. Incidence, genetics, and clinical phenotype of permanent neonatal diabetes mellitus in northwest Saudi Arabia. Pediatr Diabetes. 2012;13(6):499–505. doi:10.1111/j.1399-5448.2011.00828.x
8. Acharya S, Al-Elq A, Al-Nafaie A, Muzaheed M, Al-Ali A. Type 2 diabetes mellitus susceptibility gene TCF7L2 is strongly associated with hyperglycemia in the Saudi Arabia population of the eastern province of Saudi Arabia. Eur Rev Med Pharmacol Sci. 2015;19(16):3100–3106.
9. Siddiqui K, Musambil M, Usmani AM. Established type 2 diabetes-susceptibility genetic variants in Saudi ethnicity: a mini-systematic review. J Biochem Clin Genetics. 2018;1(2):57–65.
10. Al-Mutairi RL, Bawazir AA, Ahmed AE, Jradi H. Health beliefs related to diabetes mellitus prevention among adolescents in Saudi Arabia. Sultan Qaboos Univ Med J. 2015;15(3):e398. doi:10.18295/squmj.2015.15.03.015
11. Choi SE, Liu M, Palaniappan LP, Wang EJ, Wong ND. Gender and ethnic differences in the prevalence of type 2 diabetes among Asian subgroups in California. J Diabetes Complications. 2013;27(5):429–435. doi:10.1016/j.jdiacomp.2013.01.002
12. Wimalawansa SJ. Associations of vitamin D with insulin resistance, obesity, type 2 diabetes, and metabolic syndrome. J Steroid Biochem Mol Biol. 2018;175:177–189. doi:10.1016/j.jsbmb.2016.09.017
13. Haq A, Wimalawansa SJ, Pludowski P, Al Anouti F. Clinical practice guidelines for vitamin D in the United Arab Emirates. J Steroid Biochem Mol Biol. 2018;175:4–11. doi:10.1016/j.jsbmb.2016.09.021
14. Mostafa WZ, Hegazy RA. Vitamin D and the skin: focus on a complex relationship: a review. J Adv Res. 2015;6(6):793–804. doi:10.1016/j.jare.2014.01.011
15. Lips P, Eekhoff M, van Schoor N, et al. Vitamin D and type 2 diabetes. J Steroid Biochem Mol Biol. 2017;173:280–285. doi:10.1016/j.jsbmb.2016.11.021
16. Bland R, Markovic D, Hills CE, et al. Expression of 25-hydroxyvitamin D3-1α-hydroxylase in pancreatic islets. J Steroid Biochem Mol Biol. 2004;89:121–125. doi:10.1016/j.jsbmb.2004.03.115
17. Sung -C-C, Liao M-T, Lu K-C, Wu -C-C. Role of vitamin D in insulin resistance. J Biomed Biotechnol. 2012;2012:1–11. doi:10.1155/2012/634195
18. Dabbour I, Jazar A, Azzeh F. Vitamin D status in patients with type 2 diabetes mellitus in Makkah region of Saudi Arabia. Pak J Nutr. 2016;15(3):203. doi:10.3923/pjn.2016.203.210
19. Nikooyeh B, Neyestani TR, Farvid M, et al. Daily consumption of vitamin D–or vitamin D+ calcium–fortified yogurt drink improved glycemic control in patients with type 2 diabetes: a randomized clinical trial. Am J Clin Nutr. 2011;93(4):764–771. doi:10.3945/ajcn.110.007336
20. Bani-Issa W, Eldeirawi K, Harfil S, Fakhry R. Vitamin D deficiency and its determinants in adults: a sample from community-based settings in the United Arab Emirates. Int J Endocrinol. 2017;2017:1–7. doi:10.1155/2017/3906306
21. Chakhtoura M, Rahme M, Chamoun N, Fuleihan GE-H. Vitamin D in the Middle East and North Africa. Bone Rep. 2018;8:135–146. doi:10.1016/j.bonr.2018.03.004
22. AlFaris NA, AlKehayez NM, AlMushawah FI, AlNaeem AN, AlAmri ND, AlMudawah ES. Vitamin D deficiency and associated risk factors in women from Riyadh, Saudi Arabia. Sci Rep. 2019;9(1):1–8. doi:10.1038/s41598-019-56830-z
23. Bachali S, Dasu K, Ramalingam K, Naidu J. Vitamin d deficiency and insulin resistance in normal and type 2 diabetes subjects. Indian J Clin Biochem. 2013;28(1):74–78. doi:10.1007/s12291-012-0239-2
24. Benetti E, Mastrocola R, Chiazza F, et al. Effects of vitamin D on insulin resistance and myosteatosis in diet-induced obese mice. PLoS One. 2018;13(1):e0189707. doi:10.1371/journal.pone.0189707
25. Talaei A, Mohamadi M, Adgi Z. The effect of vitamin D on insulin resistance in patients with type 2 diabetes. Diabetol Metab Syndr. 2013;5:8. doi:10.1186/1758-5996-5-8
26. Heaney RP, French CB, Nguyen S, et al. A novel approach localizes the association of vitamin D status with insulin resistance to one region of the 25-hydroxyvitamin D continuum. Adv Nutr. 2013;4(3):303–310. doi:10.3945/an.113.003731
27. Tiptaradol S, Aekplakorn W. Prevalence, awareness, treatment and control of coexistence of diabetes and hypertension in Thai population. Int J Hypertens. 2012;2012:1–7. doi:10.1155/2012/386453
28. Mancusi C, Izzo R, di Gioia G, Losi MA, Barbato E, Morisco C. Insulin resistance the hinge between hypertension and type 2 diabetes. High Blood Pressure Cardiovasc Prev. 2020;27(6):515–26.
29. Handel AE, Sandve GK, Disanto G, et al. Vitamin D receptor ChIP-seq in primary CD4+ cells: relationship to serum 25-hydroxyvitamin D levels and autoimmune disease. BMC Med. 2013;11(1):1–11. doi:10.1186/1741-7015-11-163
30. Mehta V, Agarwal S. Does vitamin D deficiency lead to hypertension? Cureus. 2017;9(2):e1038.
31. Pludowski P, Holick MF, Grant WB, et al. Vitamin D supplementation guidelines. J Steroid Biochem Mol Biol. 2018;175:125–135. doi:10.1016/j.jsbmb.2017.01.021
32. Juonala M, Voipio A, Pahkala K, et al. Childhood 25-OH vitamin D levels and carotid intima-media thickness in adulthood: the cardiovascular risk in young Finns study. J Clin Endocrinol Metab. 2015;100(4):1469–1476. doi:10.1210/jc.2014-3944
33. Xia Z, Hu Y, Han Z, et al. Association of vitamin D receptor gene polymorphisms with diabetic dyslipidemia in the elderly male population in North China. Clin Interv Aging. 2017;12:1673. doi:10.2147/CIA.S145700
34. Gehan AT, Waleed MF, Azza M, Gehan AT, Tawfeek M, Ahmed R. Vitamin D receptor gene polymorphisms and vitamin D levels in Egyptian patients with diabetic nephropathy and type 2 diabetes mellitusus. Med J Cairo Univ. 2018;86:195–205. doi:10.21608/mjcu.2018.55077
35. Alkhedaide A, Mergani A, Aldhahrani A, et al. Association of vitamin D receptor gene polymorphisms with type 2 diabetes mellitus in Taif population: a case-control study. Braz J Biol. 2021;84:e250739.
36. Lucato P, Solmi M, Maggi S, et al. Low vitamin D levels increase the risk of type 2 diabetes in older adults: a systematic review and meta-analysis. Maturitas. 2017;100:8–15. doi:10.1016/j.maturitas.2017.02.016
37. Alkadi H.Vitamin D. Vitamin D status in Saudi women with type 2 diabetes mellitus: a case-control study.International Journal of Recent Advances in Multidisciplinary Research.2014;01(03):033-036.
38. Krul-Poel YH, Westra S, ten Boekel E, et al. Effect of vitamin D supplementation on glycemic control in patients with type 2 diabetes (SUNNY trial): a randomized placebo-controlled trial. Diabetes Care. 2015;38(8):1420–1426. doi:10.2337/dc15-0323
 © 2022 The Author(s). This work is published and licensed by Dove Medical Press Limited. The full terms of this license are available at https://www.dovepress.com/terms.php and incorporate the Creative Commons Attribution - Non Commercial (unported, v3.0) License.
By accessing the work you hereby accept the Terms. Non-commercial uses of the work are permitted without any further permission from Dove Medical Press Limited, provided the work is properly attributed. For permission for commercial use of this work, please see paragraphs 4.2 and 5 of our Terms.
© 2022 The Author(s). This work is published and licensed by Dove Medical Press Limited. The full terms of this license are available at https://www.dovepress.com/terms.php and incorporate the Creative Commons Attribution - Non Commercial (unported, v3.0) License.
By accessing the work you hereby accept the Terms. Non-commercial uses of the work are permitted without any further permission from Dove Medical Press Limited, provided the work is properly attributed. For permission for commercial use of this work, please see paragraphs 4.2 and 5 of our Terms.