")
Back to Journals » Integrated Blood Pressure Control » Volume 14
Prevalence of Hypertension and Its Associated Factors Among Adults in Areka Town, Wolaita Zone, Southern Ethiopia
Authors Anjulo U, Haile D , Wolde A
Received 3 December 2020
Accepted for publication 2 March 2021
Published 16 March 2021 Volume 2021:14 Pages 43—54
DOI https://doi.org/10.2147/IBPC.S295574
Checked for plagiarism Yes
Review by Single anonymous peer review
Peer reviewer comments 2
Editor who approved publication: Dr Konstantinos Tziomalos
Ufaysa Anjulo,1 Dereje Haile,2 Anbessaw Wolde1
1Wolaita Zone Health Department, Sodo, Southern Ethiopia; 2Reproductive Health and Nutrition Department, School of Public Health, College of Medicine and Health Science, Wolaita Sodo University, Sodo, Southern Ethiopia
Correspondence: Dereje Haile Email [email protected]
Background: Hypertension is an emerging public health problem in many low- and middle-income countries including Ethiopia. However, there are limited studies and data are scarce in these countries, particularly in Ethiopia. Thus, the aim of this study was to assess the prevalence of hypertension and its associated factors in this study area.
Methods: A community-based cross-sectional study was conducted in Areka town. Multi-stage sampling technique was used to select 581 adults. Information on socio-demographic data, behavioral and dietary habits, and family history of hypertension were collected using face-to-face interview. Measurements of weight, height, and blood pressure were taken using digital weighing scale, Stadio-meter, and digital sphygmomanometer respectively. Data were entered and cleaned in Epi-Data version 3.1, and exported to SPSS version 20 for analysis. Binary logistic regressions were done and odds ratios with 95% confidence intervals were calculated to identify associated factors.
Results: The overall prevalence of hypertension among the study participants was 19.1% (95% CI: 15.9– 22.4). Out of these, more than half (57.3%) of the cases were newly screened for hypertension. In a multivariate logistic regression analysis; history of perceived childhood obesity (AOR:2.8 (95% CI:1.6,5.1)), age 55 years and above (AOR=8.90, 95% CI: 3.77– 21.02), family history of hypertension (AOR= 2.57, 95% CI: 1.17– 5.64), fatty meat intake (AOR=1.96, 95% CI: 1.05– 3.65), eating vegetables less than two days per week (AOR=2.81, 95% CI: 1.24– 6.37) and being obese (AOR=11.59, 95% CI: 4.7– 27.62) were associated factors of developing hypertension.
Conclusion: The study revealed that the prevalence was found to be high among adults indicating the hidden burden of the problem in the area. Therefore, the health systems need to develop strategies for community-based screening, strategies that focus on life cycle-based approach because childhood and adolescence are crucial times for the prevention of NCDs including hypertension. Health education on eating behavior and life style modifications to maintain normal body weight are recommended.
Keywords: hypertension, prevalence, associated factors, Areka, Ethiopia
Background
The global burden and threat of non-communicable diseases constitute a major public health challenge that undermines social and economic development throughout the world.1 Even though non-communicable diseases predominantly exist in high-income countries, there is a rising epidemic of it in Sub-Saharan Africa (SSA), that includes cardiovascular disease (CVD) such as hypertension, cancer and metabolic diseases like diabetes and obesity.2 Hypertension, diabetes mellitus (DM), ischemic heart disease, and heart failure are of particular concern.3 Hypertension is defined as a persistent elevation of arterial blood pressure with systolic blood pressure (SBP) of 140 mm Hg or greater and/or a diastolic blood pressure (DBP) of 90 mm Hg or greater.4,5
Globally, hypertension is a major public health problem and a leading modifiable risk factor for cardiovascular disease (CVD) and death.6,7 Hypertension has become a major public health problem, being already established in high-income countries, and also emerging in many low- and middle-income countries (LMICs) experiencing an epidemiological transition from communicable to non-communicable chronic diseases.4 The WHO’s 2012 report highlighted the growing burden of non-communicable diseases such as hypertension and others worldwide.
The global prevalence of hypertension is approximately 30% among adults. In developed countries, the prevalence is beginning to stabilize or decrease, while in the developing regions proportions continue to rise between 20–50%.8
According to the WHO’s recent estimation of the prevalence of rising blood pressure in Africa, the prevalence of hypertension was 33.7% in men and 33.2% in women in Ethiopia, but there are few studies concerning hypertension.9
This rising prevalence of hypertension in low- and middle-income countries is due to different risk factors. Mass migration from rural to urban areas and lifestyle changes associated with civilization may explain the apparently rising prevalence of hypertension in urban populations.10 Increasing rates of hypertension and other cardiovascular diseases represent an emerging public health problem in LMICs. It happens as populations become older, urbanized, and lifestyle changes favor sedentary habits, physical inactivity, obesity, increasing alcohol consumption and salt intake, and others.4
Worldwide, despite the high prevalence of hypertension and its consequences, awareness, treatment, and control of hypertension is extremely low in these countries.11 The detection rate of hypertension varies across the globe. It was higher in developed countries while it is lower in low and middle income countries. The detection rates in most high-income countries range from 32%–64%, while in many low-income countries, the reported detection rates are significantly lower.12 The prevention and control of hypertension have not received due attention in many developing countries, although it is one of the most modifiable risk factors for cardiovascular diseases.
Nowadays, there is a universal WHO sustainable development goal (3 target 3.4) which aims to reduce, by 2030, non-communicable disease, including, hypertension, by one third through prevention and treatment, and promote mental health and well being.13 Moreover, the Ethiopian government has initiatives in the plan of HSTP which focus on prevention and control of hypertension.14
Evidence on prevalence and factors that affect hypertension among adults is not limited in Ethiopia. However, research on hypertension among adults, particularly assessing the history of childhood obesity as variable is limited, even though it may provide important input to design policy and strategy aimed at preventing and controlling adulthood hypertension.
Moreover, assessing the prevalence and risk factors of hypertension has important public health implications in this study area where the lifestyle of the population is changing rapidly. It is therefore imperative that data on hypertension are determined so that stakeholders can design tailored interventions focused on community-specific nutritional and behavioral practices aimed at effectively addressing hypertension.
Methods and Materials
Study Setting and Period
The study was conducted in Wolaita zone, particularly in Areka town. The town is located at 7.04°-7.1° latitude north and 37.68°-37.72° longitude east. It is at a distance of 300 Km from Addis Ababa along Addis Ababa-Hosanna-Wolaita Sodo road and 197 Km southwest from the regional capital Hawassa and 29 Km North West from Wolaita Sodo, the capital city of Wolaita zone. The town is located at an altitude of 1774 m above sea level.15
The town has four kebeles, with a total area of 3256 hectares. The total population of the town is 58,030; which comprises 29,189 males, 28,841 females, and about 21,123 (36.4%, according to 2014 Mini DHS estimate) were adults with age ≥25 years. In the Areka town, there were one governmental health center, one NGO hospital, and 6 private clinics providing services to the community according to the town health office information. A community-based cross-sectional study was conducted from February 18 to March 16, 2019.
Population
All adult men and women of Areka town with age 25 and above were considered as source population. All randomly selected adult men and women of Areka town aged 25 and above were considered as the study population.
Sample Size Determination
The sample size was calculated by using the single population proportion formula with an assumption of hypertension prevalence (proportion) of 22.4% taken from the study done in Durame town, Southern Ethiopia,16 and confidence interval 95% (Z α/2=1.96), the power of the test 80% and margin of error 5%, design effect of 2.0, and by adding 10% non-response rate, the final sample size was 581.
Sampling Procedure
Respondents were selected by a multi-stage sampling technique. All kebeles in the town were included in the study. There are 255 Gots in these four kebeles. Of these 52 Gots (14 from 01 kebele, 15 from 02 kebele, 11 from 03 kebele and 12 from kebele 04) were selected by simple random sampling method. After proportional to Got’s size allocation, systematic sampling method was applied to select households. The sampling interval was calculated by dividing the total households in the selected study Gots by the final sample size, which was every fourth household. Then, the first households were selected from each Got by spinning a pen, where the tip of the pen was pointed. Finally, one individual was selected out of eligible adults in each household using the lottery method.
Eligibility Criteria
Inclusion criteria: all adults in the households who were 25 years old and above who lives permanently (lived for at least six months) in the study area.
Exclusion criteria: adults with known normal physiology like pregnancy, and gross anatomical deformities of the arms were excluded from the study.
Data Collection Procedure
Data collection instruments: on selected socio-demographic, dietary and behavioral factors, data were collected using an interviewer administered questionnaire adopted and modified from WHO STEP wise approach to socio-demographic profile of the study participants, behavioral measurements and physical measurements to chronic disease were applied.5,17 A Stadio-meter and digital weight scale were used for measurement of height and weight respectively. The standard digital mercury BP apparatus was used to measure blood pressure.
Recruitment of data collectors: data were collected by a total of eight research assistants who have a diploma in clinical nursing with previous experience to maintain uniformity. The data collection was supervised by two supervisors (health officers with B.Sc), proficient in the local language.
Height, Weight, and BP Measurements
Weight and height were measured with subjects standing, wearing slippers and light clothes.
Weight was measured using a well-calibrated digital weight scale.
Height was measured using portable Stadio-meter, which consisted of an anthropometer with a simple triangular headboard. In taking height, the adult was made to stand straight with his/her shoes off and head held erect such that the external auditory meatus and the lower border of the eye were in one horizontal plane (Frankfurt plane). Height was recorded to the nearest 0.1 cm, and weight to the nearest 100 gm.
Blood pressure was measured by using a standard digital sphygmomanometer on upper arm in a sitting position with back support after the study respondent rested for at least 5 minutes. The measurement was taken with adult cuff of appropriate bladder size; the cuff was placed on upper arm, so that the lower edge was at least 1 inch (2.5 cm) above the elbow crease and the bladder was centered over the brachial artery. The arm was bare and supported with the ante-cubital fossa at heart level, because a lower position will result in erroneously higher systolic and diastolic blood pressure measurements. A measurement was made after ensuring that the respondent had not been doing vigorous work and exercise, avoided smoking and intake of caffeine and alcohol during the last 30 minutes, otherwise BP measurement was postponed for 30 minutes. The respondent was also told to sit relaxed without crossing legs and to stop talking. Two consecutive measurements were taken on the left arm with the respondent in the same position with an interval of at least 20 minutes. The mean systolic and diastolic blood pressures were determined from the two measurements and recorded.
Measurements
Hypertension: a subject was considered as hypertensive if the blood pressure was ≥140 mm Hg systolic and/or ≥90 mm Hg diastolic after two measurements were taken; the average of the two was determined and/or self-reported use of drug treatment for hypertension irrespective of measured blood pressure. Isolated diastolic hypertension (IDH), having a systolic blood pressure 90–139 mmHg and diastolic blood pressure ≥90 mm Hg and isolated systolic hypertension (ISH), having a systolic blood pressure ≥140 mm Hg and diastolic blood pressure 60–89 mmHg was also considered as hypertension.5,18
Excess alcohol intake: refers to the average consumption of more than 4 standard alcoholic drinks per day for men or >3 standard alcoholic drinks for women. A standard alcoholic drink is the equivalent of one bottle (330 mL) of regular beer (with 4.5% ethanol), one glass (100 mL) of wine (10% ethanol) or one cup (40 mL) of distilled spirits or local “Araqe/katikala” (40% ethanol) or two glasses (200 mL) of “Tella” (6% ethanol) or one and a half glasses (150 mL) of “Tadji” with 8% ethanol.19–21
Dietary intake: consuming less than 4–5 servings of one medium fruit and one cup of leafy vegetables per day, less than 2–3 servings of low fat dairy products per day, and more than 1–2 servings of animal fat (beef, eggs, chicken, butter, etc.) and highly processed foods (burgers, margarine, cookies, etc.) was considered as high calorie dietary intake or unhealthy diet.22
Body mass index (BMI): weight in kilograms divided by height in meters squared. Body mass index (BMI) was categorized as <18.5 Kg/m2 (underweight), 18.5–24.9 Kg/m2 (normal), 25–29.9 Kg/m2 (overweight), and ≥30 Kg/m2 (obese).23
Cigarette smoking: subjects who smoked at least 1 cigarette per day at the time of the study was classified as current smokers and those who smoked for at least three years in the past, but had stopped by the time of the study were classified as habitual smokers.24
Physical activity: level of physical activity was classified into vigorous and moderate. An activity that involves walking quickly, bicycling, swimming for recreation, dancing, or mowing a lawn for at least 30 minutes for at least 5 days per week was considered as moderate physical activity whereas an activity that involves running, fast cycling, construction work, digging, fast swimming or carrying/moving heavy loads greater than 20 kgs for at least 10 minutes continuously was considered as vigorous physical activity.25
Data Quality Assurance
Before data collection, the questionnaire was prepared in English and then translated into Amharic and again retranslated into English by language experts. Then, the data collectors and supervisors were trained for two days on filling in the questionnaire and “standardized” particularly on the proper use of the weight and height scales, and measurement of high blood pressure in order to minimize inter- and intra-observer errors. Two days before the actual study the questionnaire was pre-tested and validated in 5% of invited adult members of households in one Got other than the study Gots and some modifications were made based on the findings.
During the data collection period, the data collectors were closely supervised by two supervisors (health officers with B.Sc) proficient in the local language. Weighing scale was well-calibrated before measurement and a respondent was measured wearing light clothing. In taking height, the respondent adult stood up straight with his/her shoes off and head held erect. Blood pressure was measured by adult size digital BP apparatus on bare upper arm. Every day after data collection, a meeting was held to evaluate completeness of questionnaires to ensure all questions were properly answered, and were corrected by the principal investigator. Every day before field work; calibration of weighing scale was done and BP apparatus was checked for its functionality.
Data Management and Analysis
Data were edited manually and then entered into Epi-Data version 3.1 for data clearance, and exported into SPSS version 20 and analyzed. All continuous data were checked for normality using histogram and other visual tests. Univariate analysis was used to determine the frequencies. Bivariate analysis was applied to determine associations between the outcome and exposure variables. Multicollinearities were also checked among selected candidate variables for multivariate analysis by calculating variance inflation factor (VIF) and Tolerance test (1-R). A VIF of 10 and above or a Tolerance (1-R) of close to zero was a concern for multicollinearity. Independent variables having P-value less than 0.05 on bivariate analysis were candidates for multivariable analysis for further confounding effect control. Hosmer and Lemeshow goodness of fit test was used to assess the fitness of the model during multivariate analysis. With p-value of 0.22, the model had a good fit for the multivariate analysis and accepted. Both crude and adjusted odds ratio with 95% confidence interval were reported to measure the strength of association between exposure and outcome variables. The results of multiple logistic regression were considered statistically significant at P-value<0.05.
Ethical Considerations
The ethical clearance was obtained from the Ethical Review Committee of the College of Health Sciences and medicine, Wolaita Sodo University. The official letter of cooperation was written to Wolaita zone health department and Areka town health office for permission. Permission letter was obtained from Areka town administration health office for each kebele. The nature of the study was fully explained to the study participants and informed verbal and written consent were obtained from each respondent before the interview. They were told that documents would be kept confidential and that they had the right to refuse to participate totally at any time if they were not comfortable. Subjects who had high BP during data collection were counseled and advised to go to a health institution as soon as possible. We confirm that the study was conducted in accordance with the Declaration of Helsinki.
Results
Socio-Demographic and Economic Characteristics of the Respondents
A total of 576 adults with 99.2% response rate was included in this study. More than half, 335 (58.2%), were females. The median age was 33 years with an IQ of 15 years. More than half, 305 (53%), of the respondents held a higher education diploma and above followed by secondary education (grade 9–12): 109 (18.9%) (Table 1).
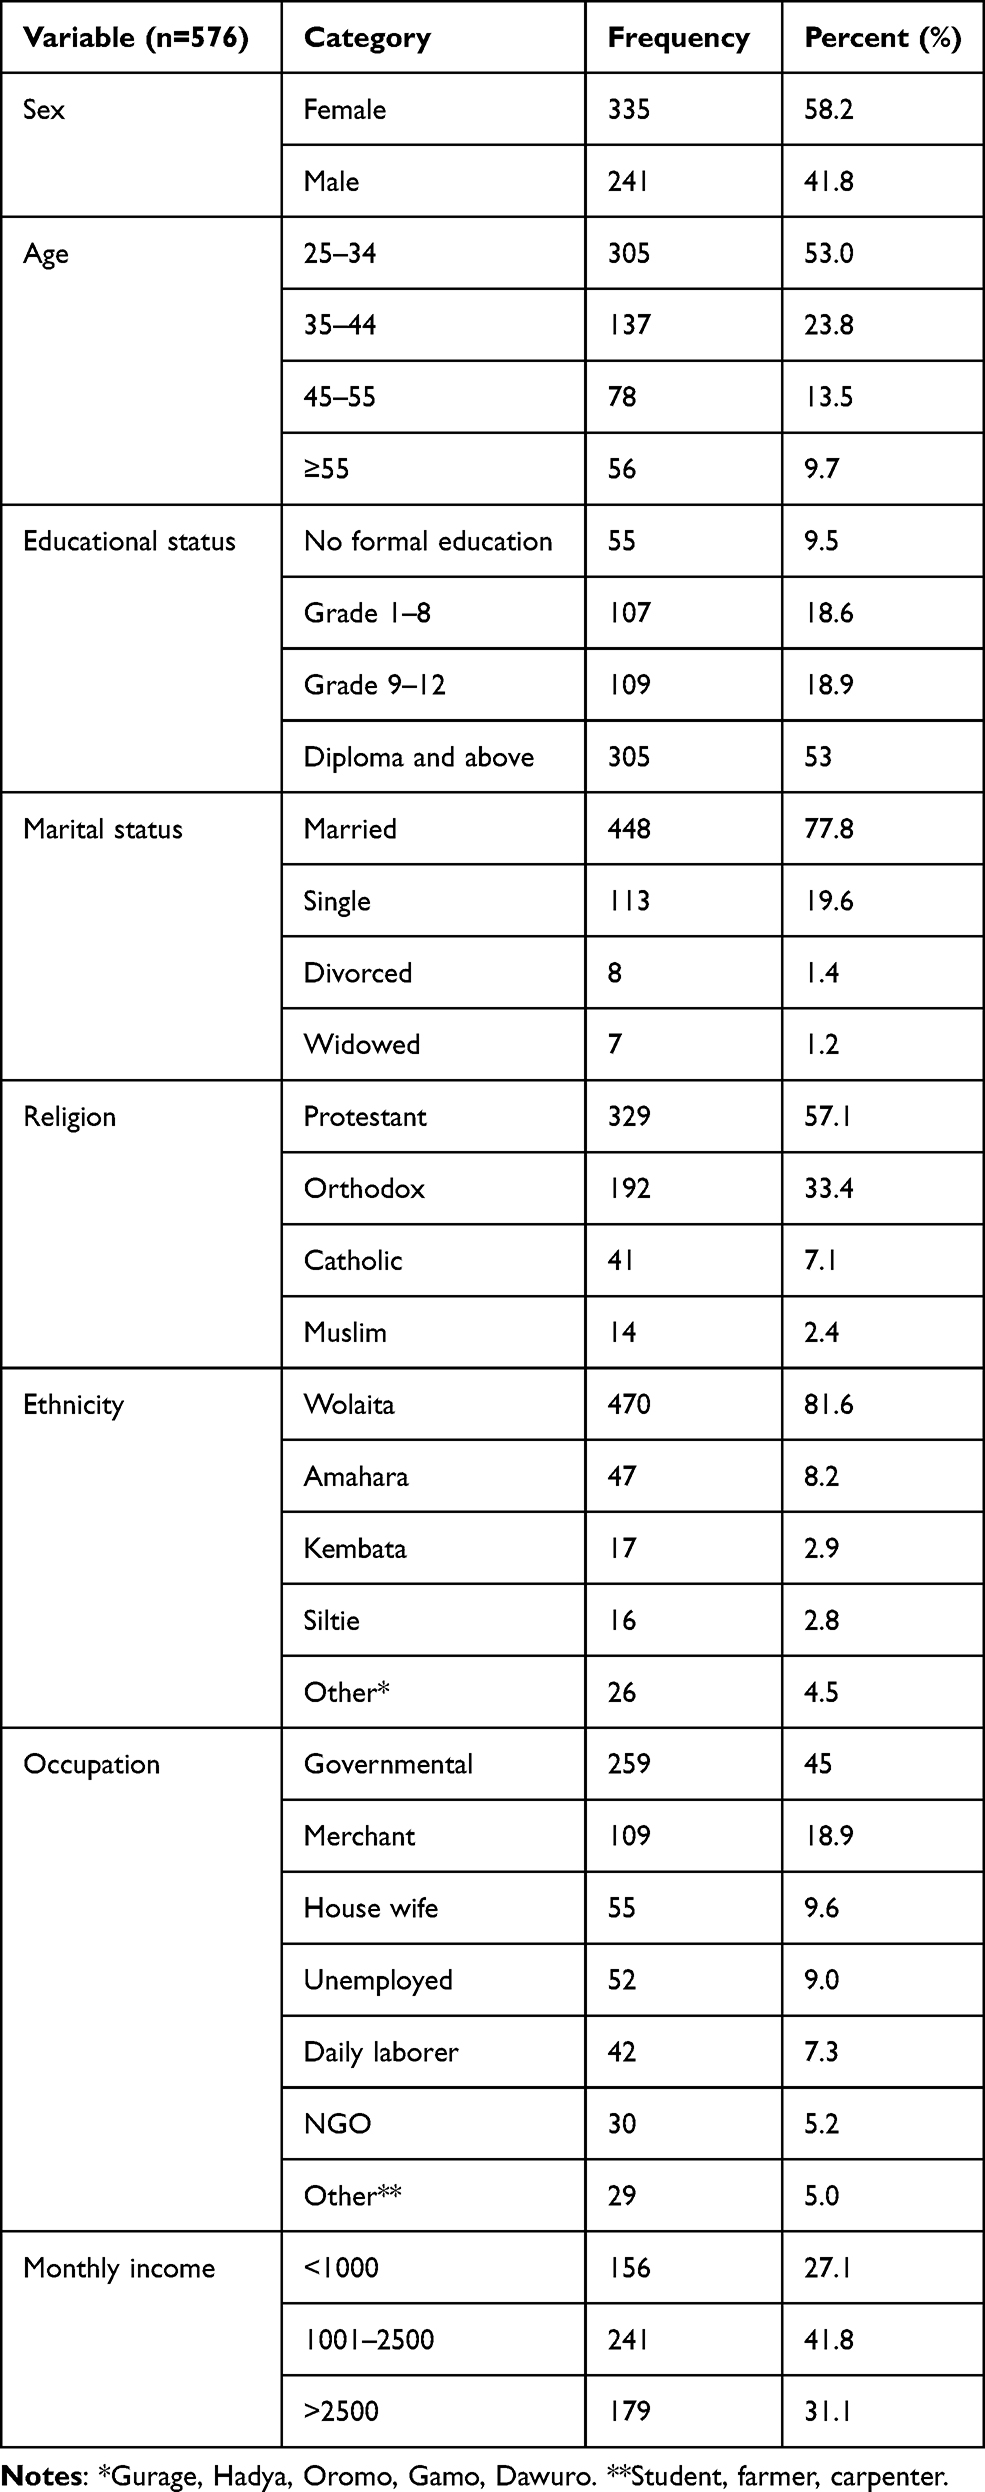 |
Table 1 Socio-Demographic Characteristics of the Respondents at Areka Town, Southern Ethiopia, 2019 |
Prevalence of Hypertension
The mean systolic and diastolic BP readings were 116.44 (SD ±16.96) and 75.37 (SD ±11.34) mmHg respectively. The overall prevalence of hypertension was 19.1% (95% CI: 15.9–22.4) (Table 2). The sex-specific prevalence of hypertension was slightly higher among males 19.5% (95% CI: 14.5–25.5) compared to females, which was 18.8% (95% CI: 14.6–23.0). Among hypertensive cases, more than half, 63 (57.3%), of them were newly screened; who did not know that they had hypertension (Table 3).
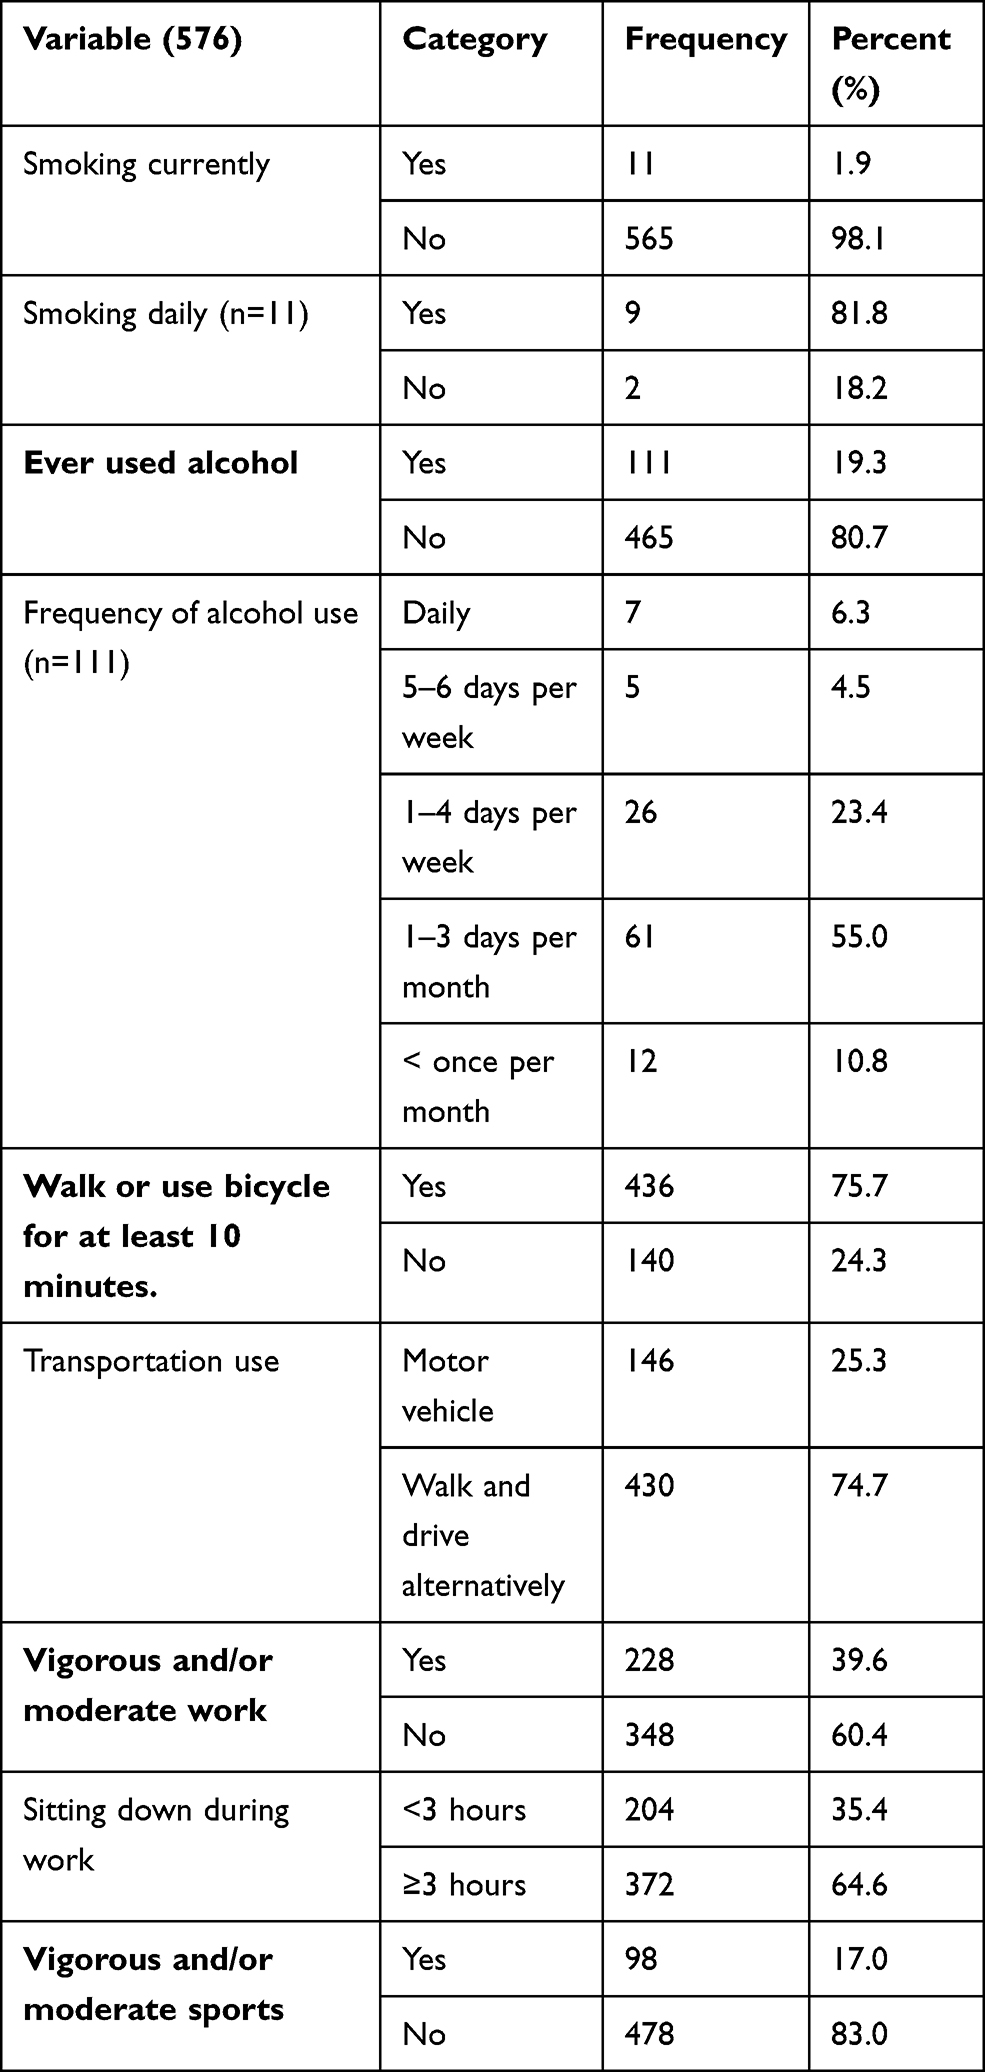 |
Table 2 Lifestyles Among Study Subjects in Areka Town, Southern Ethiopia, 2019 |
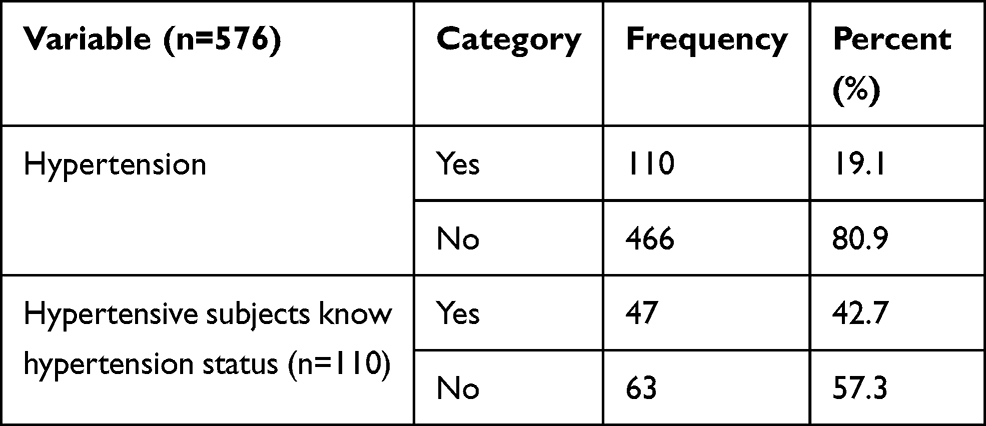 |
Table 3 Hypertension Among Study Subjects in Areka Town, Southern Ethiopia, 2019 |
Behavioral and Dietary Practices
Regarding cigarette smoking, 11 (1.9%) respondents were smokers at the time of the survey and of these 9 (81.8%) smoked on a daily basis. One hundred and eleven (19.3%) of the respondents had consumed alcohol at least once. However, of these respondents more than half, 61 (55.0%), were drinking alcohol one to three days per month and 7 (6.3%) drank alcohol on a daily basis (Table 2).
More than half, 313 (54.3%), of the respondents consumed fatty meats at least once per week. Of these, 8 (2.6%) had it more than two days per week. Thirty two (5.6%) of the respondents ate highly processed foods and of them 29 (90.6%) consumed it one to two days per week. Nearly two thirds, 375 (65.1%), used egg products and of them, 58 (15.5%) consumed it more than two days per week (Table 4).
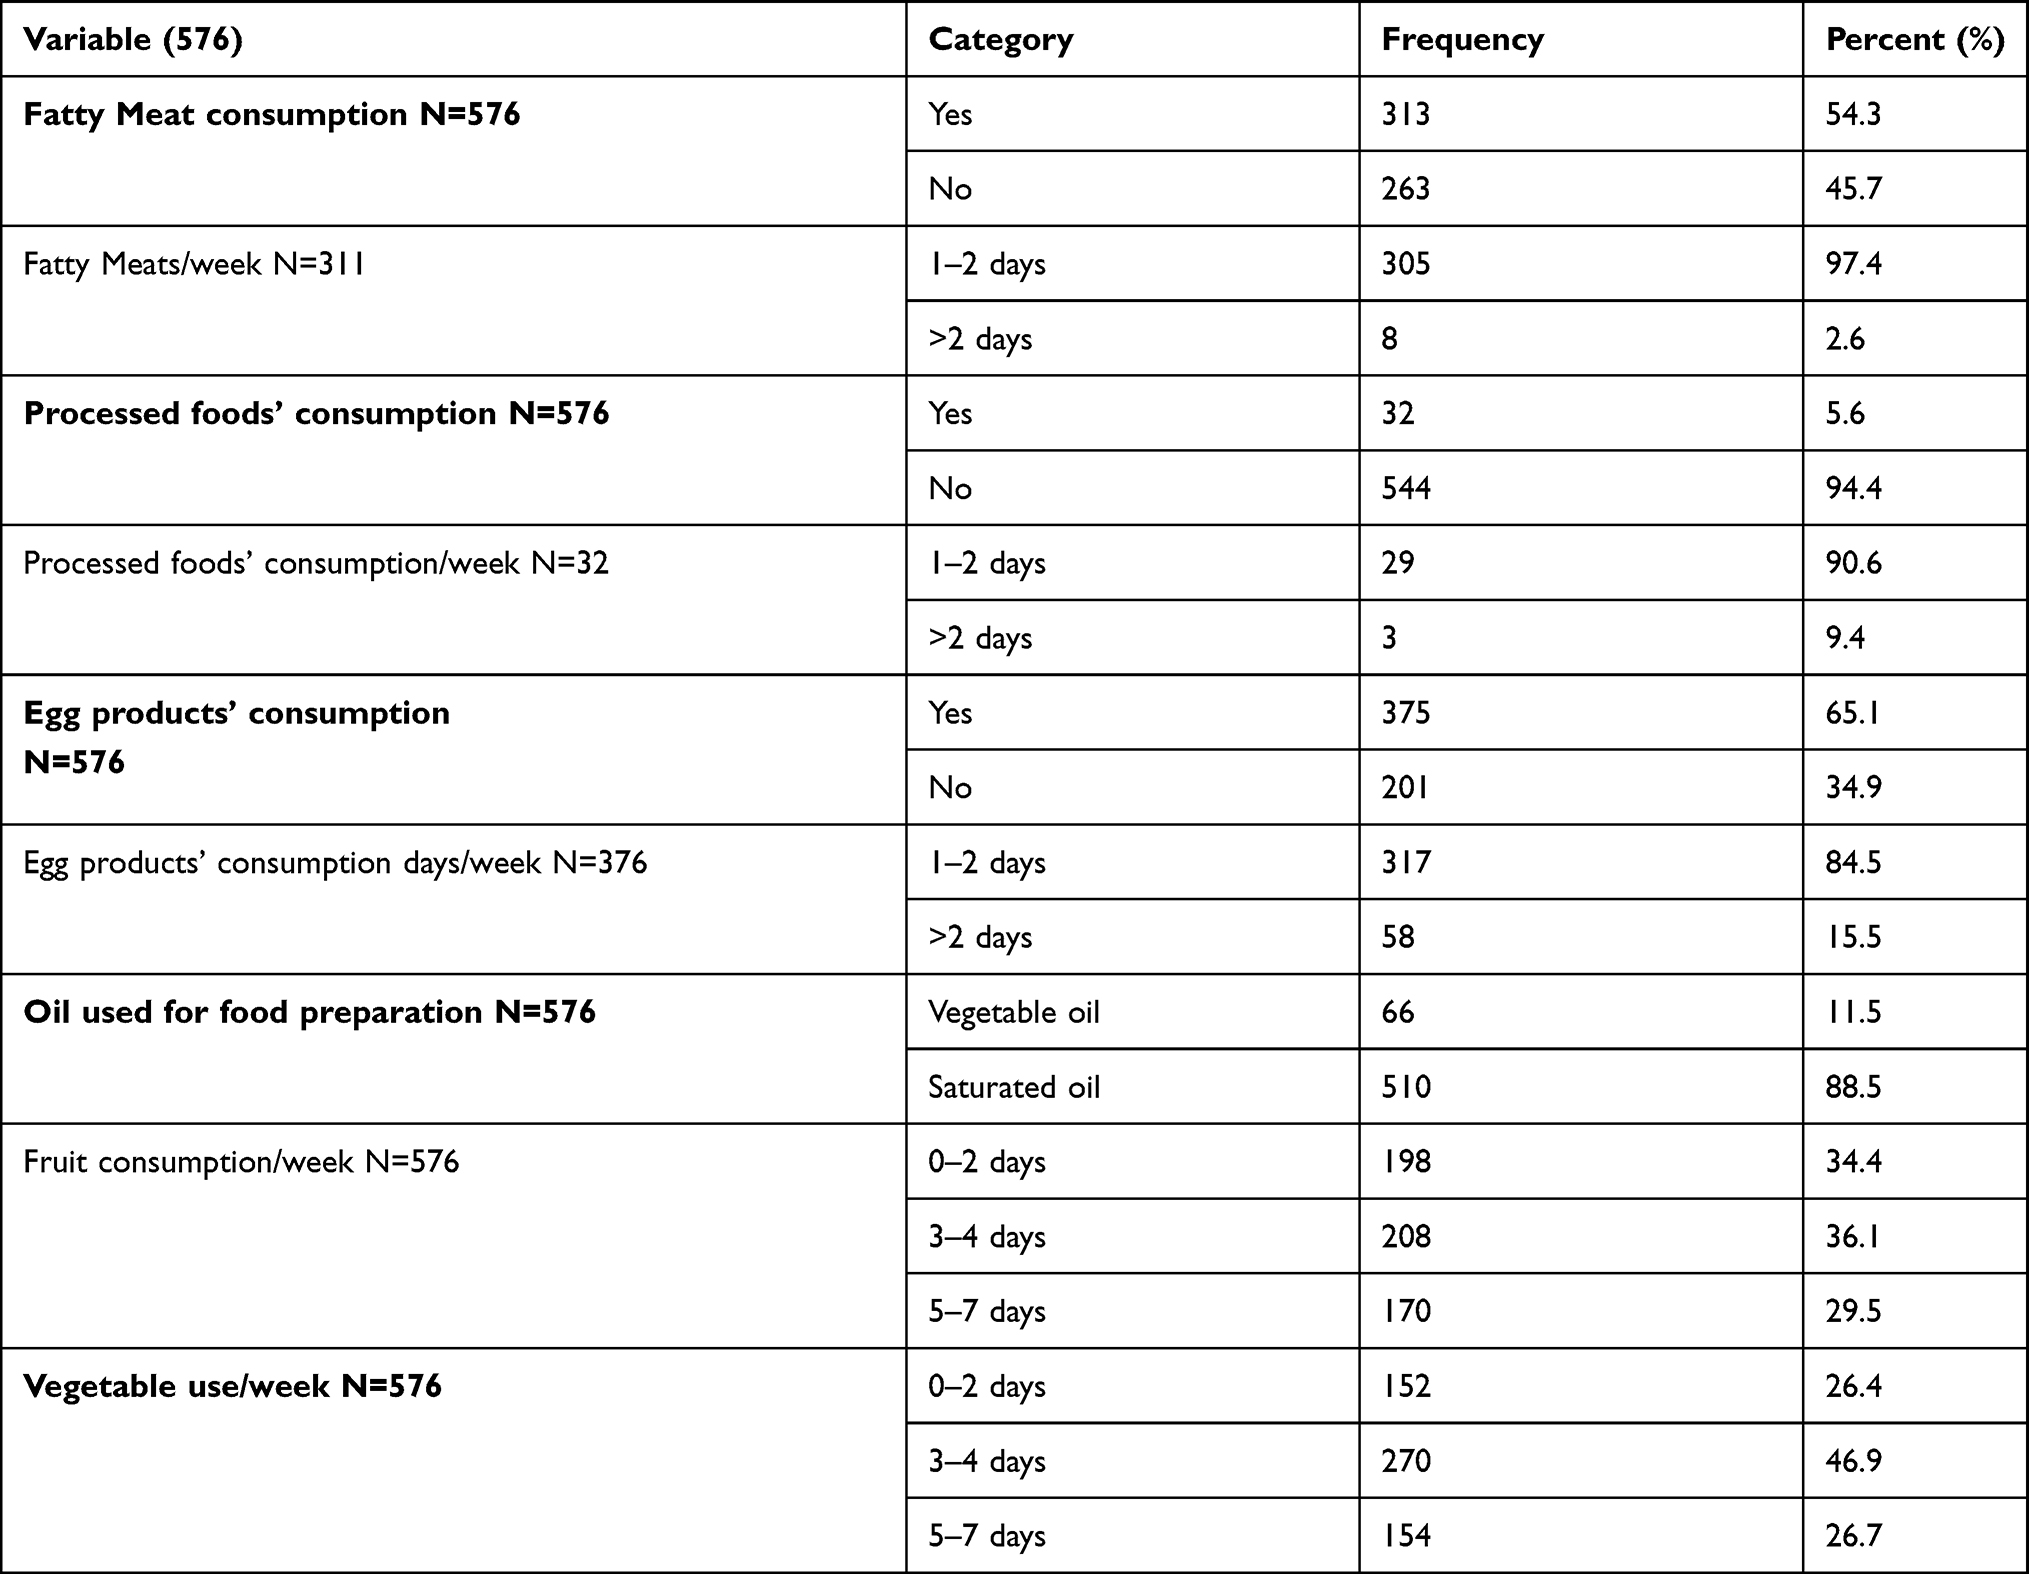 |
Table 4 Dietary Factors Among Study Subjects in Areka Town, Southern Ethiopia, 2019 |
Medical and Genetic Factors
Majority, 516 (89.6%), of the respondents said that there was nothing that caused them stress, 22 (3.8%) reported that they had diabetes mellitus. Fifty two (9.0%) of the respondents had a family history of hypertension. However, only 64 (11.1%) had a history of perceived childhood obesity (Table 5).
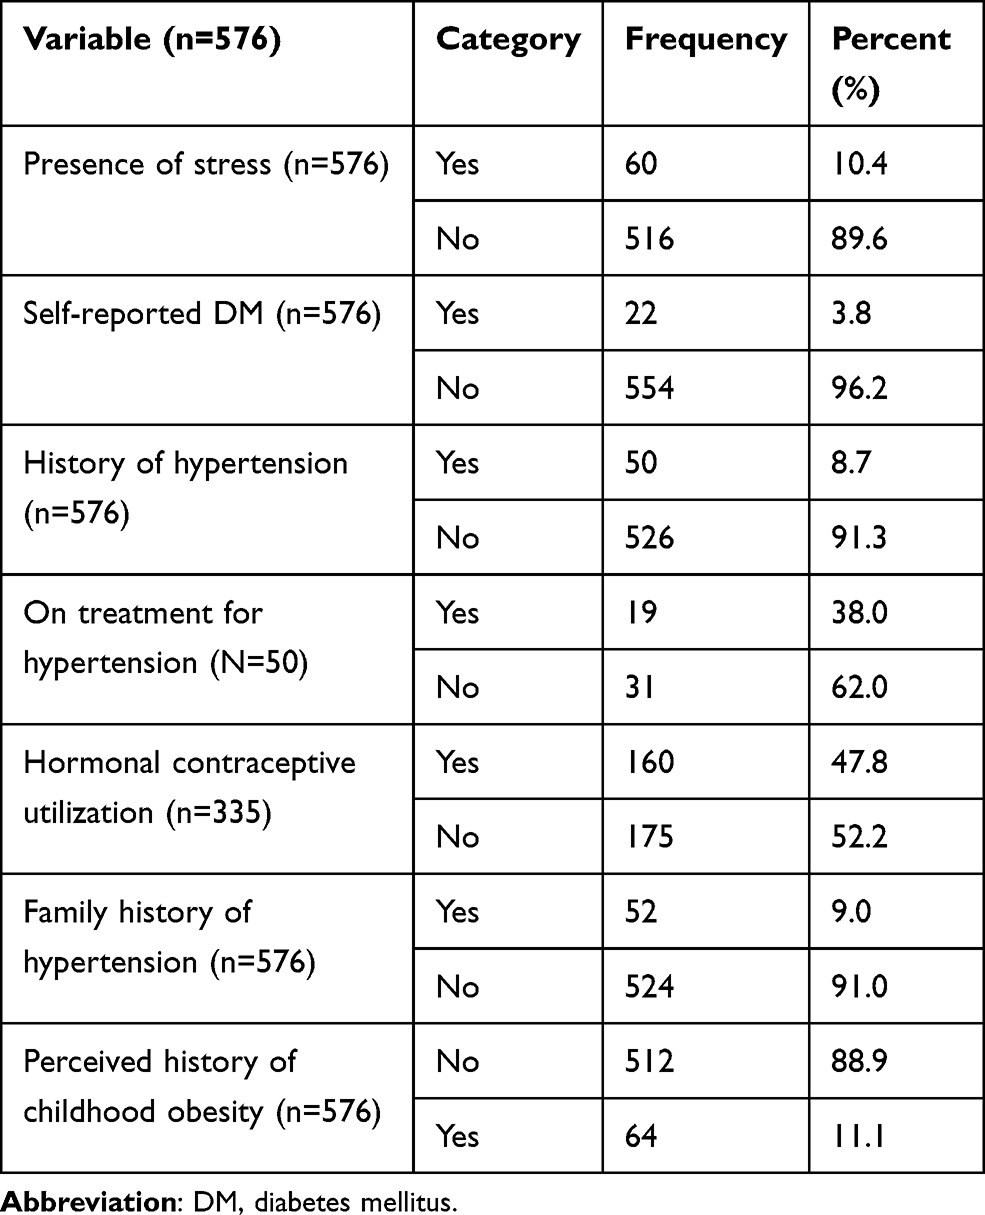 |
Table 5 Medical and Genetic Factors Among Study Subjects in Areka Town, Southern Ethiopia, 2019 |
Body Mass Index (BMI)
Body mass index was computed from weight and height, and categorized as underweight, normal, overweight, and obese. Majority, 331 (57.5%), of the participants had a normal body mass index. Nearly 40% were overweight and above.
Factors Associated with Hypertension
Different factors were assessed for significant association with hypertension in bivariate analyses. Among these factors, age, ethnicity, self-reported diabetes mellitus and family history of hypertension, history of perceived childhood obesity, marital status, monthly income, alcohol use, high calorie fatty meat consumption, low fruit and vegetable consumption, sitting down while working, and being overweight/obese were risk factors significantly associated with the outcome variable.
In multivariable logistic regression analysis; age, fatty meat consumption, history of perceived childhood obesity, lower vegetable intake, family history of hypertension, and being overweight/obese were significantly associated factors for developing hypertension.
The likelihood of developing hypertension increased with advancing age. Study participants aged 55 years and above were 9 times more likely to develop hypertension as compared to those aged 25–34 years old (AOR of 8.9 (95% CI: 3.77–21.02)). Study participants with a family history of hypertension were 2.57 times (AOR= 2.57, 95% CI: 1.17–5.64) at increased risk to be hypertensive compared to their counterparts.
The odds of having hypertension were 2.8 times higher for those study participants who reported having of history of perceived childhood obesity when compared to their counterparts (AOR:2.8 (95% CI:1.6,5.1)).
High calorie, fatty meat consumption, lower vegetable eating habit, and higher body mass index were factors significantly associated with developing hypertension. If the participants of the study consumed high calorie, fatty meat at least once per week, then they were nearly two times (AOR=1.96, 95% CI: 1.05–3.65) more likely to be hypertensive than their counterparts.
Study participants who ate vegetables less than two days per week were aboutthree times (AOR=2.81, 95% CI: 1.24–6.37) more likely to be hypertensive than those who eat it on a daily basis. Those who were obese were 11.59 times (AOR=11.59, 95% CI: 4.7–27.62) more likely to develop hypertension compared to those with BMI<25 Kg/m2. Risky behaviors like smoking and alcohol use were not significantly associated with hypertension in this particular study (Table 6).
 |
Table 6 Multivariate Logistic Regression Analysis of Factors Associated with Hypertension in Areka Town, Southern Ethiopia, 2019 (n=576) |
Discussion
The overall prevalence of hypertension in this study was 19.1%. The sex-specific prevalence of hypertension was higher among males, 19.5%, compared to within females, 18.8%. Older age and family history of hypertension were non-modifiable risk factors which were significantly associated with hypertension in this study. High calorie, fatty meat consumption, lower daily vegetable intake per week, history of perceived childhood obesity, and BMI≥25 Kg/m2 were among modifiable risk factors assessed in this study.
The prevalence in this study was comparable with studies done in Durame town, 22.4% of SNNPR, and Humera and Mekelle towns of northern Ethiopia, 18.1%.16,26 And it was again in line with a systematic review and meta-analysis of prevalence of hypertension in Ethiopia, 19.6%.27 This finding was lower than that of the study conducted in Gondar city, 28.3%, Bahir Dar city, 25.1%, and federal civil service minister of Ethiopia, 27.3%.28–30 This discrepancy was explained by the fact that those studies included participants aged above thirty years, and were conducted in large cities with high availability of sugar-rich foods. The prevalence was also much lower than in the study conducted in Nepal, 44.7%, and in Delhi city of Jilin province in China, 41.0%.31,32 This difference could be due to genetic differences and living standards of the populations.
In this study, history of perceived childhood obesity was significantly associated with adulthood hypertension. This finding agrees with the review of literature where the risk of adult obesity was at least twice as high for obese children as for non-obese children.33 Moreover, adults who had been obese as children may have an even greater prevalence of risk factors for hypertension compared with those who had normal weight as children.34 Furthermore, this finding is supported by systematic reviews showing that childhood obesity is significantly and positively associated with adult SBP.35,36 This suggested that childhood obesity may be a risk factor for adulthood hypertension. This finding implies that the policy makers and government should pay attention to life cycle approach in order to prevent adulthood hypertension because childhood and adolescence period are crucial times for prevention of non-communicable disease (NCD) including hypertension.37
Age 55 years and above was found to be a risk factor for hypertension. Similarly, studies conducted in Dabat and Gondar in northern Ethiopia, federal civil service minister workers of Ethiopia and Mekelle city, showed a significant association between age and hypertension, in which the risk of hypertension increased with older age.6,28,38 This finding is also in line with community-based studies conducted in Kenya and Turkey.39,40 This is due to the fact that the biological effects of increased arterial resistance due to arterial thickening coincide with older age.
According to this study, family history of hypertension was identified as another risk factor for hypertension. This finding was supported by the study done in Durame town of southern Ethiopia and Gondar town, North West Ethiopia.16,29 Similarly, it was in line with community-based studies in Delhi City of Jilin Province in China and Afyonkarahisar region of Turkey.32,39 This is explained by the fact that family members may experience the same lifestyle and inherit genetic factors.
This study also found that consumption of vegetables less than two days per week compared to consuming it on a daily basis was associated with being hypertensive. This was compared with a similar study done in Durame town of southern Ethiopia and Nepal.16,31 This could be explained by the fact that there is a high concentration of fat and cholesterol in animal products compared to vegetables. Vegetables consist of potassium, dietary fiber, and other anti-oxidants that modulate cholesterol levels and reduce atherosclerosis. Thus, consuming vegetable less regularly; and having a high intake of high calorie fatty foods most days may result in intravascular cholesterol level increments that finally end-up as hypertension. This finding implies that the government should work hard on health education availability, and behavioral change communication sessions at health facilities and community through health extension workers and mass media regarding the risk of consuming foods enriched with cholesterol and less frequent consumption of vegetables. Moreover, the concerned bodies should avail The implication of this finding might be the policy makers should focus on implementation of nutrition security besides life style modification.37
Being overweight and obese were significantly associated with hypertension compared to BMI less than twenty five in this study. This finding was comparable with similar studies conducted in Dabat district and Gondar city in northwestern Ethiopia and Mekelle city.6,38 This is also in line with similar studies of Kenya and Jalalabad city, Afghanistan.8,40 This might be due to fast growing urbanization and industrialization associated with changes in dietary habits and reduced physical activity that lead to unbalanced energy gain and results in high prevalence of overweight/obesity, indicating fat accumulation. This overweight/obesity with excess body fat accumulation and cholesterol level eventually results in the increased prevalence of hypertension. This finding implies the strengthening of the implementation of routine checkups and screening for overweight/obesity at health facilities.
Strength and Limitations
Some limitations of this study include its cross-sectional design, first it did not allow inferences to be drawn with respect to the temporal relationship among variables. Secondly, it was subjective to recall bias due to the information being obtained a long time after exposure to risk and the development of hypertension, therefore it may have been difficult for the study participants to remember. However, the respondents were encouraged to memorize past exposure status linking to past events.
Thirdly, the association between perceived childhood obesity and adulthood hypertension was subject to under-reporting. Moreover, no biochemical test was done to check whether childhood obesity markers existed or not.
Fourthly, since this study used physical measurements, there was a high probability of measurement and instrument error; but to alleviate these challenges, training was conducted, and calibration of the instrument was done every day during data collection. And the other limitation is, this study was limited to only behavioral and physical measurements, but did not include biochemical tests; so further research is needed to solve this problem.
Conclusion
The overall prevalence of hypertension was high among adults aged 25 years and above in Areka town. Thus, the concerned government bodies should pay special attention to the rising prevalence of hypertension by preparing guidelines to prevent and control it. Older age, perceived childhood obesity, consumption of high calorie fatty meats, low vegetable consumption per week, family history of hypertension and overweight/obesity were risk factors significantly associated with developing hypertension.
The health system should strengthen the implementation of the existing strategies that focus on the life cycle based approach in order to control unwanted childhood obesity to in turn prevent intergenerational effects of childhood obesity and the development of adulthood hypertension.
The health institutions in the town need to develop strategies to increase the community-based screening and diagnostic services for high-risk individuals, integrating with other health care services. Health systems should strengthen health education for the population regarding lifestyle modification and eating behavior, eg, consumption of vegetables most of the time and reduction of foods containing saturated fat and cholesterol, and maintaining normal body weight. Finally, further study is recommended to find out the hidden burden of hypertension at national level, including biochemical test.
Abbreviations
AOR, adjusted odds ratio; BP, blood pressure.
Data Sharing Statement
The data used to support the findings of this study are available from the corresponding author upon request, email address: [email protected]
Acknowledgment
We are grateful to the Wolaita Sodo University, School of public health, College of Medicine and Health Sciences for providing ethical clearance for this study. Our appreciation also goes to our data collectors, supervisors, and the study participants.
Author Contributions
All authors made a significant contribution to the work reported, whether that is in the conception, study design, execution, acquisition of data, analysis and interpretation, or in all these areas; took part in drafting, revising or critically reviewing the article; gave final approval of the version to be published; have agreed on the journal to which the article has been submitted; and agree to be accountable for all aspects of the work.
Disclosure
The authors declare that there are no conflict of interests regarding the publication of this paper.
References
1. WHO. Follow-up to the political declaration of up to the political declaration of high-level meeting of the general assembly on the prevention and control of non-communicable diseases; 2013.
2. Dalal S, Beunza JJ, Volmink J, Adebamowo C, Bajunirwe F. Non-communicable diseases in sub-Saharan Africa: what we know now. Int J Epidemiol. 2011;40(4):885–901. doi:10.1093/ije/dyr050
3. Kavishe B, Biraro S, Baisley K, Vanobberghen F, Kapiga S, Munderi P. High prevalence of hypertension and of risk factors for non-communicable diseases (NCDs): a population based cross-sectional survey of NCDS and HIV infection in Northwestern Tanzania and Southern Uganda. BMC Med. 2015;13(126):1–21. doi:10.1186/s12916-015-0357-9
4. Epidemiology and Global Health DoPHaCM, Umeå University, Umeå, Sweden and Vietnam National Heart Institute, BachMai Hospital & Hanoi Medical University, Vietnam. Hypertension in Vietnam from community-based studies to a national targeted programme. Sweeden: the Dean of the Medical Faculty; 2012.
5. WHO. Clinical Guidelines for the Management of Hypertension. 2005:175–281
6. Abebe SM, Berhane Y, Worku A, Getachew A. Prevalence and associated factors of hypertension: a crossectional community based study in Northwest Ethiopia. PLoS One. 2015;10(4):1–11. doi:10.1371/journal.pone.0125210
7. BeLue R, Okoror TA, Iwelunmor J, et al. An overview of cardiovascular risk factor burden in sub-Saharan African countries: a socio-cultural perspective. Global Health. 2009;5(1):10. doi:10.1186/1744-8603-5-10
8. Saeed KMI. Prevalence of hypertension and associated factors in Jalalabad City, Nangarhar Province, Afghanistan. Cent Asian J Glob Health. 2015;4(1). doi:10.5195/CAJGH.2015.134
9. Ogah OS, Rayner BL. Recent advances in hypertension in sub-Saharan Africa. Heart. 2013;99(1):1–10. doi:10.1136/heartjnl-2012-302968
10. Awoke A, Awoke T, Alemu S, Megabiaw B. Prevalence and associated factors of hypertension among adults in Gondar, Northwest Ethiopia: a community based cross-sectional study. BMC Cardiovasc Disord. 2012;12(1):113. doi:10.1186/1471-2261-12-113
11. Tesfaye F, Byass P, Wall S. Population based prevalence of high blood pressure among adults in Addis Ababa: uncovering a silent epidemic. BMC Cardiovasc Disord. 2009;2009(9):1471–2261.
12. Bonsa F, Gudina EK, Hajito KW. Prevalence of hypertension and associated factors in Bedele town, Southwest Ethiopia. Ethiop J Health Sci. 2014;24(1):16–21. doi:10.4314/ejhs.v24i1.3
13. UN-DESA. Sustainable Development Goal 3: ensure healthy lives and promote well-being for all at all ages. Sustainable Development Knowledge Platform; 2017. 17 May 2017.
14. Federal Minster of Health. Health Sector Transformation Plan of Ethiopia; October 2015.
15. Wikipedia. Location in southern nations, nationalities and peoples region of Ethiopia. Areka: The free encyclopedia. Areka; 2016.
16. Helelo TP, Gelaw YA, Adane AA. Prevalence and associated factors of hypertension among adults in Durame town, Southern Ethiopia. PLoS One. 2014;9(11):e112790. doi:10.1371/journal.pone.0112790
17. WHO. Non-Comunicable Disease and Mental Health Cluster. (2005). WHO STEPS serveillance manual. The WHO STEPwise approach to chronic disease risk factor surveillance (STEPS).
18. WHO. A Global Brief on Hypertension. Silent killer, Global Public Health Crisis. 20 Avenue Appia, 1211 Geneva 27, Switzerland;2013:1–39
19. Adelekan PM. Non-Commercial Alcohol in Three Regions. 2008 International Center for Alcohol Policies Analysis (ICAP) Balance Partnership.
20. Services USDoHaH. What is excessive alcohol use? Centers for Disease Control and Prevention. Available from: WWW.CDC.GOV/ALCOHOL.
21. Alcoholism N-NIoAAa. Alcohol overdose: the dangers of drinking too much; 2015.
22. National Heart LaBI. lowering your blood pressure with DASH; 2015.
23. Observatory NO. Body mass index as a measure of obesity; 2009.
24. Lifestyles Statistics team HaSCIC. Statistics on Smoking. England; 2015.
25. Cavill N, Kahlmeier S, Racioppi F. Physical Activity and Health in Europe:Evidence for Action. WHO-Europe; 2006.
26. Mengistu MD. Pattern of blood pressure distribution and prevalence of hypertension and prehypertension among adults in Northern Ethiopia: disclosing the hidden burden. BMC Cardiovasc Disord. 2014;14(33). doi:10.1186/1471-2261-14-33
27. Kibret KT, Mesfin YM. Prevalence of hypertension in Ethiopia: a systematic meta-analysis. Public Health Rev. 2015;36(1). doi:10.1186/s40985-015-0014-z
28. Angaw K, Dadi AF, Alene KA. Prevalence of hypertension among federal ministry civil servants in Addis Ababa, Ethiopia: a call for a workplace-screening program. BMC Cardiovasc Disord. 2015;15(76):1–6.
29. Awoke A, Awoke T, Alemu S, Megabiaw B. Prevalence and associated factors of hypertension among adults in Gondar, Northwest Ethiopia: a community based cross-sectional study. BMC Cardiovasc Disord. 2012;12(1):113.
30. Anteneh ZA, Yalew WA, Abitew DB. Prevalence and correlation of hypertension among adult population in Bahir Dar city, northwest Ethiopia: a community based cross-sectional study. Int J Gen Med. 2015;175–185. doi:10.2147/IJGM.S81513
31. Manandhar RK, Koju R, Sinha NP, Humagain S. Prevalence and associated risk factors of hypertension among people aged 50 years and more in Banepa municipality, Nepal. Kathmandu Univ Med J (KUMJ). 2012;10(39):35–38. doi:10.3126/kumj.v10i3.8015
32. Wei Q, Sun J. Prevalence of hypertension and associated risk factors in Dehui City of Jilin Province in China. J Hum Hypertens. 2014;29(1):64–68. doi:10.1038/jhh.2014.32
33. Serdula MK, Ivery D, Coates RJ, et al. Do obese children become obese adults? A review of the literature. Prev Med. 1993;22(2):167–177. doi:10.1006/pmed.1993.1014
34. Bridger T. Childhood obesity and cardiovascular disease. Paediatr Child Health. 2009;14(3):177–182. doi:10.1093/pch/14.3.177
35. Umer A, Kelley GA, Cottrell LE, Giacobbi P, Innes KE, Lilly CL. Childhood obesity and adult cardiovascular disease risk factors: a systematic review with meta-analysis. BMC Public Health. 2017;17(1):683. doi:10.1186/s12889-017-4691-z
36. Llewellyn A, Simmonds M, Owen CG, Woolacott N. Childhood obesity as a predictor of morbidity in adulthood: a systematic review and meta-analysis. Obes Rev. 2016;17(1):56–67. doi:10.1111/obr.12316
37. Federal Minster of Health. National food and nutrition policy of Ethiopia. 2019.
38. Zakru AB, Gebru HB, Kahsay AB. prevalence and associated factors of hypertension among adult population in Mekelle city, Northern Ethiopia. IJIPSR. 2014;2(3):653–668.
39. Doğan N, Toprak D, Demir S. Hypertension prevalence and risk factors among adult population in Afyonkarahisar region: a cross-sectional research. Anadolu Kardiyol Derg. 2012;12(1):47–52. doi:10.5152/akd.2012.009
40. Joshi MD, Ayah R, Njau EK, et al. Prevalence of hypertension and associated cardiovascular risk factors in an urban slum in Nairobi, Kenya: a population-based survey. BMC Public Health. 2014;14(1177):1–10.
 © 2021 The Author(s). This work is published and licensed by Dove Medical Press Limited. The full terms of this license are available at https://www.dovepress.com/terms.php and incorporate the Creative Commons Attribution - Non Commercial (unported, v3.0) License.
By accessing the work you hereby accept the Terms. Non-commercial uses of the work are permitted without any further permission from Dove Medical Press Limited, provided the work is properly attributed. For permission for commercial use of this work, please see paragraphs 4.2 and 5 of our Terms.
© 2021 The Author(s). This work is published and licensed by Dove Medical Press Limited. The full terms of this license are available at https://www.dovepress.com/terms.php and incorporate the Creative Commons Attribution - Non Commercial (unported, v3.0) License.
By accessing the work you hereby accept the Terms. Non-commercial uses of the work are permitted without any further permission from Dove Medical Press Limited, provided the work is properly attributed. For permission for commercial use of this work, please see paragraphs 4.2 and 5 of our Terms.