")
Back to Journals » Clinical Interventions in Aging » Volume 14
Prevalence of dyslipidemia and prediction of 10-year CVD risk among older adults living in southeast coastal regions in China: a cross-sectional study
Authors Lin HQ, Wu JY, Chen ML, Chen FQ, Liao YJ, Wu YT, Guo ZJ
Received 5 March 2019
Accepted for publication 1 May 2019
Published 20 June 2019 Volume 2019:14 Pages 1119—1129
DOI https://doi.org/10.2147/CIA.S207665
Checked for plagiarism Yes
Review by Single anonymous peer review
Peer reviewer comments 2
Editor who approved publication: Dr Zhi-Ying Wu
Hui-Qin Lin,1* Jing-Ying Wu,2* Mei-Li Chen,3 Feng-Qiang Chen,4 Yan-Jun Liao,5 Yu-Ting Wu,1 Zhi-Jun Guo1
1Departments of Geriatric, The First Hospital of Quanzhou Affiliated to Fujian Medical University, Quanzhou, People’s Republic of China; 2Department of Cardiology, The Second Hospital Affiliated to Fujian Medical University, Quanzhou, People’s Republic of China; 3Physical Examination Center, Medical College of Quanzhou, Quanzhou, People’s Republic of China; 4Luoshan Community Health Center of Jinjiang, Quanzhou, People’s Republic of China; 5Departments of Intensive Care Unit, The First Hospital of Quanzhou Affiliated to Fujian Medical University, Quanzhou, People’s Republic of China
*These authors contributed equally to this work
Objective: This study aims to analyze the prevalence of dyslipidemia and identify the cardiovascular disease (CVD) risk stratification among older adults living in Quanzhou, China’s southeast coastal region, where the ancient Maritime Silk Road starts.
Methods: A population-based cross-sectional survey of 2,018 adults was conducted in 60–98-year-old residents in Quanzhou from September 2016 to March 2018 using multistage stratified cluster random sampling. The 10-year CVD risk was also estimated by applying the Chinese model recommended by the Chinese Guidelines for Prevention of Cardiovascular Diseases.
Results: The overall prevalence of dyslipidemia among older adults was 56.8%. The prevalence of high total cholesterol (TC), high low-density lipoprotein cholesterol (LDL-C), low high-density lipoprotein cholesterol (HDL-C) and high triglyceride (TG) were 8.4%, 13.9%, 23.1% and 11.4%, respectively. The mean levels of TC, LDL-C, HDL-C and TG were 5.12±1.18, 3.37±0.81, 1.03±0.27 and 1.65±0.76 mmol/L, respectively. Older adults had low risk, moderate risk and high risk for CVD, which were 49.7%, 36.8% and 13.5%, respectively. Age, body mass index and abdominal obesity were significantly associated with the risk of increasing LDL-C levels and were positively correlated to CVD risk.
Conclusion: The prevalence of high TC, high LDL-C, low HDL-C and high TG was relatively low among older adults in Quanzhou, but their lipid levels were high. Approximately half of the elderly adults had moderate or high CVD risk. The personalized primary prevention and control of CVD are recommended for elderly people to identify high-risk individuals.
Keywords: prevalence, prediction, dyslipidemia, CVD risk, older adults
Introduction
Cardiovascular disease (CVD) is the leading cause of mortality, worldwide. At present, CVD accounts for up to 40% of all deaths in both urban and rural populations in China. Most CVD occurs in patients over 60 years, and the prevalence of CVD in patients over 80 years is 85%. The proportion of patients over 60 yearsis expected to double from 11% to 22% by 2050, with older adults (>60 years old) outnumbering the young (<5 years old) in many countries within a few years.1,2 Aging biology fundamentally overlaps with CV pathophysiology, and the expanding senior adult population is inherently predisposed to CVD.3
The proper management of CVD-related risk factors, such as dyslipidemia, hypertension, diabetes and obesity, can remarkably reduce the risk of CVD in older Chinese patients. Among these risk factors, the prevalence of dyslipidemia (64.2%) is higher than hypertension, diabetes and obesity, with a prevalence of 50%, 19.5% and 30.1%, respectively, for patients within 65–74 years.4,5 A latest national survey based on a larger sample size also confirmed the high prevalence of abnormal serum lipid levels in Chinese adults.6 Dyslipidemia, including high levels of total cholesterol, low-density lipoprotein cholesterol (LDL-C) and triglyceride (TG), and low levels of high-density lipoprotein cholesterol (HDL-C), are major risk factors of atherosclerosis that leads to various CVDs. The elevation of plasma cholesterol, especially LDL-C, and non-HDL-C, are the main risk factors for atherosclerotic cardiovascular disease (ASCVD). With the aging population trend in China, the picture of public health posed by dyslipidemia would worsen.7,8
There is a lack of effective primary prevention of CVD for older adults, and few evidences were available to indicate the CVD event reduction benefit in primary prevention. Fortunately, CVD risk assessment tools can be used to assess the 10-year CVD risk, which plays an important role in CVD prevention and control. The use of Framingham risk scoring (FRS)9 was recommended by the National Cholesterol Education Program (NCEP) Adult Treatment Panel III (ATP III) and the Chinese model10 was recommended by the Chinese Guidelines for Prevention of Cardiovascular Disease to help health professionals predict the combined ischemic CVD and ischemic stroke risk, which was calculated using simplified scoring tables. In 2013, the American College of Cardiology/American Heart Association (ACC/AHA) pooled cohort equations (PCEs)11 to determine the 10-year ASCVD risk. Some differences in these risk assessment tools were observed. Lately, research12,13 revealed that the 10-year ASCVD risk predicted by PCEs was higher than the ischemic CVD risk predicted using the Chinese model. Hence, PCEs are appropriate for use in primary care in an untreated population.
As early as 2,000 years ago, the Maritime Silk Road started from Quanzhou, China’s southeast coastal region. The city of Quanzhou has experienced rapid economic growth over the last few decades under the policy of reviving the ancient Maritime Silk Road from the Chinese Government. According to the bulletin on the elderly population of Quanzhou municipality, approximately 13.3% of the population in Quanzhou will be 60 years old in 2016, older populations are projected to constitute 25% of the total older population by 2040 and those over 80 years old will account for 14.6% of the total elderly population. Despite the rapid aging of the population in Quanzhou, epidemiological studies on dyslipidemia and the epidemic of CVD in the context of aging projected a significant increase in the incidence and prevalence of CVD, which is scarce.
With the aim of investigating the prediction of CVD risk, in order to improve the prevention and control of CVD in the years to come and bring more benefits to the increasing population age in Quanzhou, the prevalence of dyslipidemia was determined, and the CVD risk stratification among older adults was identified.
Methods
This study was conducted in accordance with the declaration of Helsinki. This study was conducted with approval from the Ethics Committee of the First Hospital of Quanzhou Affiliated to Fujian Medical University. Written informed consent was obtained from the participants.
Data source and study population
A cross-sectional survey of 2018 adults was conducted in elderly residents who were 60–98 years old in three districts of Quanzhou from September 2016 to March 2018, in order to collect the general health status of the elderly using multistage stratified cluster random sampling. People who have lived at their present address for six months or longer within the previous 12 months were eligible to participate in the survey. All subjects were administered questionnaires regarding socio-demographic characteristics, including gender, age, education level and lifestyle factors, such as smoking status, alcohol drinking habit and physical activity. Fasting venous blood samples were collected to assess the lipid profile. Weight, height, waist circumference and blood pressure were measured. Subjects who received lipid-regulating drugs were excluded.
Data collection
Height and weight were measured twice using a height–weight scale that has been previously calibrated. The subjects stood with their bare feet and wore light clothing, and the average values were calculated. The body mass index (BMI) was calculated as weight (kg) divided by height (m) squared. Waist circumference (WC) was measured twice on standing participants at the midpoint between the lower edge of the costal arch and upper edge of the iliacus, and the mean values were calculated. Blood pressure was measured using a mercury sphygmomanometer on the right arm of each participant in a comfortable sitting position after a 30-min rest period. Three consecutive blood pressure measurements were performed, and the mean value of these three measurements was applied in the subsequent analysis. Venous blood samples were collected from all participants in the morning after at least 12 hrs of fasting and immediately centrifuged. Then, the specimens were frozen and stored at −70°C within 2 hrs of collection. Subsequently, fasting blood glucose (FBG), uric acid (UA) and serum lipid profiles, including total cholesterol (TC), LDL-C, HDL-C and TG, were assayed using an automated spectrophotometer, and through the enzymatic colorimetric method using an AU 5800 analyzer (Beckman Coulter, CA, USA).
The age groups were classified according to the Quanzhou census: 60–66 years old, 66–70 years old, 71–75 years old, 76–80 years old and >80 years old. Educational level was categorized into four groups, according to the number of years of education (1–6, 7–9, 10–12 and ≥12 years). Smoking was classified in terms of current smokers or nonsmokers (including ex-smokers). Habitual alcohol consumption was defined as drinking twice per month over the past 12 months, regardless of the quantity of alcohol consumed. Physical activity was defined as moderate-to-vigorous intensity physical activity for not less than once a week. BMI was categorized as underweight (<18.5 kg/m2), normal weight (18.5–23.9 kg/m2), overweight (24.0–27.9 kg/m2) and obese (≥28.0 kg/m2).
The 2016 Chinese Guideline for the Management of Dyslipidemia in Adults (Chinese guideline)14 was used to classify the serum TC, LDL-C, HDL-C and TG levels. These classifications defined by Chinese guidelines were the same with the criteria in the Third Report of the NCEP Expert Panel on Detection Evaluation and Treatment of High Blood Cholesterol in Adults (Adult Treatment Panel III) final report (NCEP-ATP III).15 High TC was defined as TC ≥6.22 mmol/L, high LDL-C was defined as LDL-C ≥4.14 mmol/L, low HDL-C was defined as HDL-C ≥1.04 mmol/L and high TG was defined as TG ≥2.26 mmol/L. The ideal, appropriate, borderline high and high LDL-C levels in the risk stratification were defined as <2.6 mmol/L, 2.6≤LDL<3.4 mmol/L, 3.4≤LDL<4.1 mmol/L and ≥4.1 mmol/L, respectively.
Hypertension was defined as a mean systolic blood pressure of ≥140 mmHg, and/or diastolic blood pressure of ≥90 mmHg, and/or self-reported antihypertension treatment in the last two weeks. Diabetes was defined as FBG ≥7.0 mmol/L and/or self-reported treatment of diabetes with antidiabetes medication in the previous two weeks. Hyperuricemia was defined as serum UA ≥420 umol/L (male) and ≥360 umol/L (female). The 10-year fatal or nonfatal CVD risk was calculated using simplified scoring tables, which were developed by Wu et al,10 and revised and recommended by the Chinese Guidelines for Prevention of Cardiovascular Disease.16 These tables included the age, gender, SBP, TC level, diabetes mellitus history and present smoking status of subjects. CVD events were defined as CAD events and ischemic stroke. The 10% and 20% risk thresholds were used to categorize these CVD risks into three groups: low risk (<10%), moderate risk (10%-20%) and high risk (>20%).
Statistical analysis
The statistical analysis of the data was performed using Statistical Package for Social Sciences version 21.0 software (SPSS, Chicago, IL, USA). Continuous variables were expressed as mean ± standard deviation (x ± SD). Categorical variables were expressed in percentage. For multiple comparisons, each value was compared by one-way ANOVA, followed by Dunnett’s test when each datum conformed to normal distribution, while non-normally distributed continuous data were compared using nonparametric tests. P<0.05 was considered statistically significant.
Results
Socio-demographics and other characteristics of participants
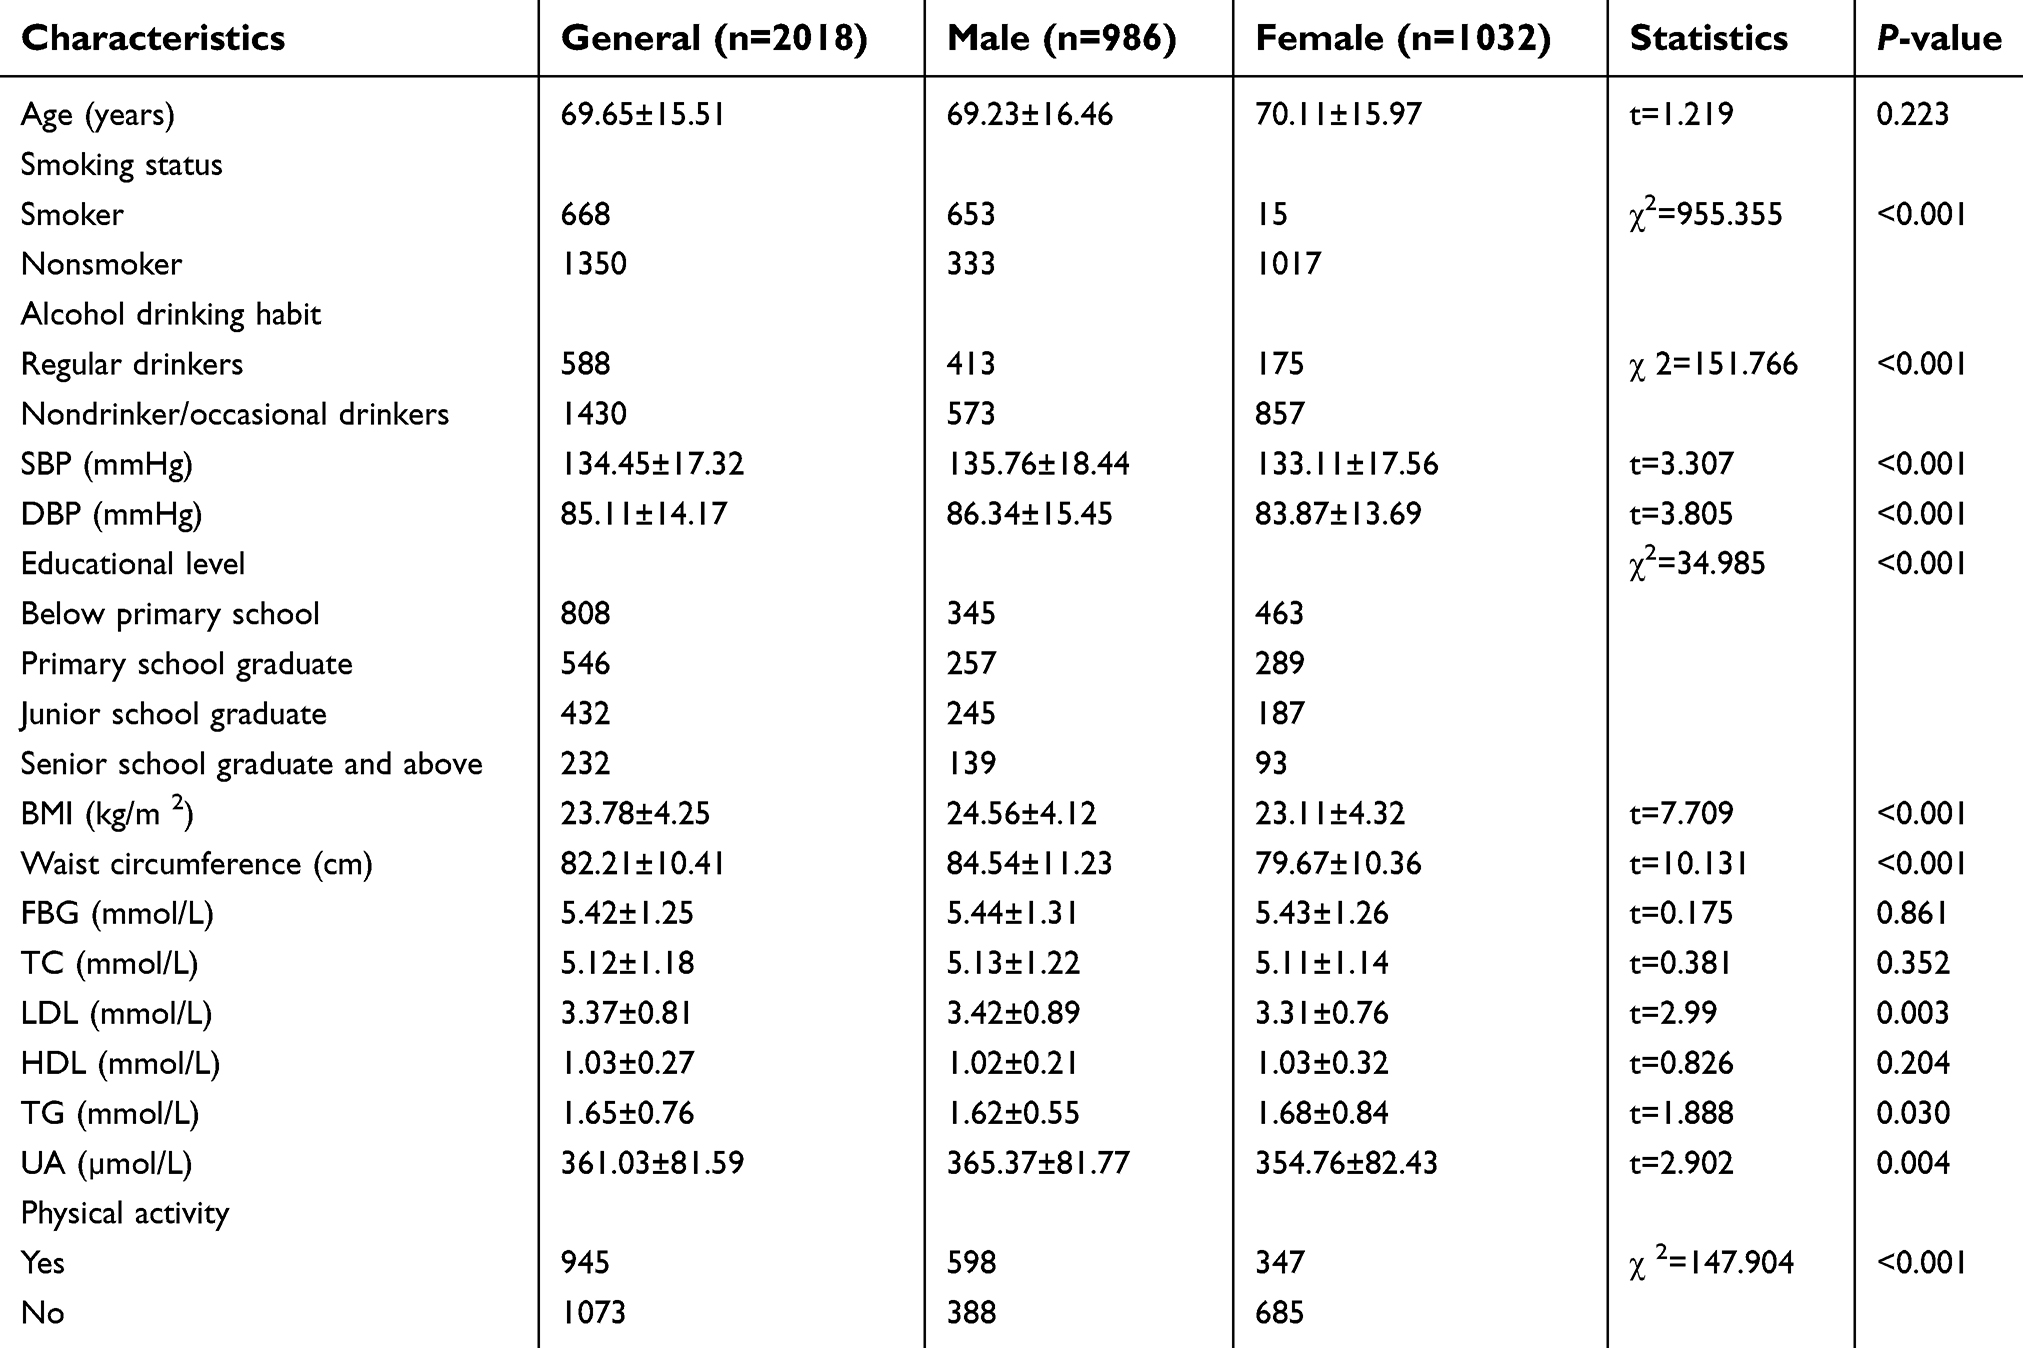
The characteristics of the study participants are presented in Table 1. Among the 2,018 participants, 48.9% were male and 51.1% were female. The mean age of these participants was 69.23 years(SD: 16.46 years) for men and 70.11 years (SD: 15.97) for women. The mean levels of TC, LDL-C, HDL-C and TG were 5.12±1.18, 3.37±0.81, 1.03±0.27 and 1.65±0.76 mmol/L, respectively. There were significant differences among the different gender groups, in terms of smoking status, drinking habit, educational level, physical activity, SBP, DBP, BMI, WC, UA and LDL-C level. Compared to women, more men were currently smoking, drinking and active, and obese, and had higher educational level, blood pressure, hyperuricemia and LDL-C levels.
 | Table 1 Socio-demographic and other characteristics of participants in Quanzhou older adults |
Prevalence of dyslipidemia and the age and gender differences of TC, LDL-C, HDL-C and TG levels
The overall prevalence of dyslipidemia among older adults in Quanzhou was 56.8% (Table 2), and the prevalence of high TC, high LDL-C, low HDL-C and high TG were 8.4%, 13.9%, 23.1% and 11.4%, respectively. There were no significant differences in the prevalence of different TC levels between gender groups. Compared to women, more men had a higher prevalence at different TG and LDL-C levels and a lower prevalence at different HDL-C levels. As shown in Table 3, the peak mean levels for TC, LDL-C and TG occurred at 66–70 years, while the peak mean levels for the bottom HDL-C levels occurred at 60–65 years. Until reaching their 80s, the peak HDL-C levels and the bottom TC, LDL-C and TG levels were reached. In addition, it was found that TC, LDL-C and TG levels increased with BMI, but HDL-C levels decreased. Patients in the obese group had higher levels of TG and LDL-C, and lower levels HDL-C, when compared to their counterparts.
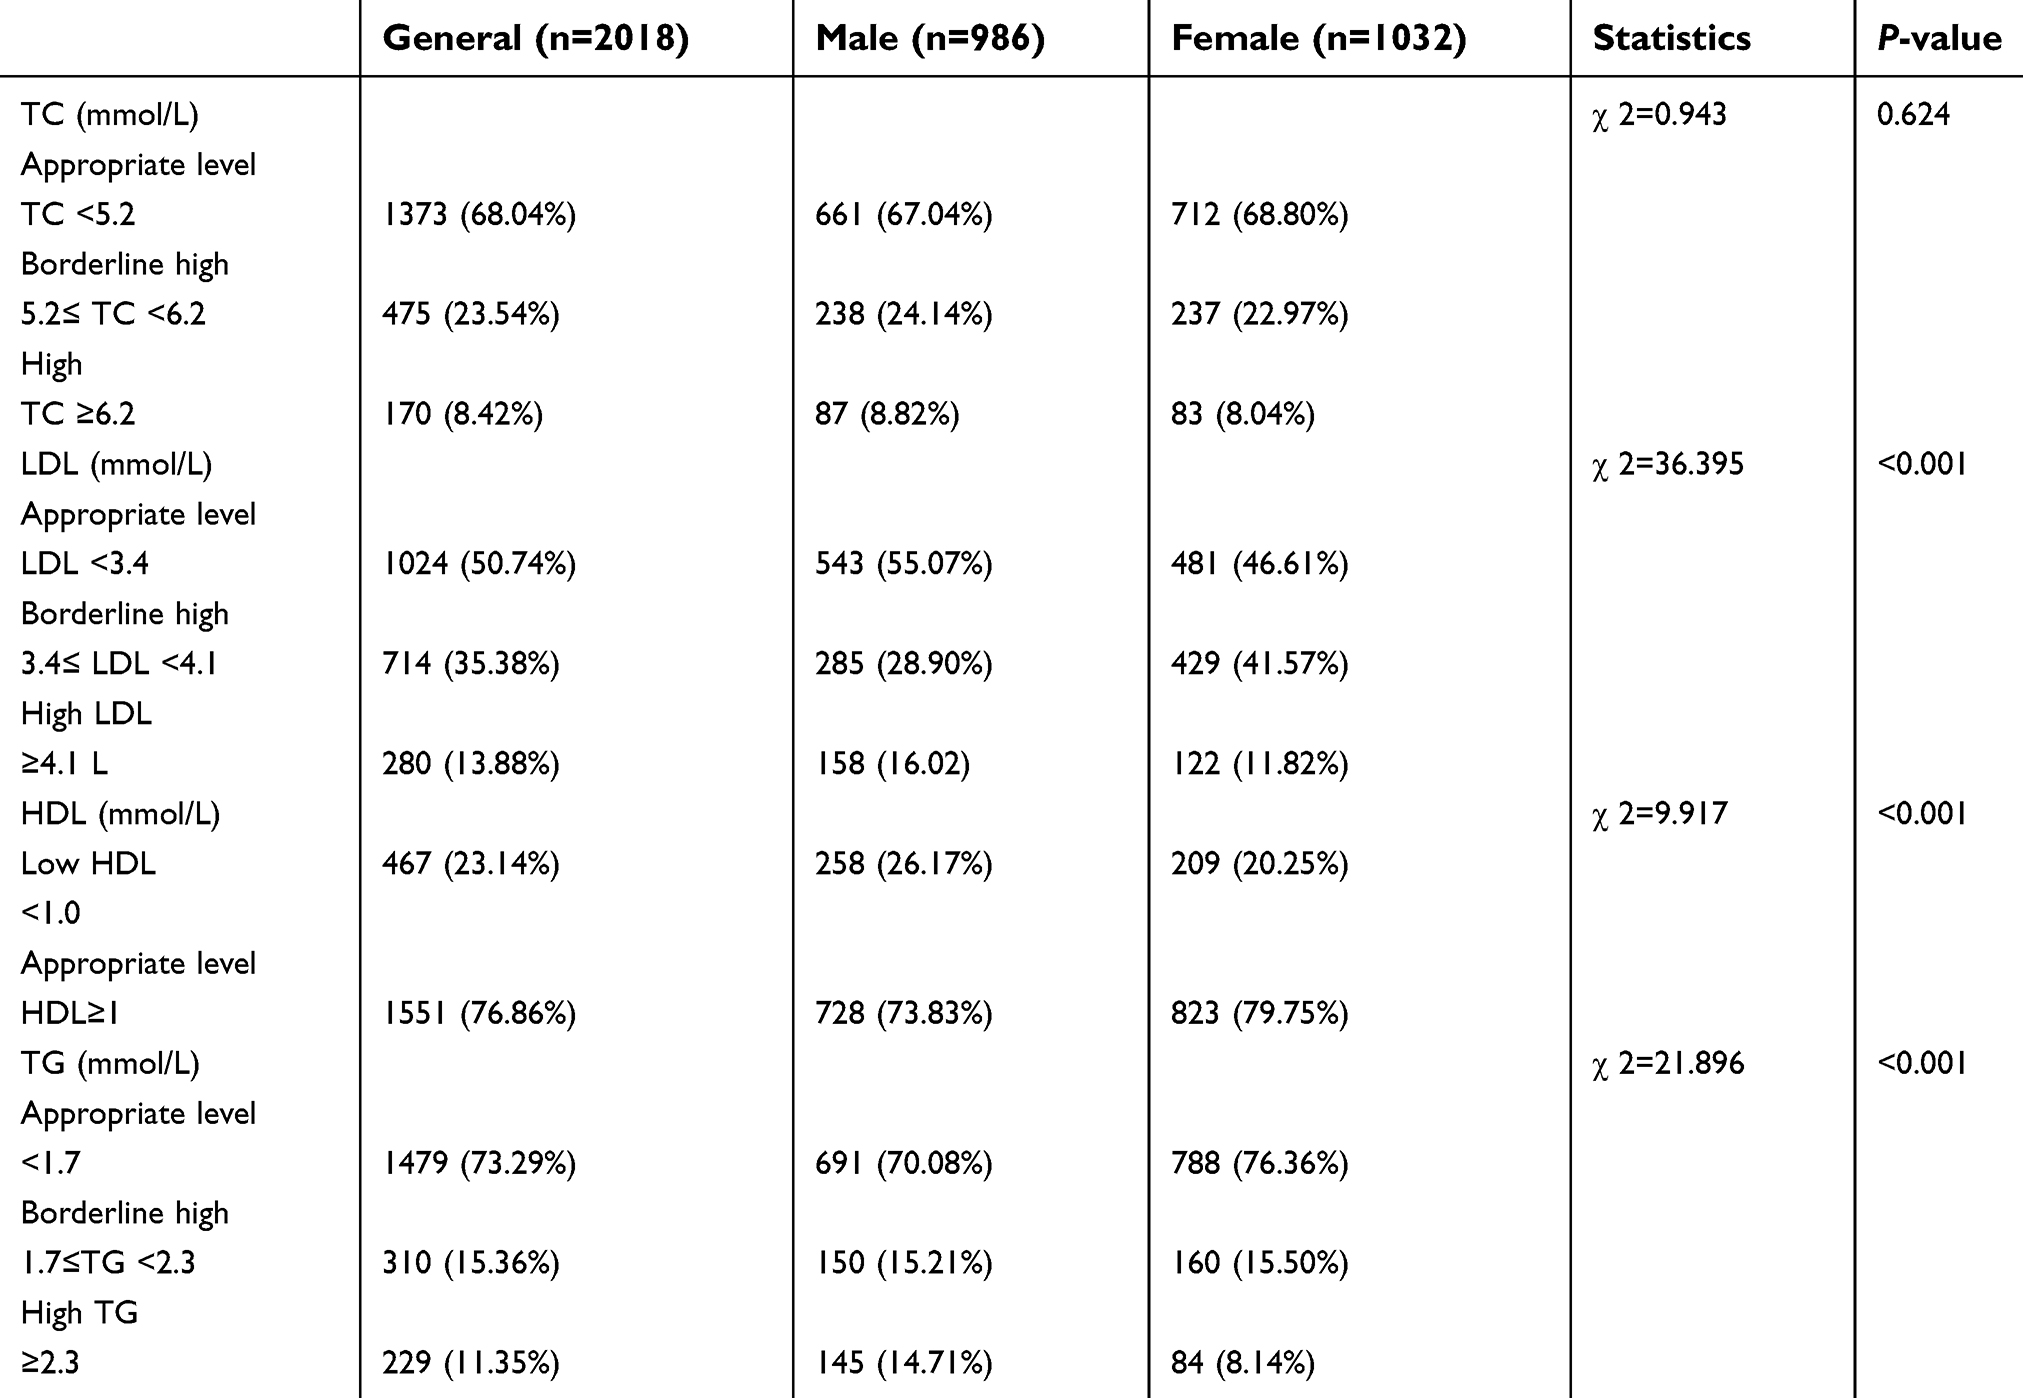 | Table 2 The prevalence of dyslipidemia and gender differences of different levels of serum lipid |
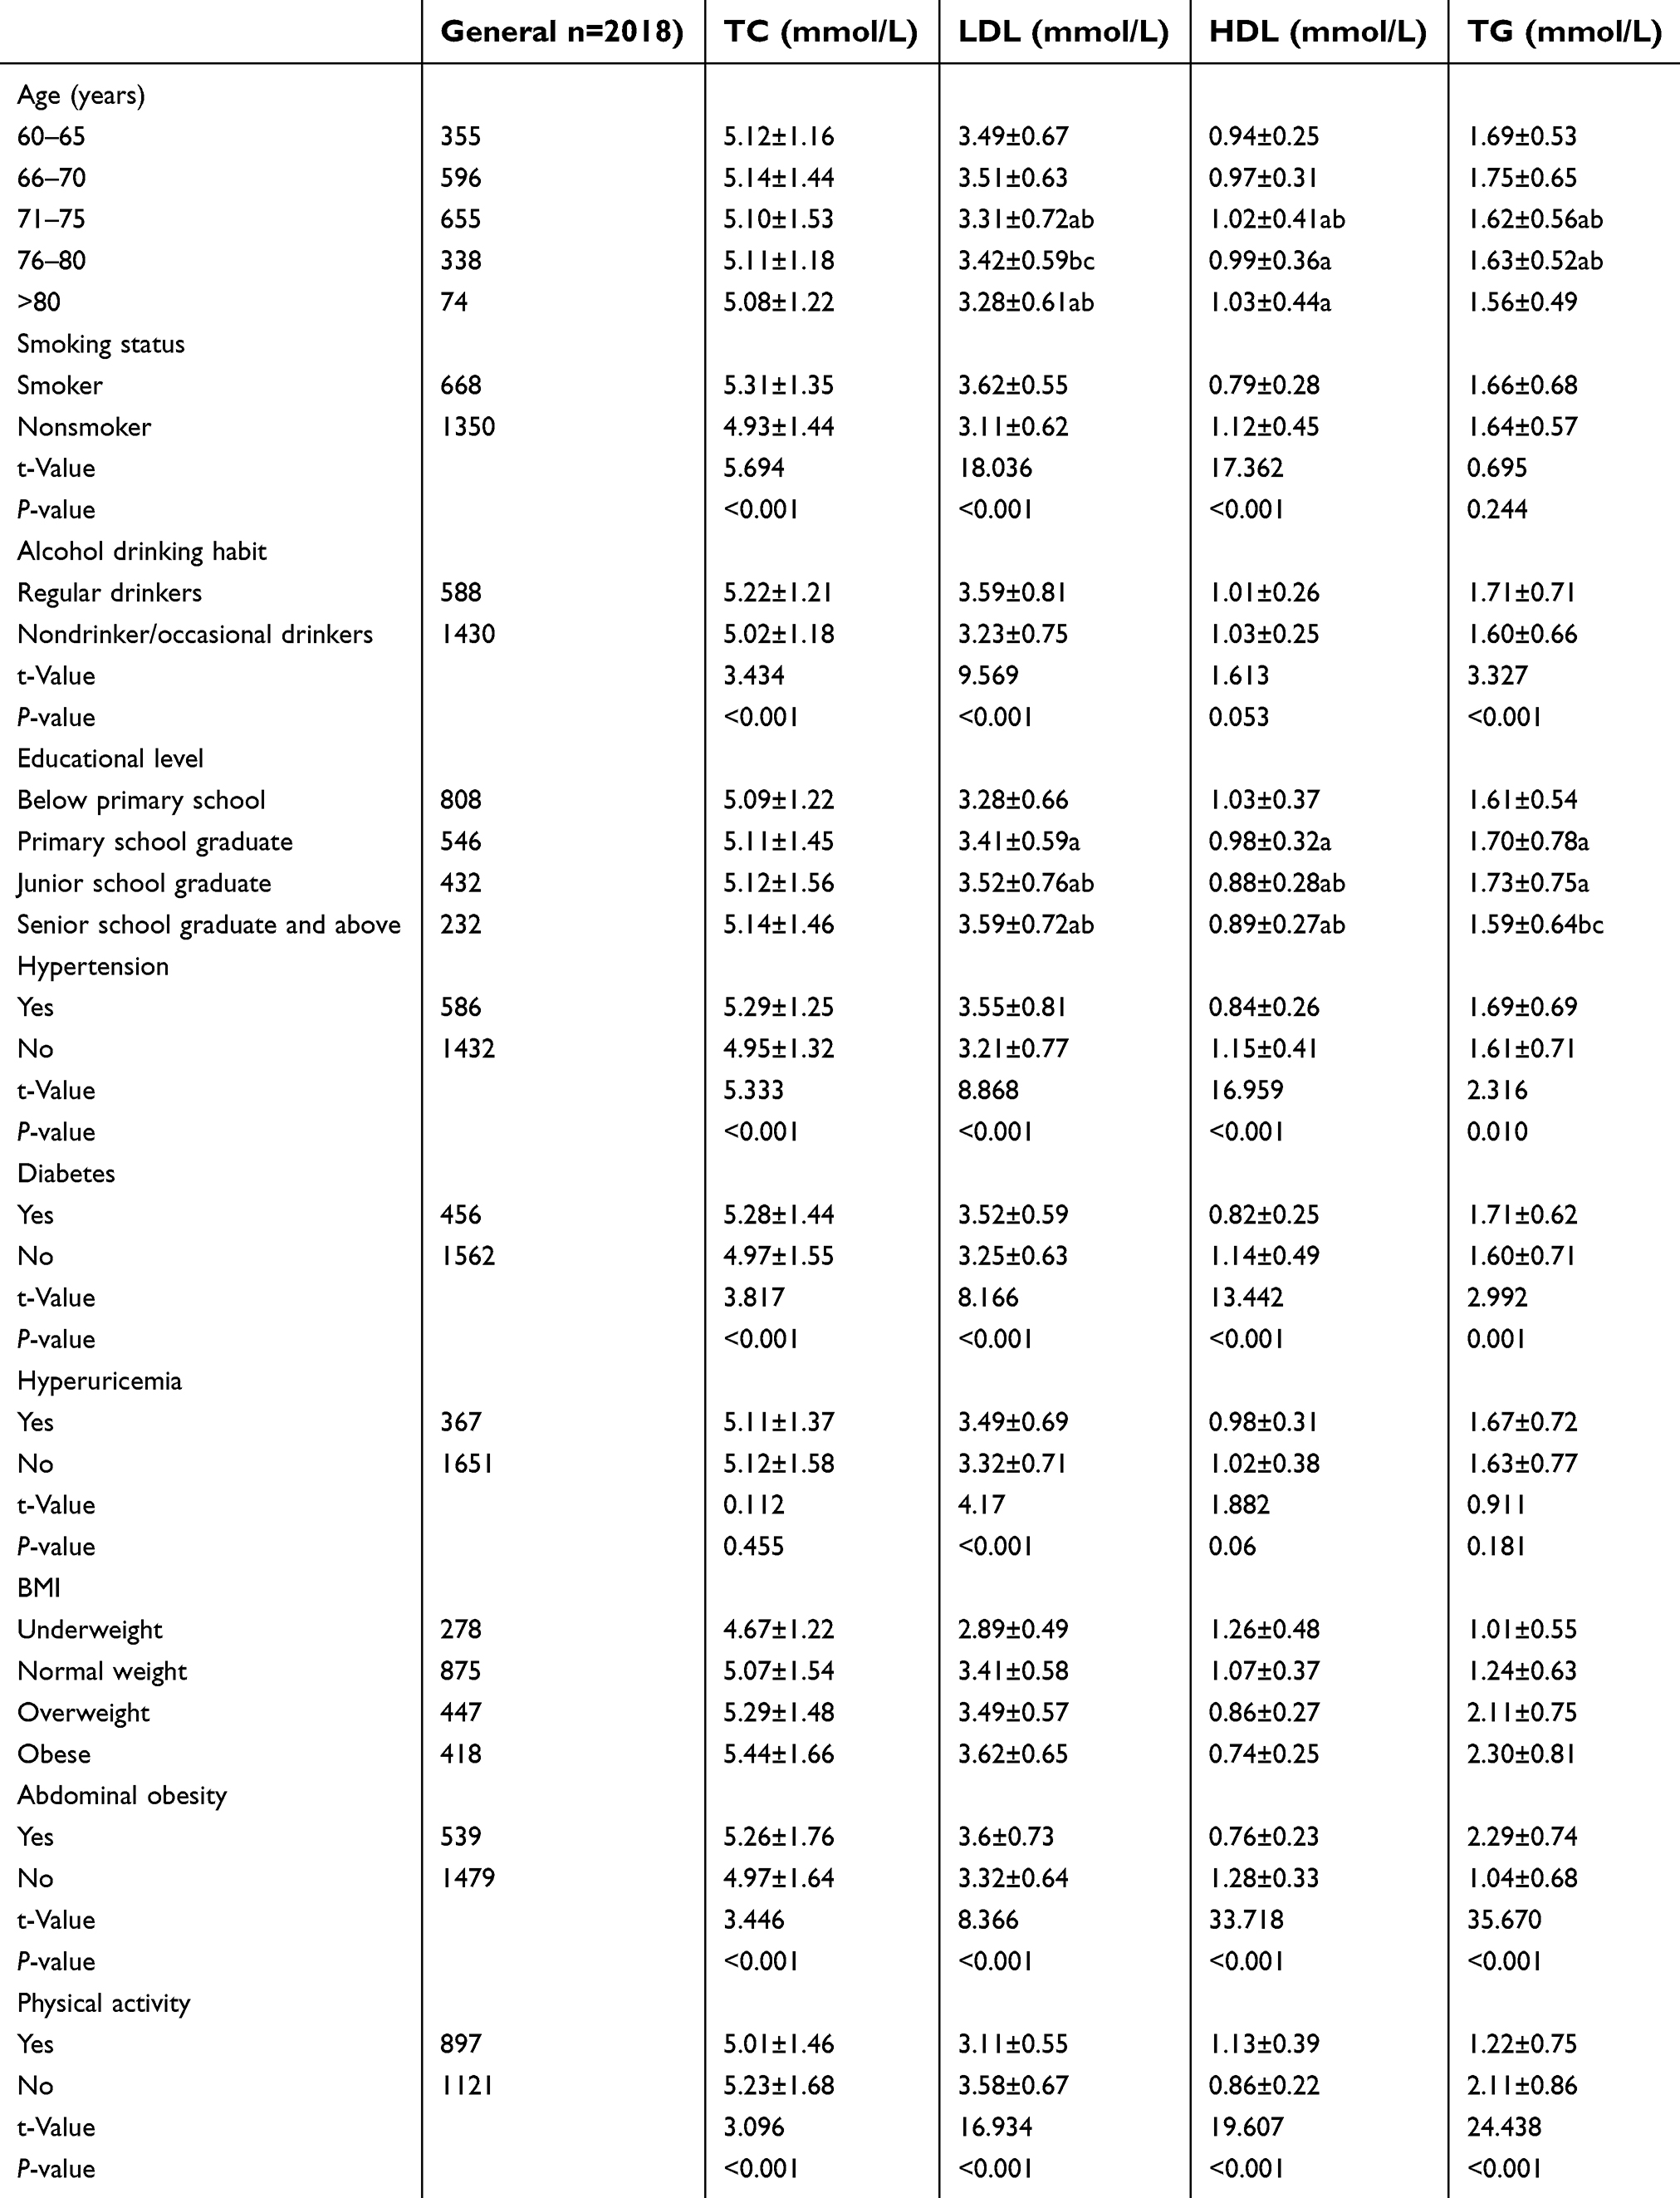 | Table 3 Age differences of TC, LDL-C, HDL-C, and TG levels in Quanzhou older adults |
The prevalence of different LDL levels by age and factors associated with LDL
According to the risk stratification of Chinese guidelines,12 the prevalence of older adults in Quanzhou was 11.9% in ideal LDL-C levels, 36.6% in appropriate levels, 36.5% in border high levels and 14.9% in high levels. For those who were within 60–70 and 76–80 years, the prevalence was higher at 3.4≤LDL<4.1 mmol/L, while for those who were within 71–75 years and >80 years, the prevalence was higher at 2.6≤LDL<3.4 mmol/L. Furthermore, these LDL-C levels were significantly negatively correlated to age, but positively correlated to education level and BMI. Compared to other LDL levels, those with an LDL of ≥4.1 mmol/L were smokers and had hypertension, diabetes and hyperuricemia (Table 4).
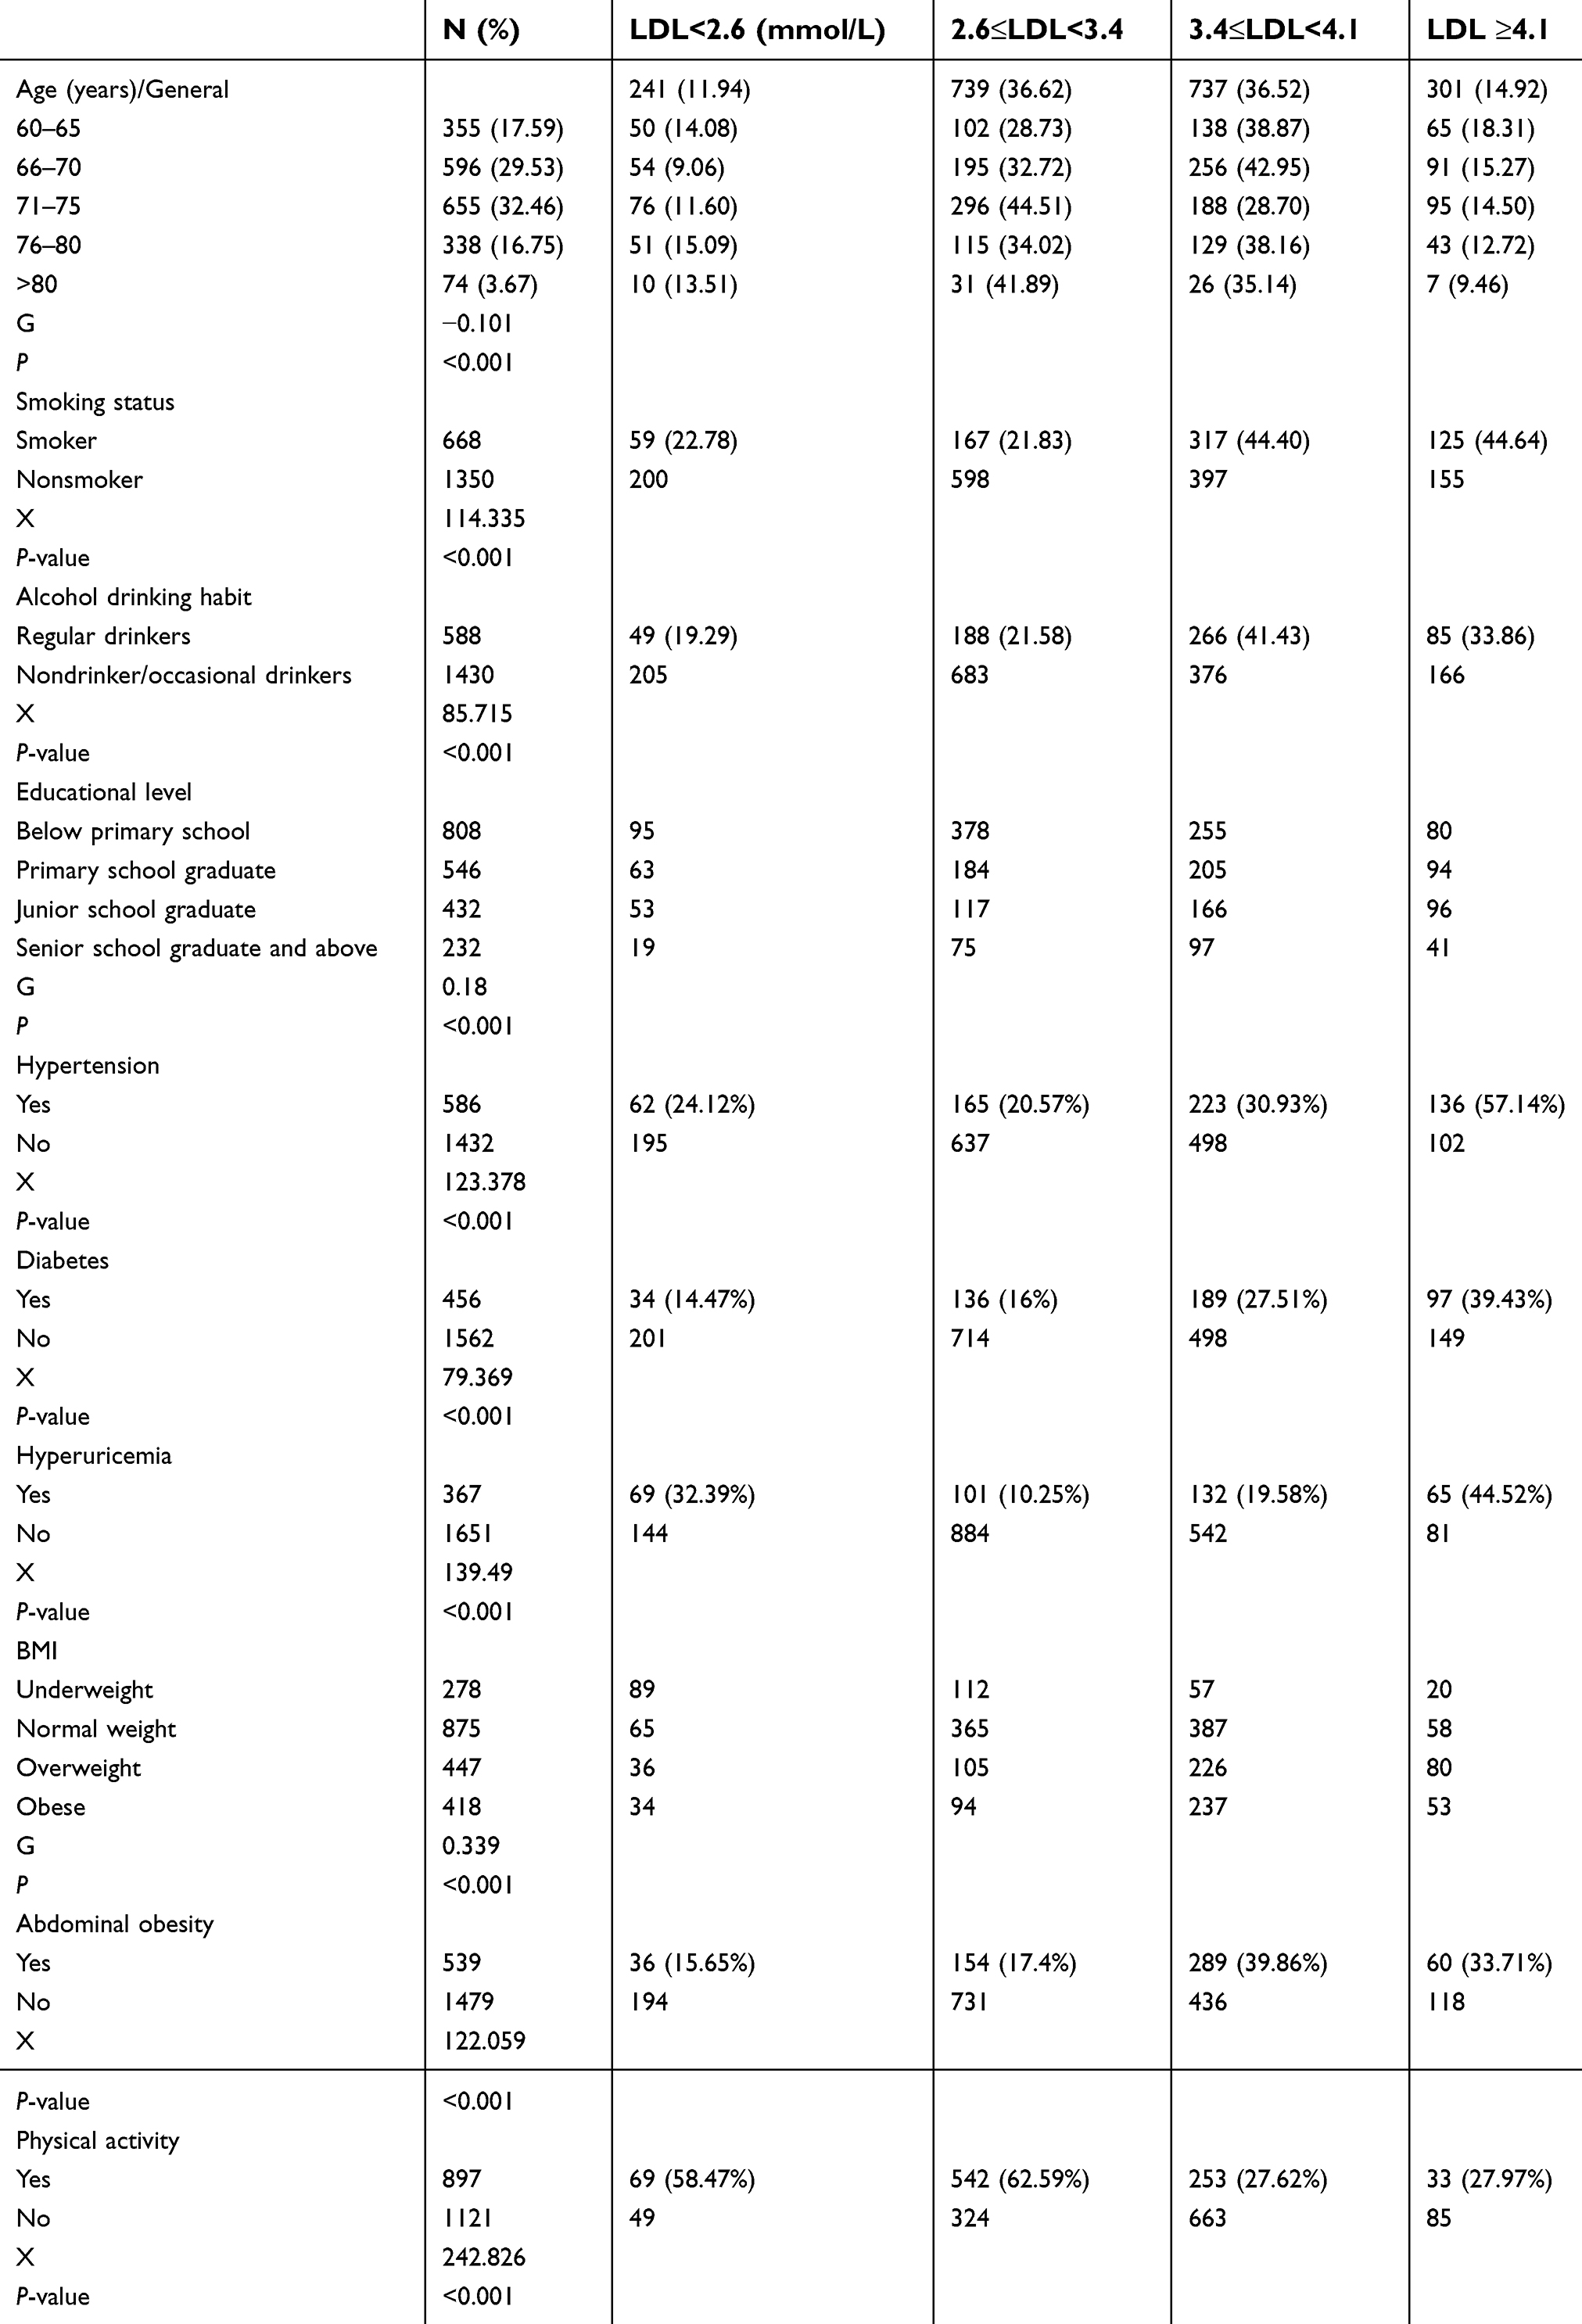 | Table 4 Age differences of the prevalence of LDL levels in Quanzhou older adults |
Multivariable logistic regression was used to determine the associations among gender, age, BMI, abdominal obesity, physical activity, habitual drinking, current smoking and education level, and hypertension, diabetes and hyperuricemia with the odds of LDL-C. The results revealed that age, BMI and abdominal obesity were significantly associated with increased risk of LDL-C for both men and women (Table 5).
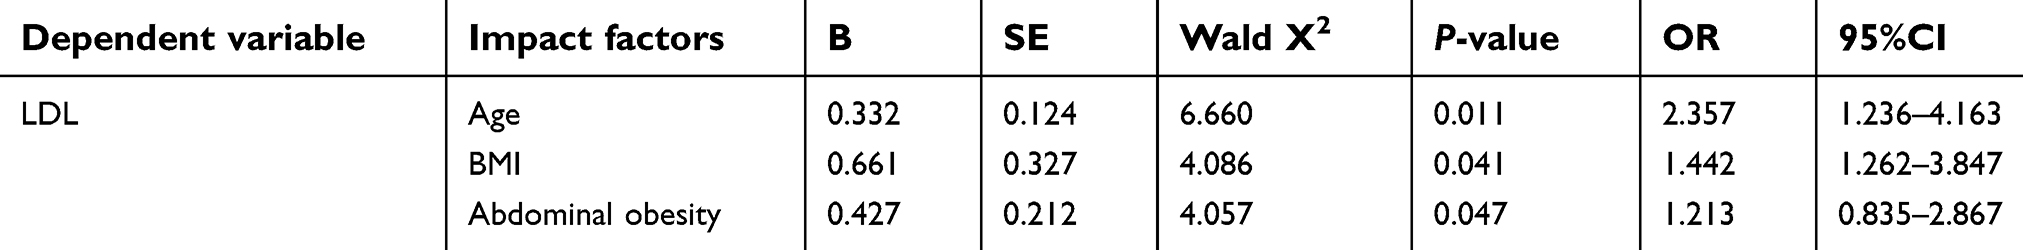 | Table 5 Impact factors on LDL levels in Quanzhou older adults |
Prediction of 10-year CVD risk
As shown in Table 6, 49.7% of older adults had low risk for CVD, 36.8% of older adults had moderate risk and 13.5% of older adults had high risk. Among the same risk groups, nearly 60% of older adults who were 66–70 yearsand 70% of older adults with 2.6≤LDL<3.4 mmol/L levels had low risk, 50% of older adults who were 76–80 years old and 50% of older adults with 3.4≤LDL<4.1 mmol/L levels had moderate risk, and almost 25% of older adults who were ≥80 and >40% of older adults with 3.4≤LDL<4.1 mmol/L levels had high risk. CVD risk was significantly and positively correlated to age and LDL-C levels. LDL-C and TG levels reached a peak in high risk group. In addition, higher LDL-C was associated with increased risk of 10-year risk for CVD (Table 4).
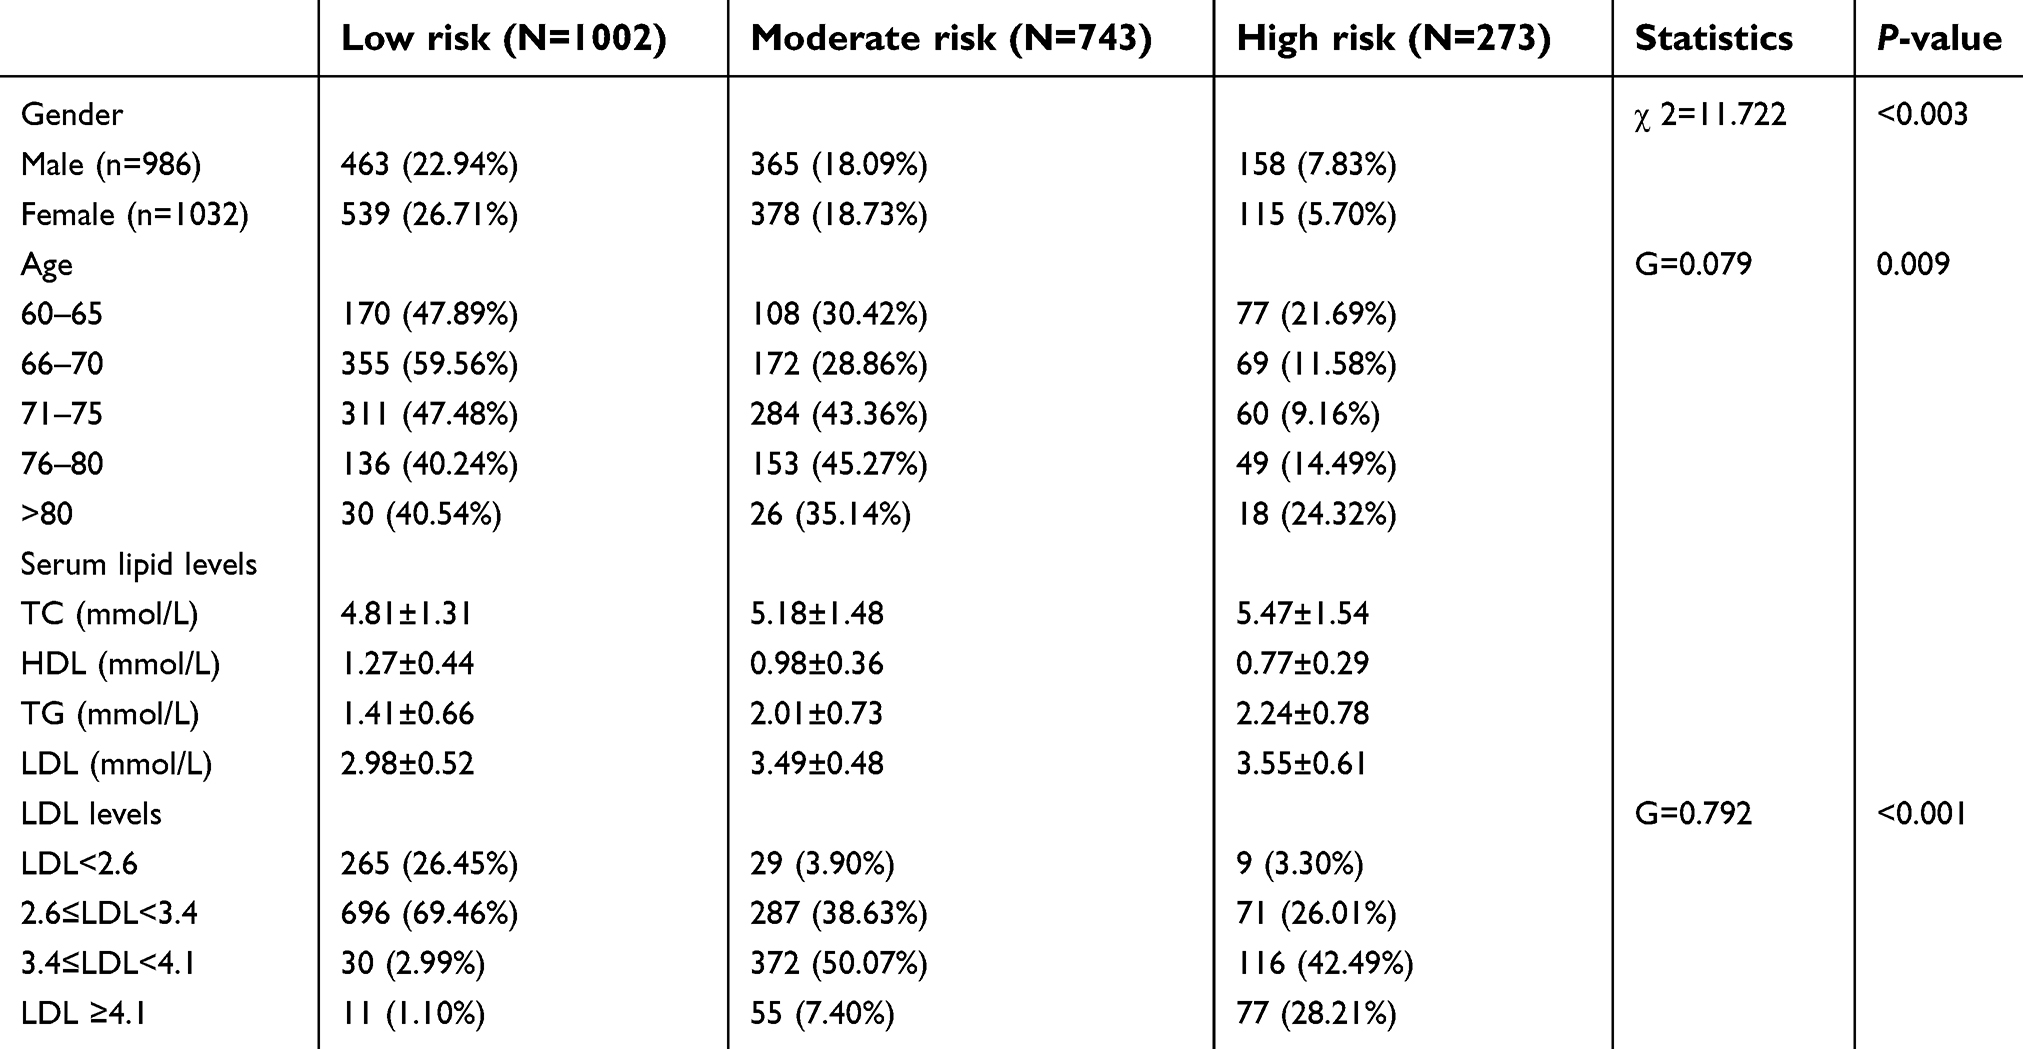 | Table 6 The prediction of CVD risk in Quanzhou older adults |
Discussion
The prevalence and importance of dyslipidemia have been identified in young and middle-aged adults.17 However, these are less clear in the elderly. In the present study, the prevalence of dyslipidemia in a population of >60 years, who are free of CVD at baseline, was 56.8%, which has decreased, while the prevalence of high TC, high LDL-C, low HDL-C and high TG were 8.4%, 13.9%, 23.1% and 11.4%, respectively, which were lower, when compared to the Chinese study (12% had high TC, 18% had high LDL-C, 12% had low HDL-C and 15% had high TG), which included a population of younger subjects (18–79 years old).6 Notably, the prevalence of dyslipidemia in elderly people in Quanzhou presently decreased, and the result is the same as the result reported by a study,18 showing that dyslipidemia is more prevalent among nonelderly subjects, when compared to elderly subjects. Five prescriptions were important for blood lipid control: drugs, exercise, nutrition, psychological sleep and alcohol cessation, such as a diversified diet, drinking more water, eating more fresh vegetables and fruits, and moderate consumption of soy products. Soy is rich in lecithin, which is beneficial for the utilization of lipids through the blood vessel wall, reducing the cholesterol in the blood. Food with high fat and cholesterol should be strictly limited, and the amount of staple food should be appropriately controlled. Alcohol should be restricted or abstained, aerobic exercise should be strengthened, and when diabetes is present, blood sugar should be controlled and blood sugar fluctuation should be avoided. As the origin of the ancient Maritime Silk Road, Quanzhou owns its unique environmental and socioeconomic factors, such as habits in diet, where people prefer to eat more seafood, fresh fruits and vegetables, drink more tea and have a lifestyle that is not highly stressful. These people live a relatively easy life rather than that in metropolitan areas, such as Beijing and Shanghai. These main factors may be the explanation for the decrease in the prevalence of dyslipidemia.
A large national representative survey6 in 2013–2014 in Chinese adults revealed that the mean levels of TC, HDL-C, LDL-C and TG were 4.70, 1.35, 2.88 and 1.14 mmol/L, respectively. According to the present study on older adults in Quanzhou, the mean levels of TC, HDL-C, LDL-C and TG were 5.12, 1.03, 3.37 and 1.65 mmol/L, respectively. Elderly people have different lipid levels, and for the young and middle-aged people, they have higher TC, LDL-C and TG levels, and lower HDL-C levels.19 Furthermore, compared with the other age groups, those who were within 66–70 yearshad higher levels of TC, LDL-C and TG levels, while those who were ≥80 years had lower levels for TC, LDL-C and TG levels. The precise mechanisms of the effect of age on serum lipid concentrations are not exactly known, and these may be correlated to reduced sex hormones, hereditary characteristics and degenerative processes.20
The Chinese guidelines for dyslipidemia prevention have established target levels of LDL-C for different risk groups. The decrease in LDL-C has been shown to significantly improve cardiovascular health.12 For LDL cholesterol levels, every 38 mg/dL of LDL reduction is associated with a 20% reduction in CVD events.21 However, few data has shown benefits in older adults. Therefore, the prevalence of different LDL levels was further explored according to the risk stratification of older adults in Quanzhou by age, and the associated factors on LDL were analyzed. The results revealed that nearly 50% of older adults had ideal and appropriate LDL-C levels, while approximately half of older adults were in borderline high and high levels. Age, BMI and abdominal obesity were significantly associated with LDL-C for both men and women. Age weakened the LDL-C level, while BMI and abdominal obesity elevated the LDL-C level. In general, the BMIs of older adults were encouraged to be <25 kg/m2, because the reduction in BMI can alleviate dyslipidemia.22 When people become older, their physical function gradually degenerates. Hence, the harmful effects of obesity among the elderly may have been underestimated due to Chinese ethnicity.23,24 These studies show that only a small proportion were obese (3.62% with BMI≥30 kg/m2 and 0.39% with BMI≥35 kg/m2), but little is known about abdominal obesity. Hence, older but healthier individuals with high BMI might already have an elevated LDL-C level.
It has been estimated12 that the average 10-year ASCVD risk among adults within 40–79 yearsand without self-reported stroke or MI was 12.6%, while approximately half of Chinese adults within 40–79 years had moderate or high ASCVD risk. In the present study, 13.5% of older adults had high risk, while 50% of adults who were ≥60 yearsand nearly 60% of those who were ≥76 years had moderate or high ASCVD risk, which was almost the same as those in other findings.25 For older adults with higher LDL-C levels, the risk for ASCVD was higher than those with lower LDL-C levels. Those in the high-risk group reached the highest LDL-C level. However, the high prevalence in the high-risk group was not at the high level for LDL ≥4.1 mmol/L, but at the borderline high level with 3.4<LDL<4.1 mmol/L, indicating that not only LDL-C level but also other risk factors, especially age, may increase the risk of ASCVD in older adults. Those who were >80 yearshad a higher prevalence in high-risk group. When dyslipidemia and other CVD risk factors, especially age and weight, among older adults coexisted, the cumulative effects of various risk factors aggravated. This may potentiate each other, resulting in greater total cardiovascular risk, when compared to its individual components.
The present study has several limitations. First, the sample size was small and the geographical distribution was narrow. Second, the cross-sectional study design could not establish the direction of some associations, and the data during risk assessment was considered as a limitation, resulting in the underestimation of the proportion of older populations with 10-year ASCVD risk. Third, the study did not have adequate power to detect the differences among other risk assessment tools, such as ACC/AHA PCEs and FRS, which may be more persuasive in evaluating the prediction of 10-year CVD risk in the elderly population. Fourth, the disease screening correlated to hypertension and diabetes may also be limited, because these were mostly based on self-reports. Future studies are needed to confirm the prevalence and control status of dyslipidemia, and the needs of this growing population and age-related mechanisms. In addition, the issues of risk stratification on the elderly population should be highlighted, in order to alleviate the burden of CVD and its costs for both individuals and society. Fifth, the information about GFR, C-reactive protein, or evidence on the prevalence of subclinical arteriosclerotic lesion remains unknown and needs further research.
Conclusion
In summary, the prevalence of dyslipidemia among Quanzhou elderly adults was 56.8%, the prevalence of high TC, high LDL-C, low HDL-C and high TG was relatively low, but the lipid levels were high. Approximately half of elderly adults had moderate or high CVD risk, when compared to their counterparts. Age, BMI and abdominal obesity were significantly associated with increased risk of LDL-C levels, and these were also positively correlated to CVD risk. Considering that the risk factors and CVD profile have changed among older populations, the personalized primary prevention and control of CVD are recommended, in order to identify high-risk individuals. This would not only be beneficial for health workers, but also for elderly people and the society.
Disclosure
The authors report no conflicts of interest in this work.
References
1. Fuster V. Changing demographics: a new approach to global health care due to the aging population. J Am Coll Cardiol. 2017;69:3002–3005. doi:10.1016/j.jacc.2017.05.013
2. Wu Y, Benjamin EJ, MacMahon S. Prevention and control of cardiovascular disease in the rapidly changing economy of china. Circulation. 2016;133:2545–2560. doi:10.1161/CIRCULATIONAHA.115.008728
3.
4. Yang W, Xiao J, Yang Z, et al. China National Diabetes and Metabolic Disorders Study investigators. Serum lipids and lipoproteins in Chinese men and women. Circulation. 2012;125:2212–2221. doi:10.1161/CIRCULATIONAHA.111.065904
5. Wu J, Cheng X, Qiu L, et al. Prevalence and clustering of major cardiovascular risk factors in china: a recent cross-sectional survey. Medicine (Baltimore). 2016;95:e2712. doi:10.1097/MD.0000000000004864
6. Zhang M, Deng Q, Wang L, et al. Prevalence of dyslipidemia and achievement of low-density lipoprotein cholesterol targets in Chinese adults: A nationally representative survey of 163,641 adults. Int J Cardiol. 2018;260:196–203. doi:10.1016/j.ijcard.2017.12.069
7. Chen GY, Li L, Dai F, Li XJ, Xu XX, Fan JG. Prevalence and risk factors for type 2 diabetes mellitus in hyperlipidemia in China. Med Sci Monit. 2015;21:2476–2484. doi:10.12659/MSM.894246
8. Pan L, Yang Z, Wu Y, et al. China National Survey of Chronic Kidney Disease Working Group. The prevalence, awareness, treatment and control of dyslipidemia among adults in China. Atherosclerosis. 2016;248:2–9. doi:10.1016/j.atherosclerosis.2016.02.006
9. Wilson PW, D’Agostino RB, Levy D, Belanger AM, Silbershatz H, Kannel WB. Prediction of coronary heart disease using risk factor categories. Circulation. 1998;97:1837–1847.
10. Wu Y, Liu X, Li X, et al. USA-PRC collaborative study of cardiovascular and cardiopulmonary epidemiology research group; China multicenter collaborative study of cardiovascular epidemiology research group. Estimation of 10-year risk of fatal and nonfatal ischemic cardiovascular diseases in Chinese adults. Circulation. 2006;114:2217–2225. doi:10.1161/CIRCULATIONAHA.105.607499
11. Goff DC
12. Zhang M, Jiang Y, Wang LM, et al. 2010 China Non-communicable disease surveillance group. prediction of 10-year atherosclerotic cardiovascular disease risk among adults aged 40-79 years in China: a nationally representative survey. Biomed Environ Sci. 2017;30:244–254. doi:10.3967/bes2017.034
13. Chia YC, Lim HM, Ching SM. Validation of the pooled cohort risk score in an Asian population – a retrospective cohort study. BMC Cardiovasc Disord. 2014;14:163. doi:10.1186/1471-2261-14-163
14. Joint committee issued Chinese guideline for the management of dyslipidemia in adults. [2016 Chinese guideline for the management of dyslipidemia in adults]. Zhonghua Xin Xue Guan Bing Za Zhi. 2016;44:833–853. doi:10.3760/cma.j.issn.0253-3758.2016.10.005
15. Stone NJ, Robinson JG, Lichtenstein AH, et al. American College of Cardiology/American Heart Association Task Force on Practice Guidelines. 2013 ACC/AHA guideline on the treatment of blood cholesterol to reduce atherosclerotic cardiovascular risk in adults:a report of the American College of Cardiology/American Heart Association Task Force on Practice Guidelines. J Am Coll Cardiol. 2014;63:2889–2934. doi:10.1016/j.jacc.2013.11.002
16. Chinese Society of Cardiology of Chinese Medical Association, editorial board of Chinese Journal of Cardiology. [Chinese guidelines for prevention of cardiovascular diseases]. Zhonghua Xin Xue Guan Bing Za Zhi. 2011;39(1):3–22.
17. Zhang FL, Xing YQ, Wu YH, et al. The prevalence, awareness, treatment, and control of dyslipidemia in northeast China: a population-based cross-sectional survey. Lipids Health Dis. 2017;16:61. doi:10.1186/s12944-017-0565-8
18. Ni WQ, Liu XL, Zhuo ZP, et al. Serum lipids and associated factors of dyslipidemia in the adult population in Shenzhen. Lipids Health Dis. 2015;14:71. doi:10.1186/s12944-015-0073-7
19. Zhong Z, Liu J, Li B, et al. Serum lipid profiles in patients with acute myocardial infarction in Hakka population in southern China. Lipids Health Dis. 2017;16:246. doi:10.1186/s12944-017-0565-8
20. Bayram F, Kocer D, Gundogan K, et al. Prevalence of dyslipidemia and associated risk factors in Turkish adults. J Clin Lipidol. 2014;8:206–216. doi:10.1016/j.jacl.2013.12.011
21. Stein EA, Raal FJ. Targeting LDL: is lower better and is it safe? Best Pract Res Clin Endocrinol Metab. 2014;28:309–324. doi:10.1016/j.beem.2013.10.010
22. Feng RN, Zhao C, Wang C, et al. BMI is strongly associated with hypertension, and waist circumference is strongly associated with type 2 diabetes and dyslipidemia in northern Chinese adults. J Epidemiol. 2012;22:317–323.
23. Zhu Y, Shao Z, Jing J, et al. Body mass index is better than other anthropometric indices for identifying dyslipidemia in Chinese children with obesity. PLoS One. 2016;11:e0149392. doi:10.1371/journal.pone.0149392
24. Gu D, He J, Duan X, et al. Body weight and mortality among men and women in China. Jama. 2006;295:776–783. doi:10.1001/jama.295.7.776
25. Zhang M, Huang ZJ, Li YC, Wang LM, Jiang Y, Zhao WH. For working group of China chronic disease surveillance(2010). Prediction of 10-year risk for ischemic cardiovascular disease in adults aged ≥35 years in China. Zhonghua Liu Xing Bing Xue Za Zhi. 2016;37(5):689–693. In Chinese. doi:10.3760/cma.j.issn.0254-6450.2016.05.021
 © 2019 The Author(s). This work is published and licensed by Dove Medical Press Limited. The full terms of this license are available at https://www.dovepress.com/terms.php and incorporate the Creative Commons Attribution - Non Commercial (unported, v3.0) License.
By accessing the work you hereby accept the Terms. Non-commercial uses of the work are permitted without any further permission from Dove Medical Press Limited, provided the work is properly attributed. For permission for commercial use of this work, please see paragraphs 4.2 and 5 of our Terms.
© 2019 The Author(s). This work is published and licensed by Dove Medical Press Limited. The full terms of this license are available at https://www.dovepress.com/terms.php and incorporate the Creative Commons Attribution - Non Commercial (unported, v3.0) License.
By accessing the work you hereby accept the Terms. Non-commercial uses of the work are permitted without any further permission from Dove Medical Press Limited, provided the work is properly attributed. For permission for commercial use of this work, please see paragraphs 4.2 and 5 of our Terms.