")
Back to Journals » Diabetes, Metabolic Syndrome and Obesity » Volume 14
Prevalence of Abdominal Obesity in Chinese Middle-Aged and Older Adults with a Normal Body Mass Index and Its Association with Type 2 Diabetes Mellitus: A Nationally Representative Cohort Study from 2011 to 2018
Authors Chen X, Duan M, Hou R, Zheng M , Li H, Singh M, Li C, Liu K, Zhang F, Yang X, Luo Y, He Y, Wu L, Zheng D
Received 20 September 2021
Accepted for publication 8 December 2021
Published 20 December 2021 Volume 2021:14 Pages 4829—4841
DOI https://doi.org/10.2147/DMSO.S339066
Checked for plagiarism Yes
Review by Single anonymous peer review
Peer reviewer comments 2
Editor who approved publication: Professor Ming-Hui Zou
Xuan Chen,1,* Mingrui Duan,1,2,* Rui Hou,1,2,* Manqi Zheng,1,2 Haibin Li,3 Manjot Singh,4,5 Changwei Li,6 Kuo Liu,1,2 Feng Zhang,1,2 Xinghua Yang,1,2 Yanxia Luo,1,2 Yan He,1,2 Lijuan Wu,1,2 Deqiang Zheng1,2,7
1Department of Epidemiology and Health Statistics, School of Public Health, Capital Medical University, Beijing, People’s Republic of China; 2Beijing Municipal Key Laboratory of Clinical Epidemiology, Capital Medical University, Beijing, People’s Republic of China; 3Heart Center & Beijing Key Laboratory of Hypertension, Beijing Chaoyang Hospital, Capital Medical University, Beijing, People’s Republic of China; 4Harry Perkins Institute of Medical Research, QEII Medical Centre, Nedlands and Centre for Medical Research, University of Western Australia, Crawley, WA, Australia; 5School of Medical and Health Sciences, Edith Cowan University, Joondalup, WA, Australia; 6Department of Epidemiology, Tulane University School of Public Health and Tropical Medicine, New Orleans, LA, USA; 7Center for Primary Health Care Research, Lund University/Region Skåne, Malmö, Sweden
*These authors contributed equally to this work
Correspondence: Deqiang Zheng
Department of Epidemiology and Health Statistics, School of Public Health, Capital Medical University, 10 Xitoutiao, Youanmen, Fengtai District, Beijing, 100069, People’s Republic of China
Tel/Fax +86 10 8391 1497
Email [email protected]
Lijuan Wu
Department of Epidemiology and Health Statistics, School of Public Health, Capital Medical University, 10 Xitoutiao, Youanmen, Fengtai District, Beijing, 100069, People’s Republic of China
Tel +86 10 8391 1497
Email [email protected]
Background: Few studies have focused on the prevalence of abdominal obesity in Chinese middle-aged and older adults with a normal body mass index (BMI). Furthermore, it is still unclear whether abdominal obesity is an independent risk factor for type 2 diabetes mellitus (T2DM). Participants with a normal BMI are usually neglected during assessments of abdominal obesity-associated T2DM risk since the current recommendations for medical interventions are mainly focused on overall body mass index rather than fat deposition patterns.
Methods: In this study, 7942 normal-BMI participants aged over 45 years from the China Health and Retirement Longitudinal Study were included to assess the prevalence of abdominal obesity defined by waist circumference (WC) or waist-to-height ratio (WHtR). In addition, 4348 normal-BMI individuals with no diabetes at baseline were included to evaluate the association between abdominal obesity and the risk of T2DM with the Cox proportional hazards model.
Results: The prevalence (95% confidence interval, CI) of increased WC and substantially increased WC among adults with a normal BMI was 22.0% (21.1%-22.9%) and 18.1% (17.3%-19.0%), respectively. The adjusted hazard ratios and 95% CIs for T2DM incidence were 1.39 (1.05– 1.85) and 1.89 (1.42– 2.53) for those with increased WC and substantially increased WC, respectively, compared to the individuals with a normal WC. Similar HRs were obtained for the association between WHtR and the risk of T2DM. In prediabetic patients, the HRs (95% CIs) for new-onset T2DM for those with increased WC and substantially increased WC were 1.85 (1.27– 2.69) and 2.46 (1.67– 3.61), respectively, when compared with individuals with normal WC. This positive association was observed in women but not in men or adults with normal glucose tolerance (NGT).
Conclusion: Abdominal obesity is highly prevalent among middle-aged and older Chinese adults with a normal BMI, and maintaining a normal waist circumference may be beneficial in the prevention of T2DM.
Keywords: abdominal obesity, normal body mass index, prevalence, type 2 diabetes mellitus, hazard ratio
Introduction
Diabetes is a chronic health disorder with an increasing worldwide prevalence. The 2019 estimation of the International Diabetes Federation suggests that 1 in 11 adults (aged 20–79 years) is living with diabetes (463 million) worldwide.1 A recent population-based cross-sectional study found that the prevalence of diabetes and prediabetes was 12.8% and 35.2%, respectively, among Chinese adults.2 The large number of diabetic and prediabetic adults has made the prevention of diabetes a major public health issue.
Obesity, a major public health concern, has also been identified as the major risk factor for type 2 diabetes mellitus (T2DM).3,4 Current recommendations for the prevention of diabetes mainly focus on adults who are overweight or obese as determined by their body mass index (BMI).5–7 However, for participants with a normal BMI, the diabetes risk associated with abdominal obesity is usually neglected, which may cause fewer opportunities to identify the disease in individuals at risk. Furthermore, few studies have investigated the relationship between abdominal obesity and the incidence of T2DM in people with normal BMI. Compared to people with BMI defined as overweight or obese, normal-BMI individuals with abdominal obesity are less likely to receive medical interventions to reduce related health risks.
Waist circumference is generally used as a measurement for abdominal obesity. In China, a cross-sectional survey found that the prevalence of abdominal obesity, which was defined as waist circumference ≥ 90 cm for men and ≥ 85 cm for women, was 7.9% among normal-BMI (18.5–23.9 kg/m2) participants aged over 18 years.8 However, it is still unclear whether the prevalence of abdominal obesity has increased among middle-aged and elderly adults who are at increased risk of T2DM development. Currently, the waist-to-height ratio (WHtR) is generally considered a better measurement for abdominal obesity diagnosis and the related health risks, as used in some previous studies; however, the distribution of WHtR in adults with a normal BMI remains unclear.9–11 Including WHtR as another indicator of abdominal obesity can further verify the robustness of abdominal obesity-related studies.
Some previous studies have shown that abdominal obesity is positively associated with T2DM.12–14 However, abdominal obesity has a strong positive correlation with general obesity, which is defined by BMI. A nationally representative study found that WC was highly correlated with BMI, where the Pearson correlation coefficient between BMI and WC was higher than 0.90 in men and 0.85 in women.15 Therefore, the claim of an association between abdominal obesity and T2DM being independent of general obesity defined by BMI needs further verification in the normal-BMI population. The main purpose of this study was to determine the prevalence of abdominal obesity as defined by waist circumference and waist-to-height ratio in normal-BMI adults among middle-aged and older Chinese and to investigate its associated risk of T2DM. This study used community-based longitudinal data for middle-aged and older adults from the China Health and Retirement Longitudinal Study.16
Methods
Study Population
The China Health and Retirement Longitudinal Study (CHARLS) is an ongoing prospective cohort study of 17,708 participants who were recruited from 450 different communities by using the multistage stratified probability-proportionate-to-size sampling strategy. The national baseline survey was conducted between 2011 and 2012. A standard vis-à-vis questionnaire was used with a computer-assisted personal interview technique. Participants were followed up again in 2013, 2015, and 2018 and underwent physical examinations in the surveys of 2011, 2013, and 2015. The first and second waves of laboratory tests for blood samples were completed at baseline and in 2015, respectively.
For our study, data from the four surveys of CHARLS during the period from 2011–2018 were used. In this analysis, 457 participants with malignant tumors were excluded. We further excluded another 1672 individuals who had missing height, weight, or waist circumference data in all four surveys. We further excluded 406 subjects with an age younger than 45 years at baseline. Considering the WHO recommendation for Asian populations, the normal BMI cutoff definition by the Working Group on Obesity in China, the previous evidence regarding ethnic differences in body composition and obesity-related risk factors in Chinese populations, and to further remove individuals on the verge of being overweight for better validation of the independence of abdominal obesity, we use the BMI cutoffs 18.5–23.9 kg/m2 as a normal BMI.8,17–22 Thus, 7231 participants with BMI <18.5 kg/m2 or BMI≥ 24 kg/m2 at baseline were excluded from this study. Finally, 7942 participants with normal BMI were used to analyze the prevalence of abdominal obesity among normal-BMI adults aged over 45 years.
In this analysis exploring the association of abdominal obesity with the future incidence of diabetes among normal-BMI adults, 807 participants with type 2 diabetes or with unknown diabetes status at baseline were excluded. We further excluded 2787 participants who had missing laboratory test data or other variables and who were lost to follow-up after the baseline survey. Consequently, 4348 individuals were included in the main study of the association between abdominal obesity and the risk of T2DM among adults with a normal BMI (Figure 1). Furthermore, among the 4348 individuals included in our main study, 2238 men and 2110 women were involved in the subgroup study for different genders. For the subgroup study based on participants with prediabetes and with normal glucose tolerance, 1901 and 2447 participants were included, respectively.
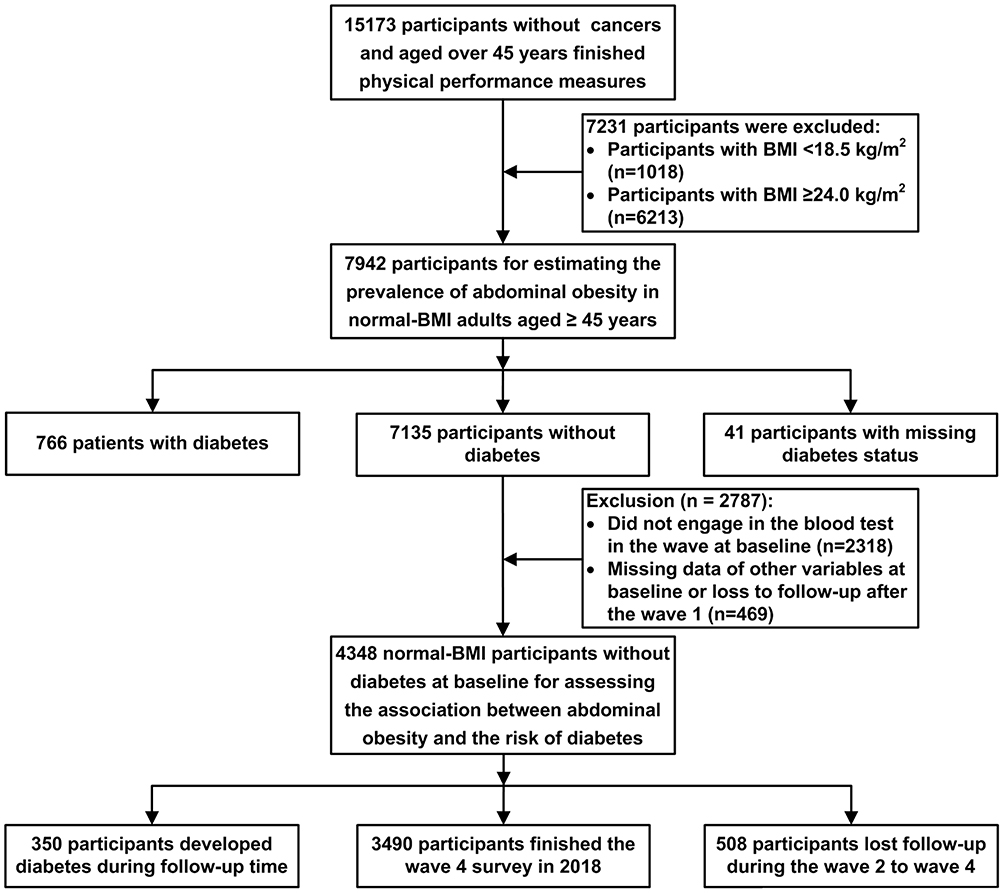 |
Figure 1 Flowchart of study population. |
Measurement and Data Collection
For demographic data, birth date, sex, residence and education, behavioral lifestyles (smoking status and alcohol consumption), and history of diseases were collected from questionnaire information collected from face-to-face interviews by trained staff.
For anthropometric and physical performance measures, height and weight were measured in light clothing using standardized stadiometers and scales, respectively. Waist circumference was measured using a measuring tape. Blood pressure was measured on the left arm three times at 45-second intervals using an electronic sphygmomanometer (the mean of 3 measurements was taken as the final value). The physical examinations were conducted by trained staff.
For laboratory tests, total cholesterol (TC), low-density lipoprotein cholesterol (LDL-C), high-density lipoprotein cholesterol (HDL-C), triglycerides (TGs), glycated hemoglobin (HbA1c), glucose (fasting plasma glucose or postprandial random plasma glucose), and other blood biochemical indexes were assayed by an automatic analyzer using enzymatic colorimetric tests. Total cholesterol and triglycerides were measured by the Oxidase method, low-density lipoprotein cholesterol (LDL-C) and high-density lipoprotein cholesterol (HDL-C) were measured by the Direct method, and glycated hemoglobin and glucose were measured by High-performance liquid chromatography (HPLC) and Hexokinase, respectively. All tests were performed at the Youanmen Center for Clinical Laboratory of Capital Medical University, Beijing.23
Assessments of Abdominal Obesity
We calculated the waist-to-height ratio by dividing the waist circumference (cm) by the height (cm). Based on previously published suggested cutoffs, participants were categorized by waist circumference < 85 cm (normal WC), 85–90 cm (increased WC) and ≥ 90 cm (substantially increased WC) for men and < 80 cm (normal WC), 80–85 cm (increased WC) and ≥ 85 cm (substantially increased WC) for women.21 Participants were also classified into three groups by waist-to-height ratio ≤ 0.50 (normal WHtR), 0.50–0.52 (increased WHtR) and > 0.52 (substantially increased WHtR) for men and ≤ 0.50 (normal WHtR), 0.50–0.55 (increased WHtR) and > 0.55 (substantially increased WHtR) for women.9,10
Assessment of Confounding Covariates
For this study, confounding covariates included sex, age, residence (rural/urban), education level, smoking status, alcohol use, BMI, blood pressure, and blood lipids. Education level was classified into three groups: primary or lower level, secondary level, and higher level. Smoking status was dichotomized into currently smoking more than 1 cigarette per day and no more than 1 cigarette per day. Alcohol use was dichotomized into currently drinking more than 125 mL and no more than 125 mL per week. Body mass index (BMI) was calculated as the weight in kilograms divided by the height in meters squared. Elevated blood pressure was defined as systolic blood pressure (SBP) ≥ 140 mmHg and/or diastolic blood pressure (DBP) ≥ 90 mmHg. Elevated total cholesterol (TC), low-density lipoprotein cholesterol (LDL-C) and triglycerides (TGs) were defined by levels ≥ 5.2 mmol/L (200 mg/dL), ≥ 3.4 mmol/L (130 mg/dL) and ≥ 1.7 mmol/L (150 mg/dL). Decreased high-density lipoprotein cholesterol (HDL-C) was defined by levels < 1.0 mmol/L (40 mg/dL). Elevated glycated hemoglobin (HbA1c) was defined by levels ≥ 6.0%. We identified prediabetic patients with impaired fasting glucose (IFG) using the following clinical measures: fasting plasma glucose (FPG) concentration ranging between 5.6 mmol/L (100 mg/dL) to 6.9 mmol/L (125 mg/dL), and/or impaired glucose tolerance (IGT) as a postprandial random plasma glucose from 7.8 mmol/L (140 mg/dL) to 11.0 mmol/L (199 mg/dL) and/or elevated HbA1c between 5.7 and 6.4% (39–47 mmol/mol).24
Assessments of Incident T2DM
The incidence of T2DM was assessed using four identifiers: a self-reported physician-diagnosis history of T2DM and/or a fasting plasma glucose (FPG) concentration ≥ 7.0 mmol/L (126 mg/dL) and/or a postprandial random plasma glucose ≥ 11.1 mmol/L (200 mg/dL) and/or HbA1c ≥ 6.5% (48 mmol/mol).24
Statistical Analysis
Estimates of the prevalence and the 95% confidence interval (95% CI) of abdominal obesity defined by waist circumference among normal-BMI participants were calculated by estimating the parameter of a binomial distribution for the overall population and subgroups stratified by sex and age. Beeswarm plots were drawn to show the distribution of waist circumference and WHtR across the subgroups. To generalize the characteristics of the participants without diabetes among the normal-BMI participants at baseline, continuous variables were expressed as the means plus standard deviation, and categorical variables were expressed as frequencies and percentages. The group differences by gender for continuous variables were compared with the Wilcoxon rank-sum test, and the χ2 tests were used for categorical variables.
The Cox proportional hazards model was applied to assess the association between waist circumference, WHtR, and the risk of T2DM. Four step-forward multivariable-adjusted Cox proportional hazards models were built for the statistical analyses in this study. Model 1 was adjusted for age and sex. Model 2 was adjusted for the variables in Model 1, as well as for residence, education level, smoking status, alcohol use, and BMI. Model 3 was adjusted for variables in Model 2, as well as for blood pressure, TC, LDL-C, HDL-C, and blood pressure. Model 4 was adjusted for variables in Model 3, as well as for the HbA1c concentration measure. Hazard ratios (HRs) with corresponding 95% confidence intervals (CIs) were calculated from the Cox proportional hazards model. Kaplan–Meier curves were drawn to analyze the onset of T2DM related to different WC or WHtR groups.
We also performed sensitivity analyses to evaluate the robustness of our results. First, we examined the association between abdominal obesity and the risk of T2DM using a simplified classification of abdominal obesity, in which we dichotomized waist circumference and waist-to-height ratio into normal (WC < 85 cm for men and WC < 80 cm for women; or WHtR ≤ 0.50) and abdominal obesity (WC ≥ 85 cm for men and WC ≥ 80 cm for women, or WHtR < 0.50). Then, we applied the Cox proportional hazards model with time-dependent covariates to assess the association between waist circumference, WHtR, and the risk of T2DM, in which waist circumference, WHtR, age, smoking status and alcohol use, BMI, blood pressure, TC, LDL-C, HDL-C, and TG measures during 2011–2018 were identified as time-dependent covariates, while sex, education level, residence, and baseline HbA1c were identified as time-invariant variables. In addition, we restricted participants whose BMI was in the normal range throughout the follow-up period spanning 2011 and 2018 (n=3451). Last, to minimize any potential reverse causation, we examined the association between abdominal obesity and the risk of T2DM among only participants with more than 2 years of follow-up (n=4253).
The following formula was used to calculate the population-attributable risk (PAR): p (HR –1)/(1 + p (HR –1)), where p is the prevalence of exposure (substantially increased WC or WHtR) in the population and HR is the hazard ratio for exposed (substantially increased WC or WHtR) versus unexposed (normal WC or WHtR) and increased WC or WHtR.
For all analyses, a two-tailed P value < 0.05 or a 95% CI for HR containing 1.00 was considered statistically significant. Statistical analyses were performed using SAS version 9.4 (SAS Institute, Cary, NC, USA) and the beeswarm package, ggbeeswarm package in R (R version 3.5.1, R Foundation for Statistical Computing, Vienna, Austria).
Results
Out of 7942 adults with normal BMI and aged 45 years old at baseline, 4758 (59.9%, 95% CI: 58.8%-61.0%), 1745 (22.0%, 95% CI: 21.1%-22.9%), and 1439 (18.1%, 95% CI: 17.3%-19.0%) individuals were classified into three groups with normal, increased, and substantially increased WC, respectively (Table S1 in the Supplement Materials). The prevalence of increased WC and substantially increased WC was higher in women and older participants (Figure 2). Among 4267 men with a normal BMI, 72.6% (95% CI: 71.3%-73.9%) had a normal WC, 17.8% (16.7%-19.0%) had an increased WC, and 9.5% (95% CI: 8.7%-10.4%) had a substantially increased WC. Of 3675 women with normal BMI, 54.9% (95% CI: 53.3%-56.5%) had a WC > 80 cm and were classified into the increased WC or substantially increased WC groups (Figure 2A). The prevalence of increased WC varied among the six age groups. The prevalence of substantially increased WC increased with age, from 11.9% in participants aged 45–49 years to 28.6% in those aged 70 years or older (Figure 2B). Among 7901 participants with T2DM status, increased WC prevalence was higher in patients with T2DM than in participants without T2DM (28.9% vs 21.2%). The percentage of substantially increased WC was higher among subjects with T2DM than in participants without T2DM (26.1% vs 17.3%). The beeswarm plot illustrates the distribution of waist circumference in men, women and participants with or without T2DM as a continuous variant (Figure 3A and B). The median and IQR for men and women were 81.0 cm and 8.8 cm and 80.3 cm and 9.4 cm, respectively. For patients with T2DM and participants without T2DM, the median and IQR were 82.8 cm and 8.9 cm and 80.2 cm and 9.0 cm, respectively.
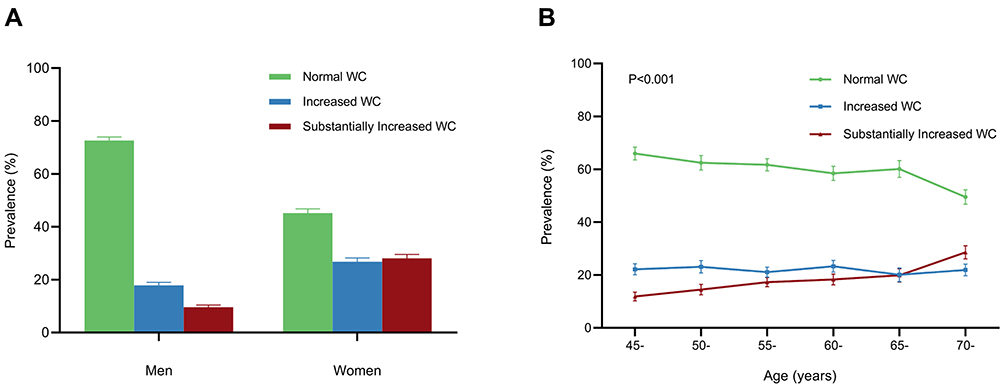 |
Figure 2 The prevalence of abdominal obesity determined by waist circumference in subgroups of gender and age. (A). Prevalence of abdominal obesity defined by waist circumference in different genders. (B). Prevalence of abdominal obesity defined by waist circumference in different age groups. |
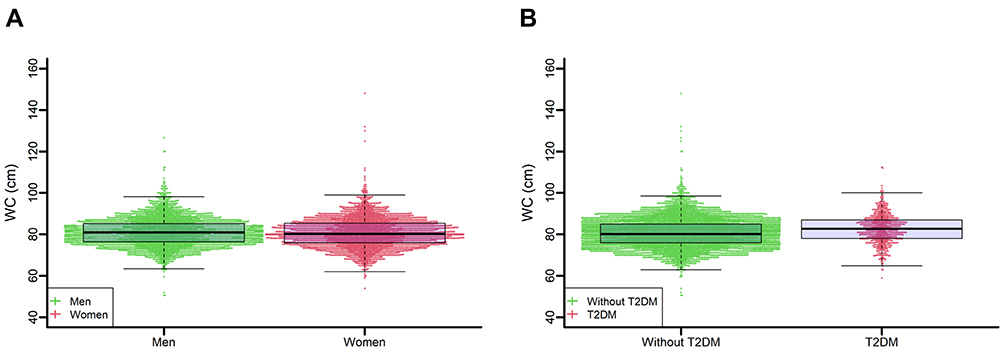 |
Figure 3 Beeswarm plots of the distribution of waist circumference across the subgroups. (A). Beeswarm plots of the distribution of waist circumference grouped by gender. (B). Beeswarm plots of the distribution of waist circumference in T2DM patients and participants without T2DM. |
The prevalence of increased WHtR and substantially increased WHtR was 29.2% (95% CI: 28.2%-30.2%) and 28.6% (95% CI: 27.6%-29.6%), respectively, among normal-BMI participants aged 45 years old (Table S2 in the Supplement materials). Similar to the prevalence of waist circumference, the prevalence of increased and substantially increased WHtR was higher in women, older participants (Figure S1A, B in the Supplement materials). The distributions of WHtR in men, women, patients with T2DM and participants without T2DM are shown in Supplementary Figure S2A and B.
Of 4348 individuals with a normal BMI and without T2DM at baseline, 350 new incident cases of T2DM were identified, 3490 participants were still followed in all four surveys, and 508 participants were lost to follow-up after the second survey. Table 1 summarizes the baseline characteristics of the participants. Compared with men, women were less likely to have a higher waist circumference and currently be smoking or drinking alcohol but were more likely to have a higher WHtR. Figure 4 shows the Kaplan–Meier unadjusted survival estimates for the different WC groups. The overall difference in the Kaplan–Meier curves for WC reached statistical significance (log-rank P value<0.001). Significant differences among different WHtR groups were also observed (log-rank P value<0.001) (Figure S3 in the Supplementary Materials).
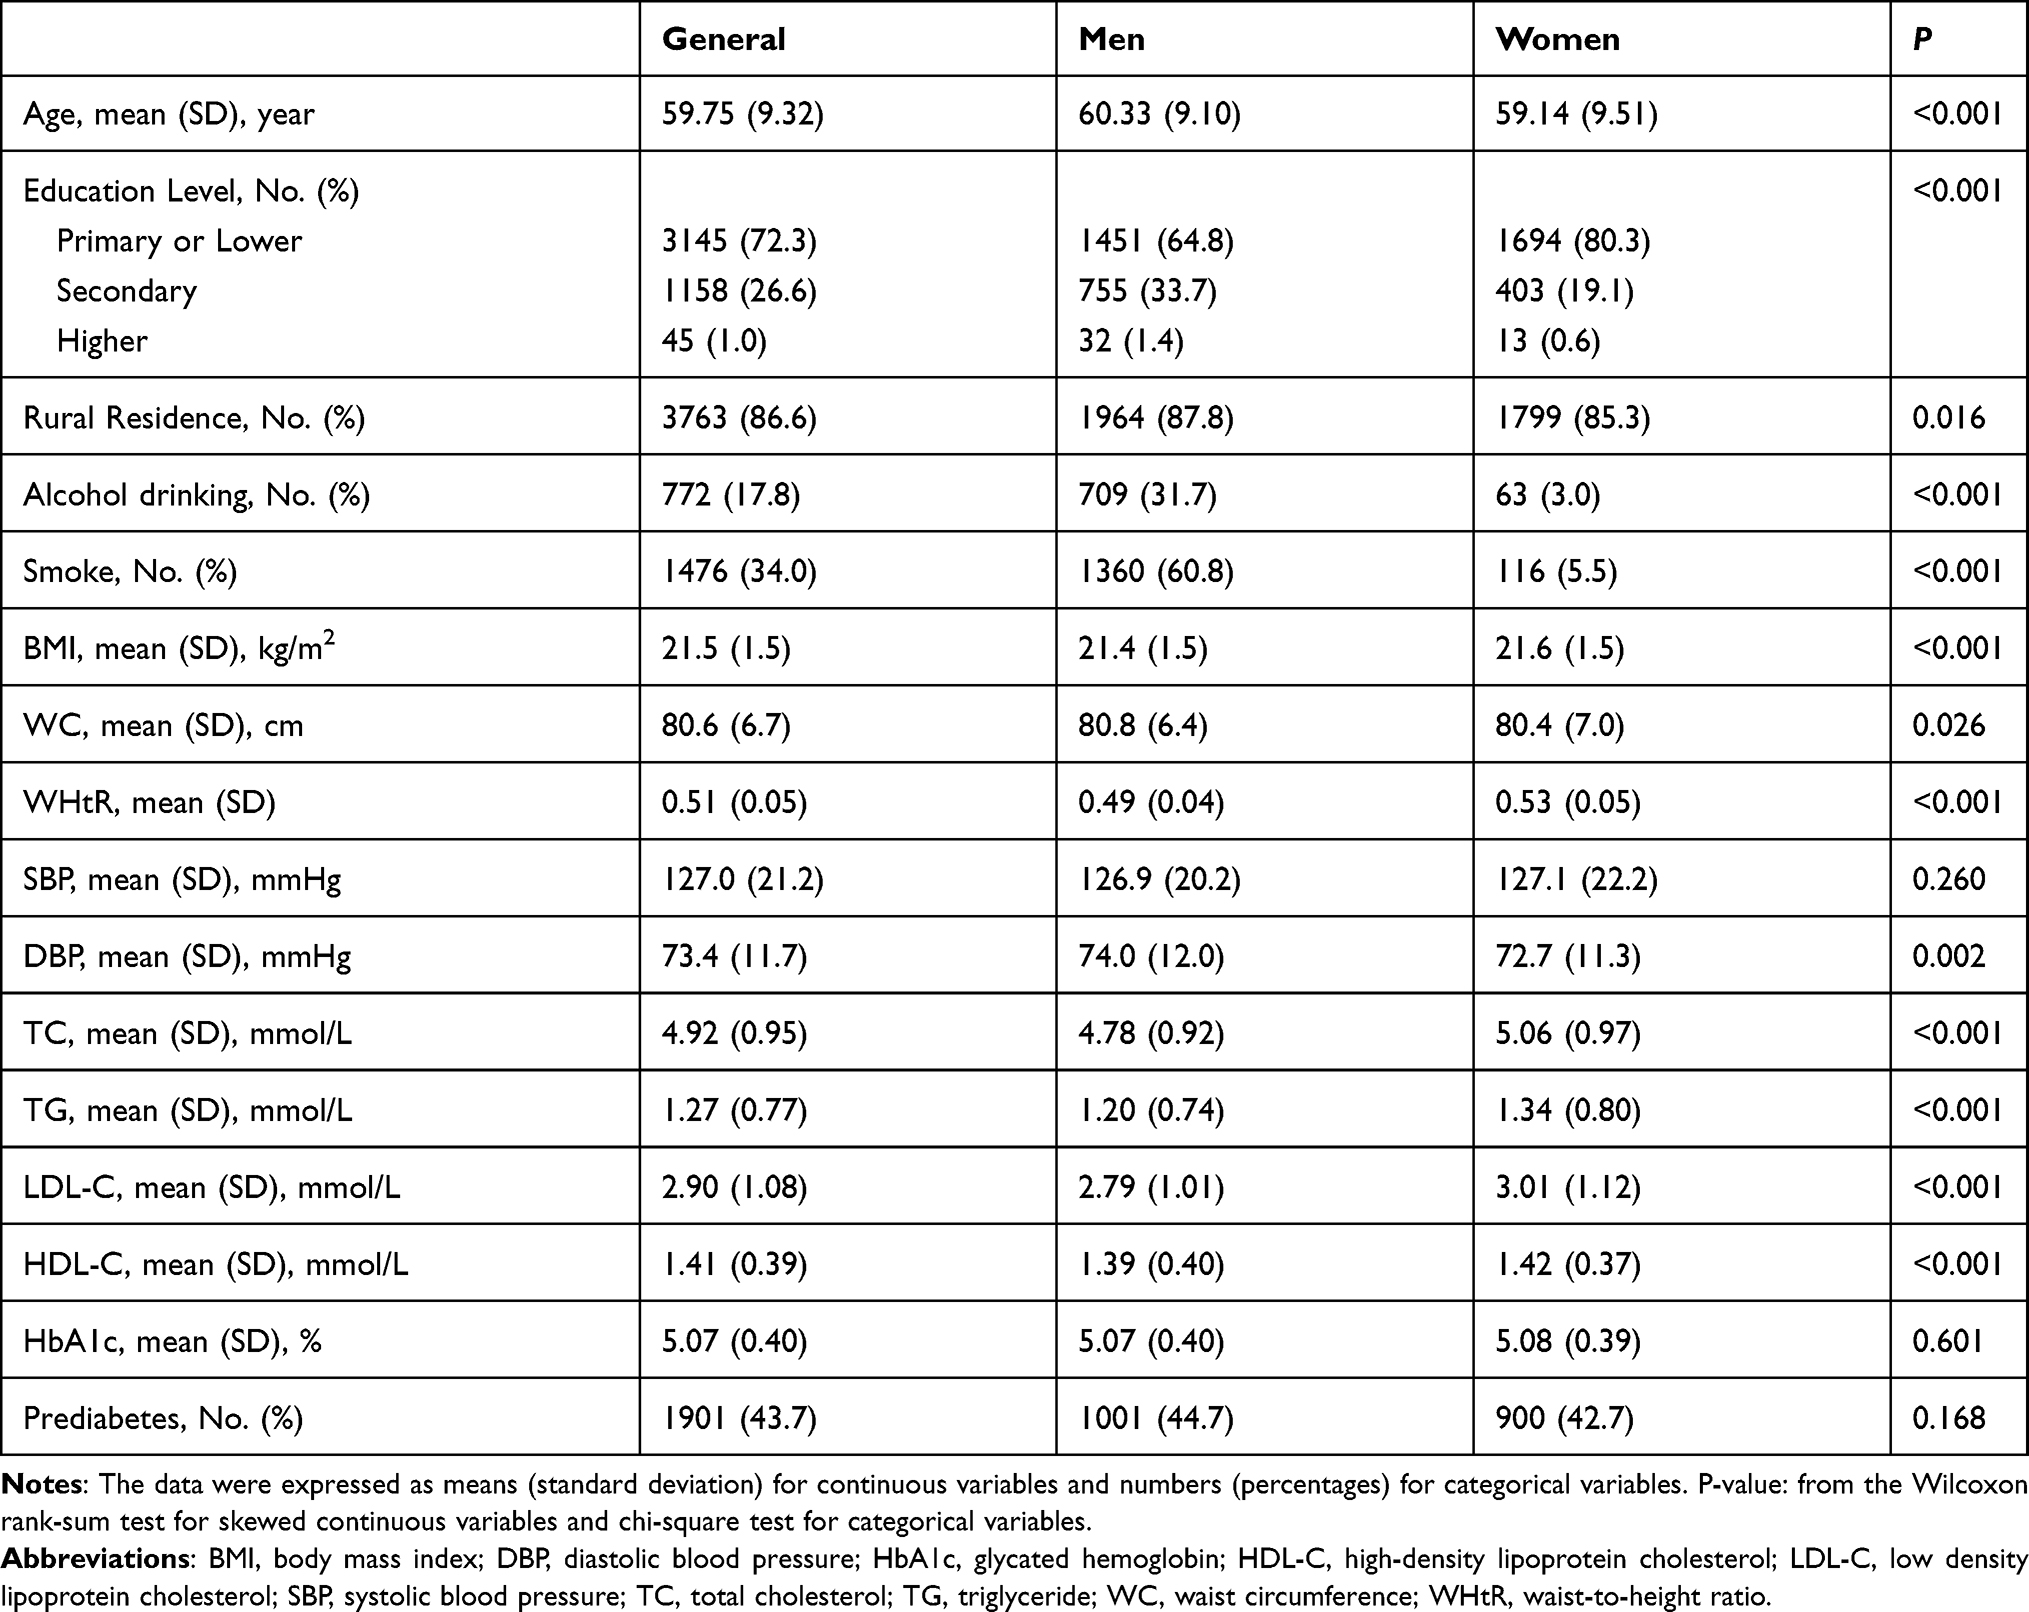 |
Table 1 Characteristics of the Study Population |
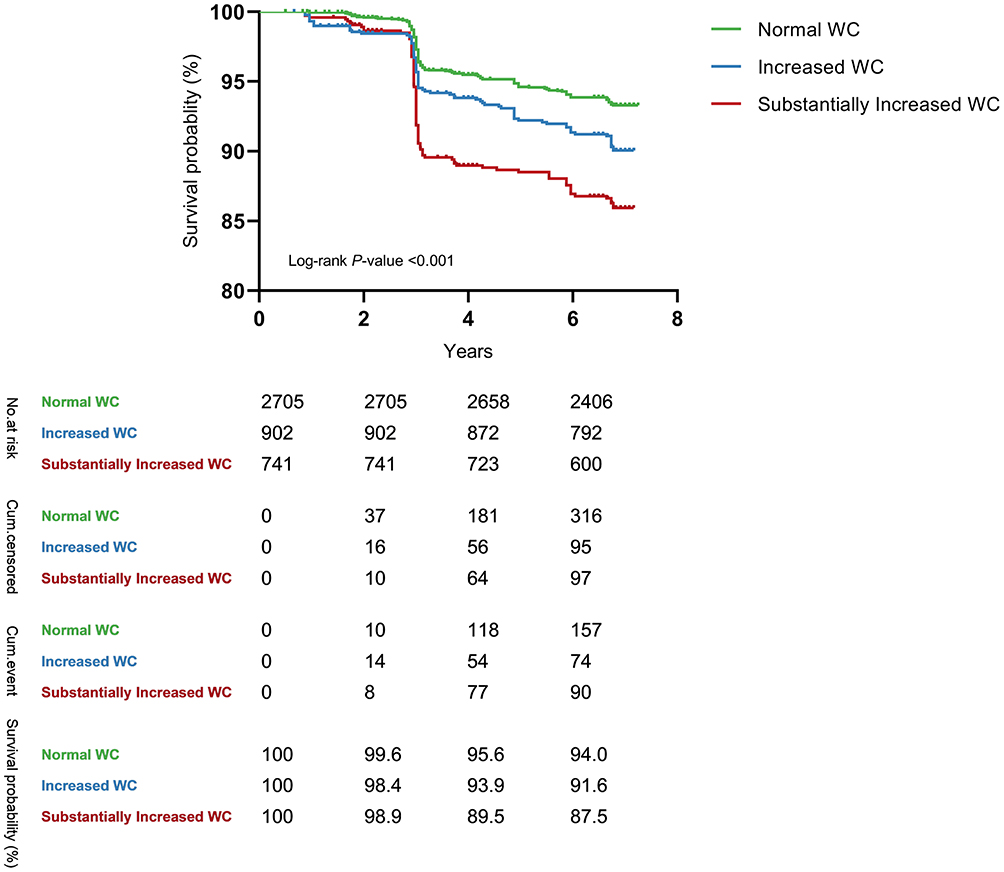 |
Figure 4 The Kaplan-Meier unadjusted survival estimates for different waist circumference groups. |
WC was positively and strongly associated with the risk of T2DM among normal-BMI participants (Table 2). The adjusted HRs for T2DM risk among participants with an increased WC (85–90 cm for men, 80–85 cm for women) and substantially increased WC (≥ 90 cm for men, ≥ 85 cm for women) were 1.39 (1.05–1.85) and 1.89 (1.42–2.53), respectively, when compared to those with normal WC (< 85 cm for men and < 80 cm for women, respectively) in Model 4.
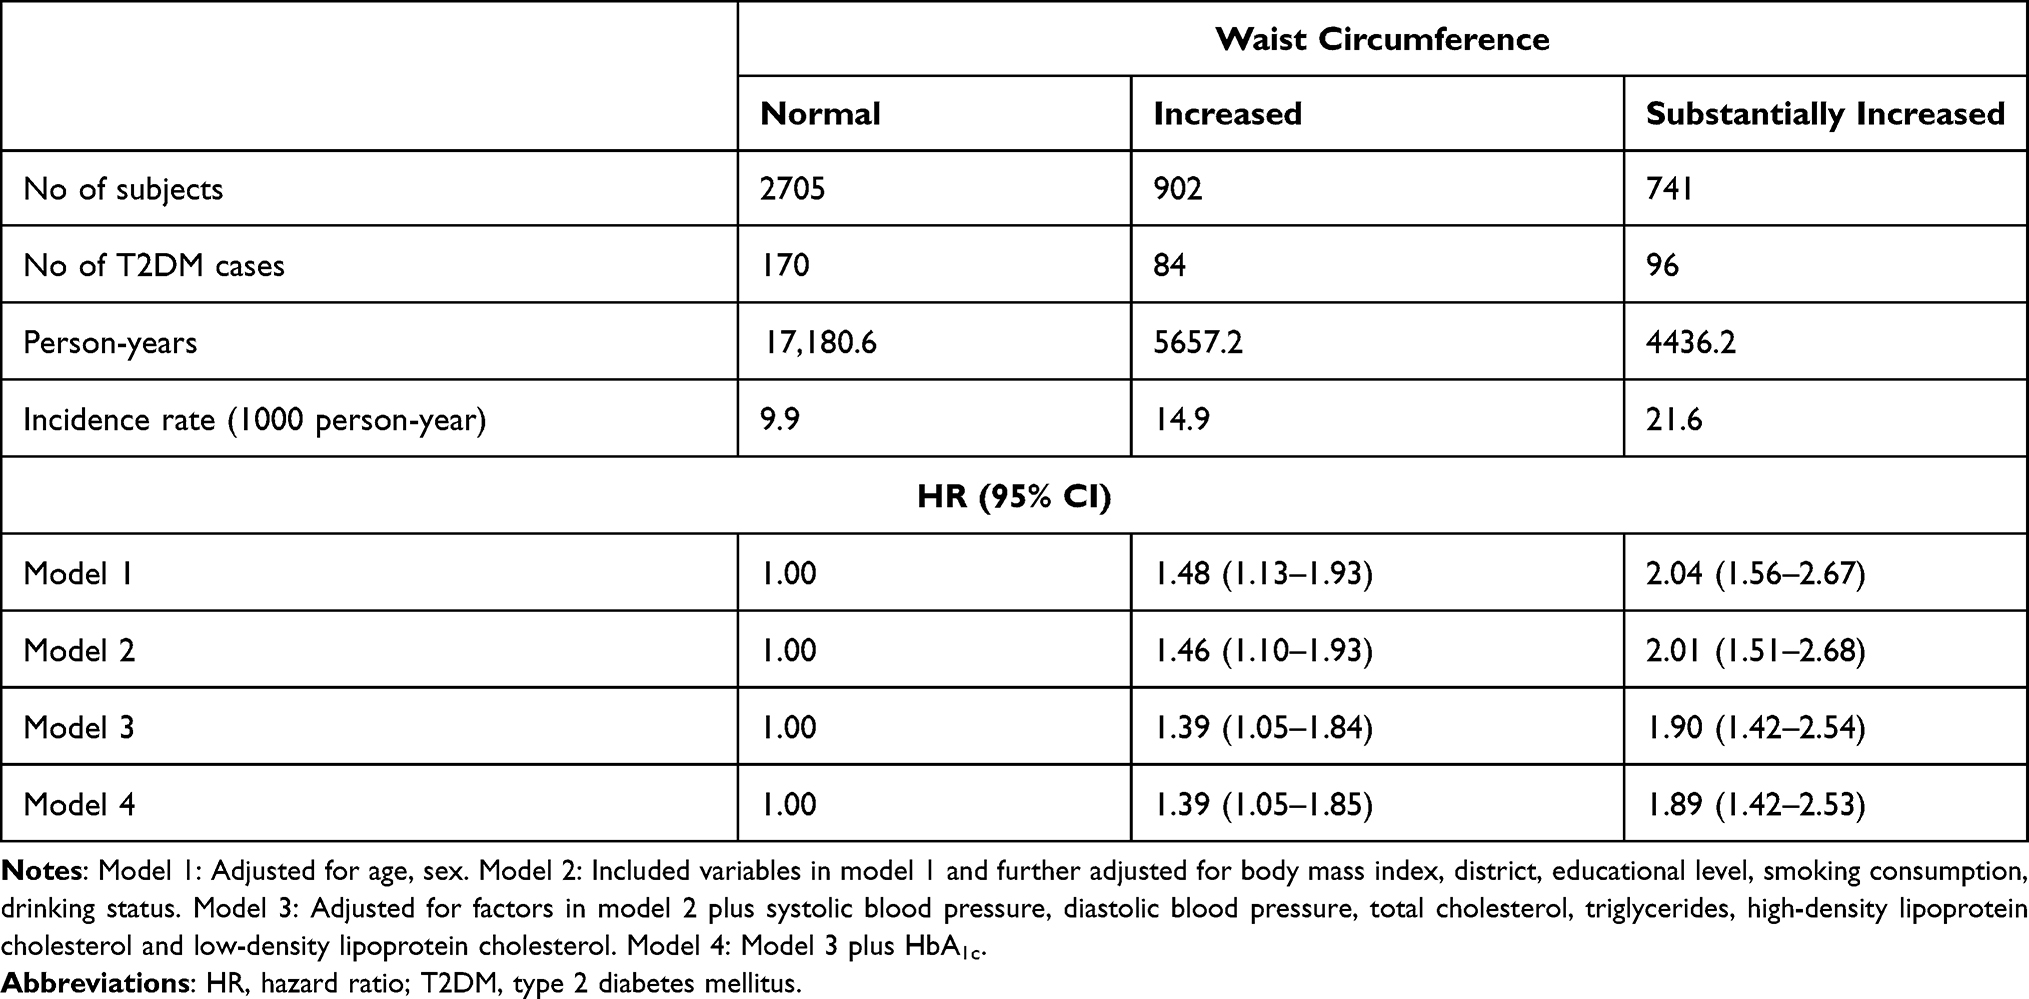 |
Table 2 Incidence of T2DM and Hazard Ratios (95% CI) of Waist Circumference in the Cox Proportional-Hazards Model |
No significant association was found between increased WC and the risk of T2DM for men and women. Significant associations were found between substantially increased WC and the risk of T2DM in women, whereas no significant association was observed in men. The risk of T2DM for women with WC > 85 cm significantly increased by 96% (HR: 1.96; 95% CI: 1.36–2.85) in comparison to those with normal WC (WC < 80) (Table 3).
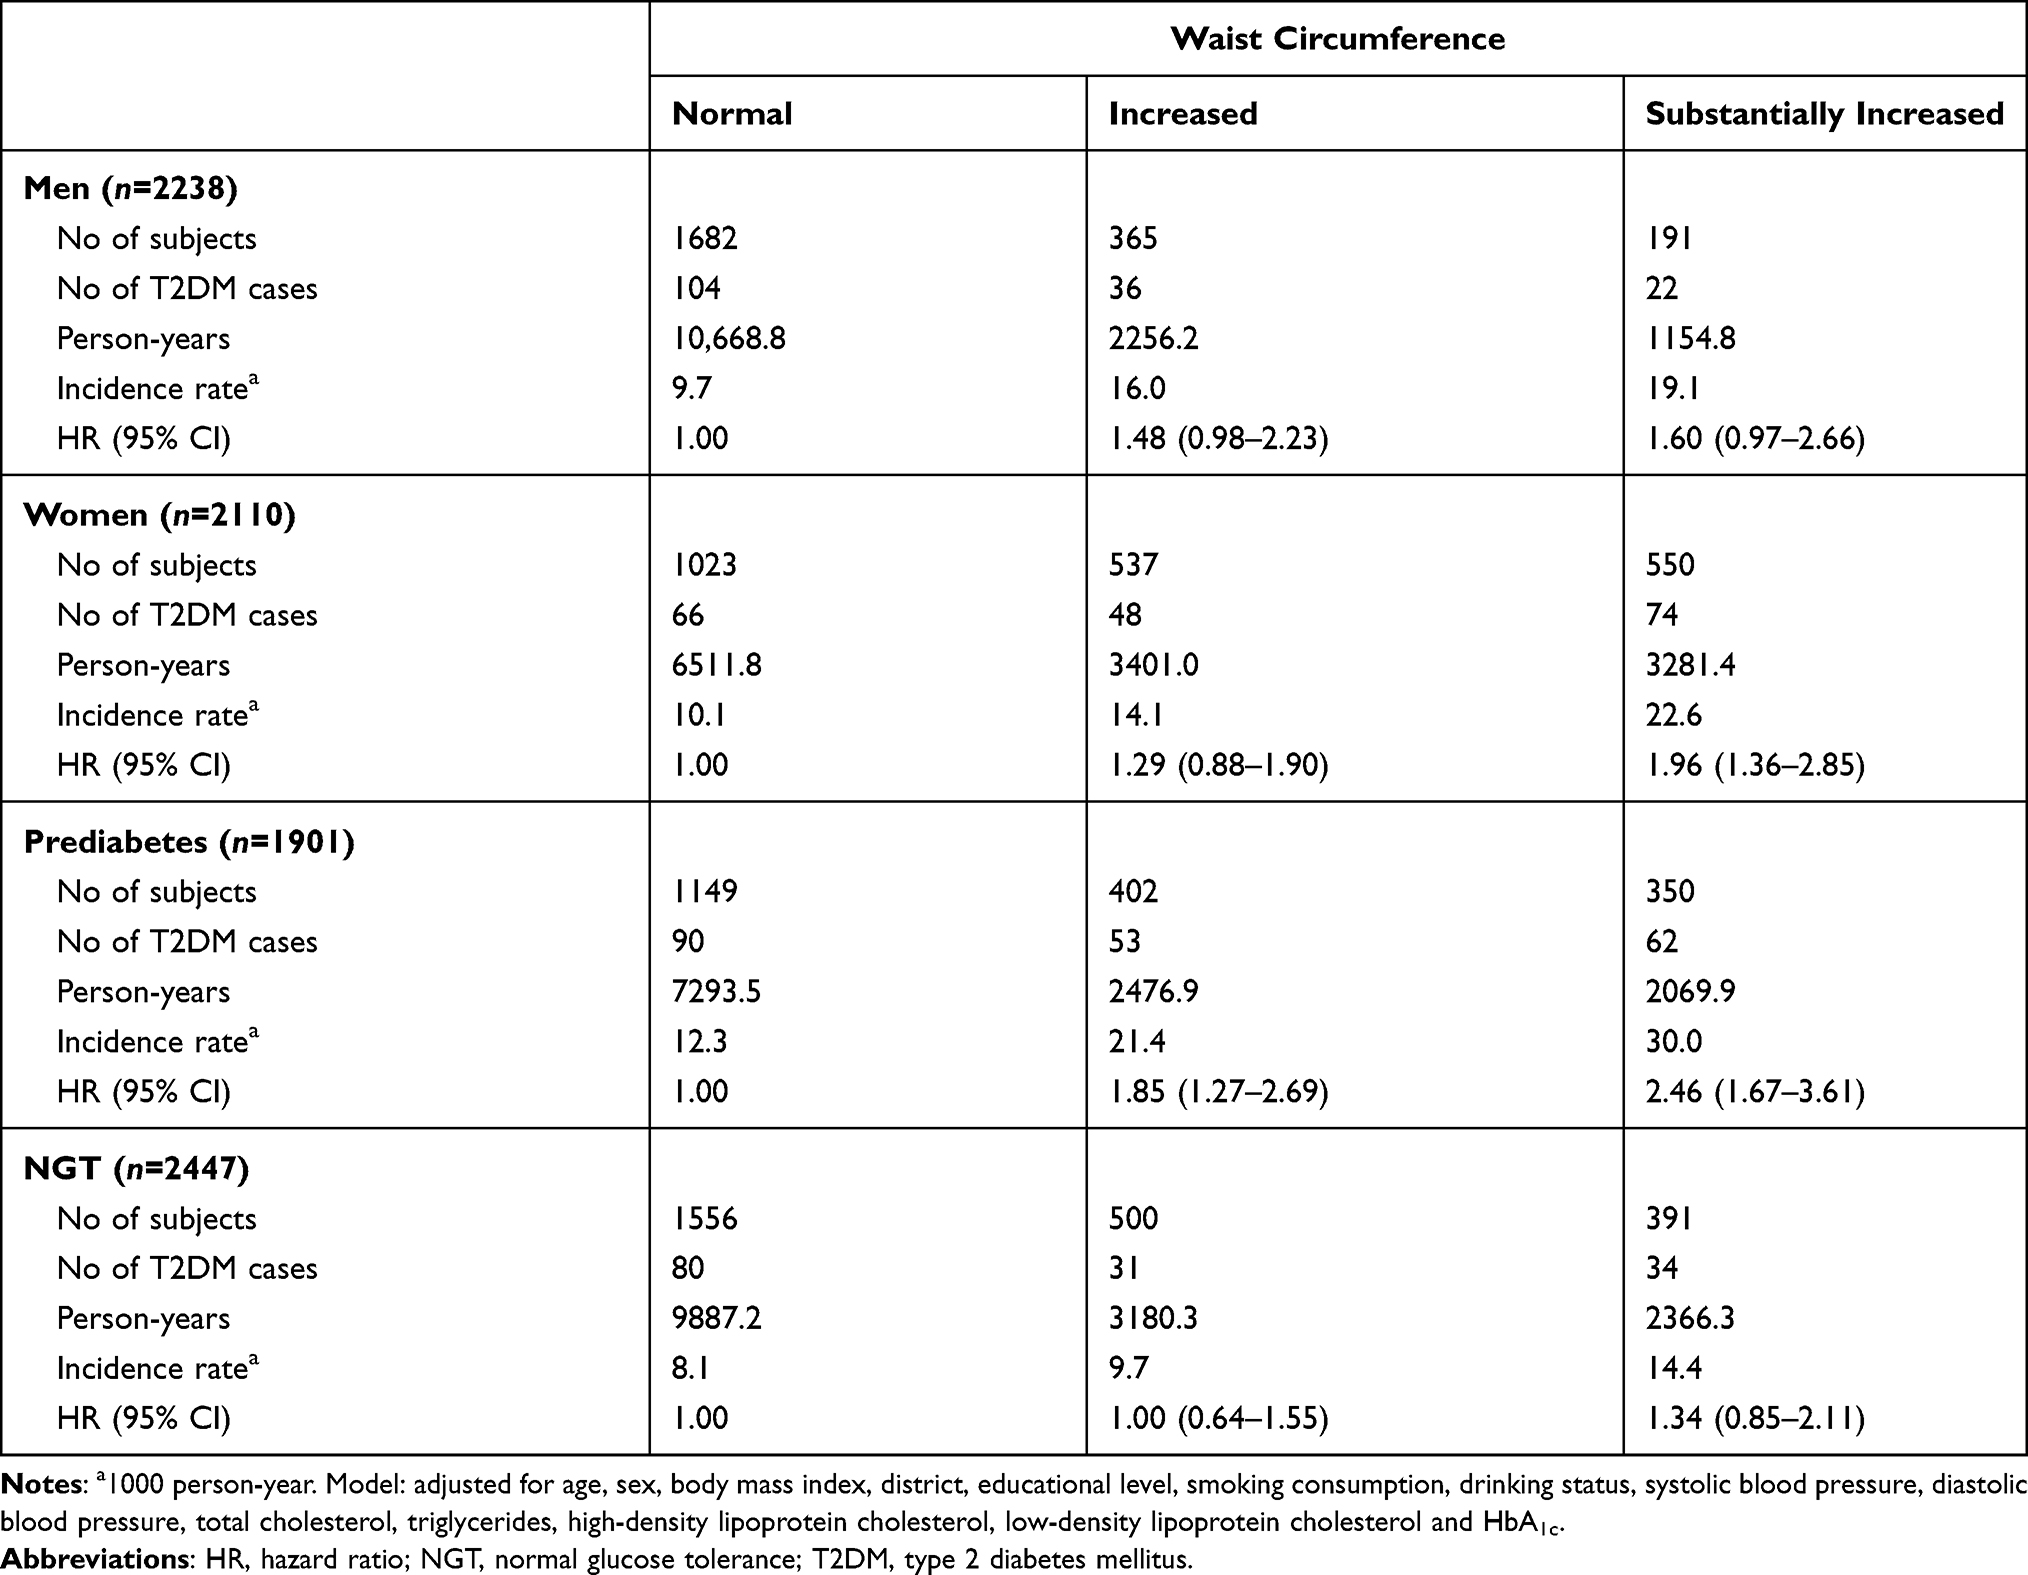 |
Table 3 Incidence of T2DM and Hazard Ratios (95% CI) of Waist Circumference for Different Subgroups in the Cox Proportional-Hazards Model |
The positive association between abdominal obesity and the incidence of T2DM was similar across the subgroups stratified by prediabetes status (Table 3). The HRs for T2DM incidence for participants with increased WC and substantially increased WC were 1.85 (95% CI: 1.27–2.69) and 2.46 (95% CI: 1.67–3.61) compared with individuals with normal WC among participants with prediabetes, which was significantly larger than for those with normal glucose tolerance (1.00 (95% CI: 0.64–1.55) and 1.34 (95% CI: 0.85–2.11), respectively). Furthermore, among participants with prediabetes, substantially increased WC was significantly associated with a higher risk of T2DM compared with the increased WC group.
Similar results for the association between increased or substantially increased WHtR and T2DM incidence were observed (Table S3 in the Supplement materials). Multiple sensitivity analyses confirmed the robust conclusion that abdominal obesity was an independent risk factor for T2DM (Figure 5; Table S4 in the Supplement materials). The estimated proportion of T2DM cases attributed to substantially increased WC (17.0% of the population) and substantially increased WHtR (26.6% of the population) was 13.2% (95% CI: 6.1%-20.3%) and 15.8% (95% CI: 6.1%-25.4%), respectively.
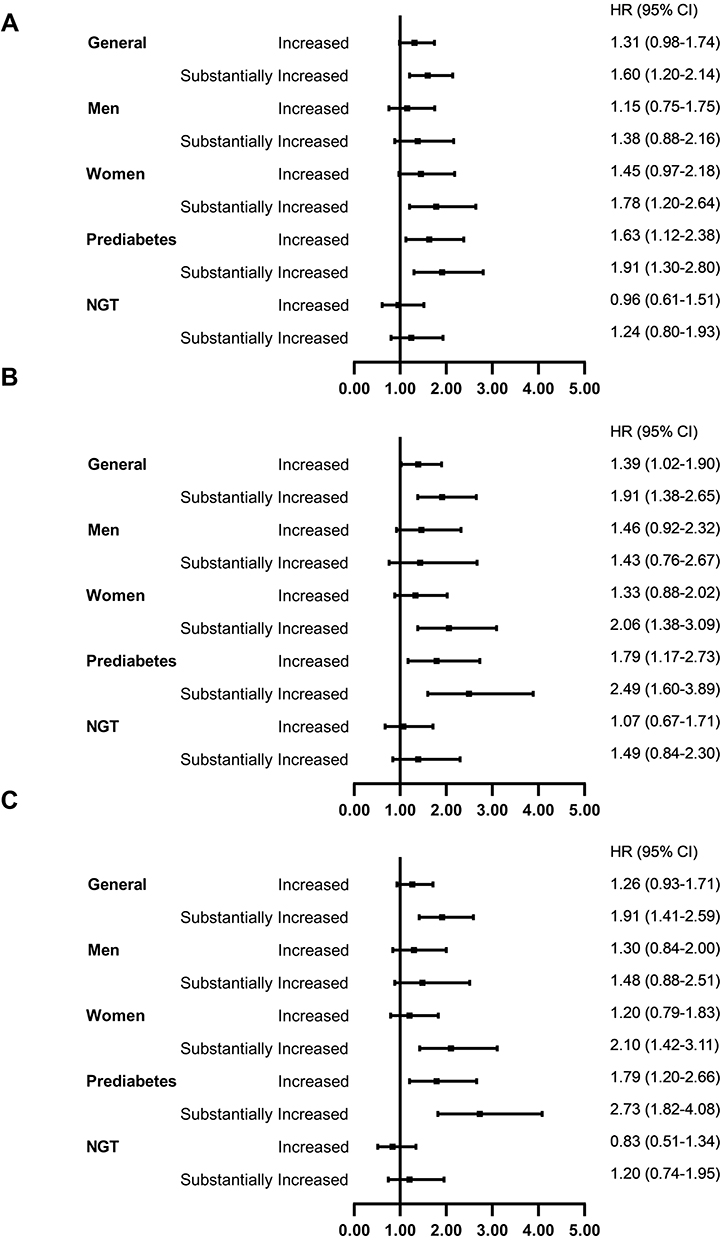 |
Figure 5 Sensitivity analyses using waist circumference to define abdominal obesity (A). Sensitivity analyses using Time-dependent Cox model. (B). Sensitivity analyses for participants with normal BMI throughout the follow-up (n=3451). (C). Sensitivity analyses for participants with more than 2 years of follow-up (n=4253). |
Discussion
Based on the data from the CHARLS, we aimed to study the prevalence of abdominal obesity among normal-BMI Chinese adults aged over 45 years and to examine its associated T2DM risk. A high prevalence of abdominal obesity was found in middle-aged and elderly Chinese adults with a normal BMI. We found a significant association between abdominal obesity and the incidence of T2DM in normal-BMI participants aged 45 years old or older. This association was further confirmed by subgroup analyses. Women and patients with prediabetes had a significant and stronger association than men and participants with normal glucose tolerance.
A recent cross-sectional study in China analyzed 441,306 participants and found that the prevalence of abdominal obesity (defined as WC ≥ 90 cm for men and WC ≥ 85 cm for women) was 7.9% (6.8% in men and 9.0% in women) for adults over 18 years old and with a BMI between 18.5–23.9 kg/m2.8 Our study observed that the overall prevalence of abdominal obesity (WC ≥ 90 cm for men and WC ≥ 85 cm for women) was 18.1%, and for normal-BMI adults over 45 years of age, it was 9.5% for men and 28.1% for women. A study of the prevalence of normal weight central obesity in general Chinese adults found that the prevalence of normal weight central obesity by WHtR (WHtR≥ 0.5) was 17.06% in 2011, 14.77% in men and 19.09% in women.25 In our study, the overall prevalence of participants with WHtR ≥ 0.5 was higher than that. A possible reason for the inconsistency may be the age differences between our study and the other study.
Using WC ≥ 90 cm for men and ≥ 85 cm for women as an abdominal obesity definition, one cross-sectional study, which included 10,634 Korean adults aged 19 years or more with a BMI between 18.5 and 24.9 kg/m2, found that the odds ratios of abdominal obesity for the risk of diabetes were 1.716 (95% CI: 1.133–2.598) in men and 1.408 (95% CI: 0.939–2.112) in women.26 Using WHtR as a definition, a cross-sectional study including 117,163 Japanese participants aged 40–64 years found odds ratios for diabetes of 1.35 (95% CI: 1.25–1.46) in men and 1.60 (95% CI: 1.35–1.90) in women.27 Defining normal-weight central obesity (NWCO) as a combination of a BMI between 18.5–23.9 kg/m2 and 1) a WC of > 85 cm in men or > 80 cm in women (NWCO by WC) or 2) a waist-to-height ratio of ≥ 0.5 (NWCO by WHtR), a cross-sectional study including 4244 Chinese individuals aged 18 years or more found that the odds ratios of NWCO were 1.64 (95% CI: 1.24–2.16) and 1.67 (95% CI: 1.27–2.19) in men and women, respectively, when compared to those with normal weight and no central obesity.25
However, those previous studies were based on cross-sectional surveys. Our study, based on data from the CHARLS, which is a large population-based and well-designed prospective study, confirmed that abdominal obesity is an independent risk factor for T2DM in adults with a normal BMI. The risk of T2DM for normal-BMI participants with substantially increased WC or substantially increased WHtR significantly increased by 89% (HR: 1.89; 95% CI: 1.42–2.53) and 70% (HR: 1.70; 95% CI: 1.26–2.30) in comparison to those with normal WC or WHtR, respectively. In our study, when the participants were stratified by gender, the association between abdominal obesity remained significant in women but not in men. This can be accounted for by the fact that a large group of male participants with abdominal obesity was already excluded due to their unhealthy BMI. This assumption was also verified by Flegal’s study, which showed that BMI tends to be more strongly correlated with WC in men than in women.15
The mechanisms underlying the association of abdominal obesity and the risk of T2DM have been previously elucidated in a few studies.28–31 Abdominal obesity has been proposed to be a marker of increased visceral and ectopic fat deposition and it is characterized by adipocyte dysfunction, inflammatory and adipokine dysregulation, insulin resistance, and impaired insulin secretion.29,32 Inflammation caused by expanded visceral adipose tissue results in increased leptin levels as a result of the increased production of inflammatory cytokines and decreased production of protective adipokines and adiponectin. Chronic, low-grade inflammation caused by altered adipokine secretion may impair glucose tolerance and contribute to the diabetes risk.33,34 In the setting of adipocyte dysfunction, several impairments in liver metabolism can be caused by the exposure to high concentrations of free fatty acids and glycerol from excess visceral adiposity and this can lead to reduced hepatic extraction of insulin (exacerbating hyperinsulinemia) and increased production of hepatic glucose, which explains the link between visceral obesity, glucose intolerance and type 2 diabetes.27,30 It is also known that age, sex, genetics, and ethnicity are broad etiological factors contributing to the variations in visceral adipose tissue accumulation.29,35
Our study has several major strengths. First, based on a representative nationwide sample of the CHARLS, this is the first Chinese study to report the prevalence of abdominal obesity defined by WC and WHtR and to assess its association with the risk of T2DM in Chinese middle-aged and older adults with normal BMI. Furthermore, benefiting from the detailed information from the CHARLS, we adjusted for potential confounding factors for each participant from standardized procedures, including the standard questionnaire, physical examination, and laboratory tests. Last, we enhanced the robustness of our findings by performing extensive subgroup studies by gender and prediabetes status and conducting multiple sensitivity analyses.
This study also has some limitations. First, blood biochemical tests were only performed every two years of follow-up, which may lead to missed diagnoses. Postprandial random glucose was used instead of 2 hours postprandial glucose. Second, this study only focused on the middle-aged and older population, which does not enable us to calculate the prevalence of abdominal obesity in adults under 45 years old. Similarly, the association of abdominal obesity and T2DM risk may not be generalizable across all age groups and different races.
Conclusion
In conclusion, the prevalence of abdominal obesity in middle-aged or older normal-BMI Chinese adults is relatively high, especially among women and T2DM patients. There was an independent positive association of abdominal obesity defined by waist circumference and waist-to-height ratio with the risk of diabetes among normal-BMI participants. It is essential to monitor abdominal obesity and reduce abdominal fat, especially among women and patients with prediabetes.
Abbreviations
BMI, body mass index; T2DM, type 2 diabetes mellitus; WC, waist circumference; CHARLS, the China Health and Retirement Longitudinal Study; WHtR, waist-to-height ratio; TC, total cholesterol; LDL-C, low-density lipoprotein cholesterol; HDL-C, high-density lipoprotein cholesterol; TGs, triglycerides; HbA1c, glycated hemoglobin; SBP, systolic blood pressure; DBP, diastolic blood pressure; IFG, impaired fasting glucose; FPG, fasting plasma glucose; IGT, impaired glucose tolerance; 2-h PG, 2-h plasma glucose; HR, hazard ratios; CI, confidence interval; PAR, population-attributable risk; NWCO, normal-weight central obesity.
Data Sharing Statement
This analysis uses data or information from the Harmonized CHARLS dataset and Codebook, Version C, as of April 2018 developed by the Gateway to Global Aging Data. The development of the Harmonized CHARLS was funded by the National Institute on Ageing (R01 AG030153, RC2 AG036619, R03 AG043052). For more information, please refer to www.g2aging.org.
Ethics Approval and Informed Consent
The survey was approved by the Institutional Review Board of Peking University, China (IRB00001052-11014 and IRB00001052-11015). This cohort study followed the principles of the Declaration of Helsinki. Each respondent who agreed to participate in the survey provided their written informed consent before taking part in CHARLS. This study was approved by the Ethics Committee of Capital Medical University, China (Z2020SY118).15
Consent for Publication
Consent for publication was obtained from the all the authors.
Acknowledgments
We thank all the individuals who took part in CHARLS and all the researchers, clinicians and administrative staff who have enabled this survey to be carried out.
Author Contributions
D.Z., X.C., L.W. and Y.H. conceived of and designed the study. D.Z. and H.L. acquired the data. M.D., and X.C. contributed to data cleaning. All authors contributed to data analysis, drafting or revising the article, have agreed on the journal to which the article will be submitted, gave final approval of the version to be published, and agree to be accountable for all aspects of the work.
Funding
This work was supported by grants from the Natural Science Foundation of Beijing Municipality [grant number 7202011], the National Natural Science Foundation of China [grants numbers 82073648 and 81703317], and the China Scholarship Council.
Disclosure
All authors report no conflicts of interest in this work.
References
1. International Diabetes Federation. IDF Diabetes Atlas.
2. Li Y, Teng D, Shi X, et al. Prevalence of diabetes recorded in mainland China using 2018 diagnostic criteria from the American Diabetes Association: national cross sectional study. BMJ. 2020;369:m997. doi:10.1136/bmj.m997
3. World Health Organization. Global Report on Diabetes. 2016, April 21.
4. Ying W, Fu W, Lee YS, Olefsky JM. The role of macrophages in obesity-associated islet inflammation and β-cell abnormalities. Nat Rev Endocrinol. 2020;16(2):81–90. doi:10.1038/s41574-019-0286-3
5. American Diabetes Association. Prevention or Delay of Type 2 Diabetes: standards of Medical Care in Diabetes—2020. Diabetes Care. 2020;43(Suppl Supplement 1):S32–S36. doi:10.2337/dc20-S003
6. Chinese Diabetes Society. Guideline for the prevention and treatment of type 2 diabetes mellitus in China (2020 edition) [in Chinese]. Chin J Endocrinol Metab. 2021;37(04):311–398.
7. Wang Y, Xue H, Sun M, Zhu X, Zhao L, Yang Y. Prevention and control of obesity in China. Lancet Glob Health. 2019;7(9):e1166–e1167. doi:10.1016/S2214-109X(19)30276-1
8. Zhang L, Wang Z, Wang X, et al. Prevalence of abdominal obesity in china: results from a cross-sectional study of nearly half a million participants. Obesity. 2019;27(11):1898–1905. doi:10.1002/oby.22620
9. Ashwell M, Gunn P, Gibson S. Waist-to-height ratio is a better screening tool than waist circumference and BMI for adult cardiometabolic risk factors: systematic review and meta-analysis. Obes Rev. 2012;13(3):275–286. doi:10.1111/j.1467-789X.2011.00952.x
10. Ashwell M, Lejeune S, McPherson K. Ratio of waist circumference to height may be better indicator of need for weight management. BMJ. 1996;312(7027):377. doi:10.1136/bmj.312.7027.377
11. Lee CMY, Huxley RR, Wildman RP, Woodward M. Indices of abdominal obesity are better discriminators of cardiovascular risk factors than BMI: a meta-analysis. J Clin Epidemiol. 2008;61(7):646–653. doi:10.1016/j.jclinepi.2007.08.012
12. Patel SA, Ali MK, Alam D, et al. Obesity and its Relation With Diabetes and Hypertension: a Cross-Sectional Study Across 4 Geographical Regions. Glob Heart. 2016;11(1):71–79.e4. doi:10.1016/j.gheart.2016.01.003
13. Tyrovolas S, Koyanagi A, Garin N, et al. Diabetes mellitus and its association with central obesity and disability among older adults: a global perspective. Exp Gerontol. 2015;64:70–77. doi:10.1016/j.exger.2015.02.010
14. Wang T, Zhang R, Ma X, et al. Causal Association of Overall Obesity and Abdominal Obesity with Type 2 Diabetes: a Mendelian Randomization Analysis. Obesity. 2018;26(5):934–942. doi:10.1002/oby.22167
15. Flegal KM, Shepherd JA, Looker AC, et al. Comparisons of percentage body fat, body mass index, waist circumference, and waist-stature ratio in adults. Am J Clin Nutr. 2009;89(2):500–508. doi:10.3945/ajcn.2008.26847
16. Zhao Y, Hu Y, Smith JP, Strauss J, Yang G. Cohort profile: the China Health and Retirement Longitudinal Study (CHARLS). Int J Epidemiol. 2014;43(1):61–68. doi:10.1093/ije/dys203
17. WHO Expert Consultation. Appropriate body-mass index for Asian populations and its implications for policy and intervention strategies. Lancet. 2004;363(9403):157–163. doi:10.1016/S0140-6736(03)15268-3
18. Caleyachetty R, Barber TM, Mohammed NI, et al. Ethnicity-specific BMI cutoffs for obesity based on type 2 diabetes risk in England: a population-based cohort study. Lancet Diabetes Endocrinol. 2021;9(7):419–426. doi:10.1016/S2213-8587(21)00088-7
19. He W, Li Q, Yang M, et al. Lower BMI cutoffs to define overweight and obesity in China. Obesity. 2015;23(3):684–691. doi:10.1002/oby.20995
20. Zhou B-F. Predictive values of body mass index and waist circumference for risk factors of certain related diseases in Chinese adults–study on optimal cut-off points of body mass index and waist circumference in Chinese adults. Biomed Environ Sci. 2002;15(1):83–96.
21. Chen C, Lu FC. The guidelines for prevention and control of overweight and obesity in Chinese adults. Biomed Environ Sci. 2004;17:
22. Pan X-F, Wang L, Pan A. Epidemiology and determinants of obesity in China. Lancet Diabetes Endocrinol. 2021;9(6):373–392. doi:10.1016/S2213-8587(21)00045-0
23. Chen X, Crimmins E, Hu PP, et al. Venous Blood-Based Biomarkers in the China Health and Retirement Longitudinal Study: rationale, Design, and Results From the 2015 Wave. Am J Epidemiol. 2019;188(11):1871–1877. doi:10.1093/aje/kwz170
24. American Diabetes Association. 2. Classification and Diagnosis of Diabetes. Diabetes Care. 2020;43(Suppl 1):S14–S31. doi:10.2337/dc20-S002
25. Song P, Li X, Bu Y, et al. Temporal trends in normal weight central obesity and its associations with cardiometabolic risk among Chinese adults. Sci Rep. 2019;9(1):5411. doi:10.1038/s41598-019-41986-5
26. Kim HY, Kim JK, Shin GG, Han JA, Kim JW. Association between Abdominal Obesity and Cardiovascular Risk Factors in Adults with Normal Body Mass Index: based on the Sixth Korea National Health and Nutrition Examination Survey. J Obes Metab Syndr. 2019;28(4):262–270. doi:10.7570/jomes.2019.28.4.262
27. Shirasawa T, Ochiai H, Yoshimoto T, et al. Associations between normal weight central obesity and cardiovascular disease risk factors in Japanese middle-aged adults: a cross-sectional study. J Health Popul Nutr. 2019;38(1):46. doi:10.1186/s41043-019-0201-5
28. Gastaldelli A, Cusi K, Pettiti M, et al. Relationship between hepatic/visceral fat and hepatic insulin resistance in nondiabetic and type 2 diabetic subjects. Gastroenterology. 2007;133(2):496–506. doi:10.1053/j.gastro.2007.04.068
29. Tchernof A, Després J-P. Pathophysiology of human visceral obesity: an update. Physiol Rev. 2013;93(1):359–404. doi:10.1152/physrev.00033.2011
30. Kahn SE, Hull RL, Utzschneider KM. Mechanisms linking obesity to insulin resistance and type 2 diabetes. Nature. 2006;444(7121):840–846. doi:10.1038/nature05482
31. Wang Y, Rimm EB, Stampfer MJ, Willett WC, Hu FB. Comparison of abdominal adiposity and overall obesity in predicting risk of type 2 diabetes among men. Am J Clin Nutr. 2005;81(3):555–563. doi:10.1093/ajcn/81.3.555
32. Neeland IJ, Ross R, Després J-P, et al. Visceral and ectopic fat, atherosclerosis, and cardiometabolic disease: a position statement. Lancet Diabetes Endocrinol. 2019;7(9):715–725. doi:10.1016/S2213-8587(19)30084-1
33. Katsiki N, Mikhailidis DP, Banach M. Leptin, cardiovascular diseases and type 2 diabetes mellitus. Acta Pharmacol Sin. 2018;39(7):1176–1188. doi:10.1038/aps.2018.40
34. López-Jaramillo P, Gómez-Arbeláez D, López-López J, et al. The role of leptin/adiponectin ratio in metabolic syndrome and diabetes. Horm Mol Biol Clin Investig. 2014;18(1):37–45. doi:10.1515/hmbci-2013-0053
35. Faulds MH, Zhao C, Dahlman-Wright K, Gustafsson J-Å. The diversity of sex steroid action: regulation of metabolism by estrogen signaling. J Endocrinol. 2012;212(1):3–12. doi:10.1530/JOE-11-0044
 © 2021 The Author(s). This work is published and licensed by Dove Medical Press Limited. The full terms of this license are available at https://www.dovepress.com/terms.php and incorporate the Creative Commons Attribution - Non Commercial (unported, v3.0) License.
By accessing the work you hereby accept the Terms. Non-commercial uses of the work are permitted without any further permission from Dove Medical Press Limited, provided the work is properly attributed. For permission for commercial use of this work, please see paragraphs 4.2 and 5 of our Terms.
© 2021 The Author(s). This work is published and licensed by Dove Medical Press Limited. The full terms of this license are available at https://www.dovepress.com/terms.php and incorporate the Creative Commons Attribution - Non Commercial (unported, v3.0) License.
By accessing the work you hereby accept the Terms. Non-commercial uses of the work are permitted without any further permission from Dove Medical Press Limited, provided the work is properly attributed. For permission for commercial use of this work, please see paragraphs 4.2 and 5 of our Terms.