")
Back to Journals » Clinical and Experimental Gastroenterology » Volume 13
Prevalence and Risk Factors of Hyperuricemia in Patients with Chronic Kidney Disease and Non-Alcoholic Fatty Liver
Authors Golmohammadi S, Tavasoli M, Asadi N
Received 31 March 2020
Accepted for publication 27 July 2020
Published 20 August 2020 Volume 2020:13 Pages 299—304
DOI https://doi.org/10.2147/CEG.S253619
Checked for plagiarism Yes
Review by Single anonymous peer review
Peer reviewer comments 2
Editor who approved publication: Professor Andreas M. Kaiser
Sima Golmohammadi,1,2 Marjan Tavasoli,1 Nadia Asadi1,2
1Clinical Research Development Center, Imam Reza Hospital, Kermanshah University of Medical Sciences, Kermanshah, Iran; 2Department of Internal Medicine, School of Medicine, Kermanshah University of Medical Sciences, Kermanshah, Iran
Correspondence: Nadia Asadi Email [email protected]
Background/Aims: The number of patients with nonalcoholic fatty liver disease (NAFLD) and chronic kidney disease (CKD) is on the rise. Epidemiological studies have shown the role of hyperuricemia in the development of NAFLD and CKD through oxidative stress and inflammatory mediators. Therefore, this study was conducted to investigate the prevalence and risk factors of hyperuricemia in patients with CKD and NAFLD in Iran.
Patients and Methods: This study was conducted in 450 CKD patients. NAFLD was diagnosed by ultrasonography. According to the serum uric acid level, all CKD+ NAFLD+ patients were divided into non-hyperuricemia and hyperuricemia groups. The patients’ demographic and clinical data such as age, sex, abdominal obesity, metabolic syndrome, diabetes, hypertension, CRP, hepatic steatosis, blood pressure, serum uric acid (UA), lipid and creatinine were collected for analysis.
Results: A total of 279 cases (62%) were diagnosed with NAFLD. The prevalence rate of NFALD in CKD patients was significantly lower in normal UA level than hyperuricemia (42.7% vs 57.3%) (P=0.039). The prevalence of hyperuricemia was about 57.3% in patients with CKD and NAFLD. Accordingly, 279 CKD patients with NAFLD were enrolled and divided into hyperuricemia (n =160) and non-hyperuricemia groups (n =119). Patients with hyperuricemia showed higher creatinine and lipid levels, and a lower GFR compared to patients with normal uric acid levels (P< 0.05). However, no significant difference was observed in age, sex, abdominal obesity, metabolic syndrome, hypertension, type 2 diabetes, CRP, and steatosis between hyperuricemia and non-hyperuricemia groups (P> 0.05). Three factors, including type 2 diabetes, hyperlipidemia, and a low GFR, serve as independent risk factors for hyperuricemia (P< 0.05).
Conclusion: The results showed a high prevalence of hyperuricemia in patients with CKD and NAFLD. A more comprehensive strategic management is necessary to address the potential harmful effects of hyperuricemia on the health of CKD+ NAFLD+ cases.
Keywords: hyperuricemia, serum uric acid, chronic kidney disease, non-alcoholic fatty liver disease, Iran
Introduction
Chronic kidney disease (CKD) or chronic kidney failure is defined as a gradual loss of kidney function. It is an important cause of morbidity and mortality, and is rapidly becoming a major burden on the global health-care system.1 The prevalence of CKD is estimated at about 15.14% in Iranian general population2 There is a substantial interest in identifying the causes and risk factors of CKD to reduce its global burden.
Uric acid (C5H4N4O3) is a heterocyclic organic compound and the final product of purine metabolism. Purine nucleosides are converted to uric acid from adenosine and guanosine.3 Hyperuricemia (serum uric acid (SUA) level >7.0 mg/dL in men and >5.7 mg/dL in women) is an independent determinant of hypertension, diabetes, metabolic syndrome, CKD, and cardiovascular events.4,5 We have previously shown that the use of allopurinol as an inhibitor of the production of uric acid slows down stage 3 chronic kidney disease progression.6
The increasing prevalence of hyperuricemia is considered as an emerging public health concern. Many factors such as dietary and lifestyle changes, excess weight, population aging, and increased prescription of antihypertensive drugs may be associated with an increase in the risk for hyperuricemia.7 Increasing evidence indicates a close relationship between hyperuricemia and NAFLD, and elevated UA levels increase the prevalence of NAFLD.8 NAFLD is characterized by lipid accumulation in hepatocytes without excessive alcohol consumption or other liver diseases.9,10 Increased oxidative stress and lipid peroxidation injury contribute to the development and progression of NAFLD.10 Hyperuricemia induces pro-inflammatory and pro-oxidative mediators, which may lead to hepatocellular damage through elevated liver enzymes and the subsequent development of NAFLD.11
It is becoming increasingly clear that there is a correlation between CKD and NAFLD. A high incidence and prevalence of CKD are observed in patients with NAFLD compared to patients without NAFLD.12,13 Thus, NAFLD and CKD are related to the same group of risk factors including hyperuricemia, insulin resistance, oxidative stress biomarkers and hypertension.12,14 Several epidemiological studies have assessed the prevalence of hyperuricemia and its correlates in different population.15,16 To the best of our knowledge, no study has investigated risk factors of hyperuricemia in patients with CKD and NAFLD. Hence, this study was conducted to determine the prevalence and correlates of hyperuricemia in CKD and NAFLD patients.
Patients and Methods
Study Design and Subjects
This case control study initially enrolled all adult patients with CKD who consecutively presented to Mahdiyeh Clinic affiliated with Kermanshah University of Medical Sciences, Kermanshah, Iran, from April 2016 to March 2017. Subjects meeting the following criteria were excluded: a history of alcohol consumption (≥30 g/day in men or ≥20 g/day in women), positive hepatitis B surface antigen or hepatitis C virus antibodies, a history of cirrhosis of any etiology, gout, cancer, corticosteroid and drugs affecting SUA consumption, and pregnancy or lactating women. All patients were evaluated for non-alcoholic fatty liver. A diagnosis of NAFLD was made according to the clinical evidence, liver enzymes, and ultrasonography criteria. Then, patients without NAFLD were excluded from the study. Eventually, according to the serum uric acid level, all CKD+ NAFLD+ patients were divided into normal uric acid and hyperuricemia groups. Written informed consent was obtained from all participants. Hyperuricemia was defined as serum uric acid >70 mg/l in males and >60 mg/l in females.
Clinical Examination and Biochemical Analyses
Demographic data such as age, sex and medical history were gathered through interview with patients during screening. A fasting blood sample was obtained from each subject in the morning. Laboratory measurements included high-sensitivity C-reactive protein (CRP), serum creatinine concentration, high‑density lipoprotein cholesterol (HDL-C), total triglycerides, SUA and fasting insulin. All measurements were done by an automatic biochemical analyser using standard methods (Hitachi 902 autoanalyzer, Japan) using standard methods. The glomerular filtration rate (eGFR) rate was estimated using the four-variable Modification of Diet in Renal Disease (MDRD) formula. CKD was defined as the presence of an eGFR < 60 mL/min/1.73 m2 and/or abnormal albuminuria.
Blood pressure was measured by a standard sphygmomanometer after the patient had been sitting quietly for at least 5 min. The subjects were considered to have hypertension if their blood pressure was ≥130/85 mmHg or if they were taking any antihypertensive drugs. Ultrasound examination was performed using the Ultramark 9 High Definition Imaging (HDI) ultrasound device with a 3.5 MHz detector. The ultrasound severity of hepatic steatosis was graded using a semi-quantitative scale (mild, moderate, and severe).
Statistical Analyses
Continuous variables are presented as mean ± standard deviation (SD). Student’s t-test or Mann–Whitney U-test, depending on the data normality, was applied to compare continuous variables. Categorical variables such as steatosis and CRP were analyzed using either the Fisher’s exact or χ2 tests. Multivariate logistic regression analysis (enter; entry: 0.05, removal: 0.10) was used to evaluate the risk factors of hyperuricemia in CKD+ NAFLD+ patients. All the statistical analyses were performed using the SPSS software version 20 for Windows. P<0.05 was considered statistically significant.
Results
Four hundred and fifty elderly patients with CKD were enrolled in the current study, of whom 53.55% (241/450) had hyperuricemia. A total of 279 cases (62%) were diagnosed with NAFLD. According to Table 1, NFALD was more prevalent in patients with hyperuricemia compared to non-hyperuricemia patients (57.3 vs 47.4, respectively, P=0.039).
 |
Table 1 Characteristics of Patients According to Different Serum Uric Acid Levels |
Accordingly, 279 CKD patients with NAFLD were enrolled and divided into hyperuricemia (n =160) and non-hyperuricemia groups (n =119). The mean age of subjects in the hyperuricemia and non-hyperuricemia group was 62.2±13.28 and 62.96±13.31 years, respectively (P = 0.65). There were 48 female participants in the non-hyperuricemia and 79 in the hyperuricemia group. (P =0.134). Although diabetes was more common in the hyperuricemia versus the non-hyperuricemia group, the difference was not significant (P=0.065). Patients with hyperuricemia showed higher creatinine and lipid levels, and lower GFR compared to those with non-hyperuricemia levels (P=0.002, P=0.038 and P=0.001, respectively). However, no significant differences were detected in abdominal obesity, metabolic syndrome, hypertension, CRP, and steatosis between hyperuricemia and non-hyperuricemia groups (P=0.874, P=0.782, P=0.782 and P=0.622, P=0.98, respectively). Differences in clinical and laboratory characteristics of patients with and without hyperuricemia are shown in Table 2.
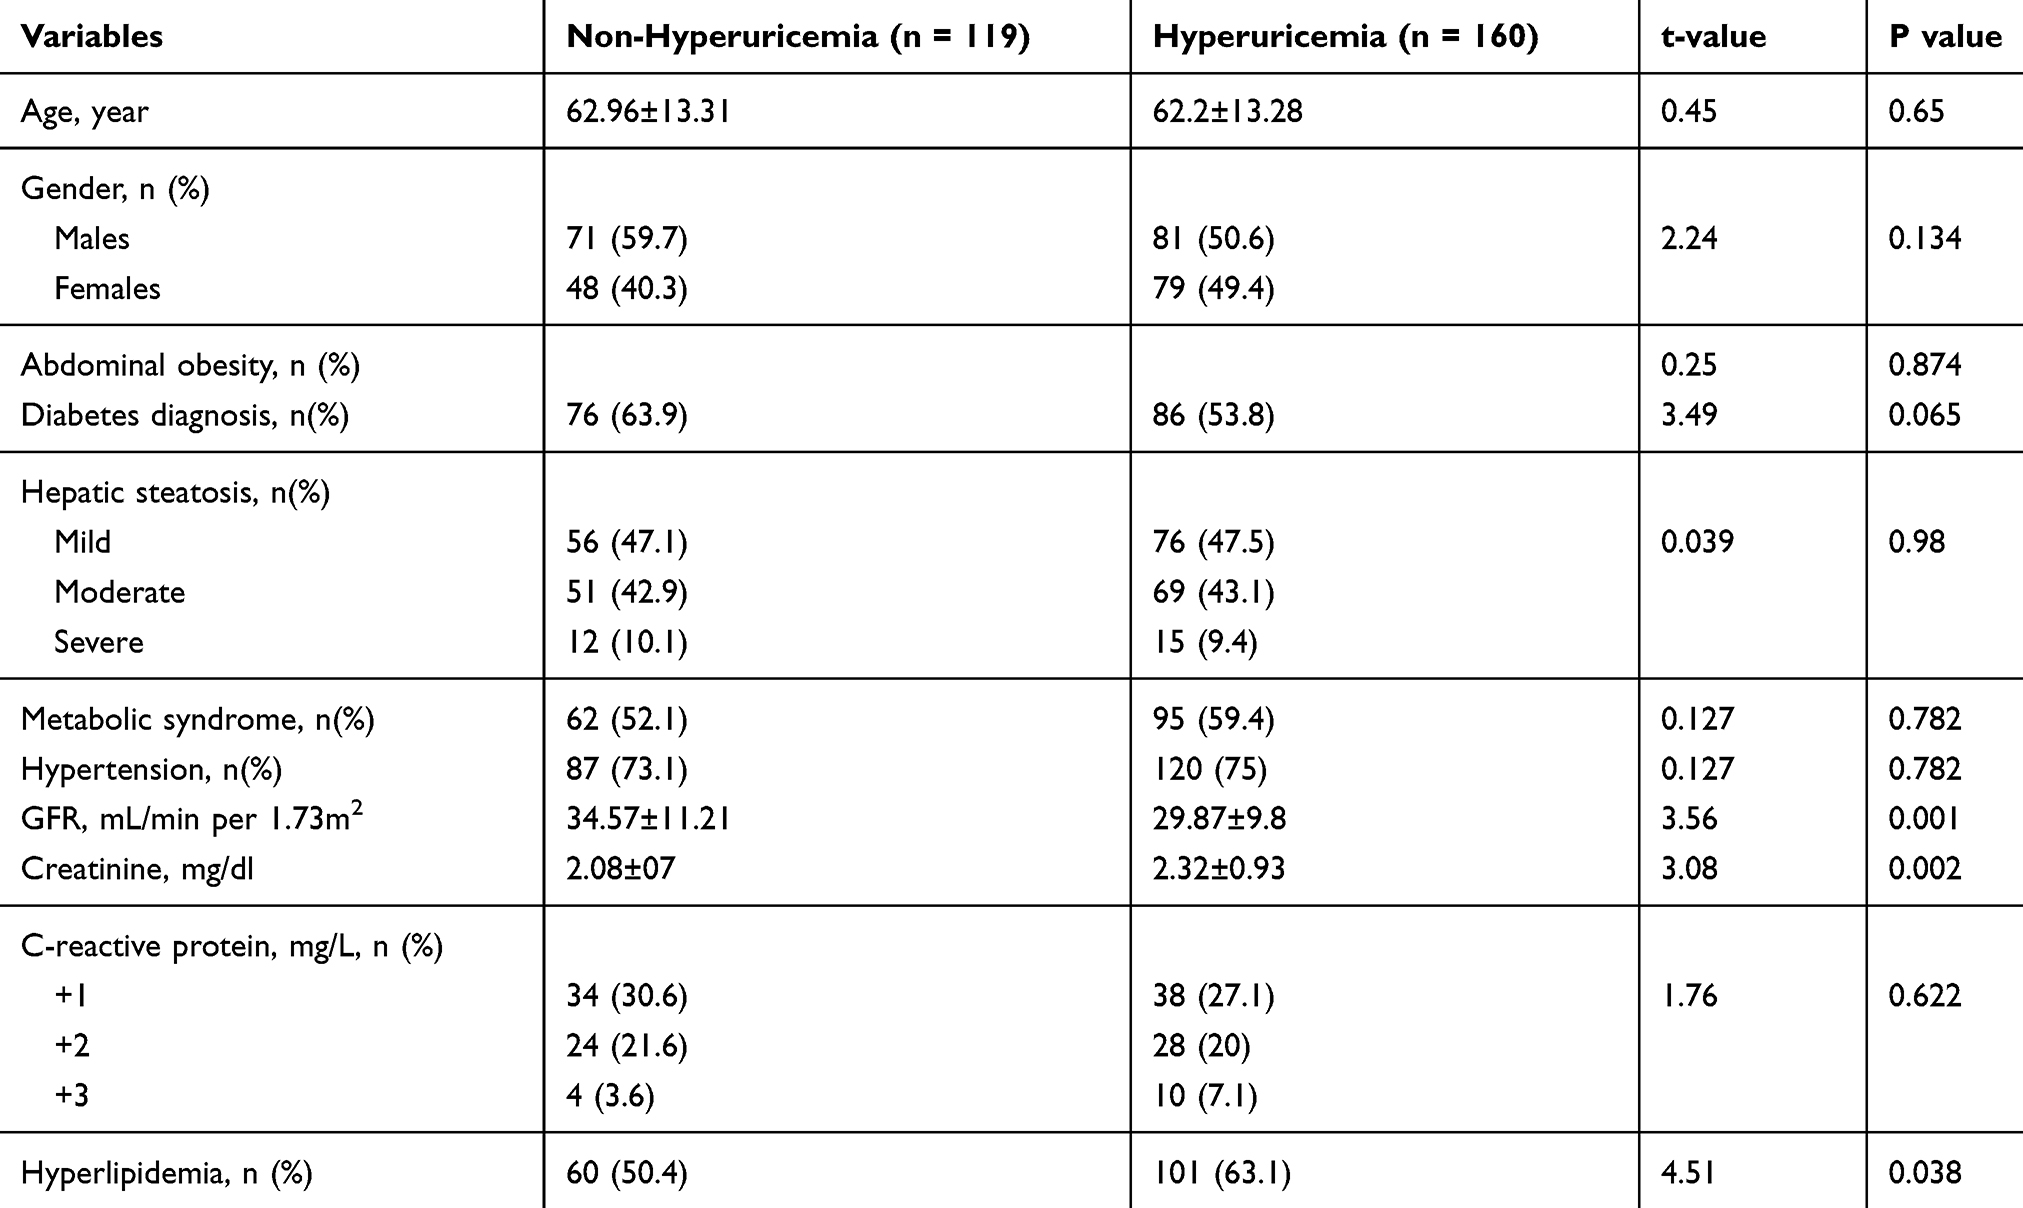 |
Table 2 Clinical and Laboratory Characteristics of Patients According to Different Serum Uric Acid Levels |
Table 3 shows the multivariable logistic regression analysis of the risk factors of hyperuricemia in CKD+NAFLD+. Patients with diabetes had a twofold higher chance of developing hyperuricemia (OR: 2.09, 95% CI: 1.13 to 3.89). Other significant predictors of the progression of hyperuricemia in CKD+ NAFLD+ patients were a low eGFR and a high serum lipid level.
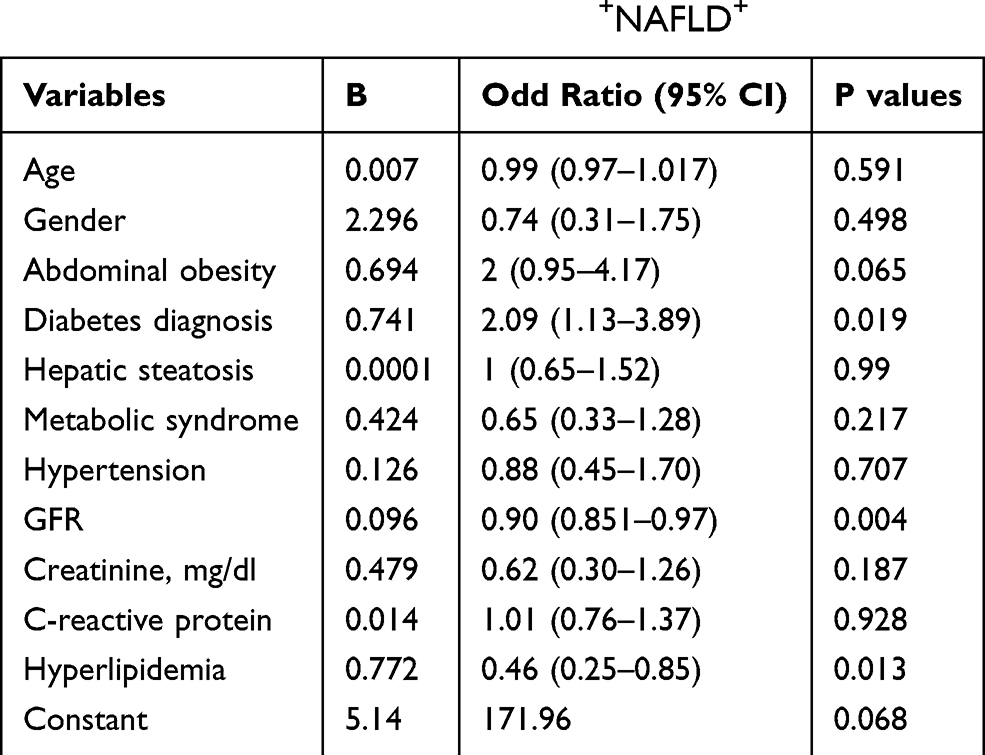 |
Table 3 Multivariable Logistic Regression Analysis Shows the Risk Factors of Hyperuricemia in CKD+NAFLD+ |
Discussion
The present study found that more than half of CKD+ NAFLD+ patients had hyperuricemia. The global prevalence ranges from 2.6% to 36% in different populations.17 The prevalence of hyperuricemia was 11.4% in the general Korean population and 13.3% in mainland China and 12.1% in Turkey.18–20 Hyperuricemia is mostly due to decreased uric acid excretion or accelerated purine degradation. It has been suggested that approximately 70% of uric acid is excreted from the kidney into the urine and the remaining 30% is excreted into the intestine.21 Thus, impaired renal function results in decreased uric acid excretion, elevated serum uric acid levels, and increased risk of hyperuricemia.22
In our study, the prevalence of hyperuricemia in CKD+ NAFLD+ patients was approximately similar in both sexes (50.6% in men and 49.4% in women). Some authors have suggested that hyperuricemia is higher in men than in women,23 but it tends to be consistent between man and woman after the age of 50 years.24 The mechanism of the increased prevalence of hyperuricemia with age in women may be related to menopause, underlining the effect of sexual hormones.25 In this study, the mean age of subjects in the hyperuricemia and non-hyperuricemia group was 62.2±13.28 and 62.96±13.31, respectively. Thus, older women in our study population may have contributed to a higher risk of hyperuricemia.
This study found that the risk of hyperuricemia in CKD+ NAFLD+ cases with abdominal obesity increased by 2 times compared to controls. Our findings were consistent with a large population-based study reporting that increased abdominal obesity or BMI increased the risk of hyperuricemia.18,26 In obesity, stimulation of the pro-inflammatory M1 macrophages in the adipose tissue induces the production of IL-6, TNF-α, and free radicals, promoting the progression of insulin resistance. Dendritic cells, mast cells, neutrophils, B cells, and T cells increase in the adipose tissue during obesity, which plays a crucial role in the development of adipose tissue inflammation and insulin resistance. Subsequently, uric acid synthesis pathways are activated, leading to increased production of uric acid.26
Decreased physical activity, decreased grain consumption and increased consumption of animal food, fried food, and fast food, which are full of purine, are probably related to hyperuricemia.27 Inappropriate dietary habits and lifestyle may therefore be a cause of hyperuricemia in our subjects, but a causal relationship between these two variables was not evaluated in this study. The present study showed that hyperlipidemia was significantly associated with hyperuricemia. This finding is consistent with the results of Keenan et al that reported an increase in serum uric acid with an increase in the triglycerides to HDL cholesterol ratio.28 It is worth mentioning that lipid-lowering drugs such as fenofibrate are also effective in reducing the serum uric acid level.29 Furthermore, insulin resistance is closely related to the pathogenesis of metabolic syndrome and increased synthesis of purines, which result from energy synthesis involving hypertriglyceridemia that plays a major role in this relation.28 On the other hand, decreased HDL cholesterol will give rise to the formation of atherosclerosis and eventually predisposes the patient to cardiovascular disease.30 Previous studies showed a stronger association between hyperuricemia and risk of cardiovascular disease.31–33 However, the beneficial effects of uric acid lowering drugs on decreased risk of cardiovascular disease and progression of kidney disease should be assessed in prospective randomized studies including a large cohort of recipients.
In conclusion, the findings of the present study suggest that three factors, including type 2 diabetes, hyperlipidemia, and a low GFR, serve as independent risk factors for hyperuricemia. More comprehensive strategic managements are necessary to reduce the potential harmful effects of hyperuricemia on the health of CKD+ NAFLD+ patients, and further studies are needed to validate the precise mechanism of these relationships.
Data Sharing Statement
The data sets used and/or analyzed during this study are available from the corresponding author on reasonable request and permission for use by the Kermanshah University of Medical Sciences Ethics Committee was received.
Ethics Approval
All the participants written informed consent prior to the study and this study was conducted in accordance with the Declaration of Helsinki. The protocol was approved by the Kermanshah University of Medical Sciences Ethics Committee.
Acknowledgments
The authors want to thank their colleagues in Mahdiyeh Clinic of Kermanshah, Iran for their contribution to the patient’s diagnosis. We also extend our thanks to clinical research development center of Imam Reza Hospital affiliated to Kermanshah University of Medical Sciences for their kind support. This study received financial support from Kermanshah University of Medical Sciences, Iran (Grant Number. 96362).
Author Contributions
All authors made substantial contributions to conception and design, acquisition of data, or analysis and interpretation of data; took part in drafting the article or revising it critically for important intellectual content; gave final approval of the version to be published; and agree to be accountable for all aspects of the work.
Disclosure
The authors declared no conflicts of interest in this work.
References
1. Hamer RA, El Nahas AM. The burden of chronic kidney disease. BMJ. 2006;332(7541):563–564. doi:10.1136/bmj.332.7541.563
2. Bouya S, Balouchi A, Rafiemanesh H, Hesaraki M. Prevalence of chronic kidney disease in Iranian general population: a meta-analysis and systematic review. Ther Apher Dial. 2018;22(6):594–599. doi:10.1111/1744-9987.12716
3. Ndrepepa G. Uric acid and cardiovascular disease. Clinica Chimica Acta. 2018;484:150–163. doi:10.1016/j.cca.2018.05.046
4. Oh TR, Choi HS, Kim CS, et al. Hyperuricemia has increased the risk of progression of chronic kidney disease: propensity score matching analysis from the KNOW-CKD study. Sci Rep. 2019;9(1):1–9. doi:10.1038/s41598-019-43241-3
5. Li L-X, Dong X-H, Li M-F, et al. Serum uric acid levels are associated with hypertension and metabolic syndrome but not atherosclerosis in Chinese inpatients with type 2 diabetes. J Hypertens. 2015;33(3):482. doi:10.1097/HJH.0000000000000417
6. Golmohammadi S, Almasi A, Manouchehri M, et al. Allopurinol against progression of chronic kidney disease. Iran J Kidney Dis. 2017;11(4):286–293.
7. Yu S, Yang H, Guo X, et al. Prevalence of hyperuricemia and its correlates in rural Northeast Chinese population: from lifestyle risk factors to metabolic comorbidities. Clin Rheumatol. 2016;35(5):1207–1215. doi:10.1007/s10067-015-3051-6
8. Huang Q, Yu J, Zhang X, et al. Association of the serum uric acid level with liver histology in biopsy‑proven non-alcoholic fatty liver disease. Biomed Rep. 2016;5(2):188–192. doi:10.3892/br.2016.698
9. Fotbolcu H, Zorlu E. Nonalcoholic fatty liver disease as a multi-systemic disease. World J Gastroenterol. 2016;22(16):4079. doi:10.3748/wjg.v22.i16.4079
10. Bashiri H, Bozorgomid A, Shojaeimotlagh V. Efficacy of Hijamat (wet cupping therapy) in Iranian patients with nonalcoholic fatty liver disease: a controlled clinical trial . Turk J Med Sci. 2020;50(2):354–359. doi:10.3906/sag-1907-82
11. Baldwin W, McRae S, Marek G, et al. Hyperuricemia as a mediator of the proinflammatory endocrine imbalance in the adipose tissue in a murine model of the metabolic syndrome. Diabetes. 2011;60(4):1258–1269. doi:10.2337/db10-0916
12. Mikolasevic I, Milic S, Wensveen TT, et al. Nonalcoholic fatty liver disease – a multisystem disease? World J Gastroenterol. 2016;22(43):9488. doi:10.3748/wjg.v22.i43.9488
13. Mantovani A, Zaza G, Byrne CD, et al. Nonalcoholic fatty liver disease increases risk of incident chronic kidney disease: a systematic review and meta-analysis. Metabolism. 2018;79:64–76. doi:10.1016/j.metabol.2017.11.003
14. Golmohamadi S, Omrani HR, Asadi N, et al. Non-alcoholic fatty liver disease and associated risk factors among hemodialysis patients. World Fam Med J. 2018;99(5804):1–5.
15. Song P, Wang H, Xia W, et al. Prevalence and correlates of hyperuricemia in the middle-aged and older adults in China. Sci Rep. 2018;8(1):1–9. doi:10.1038/s41598-017-17765-5
16. Zhao -C-C, Wang A-P, Li L-X, et al. Urine uric acid excretion is associated with nonalcoholic fatty liver disease in patients with type 2 diabetes. J Diabetes Complications. 2016;30(6):1074–1080. doi:10.1016/j.jdiacomp.2016.04.017
17. Uaratanawong S, Suraamornkul S, Angkeaw S, et al. Prevalence of hyperuricemia in Bangkok population. Clin Rheumatol. 2011;30(7):887–893. doi:10.1007/s10067-011-1699-0
18. Kim Y, Kang J, Kim G-T. Prevalence of hyperuricemia and its associated factors in the general Korean population: an analysis of a population-based nationally representative sample. Clin Rheumatol. 2018;37(9):2529–2538. doi:10.1007/s10067-018-4130-2
19. Yano Y, Fujimoto S, Asahi K, et al. Prevalence of chronic kidney disease in China. Lancet. 2012;380(9838):213–214. doi:10.1016/S0140-6736(12)61209-4
20. Sari I, Akar S, Pakoz B, et al. Hyperuricemia and its related factors in an urban population, Izmir, Turkey. Rheum Int. 2009;29(8):869–874. doi:10.1007/s00296-008-0806-2
21. Sorensen LB, Levinson DJ. Origin and extrarenal elimination of uric acid in man. Nephron. 1975;14(1):7–20. doi:10.1159/000180432
22. Marangella M. Uric acid elimination in the urine. Pathophysiological implications. Contrib Nephrol. 2005;147:132–148. doi:10.1159/000082551
23. Hou Y-L, Yang X-L, Wang C-X, et al. Hypertriglyceridemia and hyperuricemia: a retrospective study of urban residents. Lipids Health Dis. 2019;18(1):81. doi:10.1186/s12944-019-1031-6
24. Ni Q, Lu X, Chen C, et al. Risk factors for the development of hyperuricemia: a STROBE-compliant cross-sectional and longitudinal study. Medicine. 2019;98(42):e17597. doi:10.1097/MD.0000000000017597
25. Guan S, Tang Z, Fang X, et al. Prevalence of hyperuricemia among Beijing post-menopausal women in 10 years. Arch Gerontol Geriatr. 2016;64:162–166. doi:10.1016/j.archger.2016.02.002
26. Ali N, Perveen R, Rahman S, et al. Prevalence of hyperuricemia and the relationship between serum uric acid and obesity: a study on Bangladeshi adults. PLoS One. 2018;13(11):e0206850. doi:10.1371/journal.pone.0206850
27. Villegas R, Xiang Y-B, Elasy T, et al. Purine-rich foods, protein intake, and the prevalence of hyperuricemia: the Shanghai Men’s Health Study. Nutr Metab Cardiovasc Dis. 2012;22(5):409–416. doi:10.1016/j.numecd.2010.07.012
28. Keenan T, Blaha MJ, Nasir K, et al. Relation of uric acid to serum levels of high-sensitivity C-reactive protein, triglycerides, and high-density lipoprotein cholesterol and to hepatic steatosis. Am J Cardiol. 2012;110(12):1787–1792. doi:10.1016/j.amjcard.2012.08.012
29. Jung J-Y, Choi Y, Suh C-H, et al. Effect of fenofibrate on uric acid level in patients with gout. Sci Rep. 2018;8(1):1–9. doi:10.1038/s41598-018-35175-z
30. Bartlett J, Predazzi IM, Williams SM, et al. Is isolated low high-density lipoprotein cholesterol a cardiovascular disease risk factor? New insights from the Framingham offspring study. Circ Cardiovasc Interv. 2016;9(3):206–212. doi:10.1161/CIRCOUTCOMES.115.002436
31. Wu J, Lei G, Wang X, et al. Asymptomatic hyperuricemia and coronary artery disease in elderly patients without comorbidities. Oncotarget. 2017;8(46):80688. doi:10.18632/oncotarget.21079
32. Muiesan ML, Agabiti-Rosei C, Paini A, Salvetti M. Uric acid and cardiovascular disease: an update. Eur Cardiol. 2016;11(1):54. doi:10.15420/ecr.2016:4:2
33. Shojaeimotlagh V, Lazari N, Ghalenoee M, et al. Relationship between metabolic syndrome and depression in elderlies with cardiovascular disease. Iran J Nurs. 2015;27(92):65–72. doi:10.29252/ijn.27.92.65
 © 2020 The Author(s). This work is published and licensed by Dove Medical Press Limited. The full terms of this license are available at https://www.dovepress.com/terms.php and incorporate the Creative Commons Attribution - Non Commercial (unported, v3.0) License.
By accessing the work you hereby accept the Terms. Non-commercial uses of the work are permitted without any further permission from Dove Medical Press Limited, provided the work is properly attributed. For permission for commercial use of this work, please see paragraphs 4.2 and 5 of our Terms.
© 2020 The Author(s). This work is published and licensed by Dove Medical Press Limited. The full terms of this license are available at https://www.dovepress.com/terms.php and incorporate the Creative Commons Attribution - Non Commercial (unported, v3.0) License.
By accessing the work you hereby accept the Terms. Non-commercial uses of the work are permitted without any further permission from Dove Medical Press Limited, provided the work is properly attributed. For permission for commercial use of this work, please see paragraphs 4.2 and 5 of our Terms.