")
Back to Journals » Adolescent Health, Medicine and Therapeutics » Volume 9
Prevalence and factors associated with dysglycemia among girls in selected boarding secondary schools in Wakiso District, Uganda
Authors Nakiriba R , Mayega RW, Piloya T, Nabukeera-Barungi N , Idro R
Received 30 June 2018
Accepted for publication 30 July 2018
Published 29 October 2018 Volume 2018:9 Pages 167—176
DOI https://doi.org/10.2147/AHMT.S178746
Checked for plagiarism Yes
Review by Single anonymous peer review
Peer reviewer comments 2
Editor who approved publication: Professor Alastair Sutcliffe
Video abstract presented by Roy William Mayega
Views: 125
Rhoda Nakiriba,1,* Roy William Mayega,2,* Thereza Piloya,1 Nicolette Nabukeera-Barungi,1 Richard Idro1
1Department of Paediatrics and Child Health, School of Medicine, Makerere University College of Health Sciences, Kampala, Uganda; 2Department of Epidemiology and Biostatistics, School of Public Health, Makerere University College of Health Sciences, Kampala, Uganda
*These authors contributed equally to this work
Background: There is limited information on dysglycemia in adolescents in low-income countries. The objective of this study was to determine the prevalence and factors associated with dysglycemia among boarding secondary school adolescent girls in a peri-urban district.
Methods: The design was a cross-sectional survey. A total of 688 adolescents from four randomly selected girls-only boarding secondary schools in Wakiso District, Uganda, participated in this study. Fasting plasma glucose, body mass index (BMI), and blood pressure (BP) were measured. A questionnaire was used to assess demographic and lifestyle factors. Suspected dysglycemia was defined using the American Diabetes Association cutoff of fasting glucose ≥5.6 mmol/L. Overweight and hypertension were defined being above two SDs or the 95th percentile of the WHO BMI for age and BP for age reference charts, respectively. Logistic regression was used to determine the factors independently associated with dysglycemia.
Results: The mean age of the participants was 15.4 years (SD=1.7 years). Probable dysglycemia was found in 44 of 688 (6.4%) participants, ranging from 3.5% in the least affluent school to 9.8% in the most affluent school. No case of type 2 diabetes was found. 11.6% of the participants were found to have probable hypertension. Dysglycemia was higher in adolescents who were overweight (adjusted OR [AOR] 2.3; 95% CI 1.22–4.48), those with hypertension (AOR 4.0; 95% CI 1.86–8.45), and those who frequently stocked biscuits (AOR 3.0; 95% CI 1.21–7.28). Dysglycemia was lower in older adolescents (AOR 0.3; 95% CI 0.10–0.86) and those who took water with meals (AOR 3.0; 95% CI 1.21–7.28).
Conclusion: In these predominantly peri-urban boarding secondary schools, 6.4% of the adolescent girls have probable dysglycemia. As Africa undergoes the epidemiological transition, there is a need for closer surveillance for diabetes and hypertension in peri-urban schools and school health measures against lifestyle diseases.
Keywords: dysglycemia, secondary school, peri-urban, adolescent girls
Background
According to projections by the International Diabetes Federation (IDF), there will be 592 million people with diabetes (or 8% global prevalence) by 2035.1 The prevalence of diabetes is rising in low-income countries too.2,3 Between 2010 and 2030, a 69% increase in type 2 diabetes is expected in low-income countries compared to a 20% increase in high-income countries.4 In Uganda, the most recent national non-communicable disease (NCD) risk factor survey conducted in 2014 revealed a 1.4% country-wide prevalence of diabetes.5 Other studies show that the distribution of diabetes in Uganda is not homogenous, and there are pockets of high prevalence. For example, Mayega et al6 showed a diabetes prevalence of 7.4% among people older than 35 years in Eastern Uganda. This increase in diabetes is attributed to globalization of unhealthy lifestyles,7,8 including inadequate physical activity and increased consumption of high-risk foods.9,10
Development of type 2 diabetes is often preceded by several disease-free years during which people may have detectable risk factors.11,12 These underlying risk factors act across an individual’s life course,13 to create the optimal phenotypic state for type 2 diabetes. Studies in high-income country settings show that some of these processes occur as early as adolescence.14 Pre-diabetes, the penultimate stage in these processes, represents the “most-at-risk” category for type 2 diabetes.15–18 Dysglycemia occurring in adolescence is strongly linked to insulin resistance and is a marker of heightened risk for future type 2 diabetes and cardiovascular disease,19 especially among obese adolescents.20–22
Despite the growing evidence that type 2 diabetes and dysglycemia are increasing in sub-Saharan Africa, the prevalence of dysglycemia and its correlates has hardly been quantified and described among adolescents in Africa. National NCD risk factor surveys in Africa focused on adults,6,23–25 yet anecdotal evidence shows that diabetes-related risk factors occur substantially in adolescents especially in the urban and peri-urban areas. A recent study in urban Uganda showed that 11% of the adolescents in secondary schools had hypertension, whereas 16.7% were overweight.26Another study in peri-urban primary schools found 14.1% of them to be overweight.27 However, available studies fall short of describing the prevalence of dysglycemia among school going adolescents.
We therefore assessed the prevalence and factors associated with dysglycemia among adolescent girls in boarding secondary schools in the peri-urban district of Wakiso in Uganda. The rationale for focusing on peri-urban adolescents is that Uganda is at a stage of the epidemiological transition in which dysglycemia is higher in urban/peri-urban areas.5 The rationale for focusing on boarding schools is because being away from their homes and in a controlled setting such students would be expected to have lower access to high-risk foods, but have varying dietary environments and peculiar feeding habits. We focused on girls because obesity rates in Uganda are disproportionately higher among women compared to men,5 which might translate into higher prevalence of dysglycemia in females as shown in some studies.28
Methods
Study setting
A descriptive cross-sectional study of girls in secondary schools was conducted in four girls-only boarding secondary schools in Wakiso District, Uganda. Wakiso is the third most populated district in Uganda, which is in the central region. Because it encircles Kampala, the capital city, it has both peri-urban and rural settings. The district has 583 secondary schools, of which 552 are private and 31 are government owned. However, there are only six girls-only boarding secondary schools.
Study population
Of the six girls’ boarding secondary schools in Wakiso District, two are government supported, whereas four are privately owned.29 For this study, we purposively selected all the two government-supported schools and randomly selected two of the four private ones. The four schools finally selected for this study are as follows: a predominantly high-income status school (School 1), a moderate-to-high-income school (School 2), a moderate-income school (School 3), and a low-moderate-income school (School 4). The classifications were based on the amount of tuition fees charged by the schools and reflect the socioeconomic status of the students’ guardians. A guardian was defined as an adult person who plays a parental or custodial role for the student and pays their school dues. Adolescents were included in the study if they were aged 12–19 years, assented to participate, and their guardians provided informed consent. Those who are known to have type 1 diabetes, those on current steroid medication, and those who had fever or a severe illness at the time of study were excluded.
The dietary environment in the study schools is peculiar but varies across schools. Although the schools provide three main meals a day, boarding school students are allowed to keep a stock of edibles (mostly in the form of dry processed and preserved foods, packed fruit juices, and roasted grains or pulses) from which they continually snack on a regular basis. However, some of the schools do not allow students to stock edibles (including School 2). All the schools have school canteens that sell a range of pastries, most of which are prepared from refined foods or fried. However, there is wide variability in access to these canteens, determined by how much stipend the guardians have given the children. In the high-income status schools, such stipends can be substantial.
The sample size required for assessing the prevalence of dysglycemia and associated factors was estimated to be 688, computed using the formula for single sample cross-sectional studies with categorical outcomes30 at 95% CI, 80% power, an estimated prevalence of dysglycemia of 3%,25 and a precision of 2%. The sample size was proportionately allocated to the four sampled schools based on their student population sizes. The sample size allocated to each of the four study schools was proportionately distributed to the six classes (Senior 1–6) based on class size. Finally, simple random sampling from class lists supplied by the study schools was employed to select the study participants.
Data collection procedures
Permission to conduct the study was sought from the District Education Office and from the head teachers of the sampled schools, and consent was obtained from parents. Three preparatory pre-visits were undertaken to each school. The first visit involved a meeting with the administration and teachers, whereas the second involved a briefing of students on their general assemblies. The third preparatory visit was undertaken on the day prior to data collection and involved contacting the sampled students again to seek their assent and to request them not to eat anything on the morning of data collection before their fasting plasma glucose was measured. Data were collected by a team of four research assistants, directly supervised by the principal investigator (PI). All the research assistants were nurses. The research assistants underwent 3 days of training before deployment. They all converged on one school at a time to complete the required data collection before moving to another school.
Each sampled student filled a self-administered and a socio-behavioral questionnaire adapted from the WHO’s STEPS survey tool,31 but adjusted to cater for specific dietary and physical activity habits unique to the boarding secondary school setting in Uganda. The self-administered component of the questionnaire was used to assess sociodemographic characteristics of the participants and their behavioral factors, following which the questionnaires were checked for completeness. After completion of the socio-behavioral questionnaire, anthropometric measurements were undertaken on each participant using standard procedures. Weight was measured in kilograms using a Seca® electronic weighing scale and corrected to one decimal point (eg, 63.7 kg). Height was measured in meters using standard height meters, with the participant standing upright, shoes off. It was corrected to two decimal points (eg, 1.58 m). Obesity and overweight were determined on the basis of having a body mass index (BMI) higher than that expected for age. BMI was computed as the participant’s weight divided by the square of her height in meters (Wt/Ht2). The BMI z-score for age was then determined for each participant using the WHO BMI charts. Participants with a BMI value above the 95th percentile for age were classified as being overweight, whereas those above the 99th percentile as obese.
The blood pressure (BP) was taken using an automated sphygmomanometer of the brand Welch-Allyn®. It was taken from the participant’s left arm with the participant comfortably seated on a chair. Three BP measurements were taken, and an average of them was used for the study. The average systolic and diastolic BP measurements for each individual were then evaluated using the WHO charts for BP for height and age. If a participant had systolic or diastolic values above the 95th percentile for age and height for the average BP readings, then the participant was classified as having probable hypertension.
Blood for glucose measurement was taken from a finger prick, placed on a test strip, and analyzed using a recently calibrated glucometer of the brand On-Call Plus® (Acon Laboratories, San Diego, CA, USA). Using the WHO classification of hyperglycemia,32 a blood glucose value of 5.6–6.9 was classified as “suspected pre-diabetes” and a value of 7 mmol/L and above as “suspected diabetes”. These two classifications comprise “dysglycemia”. Students who were found to have eaten something at the time of the assessment had their appointments rescheduled to another day.
Statistical analyses
Data were entered into Epi Info Version 3.2 and then exported to SPSS Version 17 (SPSS Inc., Chicago, IL, USA) for analysis. Univariate analysis was conducted for background, behavioral, and physical characteristics, and the outcomes were summarized using frequency counts and prevalence percentages for categorical variables and mean values and SDs for numerical variables. Bivariate analysis involved comparison of the dependent variable (ie, glycemic status) with various independent variables. Statistical significance for these was tested using ORs, CIs, and P-values generated using simple logistic regression. Variables that were significant at bivariate analysis (ie, P<0.05) and those that were not significant but with high plausibility from previous studies (eg, level of physical activity) were included in a logistic regression model to adjust for confounding and determine factors independently associated with dysglycemia. Two variables (school and class category) that appeared to be in the causal pathway of the relationship between other independent variables and the outcome of interest (dysglycemia) were excluded from the final parsimonious model as they tended to render several other factors non-significant when included. Statistical significance was tested at α=0.05 (95% CI). The model’s fit was tested using the Hosmer–Lemeshow analysis, generating good fit (P-value=0.537).33
Ethical considerations
Ethical approval was obtained from the Makerere University School of Medicine Research and ethics committee. Permission for the study was obtained from the District Education Officer and the head teachers of the respective schools. Written informed consent was sought and obtained from all guardians of the adolescents sampled, and all participants aged 18 years and above, whereas written assent was requested and obtained from all participants under 18 years of age. Children found to have prediabetes and/or hypertension were given a detailed health education session on preventive lifestyles, including diet and physical activity. They were also given a health note to take back home to their guardians explaining their condition, with advice to visit the pediatrics outpatient clinic at Mulago Hospital during the school holidays for further evaluation, health education, and treatment for those who had hypertension. All information collected was kept confidential. The PI and the research assistants went back to the respective schools after data analysis to provide feedback to the head teachers and the participants. The PI held a planning meeting with the head teachers on how to improve the health of the students through promotion of behavioral adjustments.
Results
Background characteristics of the participants
A total of 694 adolescent girls were screened to participate in the study. Four of these girls were excluded because they were recovering from malaria at the time of the study. Another two girls were excluded because they declined to have their blood sugar measured, leaving a total of 688 participants. The mean age of the participants was 15.4 (SD 1.7 years). Among the participants, 91.7% (631/688) were aware about diabetes but only 15.1% (103/688) had ever had their blood glucose measured (Table 1). 30.5% (210/688) of the participants were found to be overweight. There was a socioeconomic gradient in the prevalence of overweight across schools, with the high-income status school (School 1) showing a 40.8% prevalence of overweight and the lowest-income status school (School 4) showing 30.5% prevalence. Of the participants, 11.6% (80/688) were found to have probable hypertension (Table 1).
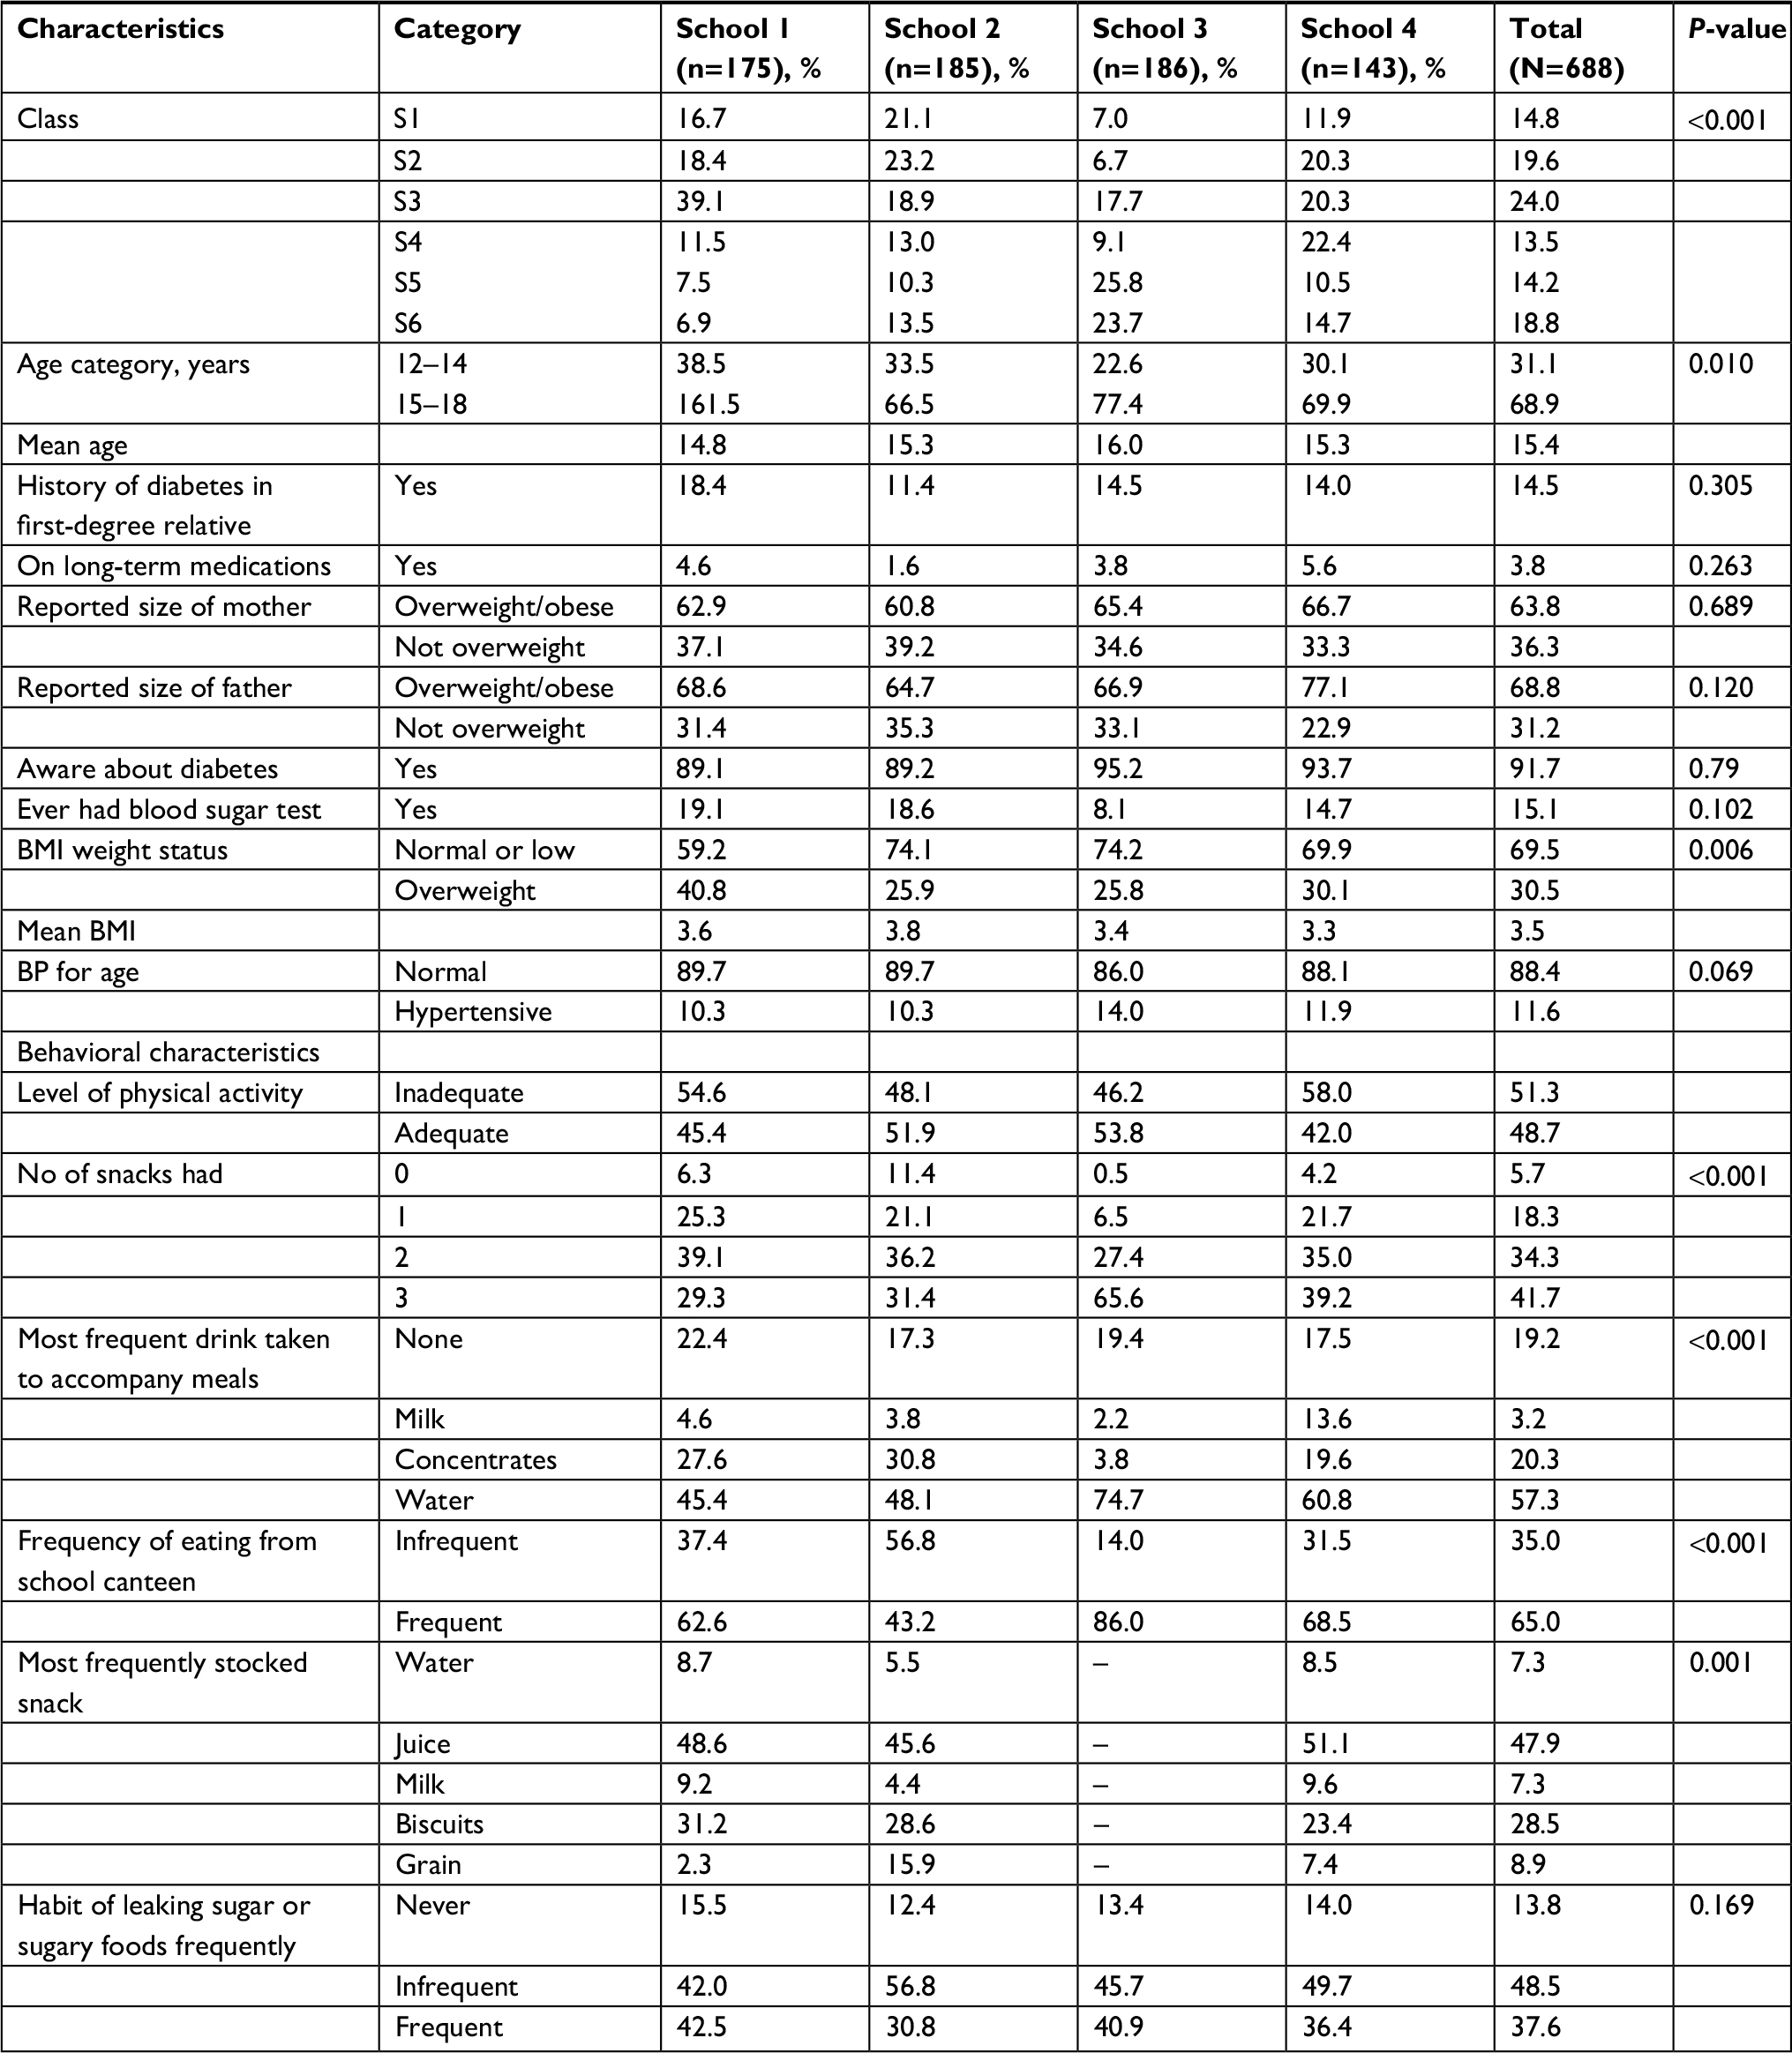 | Table 1 Background characteristics of the participants Abbreviations: BMI, body mass index; BP, blood pressure. |
Behavioral characteristics of the participants
A majority of the participants (410/688, ie, 59.6%) reported that they had three meals the previous day. Most of the behavioral characteristics (including number of meals a day, snacking, type of drink most frequently accompanying meals, frequency of eating from the school canteen, frequency of fruit and vegetable intake, and the most stocked reserve edible) were found to be distributed significantly differently across the four schools. The high-income school (School 1) showed a higher prevalence of the unhealthy behavioral characteristics compared to the other schools.
Prevalence of dysglycemia among adolescent girls in peri-urban boarding schools
The overall prevalence of dysglycemia in the study schools was 6.4% (44/688), all being probable prediabetes. There was no participant found to have type 2 diabetes. There was a gradient in the prevalence of dysglycemia across schools, School 1 having a prevalence of 9.8% (17/157), School 2 at 7.6% (14/171), School 3 at 4.5% (8/178), and School 4 at 3.5% (5/138). However, the difference in the prevalence across the schools was not statistically significant (P=0.069). The mean fasting plasma glucose measurement was 4.8 mmol/L (SD 0.5 mol/L; minimum=2.7 mol/L; maximum=6.8 mmol/L; median 4.8).
Factors associated with dysglycemia among adolescent girls in boarding schools
The factors that were found to be significantly associated with dysglycemia at bivariate analysis (Table 2) and those with a P-value less than 0.1 (Table 2) were entered into the final regression model to determine the factors independently associated with dysglycemia. At multivariate analysis, being in the age group of 17–19 years (adjusted OR [AOR] 0.3; 95% CI 0.10–0.86; P-value=0.025) and frequently accompanying meals with water (AOR 0.5; 95% CI 0.22–0.99; P-value=0.049) were associated with a lower likelihood of dysglycemia. On the other hand, being overweight (AOR 2.3; 95% CI 1.22–4.48; P-value=0.010), having hypertension (AOR 4.0; 95% CI 1.86–8.45; P-value<0.001), and stocking of refined foods such as biscuits for regular snacking (AOR 3.0; 95% CI 1.21–7.28; P-value=0.018) were associated with a higher likelihood of dysglycemia (Table 3).
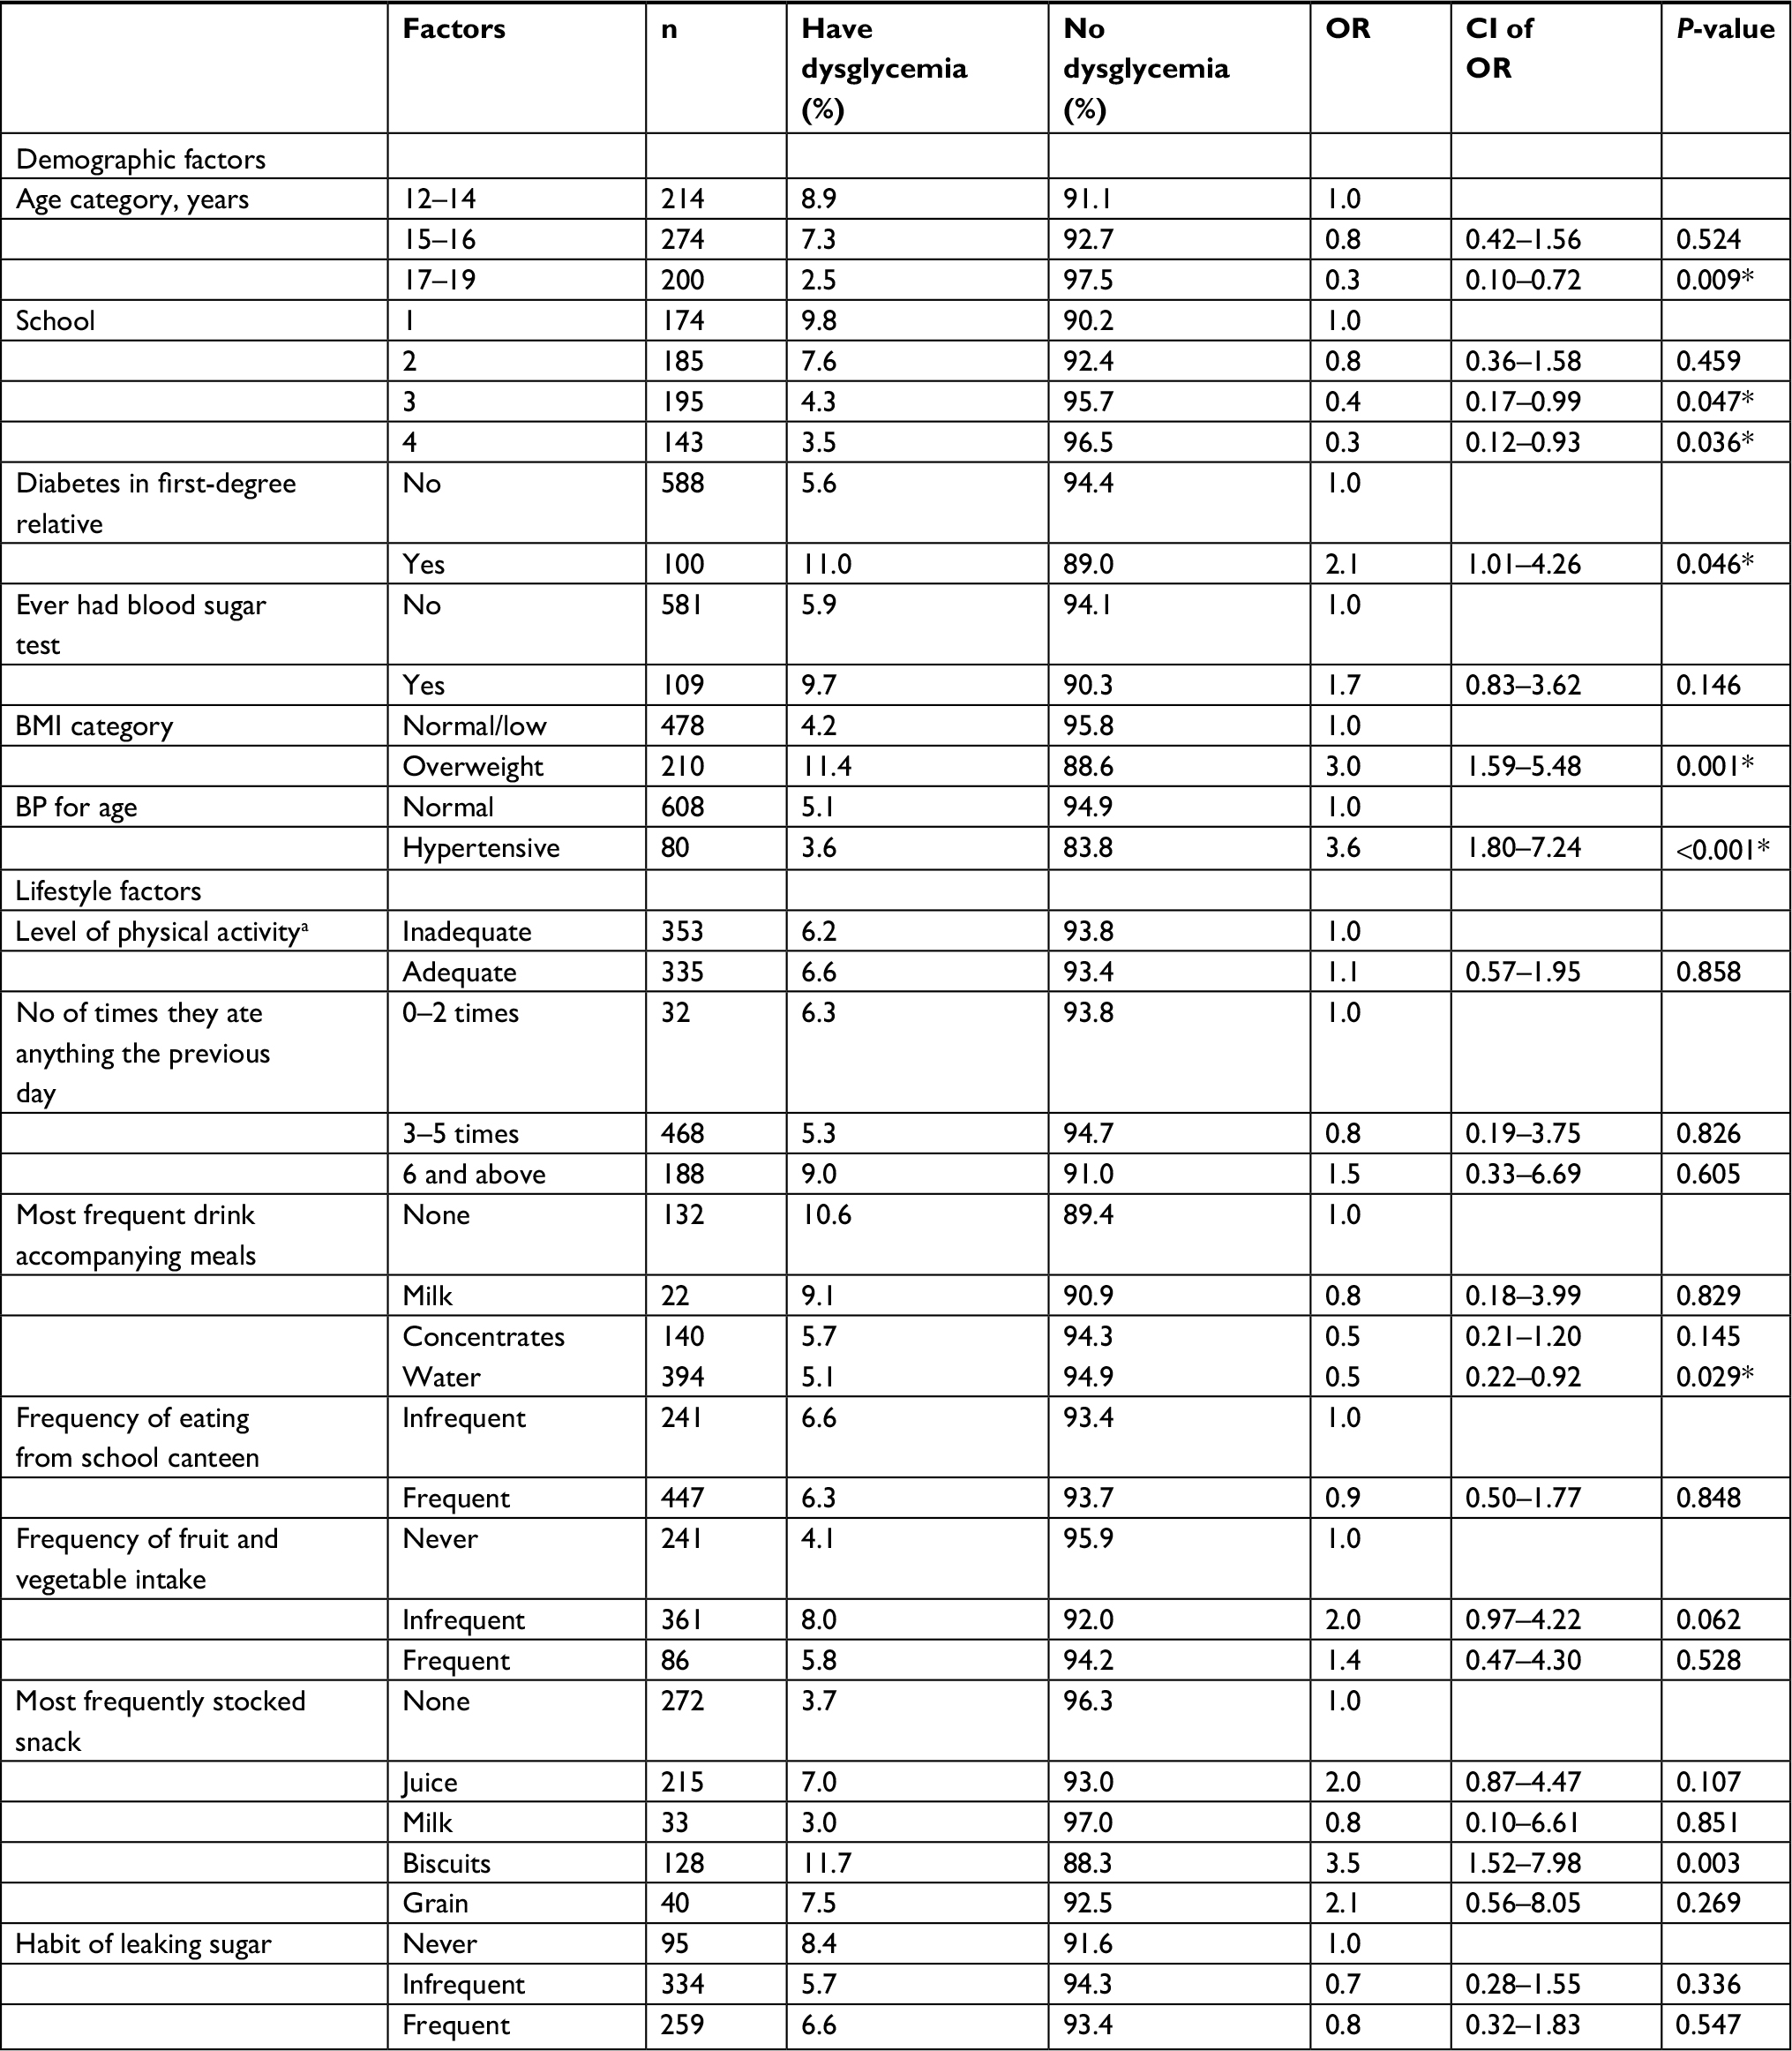 | Table 2 Factors associated with dysglycemia Notes: aAdequate: at least 150 minutes of moderate physical activity per week. Inadequate is less than 150 minutes. *Statistically significant findings at P=0.05. Abbreviations: BMI, body mass index; BP, blood pressure. |
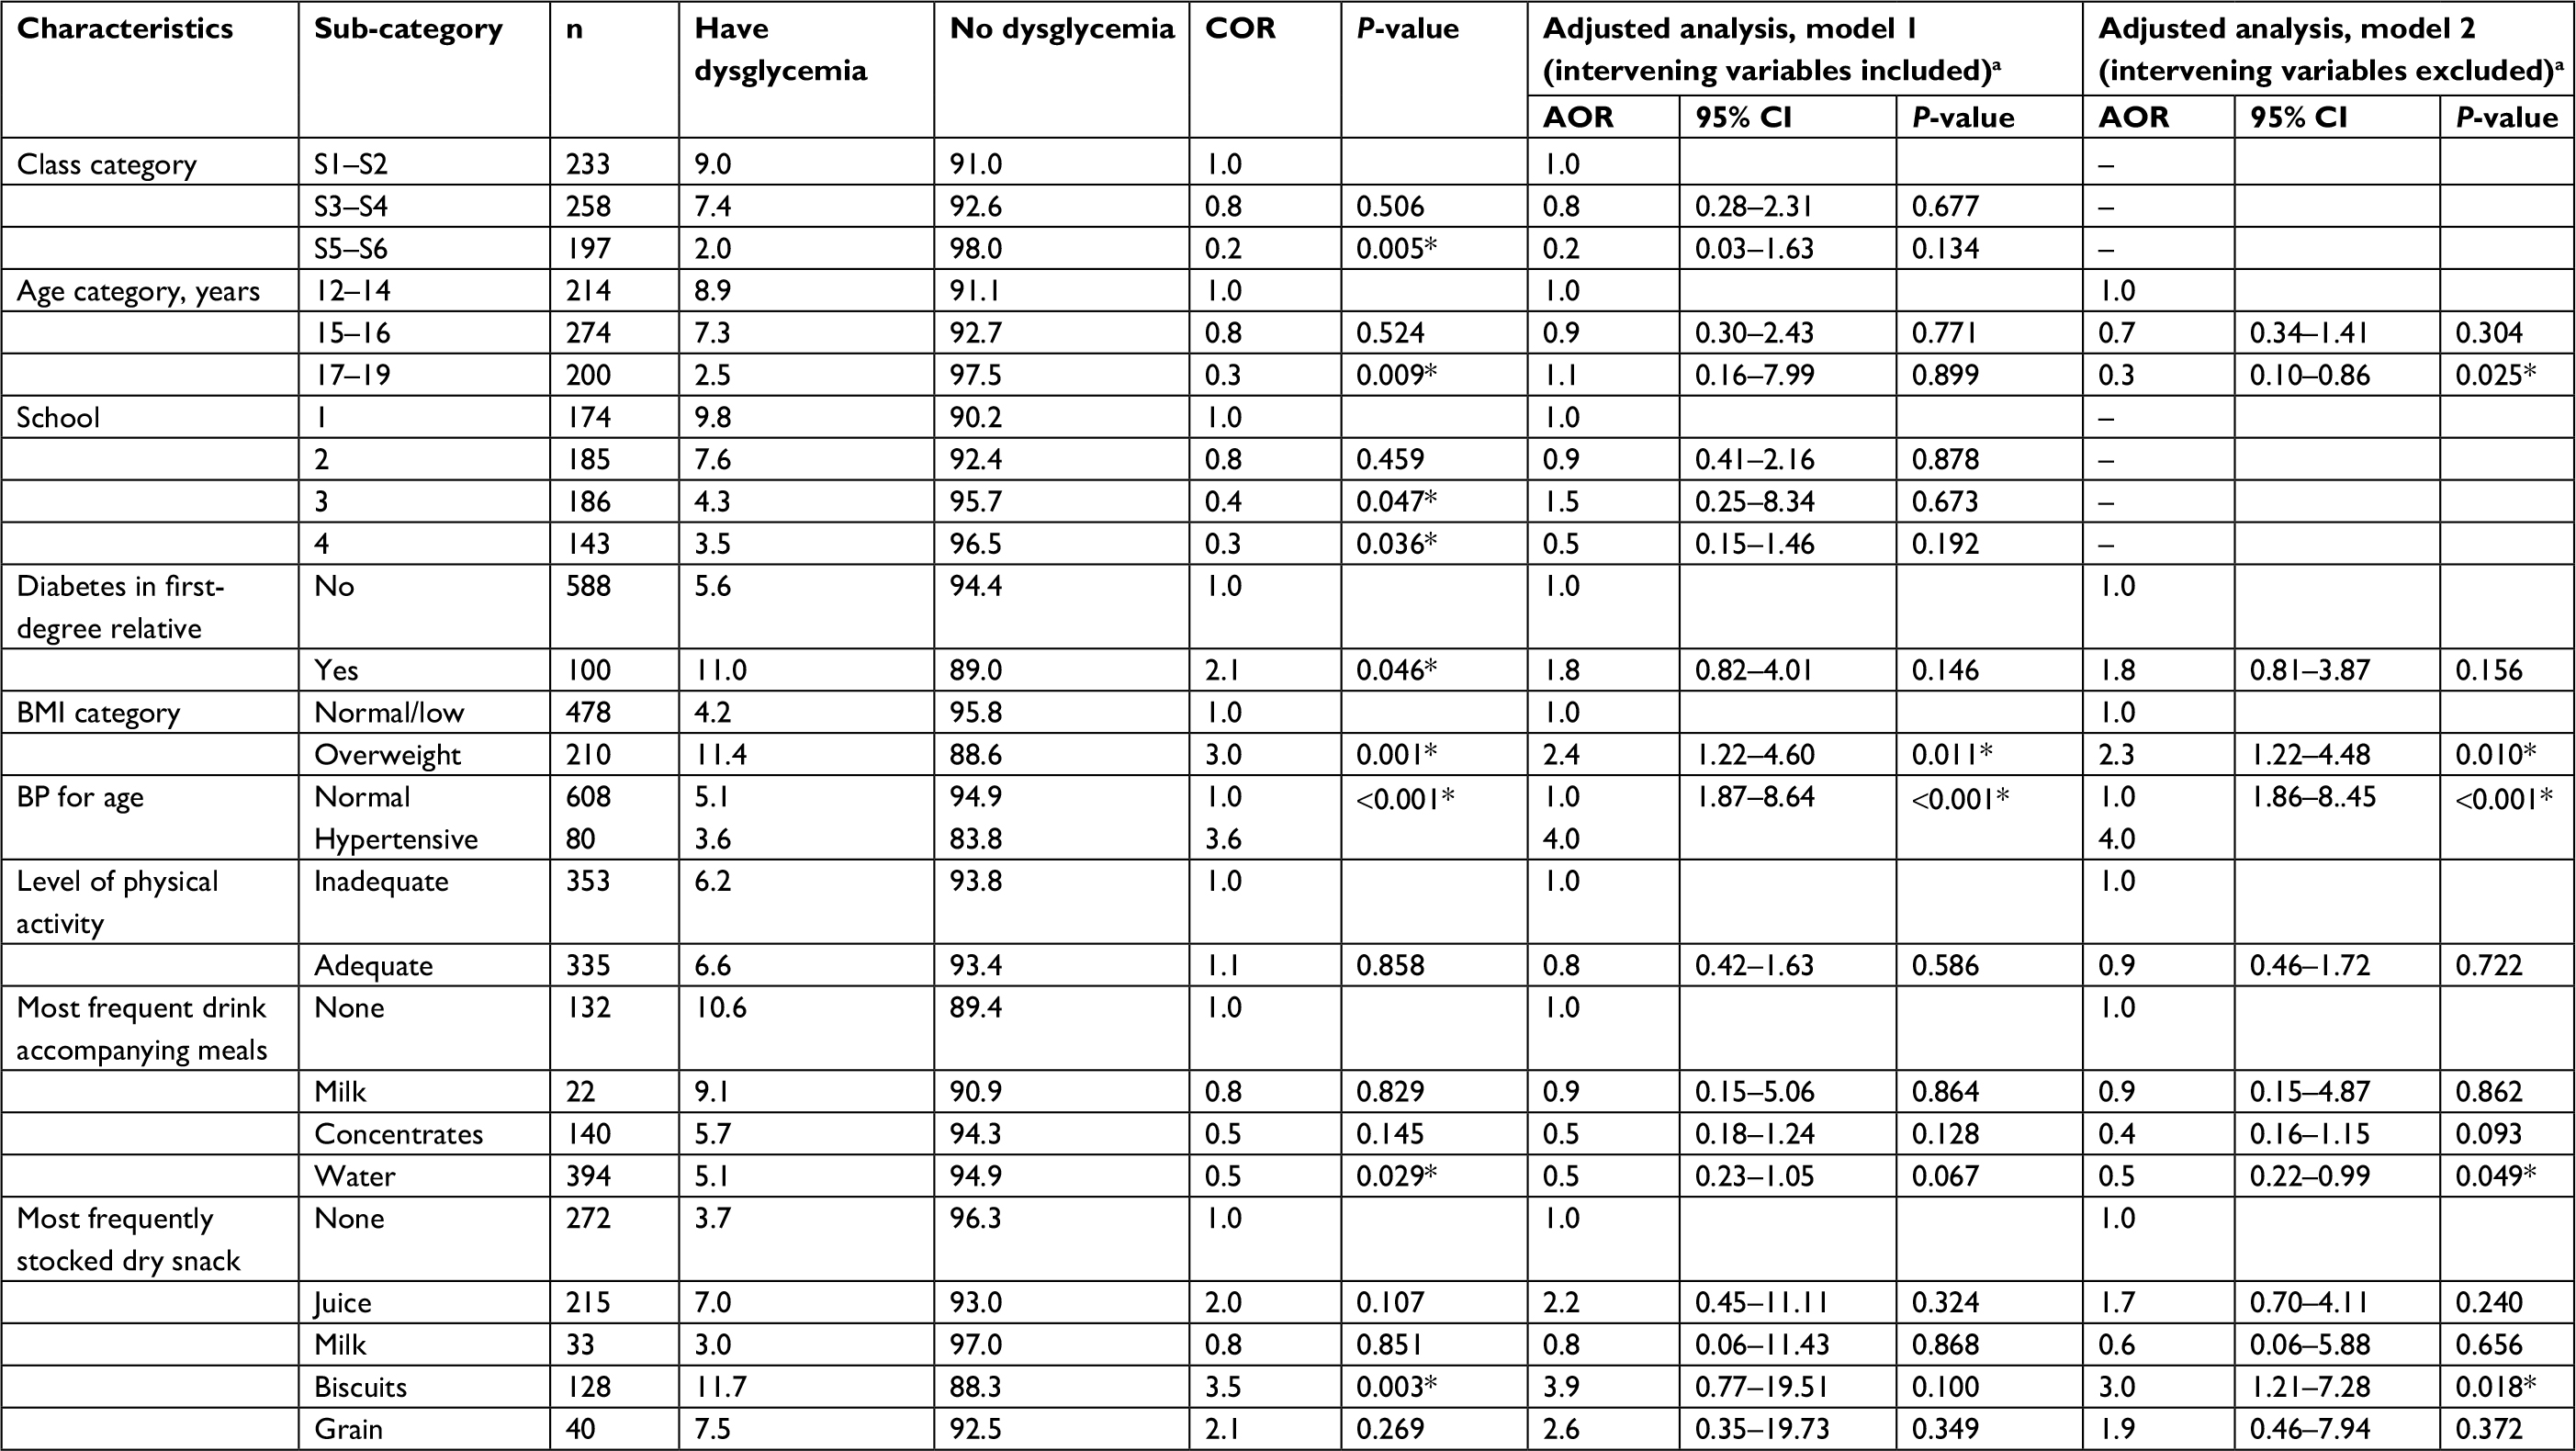 | Table 3 Multivariate analysis for factors independently associated with dysglycemia Notes: aVariables “Class” and “School” were excluded from final logistic regression model because including them tends to render several other variables significant at bivariate analysis and non-significant at multivariate analysis. They, therefore, appear to be in the causal/explanatory pathways for several variables; it is therefore advised not to adjust for them. *Statistically significant findings at P=0.05. Abbreviations: BMI, body mass index; BP, blood pressure; COR, crude odds ratio. |
Discussion
This study set out to determine whether dysglycemia exists among adolescents in boarding secondary schools in a rapidly urbanizing district in Uganda and to describe its correlates among adolescent girls. Not only did 6.4% of the adolescent girls in boarding schools in this district have dysglycemia but also its prevalence was not homogenous between and within schools. This is the only study to describe the magnitude of dysglycemia in boarding secondary school adolescents in peri-urban Uganda, a country that is undergoing the epidemiological transition to NCDs.
Although none of the girls was found to have diabetes, the observed prevalence of prediabetes in this population is relatively high compared to that found in other national and focal surveys. Uganda’s national NCD risk factor survey found a prevalence of dysglycemia of 3.5%, of whom 2.1% had prediabetes. The national study targeted people above 18 years, many of whom were older than those in this study. The prevalence of prediabetes in this study is also above that found in a rural cohort in southern Uganda, which was 3%.25 However, the findings are comparable with those from a population-based study done by Mayega et al6 in adults aged 35–60 years in a predominantly rural setting in Eastern Uganda, which found a prevalence of prediabetes of 9.6%. More comparable to the study age group, a recent study conducted in secondary schools in Port Harcourt in 2013 examined 880 males and females aged 10–19 years and found that 17% had impaired fasting glucose,34 which is way higher than the prevalence found in this study population. A SEARCH study conducted in USA in 2009 found a 35% prevalence of diabetes among the American youth.35,36 Similar to this study, none of the adolescents with dysglycemia in the American study had diabetes. Similar findings have been reported elsewhere.34,37,38 The substantial presence of prediabetes among adolescents in this study could be attributed to the epidemiological transition that is preponderant in urban and peri-urban areas in developing countries, as well as the peculiar feeding habits of this demographic group compared to the general population in Uganda. Prediabetes occurring early in life is an indicator of high lifetime risk for diabetes. The implication of this finding is that the epidemiological and nutritional transition in Uganda might already be occurring among girls in peri-urban secondary schools.
This study found a difference in the prevalence of dysglycemia between the four schools studied, the highest being 9.8% and the lowest being 3.5%. This can be explained by the difference in socioeconomic status of the schools, affecting their food environment and the ability of students to stock refined foods or buy snacks. The environments in schools contribute to different dietary and lifestyle habits. For example, in School 3 where students were not allowed to store any reserve edibles carried from home, the prevalence of dysglycemia was 4.3% compared to a prevalence of 9.8% in School 1 where students carried large quantities of reserve edibles. Follow-up information from the head teachers at the time of feedback also indicates that the four schools deferred in the intensity of their physical activity programs.
Factors independently associated with a higher risk of dysglycemia among the adolescent girls in peri-urban secondary schools included being in the younger age category (ie, 12–14 years), being overweight, having a high BP, regularly taking drinks other than water as accompaniment to meals, and having biscuits (a refined food) as the most frequently stocked snack. The higher prevalence of dysglycemia in adolescents aged 12–14 years compared to those aged 17–18 years is consistent with the studies that have reported a higher occurrence of dysglycemia in younger adolescents associated with a peaking of pubertal insulin resistance in early adolescence.34,38,39 However, older adolescents might also be more conscious of their dietary habits and in control of their food cravings than the younger ones. Overweight participants were more likely to have probable prediabetes compared to normal weight participants. This is comparable to other studies that have found obesity to be significantly associated with dysglycemia and is attributed to an increase in insulin resistance associated with obesity, which exacerbates pubertal insulin resistance.34,38,39 Discovery of the etiological mechanisms at the cellular level leading to age-mediated reversal of prediabetes in older adolescents could provide more insights into how to reverse prediabetes in older people. Association between hypertension and prediabetes has also been observed in other studies40,41 and is attributed to shared pathophysiological mechanisms between dysglycemia and hypertension.
The findings raise serious concerns regarding the extent to which students in schools and the school administrators appreciate the need to prevent lifestyle diseases as early as possible through promotion of healthier diets and physical activity in the schools. They also affirm the need to support overweight students and students with hypertension, who occur to a substantial level even in boarding secondary schools, by providing more targeted lifestyle programs.
This study found that participants who took water regularly with meals were less likely to have dysglycemia compared to those who took other types of drinks. This could mean that providing water with meals leads to lower consumption of sweetened concentrates such as soda and packed fruit juices. Stocking of biscuits for regular snacking was associated with a three times likelihood of dysglycemia compared to other edible items that the students often stock. Biscuits are a refined food, and there is clear evidence linking high consumption of refined foods to dysglycemia.42,43 In the context of boarding schools, biscuits and other similar refined carbohydrates or sugary edibles seem to be at the center of students snacking practices due to their long shelf life and convenient packaging. Such foods could be driving an epidemic of carbohydrate cravings among adolescents in boarding schools. These findings raise important implications for the school diet environment. Parents need guidance to pack healthier edibles for their children. Adolescents in boarding secondary schools need sensitization on healthy dietary practices. Schools also need to improve the quality of their diets and food environment to reduce the practice of snacking by students.
Physical activity and family history of diabetes were not found significantly associated with dysglycemia at multivariate analysis although they have been associated with diabetes in other studies. This is in contrast to most studies that have found a strong association between insufficient physical activity and dysglycemia.44,45 This could have been due to the tools used to assess the level of physical activity that relied on self-reported behaviors.
Limitations of the study included reliance on self-reports regarding behavioral assessments, reliance on students’ affirmation not to have eaten anything in the 8 hours preceding the survey, proneness of the international physical activity questionnaire to information bias, and not using an asset index to classify the socioeconomic status of participants’ guardians. Due to the peer pressure to “fit in”, adolescents tend to have biased reporting when enumerating the assets in their guardian’s homes. However, we used as much as possible standard approaches to such assessments by adapting the STEPS tools. Although Tanner Staging for pubertal assessment was not done, representation of the entire age group of 12–19 years ensured that adolescents at different stages of the staging are included, the majority of them being pubertal.
Conclusion
The prevalence of dysglycemia among adolescent girls in boarding schools in Wakiso District was substantial. Age, overweight, hypertension, and frequent eating of processed snacks were independently associated with an increased risk of dysglycemia. Regular drinking of water with meals was found to lower the risk of dysglycemia. Schools need to work hand in hand with parents to regulate the volume and type of processed foods that the students pack for snacking while at school. Boarding school feeding and physical activity programs should be reviewed to incorporate measures toward healthier lifestyles for adolescents. The Ministry of Education together with the Ministry of Health and civil society organizations should support the development of a school health policy that targets NCDs. This strategy should include regular screening for NCD risk factors among adolescents and providing targeted lifestyle support to higher risk students.
Acknowledgments
This work was supervised and reviewed by the Department of Pediatrics and Child Health at Makerere University. We would like to acknowledge the support of Wakiso District Local Government, the school administrations of the four schools involved in the study, the class teachers who coordinated the student selection and preparation for data collection, as well as the enthusiastic students who participated actively in the study. An abstract from the findings of this study was presented to the Makerere University International NCD symposium following which an oral presentation of the findings was made to the conference in February 2018. The abstract is published in the conference proceedings. However, the content of the presentation is not published anywhere.
Author contributions
RN was the principle investigator. She led the conceptualization of the study, collection of the data, supervision of field activities, and data analysis and prepared the comprehensive report from which this manuscript was derived. She participated in development of the manuscript. RWM substantially supported the conceptualization and execution of the study, contributing in equal measure to RN. He substantially contributed to the design of the study, the data analysis and interpretation. He led the drafting, development, and incorporation of revisions to the manuscript. TP, NN and RI participated in discussions of the study idea to identify key methodological considerations. They all extensively reviewed the study concept and the full study proposal, inputting substantial amendments and scientific insights. Each of them substantially reviewed the full study report and the draft manuscript, providing substantial technical and editorial input. All authors (RN, RWM, TP, NN, and RI) took part in drafting the article or revising it critically for important intellectual content and approved the final version of the manuscript to be submitted for publication. All authors agree to be accountable for all aspects of the work and questions arising therefrom.
Disclosure
The authors report no conflicts of interest in this work.
References
International Diabetes Federation. IDF Diabetes Atllas - 8th edition. Brussels: International Diabetes Federation; 2017. Available from: http://www.diabetesatlas.org/resources/2017-atlas.html. Accessed September 26, 2018. | ||
Mbanya JC, Motala AA, Sobngwi E, Assah FK, Enoru ST. Diabetes in sub-Saharan Africa. Lancet. 2010;375(9733):2254–2266. | ||
Maher D, Sekajugo J. Research on health transition in Africa: time for action. Health Res Policy Syst. 2011;9:5. | ||
Shaw JE, Sicree RA, Zimmet PZ. Global estimates of the prevalence of diabetes for 2010 and 2030. Diabetes Res Clin Pract. 2010;87(1):4–14. | ||
Bahendeka S, Wesonga R, Mutungi G, Muwonge J, Neema S, Guwatudde D. Prevalence and correlates of diabetes mellitus in Uganda: a population-based national survey. Trop Med Int Health. 2016;21(3):405–416. | ||
Mayega RW, Guwatudde D, Makumbi F, et al. Diabetes and pre-diabetes among persons aged 35 to 60 years in eastern Uganda: prevalence and associated factors. PLoS One. 2013;8(8):e72554. | ||
de-Graft Aikins A, Unwin N, Agyemang C, Allotey P, Campbell C, Arhinful D. Tackling Africa’s chronic disease burden: from the local to the global. Global Health. 2010;6:5. | ||
Maher D, Smeeth L, Sekajugo J. Health transition in Africa: practical policy proposals for primary care. Bull World Health Organ. 2010;88(12):943–948. | ||
Addo J, Smeeth L, Leon DA. Hypertension in sub-saharan Africa: a systematic review. Hypertension. 2007;5022(6):1012–1018. | ||
Hossain P, Kawar B, El Nahas M. Obesity and diabetes in the developing world--a growing challenge. N Engl J Med. 2007;356(3):213–215. | ||
Lindström J, Louheranta A, Mannelin M, et al; Finnish Diabetes Prevention Study Group. The Finnish Diabetes Prevention Study (DPS): Lifestyle intervention and 3-year results on diet and physical activity. Diabetes Care. 2003;26(12):3230–3236. | ||
Ambady R, Chamukuttan S. Early diagnosis and prevention of diabetes in developing countries. Rev Endocr Metab Disord. 2008;9(3):193–201. | ||
Penn L, Dombrowski SU, Sniehotta FF, White M. Participants’ perspectives on making and maintaining behavioural changes in a lifestyle intervention for type 2 diabetes prevention: a qualitative study using the theory domain framework. BMJ Open. 2013;3(6):e002949. | ||
Cook S, Weitzman M, Auinger P, Nguyen M, Dietz WH. Prevalence of a metabolic syndrome phenotype in adolescents: findings from the third National Health and Nutrition Examination Survey, 1988-1994. Arch Pediatr Adolesc Med. 2003;157(8):821–827. | ||
Chen KT, Chen CJ, Gregg EW, Imperatore G, Narayan KM. Impaired fasting glucose and risk of diabetes in Taiwan: follow-up over 3 years. Diabetes Res Clin Pract. 2003;60(3):177–182. | ||
Coronado-Malagón M, Gómez-Vargas JI, Espinoza-Peralta D, Arce-Salinas A. Progression toward type-2 diabetes mellitus among Mexican pre-diabetics. Assessment of a cohort. Gac Med Mex. 2009;145(4):269–272. | ||
Meigs JB, Muller DC, Nathan DM, Blake DR, Andres R; Baltimore Longitudinal Study of Aging. The natural history of progression from normal glucose tolerance to type 2 diabetes in the Baltimore Longitudinal Study of Aging. Diabetes. 2003;52(6):1475–1484. | ||
Edelman D, Olsen MK, Dudley TK, Harris AC, Oddone EZ. Utility of hemoglobin A1c in predicting diabetes risk. J Gen Intern Med. 2004;19(12):1175–1180. | ||
Morrison KM, Xu L, Tarnopolsky M, Yusuf Z, Atkinson SA, Yusuf S. Screening for dysglycemia in overweight youth presenting for weight management. Diabetes Care. 2012;35(4):711–716. | ||
Bacha F, Saad R, Gungor N, Arslanian SA. Are obesity-related metabolic risk factors modulated by the degree of insulin resistance in adolescents? Diabetes Care. 2006;29(7):1599–1604. | ||
Weiss R. Impaired glucose tolerance and risk factors for progression to type 2 diabetes in youth. Pediatr Diabetes. 2007;8(Suppl 9):70–75. | ||
Weiss R, Dufour S, Taksali SE, et al. Prediabetes in obese youth: a syndrome of impaired glucose tolerance, severe insulin resistance, and altered myocellular and abdominal fat partitioning. Lancet. 2003;362(9388):951–957. | ||
Hall V, Thomsen RW, Henriksen O, Lohse N. Diabetes in Sub Saharan Africa 1999-2011: epidemiology and public health implications. A systematic review. BMC Public Health. 2011;11:564. | ||
Kengne AP, Echouffo-Tcheugui JB, Sobngwi E, Mbanya JC. New insights on diabetes mellitus and obesity in Africa-part 1: prevalence, pathogenesis and comorbidities. Heart. 2013;99(14):979–983. | ||
Maher D, Waswa L, Baisley K, Karabarinde A, Unwin N, Grosskurth H. Distribution of hyperglycaemia and related cardiovascular disease risk factors in low-income countries: a cross-sectional population-based survey in rural Uganda. Int J Epidemiol. 2011;40(1):160–171. | ||
Bodo B. Hypertension in Adolescents in Day Secondary Schools in Kampala. Prevalence and risk factors. Uganda: Makerere University; 2012. | ||
Alyek J. Prevalence and Risk Factors for Overweight and Obesity Among Children in Day Primary Schools in Kampala district. Kampala, Uganda: Makerere University; 2006. | ||
Rosenbloom AL, Joe JR, Young RS, Winter WE. Emerging epidemic of type 2 diabetes in youth. Diabetes Care. 1999;22(2):345–354. | ||
Wakiso District Local Government 2012. Annual Report 2011/2012. Education Department. | ||
Leslie K. Survey Sampling. Hoboken, NJ: Wiley; 1995. | ||
WHO. STEPS Manual. Geneva: World Health Organization; 2011. Available from: http://www.who.int/ncds/surveillance/steps/manual/en/. Accessed September 26, 2018. | ||
WHO, International Diabetes Federation. Definition and diagnosis of diabetes mellitus and intermediate hyperglycaemia. Geneva: World Health Organization; 2006. Available from: http://www.who.int/diabetes/publications/diagnosis_diabetes2006/en/. Accessed September 26, 2018. | ||
Hosmer D, Lemeshow S. Applied Logistic Regression, Wiley Series in Probability Statistics. 2nd ed. Hoboken, NJ: John Wiley and Sons Inc; 2000. | ||
Jaja T, Oduwole A, Fetuza B, Abdus-Salam IA. Prevalence of prediabetes in secondary school students in Port Harcourt, Nigeria. Afr J Diabet Med. 2015;23:11–14. | ||
Dabelea D, Mayer-Davis EJ, Saydah S, et al; SEARCH for Diabetes in Youth Study. Prevalence of Type 1 and Type 2 Diabetes Among Children and Adolescents From 2001 to 2009. JAMA. 2014;311(17):1778. | ||
Waknine Y [homepage on the Internet]. Diabetes rates soar among USA tweens and teens. Medscape; 2014. Available from: https://www.slideshare.net/YaelWaknine/diabetes-rates-rocket. | ||
Ghergherehchi R, Tabrizi A. Prevalence of impaired glucose tolerance and insulin resistance among obese children and adolescents. Ther Clin Risk Manag. 2010;21:345–349. | ||
Jeffery SC, Hosking J, Jeffery AN, et al. Insulin resistance is higher in prepubertal girls but switches to become higher in boys at age 16: A Cohort Study (EarlyBird 57). Pediatr Diabetes. 2018;19(2):223–230. | ||
Mamtani R, Lowenfels AB, Sheikh J, et al. Adolescent prediabetes in a high-risk Middle East country: a cross-sectional study. JRSM Open. 2014;5(8):205427041453655. | ||
Duncan GE, Li SM, Zhou XH. Prevalence and Trends of a Metabolic Syndrome Phenotype Among US Adolescents. Diabetes Care. 2004;27(10):2438–2443. | ||
Boyd GS, Koenigsberg J, Falkner B, Gidding S, Hassink S. Effect of obesity and high blood pressure on plasma lipid levels in children and adolescents. Pediatrics. 2005;116(2):442–446. | ||
Mercola D [homepage on the Internet]. Sugary Beverages Tied to Increased Risk of Diabetes. Mercola.Com; 2015. Available from: https://articles.mercola.com/sites/articles/archive/2015/05/06/sugary-drinks-heart-disease-risk.aspx. | ||
Schulze MB, Manson JE, Ludwig DS, et al. Sugar sweetened beverages, weight gain, and incidence of type 2 Diabetes in young and middle aged women. JAMA. 2004;292(8):927–934. | ||
Gill JM, Cooper AR. Physical activity and prevention of type 2 diabetes mellitus. Sports Med. 2008;38(10):807–824. | ||
Hamasaki H. Daily physical activity and type 2 diabetes: A review. World J Diabetes. 2016;7(12):243–251. |
 © 2018 The Author(s). This work is published and licensed by Dove Medical Press Limited. The full terms of this license are available at https://www.dovepress.com/terms.php and incorporate the Creative Commons Attribution - Non Commercial (unported, v3.0) License.
By accessing the work you hereby accept the Terms. Non-commercial uses of the work are permitted without any further permission from Dove Medical Press Limited, provided the work is properly attributed. For permission for commercial use of this work, please see paragraphs 4.2 and 5 of our Terms.
© 2018 The Author(s). This work is published and licensed by Dove Medical Press Limited. The full terms of this license are available at https://www.dovepress.com/terms.php and incorporate the Creative Commons Attribution - Non Commercial (unported, v3.0) License.
By accessing the work you hereby accept the Terms. Non-commercial uses of the work are permitted without any further permission from Dove Medical Press Limited, provided the work is properly attributed. For permission for commercial use of this work, please see paragraphs 4.2 and 5 of our Terms.