")
Back to Journals » International Journal of General Medicine » Volume 8
Prevalence and correlation of hypertension among adult population in Bahir Dar city, northwest Ethiopia: a community based cross-sectional study
Authors Anteneh Z , Yalew WA, Abitew DB
Received 24 January 2015
Accepted for publication 5 March 2015
Published 6 May 2015 Volume 2015:8 Pages 175—185
DOI https://doi.org/10.2147/IJGM.S81513
Checked for plagiarism Yes
Review by Single anonymous peer review
Peer reviewer comments 4
Editor who approved publication: Dr Scott Fraser
Zelalem Alamrew Anteneh, Worku Awoke Yalew, Dereje Birhanu Abitew
School of Public Health, College of Medicine and Health Sciences, Bahir Dar University, Bahir Dar, Ethiopia
Background: Hypertension is one of the most common causes of premature death and morbidity and has a major impact on health care costs. It is an important public health challenge to both developed and developing countries. The aim of this study was to determine the magnitude and correlates of hypertension.
Methods: A community-based cross-sectional study was conducted in June 2014 among 681 adult residents of Bahir Dar city using multistage sampling techniques. An interview-administrated questionnaire and physical measurements such as blood pressure (BP), weight, height, and waist and hip circumferences were employed to collect the data. The data were coded, entered, and analyzed with SPSS version 16 software package.
Results: A total of 678 responses were included in the analysis resulting in a response rate of 99.6%. The findings declared that 17.6%, 19.8%, and 2.2% of respondents were prehypertension, hypertension stage I, and hypertension stage II, respectively, on screening test. The overall prevalence of hypertension (systolic BP ≥140 mmHg, or diastolic BP ≥90 mmHg, or known hypertensive patient taking medications) was 25.1%. According to the multivariate logistic regression analysis, age; having ever smoked cigarette; number of hours spent walking/cycling per day; number of hours spent watching TV per day; history of diabetes; adding salt to food in addition to the normal amount that is added to the food during cooking; and body mass index were statistically significant predictors of hypertension.
Conclusion: One out of every four respondents of the study had hypertension, and more than one out of three cases of hypertension (38.8%) did not know that they had the hypertension; 17.6% of the respondents were in prehypertension stage, which adds to overall future risk of hypertension. Therefore, mass screening for hypertension, health education to prevent substance use, regular exercise, reducing salt consumption, and life style modifications are recommended.
Keywords: blood pressure, body mass index, noncommunicable disease, salt consumption
Introduction
Noncommunicable diseases (NCDs) are a major cause of morbidity and mortality globally. These diseases account for two-thirds of all deaths worldwide; in opposition to the common misconception, the burden of these diseases is worst in low- and middle-income countries where 80% of all NCDs occur.1 Hypertension is one of the main public health challenges because of its high frequency and associated risks of cardiovascular and kidney diseases such as myocardial infarctions, strokes, and renal failures.2
Hypertension is the biggest risk factor for death, responsible for 9.4 million deaths and 7% of disability worldwide. This makes it the single most important cause of morbidity and mortality worldwide.3 It was almost nonexistent in African societies in the first half of the twentieth century; however, estimates now show in some settings in Africa that more than 40% of adults have hypertension.4
Hypertension is not only an important public health problem; rather, it will also have a big economic impact as a significant proportion of the productive population becomes chronically ill and stays at home, leaves their job, or dies, leaving their families in poverty.5 It is called the “silent killer” because it often has no warning signs or symptoms, and many people do not realize they have it.6
Various factors contribute to the occurrence of hypertension including excessive intake of saturated fatty acids and higher consumption of salts, which are risk factors for cardiovascular diseases. Unhealthy diet and physical inactivity contribute to around 30% of preventable morbidity and mortality from NCDs, including due to hypertension.7
The dietary approach is to promote food items containing fruits, vegetables, low-fat dairy products, and whole grains while limiting the amount of meat, sweets, and sugar and reducing sodium intake to reduce the mean population blood pressure (BP).8,9
Sedentary life style is also a cause of overweightness that produces higher body mass indexes (BMIs) and waist-to-hip ratios. In turn, these factors are associated with hypertension and other cardiovascular diseases.10–12
Studies in Africa have indicated that hypertension is a highly prevalent disease; accordingly, a study conducted in Nigeria showed prevalence of hypertension ranging from 8% to 46.4%; in Cameron it was 47.5%; and in Tanzania it ranged from 25.4% to 41.1%.12–14
In developing countries like Ethiopia where urbanization is expanding, lifestyles are changing, literacy rate is low, and people are still living in poverty, hypertension and its impact on development and health is particularly critical. However, little work has been done on NCDs. Therefore, there is a need to fill the gap regarding the magnitude (prevalence) of high BP and to identify factors associated with high BP in our country, which prompted the conduct of this study. Once the prevalence of hypertension and its associated risk factors have been identified in the target area, the findings will contribute to regional health offices and concerned bodies designing intervention strategies and prevention measures. Moreover, research organizations and those who are interested in the field of cardiovascular diseases would benefit from this information.
Materials and methods
Study design and period
A community-based cross-sectional study was conducted in people living in Bahir Dar city in June 2014.
Study setting
Ethiopia has eight regions (very large administrative units). Amhara region is one of those eight regions of the country, and Bahir Dar city is the capital city of Amhara region; this is where the study was conducted. Bahir Dar city possesses nine kebeles (the smallest administrative units). The city is located in northwest Ethiopia at a distance of 565 kilometers from Addis Ababa, the capital city of Ethiopia. The sample population was selected at random from the population residing in the city, which implies that the selected sample is representative of the adult population in the area; therefore, the result can be extrapolated to the adult population in Ethiopia and other African nations.
Source population
All adult aged 30 years or more living in the city during the study period were eligible for the study.
Exclusion criteria
Pregnant women were excluded from the study to avoid confounding.
Sample size determination
The sample size of the study was determined from a previous study, considering an estimated 30.2% as the expected proportion of hypertension.15 Any particular outcome was to be within 5% marginal error and 95% confidence interval (CI) of certainty. Based on these assumptions, the final sample size with design effect of 2 and an additional 10% for nonresponse rate was determined to be 681 people.
Sampling procedure
Bahir Dar city has nine administrative units or kebeles; four of the nine kebeles (44.4%) were selected randomly to get representative samples of the population. The study participants were selected from the target population through a multistage sampling technique and probability proportionate to size of the households from each selected kebele of the city.
The calculated sample size of 681 was distributed among each selected kebele proportional to the size of the population in each administrative unit. Then, after determining the number of individuals to be studied in each kebele, the sample size in each kebele was divided by the number of households in the kebele to determine the proportion of individuals to be studied in each selected kebele. This allowed a systematic sampling technique to be used in order to select the study units in the selected households.
After getting the sampling fraction in the selected kebeles or administrative units, a simple random method was used among the first “k” units of the households. Then, every kth units of households was visited to get the required number of study participants in all selected kebeles of the city.
Finally, a simple random sampling technique was used to select the study units in the selected households in the case that more than one person of 30 years of age or more was present in the house.
Study variables
Dependent variable
The dependent variable of the study was hypertension.
Independent variables
The independent variables of the study were:
- Sociodemographic characteristics: sex, age, marital status, ethnicity, religion, educational status, occupation, income
- Behavioral factors: Alcohol consumption, smoking, physical activity, lifestyle, feeding practices
- Other factors: BMI, waist-to-hip circumference ratio, history of hypertension, diabetes mellitus.
Operational definitions
Hypertension was defined as self-reported use of antihypertensive medication within the past 2 weeks or an average systolic BP ≥140 mmHg, an average diastolic BP ≥90 mmHg, or both. The level of hypertension was measured based on the Seventh Report of the Joint National Committee on Prevention, Detection, Evaluation, and Treatment of High Blood Pressure (JNC 7) (Table 1).16
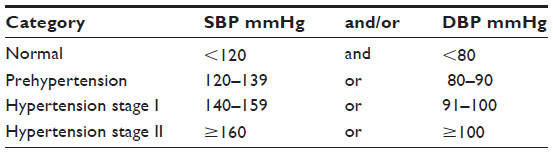 | Table 1 Level of blood pressure |
An adult who had a BMI between 25 and 29.9 was considered overweight. An adult who had a BMI of 30 or higher was considered obese. BMI is defined as the individual’s body mass divided by the square of their height. Categories of BMI were done based on World Health Organization (WHO) classification (Table 2). Waist-to-hip ratio was measured based on the World Health Organization classification as in the following way: for males ≤95 and >95 low and high respectively; and for females ≤0.85 and >0.85 low and high respectively (Table 3).
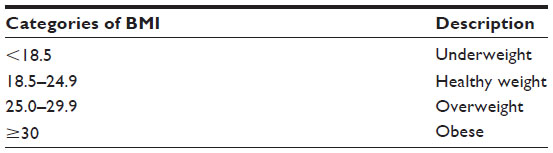 | Table 2 WHO classification of BMI |
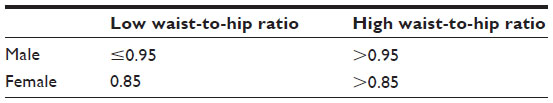 | Table 3 Waist-to-hip ratio classified into low and high based on World Health Organization classification in the following ways |
Data collection procedures and data collection tools
The data was collected using a structured interview questionnaire and physical measurements. The questionnaire was adapted from “WHO STEP wise approach to chronic disease risk factor surveillance (STEPS)”.17
A digital measuring instrument was used to measure the weight of adult individuals who were included in the study. Weight measuring scales were checked and adjusted at zero level between each measurement. Height was measured with stadiometers following the standard steps. Waist circumference was measured just at the midpoint between the anterior superior iliac spine and the lowest rib using tape meters, marking the area with a single thin piece of cloth.
BP was measured twice in a sitting position (using a standard sphygmomanometer BP cuff with an appropriate size to cover two-thirds of the upper arm) after the participant rested for at least 5 minutes, with no smoking or caffeine allowed for 30 minutes before measurement. The second measurement was taken 5–10 minutes after the first measurement.
Seven clinical nurses acted as data collectors, and two supervisors were recruited for the field work.
Data quality management
The questionnaire was initially prepared in English, was translated into the local language (Amharic) in order to obtain the required information from the respondents, and was translated back to English to check for any inconsistencies in meaning of words by language experts.
A pretest was done among 5% of the sample population among individuals in kebeles that were not included in the main survey. Data collectors and supervisors were trained for period of 2 days on procedures of measuring BP, heart rate, weight, height, and waist and hip circumferences of the participants, and were also made familiar with the questionnaires.
Data processing and analysis
Prior to data entry, questionnaires were checked for errors and coded; next, data were entered into SPSS version 16 software package. Data was cleaned by doing simple frequency and cross-tabulation between each independent and dependent variable.
Univariate and bivariate analyses were computed to see the frequency distribution and to test whether there was association/difference between hypertension and selected independent variables, respectively. Factors associated with hypertension on bivariate analysis were identified, and the variables with P-values of 20% or less were taken to multivariable logistic regression analysis and the model was built with backward elimination.
Finally, P-values less than 0.05 was considered statistically significant.
Ethical considerations
Ethical clearance was obtained from the ethical review committee of Bahir Dar University and was communicated to the Amhara regional health bureau and Bahir Dar city administrative offices to receive permission letters. After obtaining permission letters and selection of the study subjects, the objective of the study was clearly explained for the study participants to get consent.
Results
Demographic characteristics of the study participants
A total of 678 responses were included in the analysis from the desired sample size of 681 participants interviewed; only three responses were excluded from analysis because of incompleteness, resulting in a response rate of 99.6%.
Out of the total study participants included in the study, 369 (54.4%) were females and the mean and standard deviation of the age of respondents was 49.2±1.37 years. Regarding the literacy level of respondents, 272 (40.1%) were illiterate. Concerning ethnicity and marital status of the respondents, 94.1% were Amhara and more than 60% were married (Table 4).
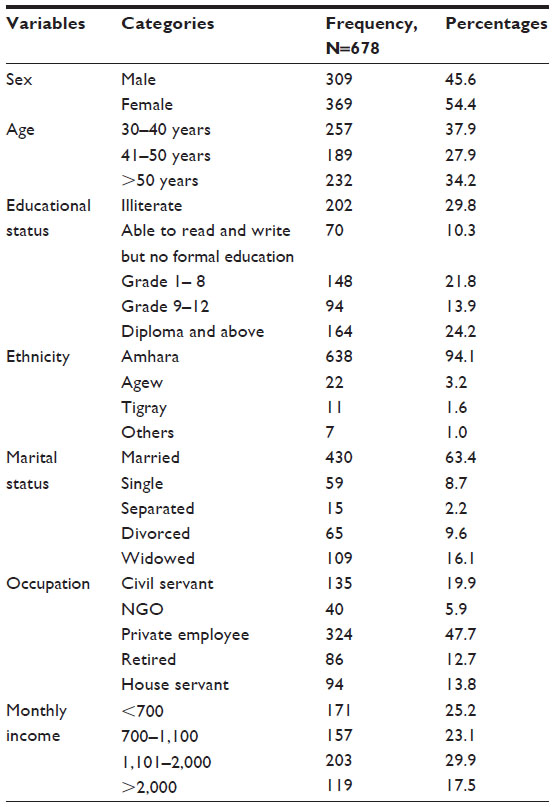 | Table 4 Demographic characteristic of people in Bahir Dar city, June 2014 |
History of substance use
The findings of this study indicated that 41 (6.0%) were smokers during the time of the survey and 46 (6.8%) of the respondents had smoked cigarettes once in their life time. About 28 (60.8%) reported that they had started smoking before 24 years of age.
Regarding alcohol consumption, 408 (59.4%) and 502 (73.9%) drank alcohol in the last 1 month and 12 months, respectively. Out of the respondents who took alcohol in the last 1 month, 278 (68.1%), 118 (28.9%), and 12 (3.0%) of them reported that they were taking alcohol less than 3 days, 3–5 days, and more than 5 days per week, respectively (Table 5).
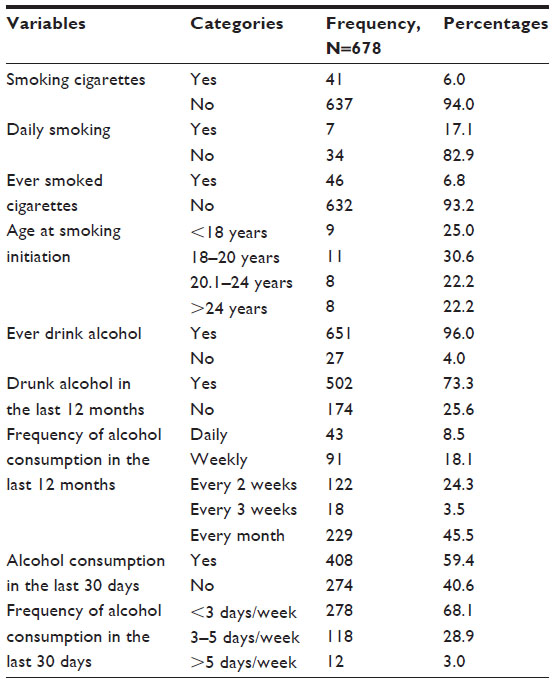 | Table 5 Substance use among adult population in Bahir Dar city, June 2014 |
Physical activity of respondents
The study found that 89 (13.1%) of the respondents’ occupations involved vigorous physical activity, 75 (84.3%) were doing vigorous physical activity more than 4 days per week, and 77 (86.5%) of them spent over 5 hours per day doing occupations involving vigorous physical activities.
However, 476 (70.1%) of respondents’ occupations involved moderate physical activity, and 310 (64.7%) of them were doing moderate physical activity more than 4 days per week. One hundred and seventy-eight (44.2%) respondents cycled or walked continuously for at least 10 minutes for less than 4 days per week, and 235 (58.3%) of them cycled or walked for more than 5 hours per day. About 33 (4.9%) of the study participants reported were doing sports involving vigorous physical activity, and 24 of them did so for less than 3 days per week (Table 6).
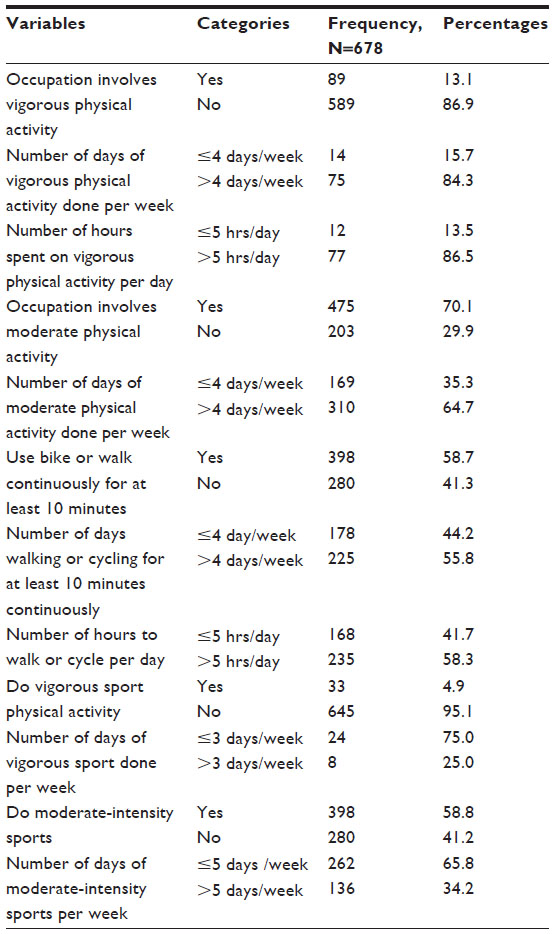 | Table 6 Physical activity of people living in Bahir Dar city, June 2014 |
Feeding habits of people in Bahir Dar city
The findings of this study showed that 403 (59.4%) respondents did not consume fruit at all and only 238 (35.1%) and 37 (5.5%) were consuming one to two and three or more servings of fruit per week, respectively. Regarding vegetable consumption, 20.9% of the respondents did not consume vegetable at all in their usual diet.
About 158 (23.3%) and 39 (5.8%) of respondents consumed food out of their home one to three and four or more times per week, respectively. Regarding sweet food consumption, 258 (38.2%) and 129 (19.1%) of the participants consumed sweet food one to three times and three or more times per week, respectively.
About 220 (59.9%) and 27 (7.4%) of our study participants reported that they consumed meat-containing foods two and three times per week, respectively. Moreover, more than 10% of respondents declared that they added salt to their food in addition to the normal amount that was added to the food during cooking (Table 7).
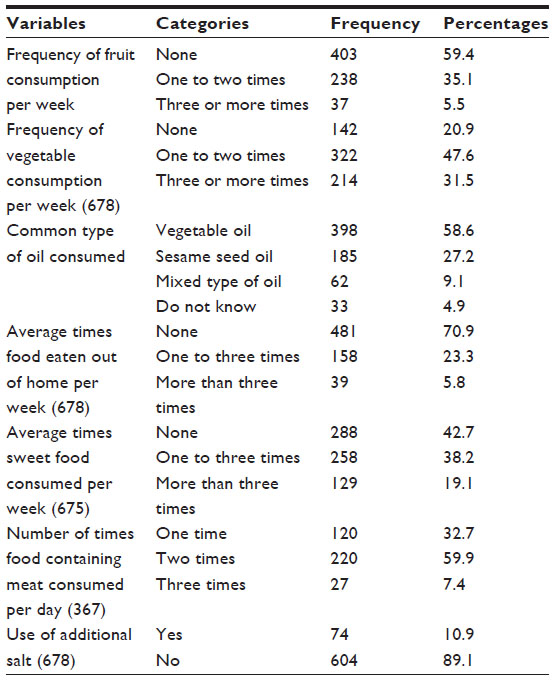 | Table 7 Feeding habits of adult population in Bahir Dar city, June 2014 |
Hypertension and blood sugar level among the adult population of Bahir Dar city
According to the current study, 410 (60.5%) of respondents had measured their BP by health professionals, and 104 (15.3%) were taking medications for hypertension. Out of the total known hypertensive patients, 31 (29.8%) visited traditional healers, and 16 of these patients (51.6%) were taking herbal medications during the survey. About 144 (21.2%) of the respondents had measured their blood sugar level, and 33 (4.9%) were taking medications for high blood sugar level (Table 8).
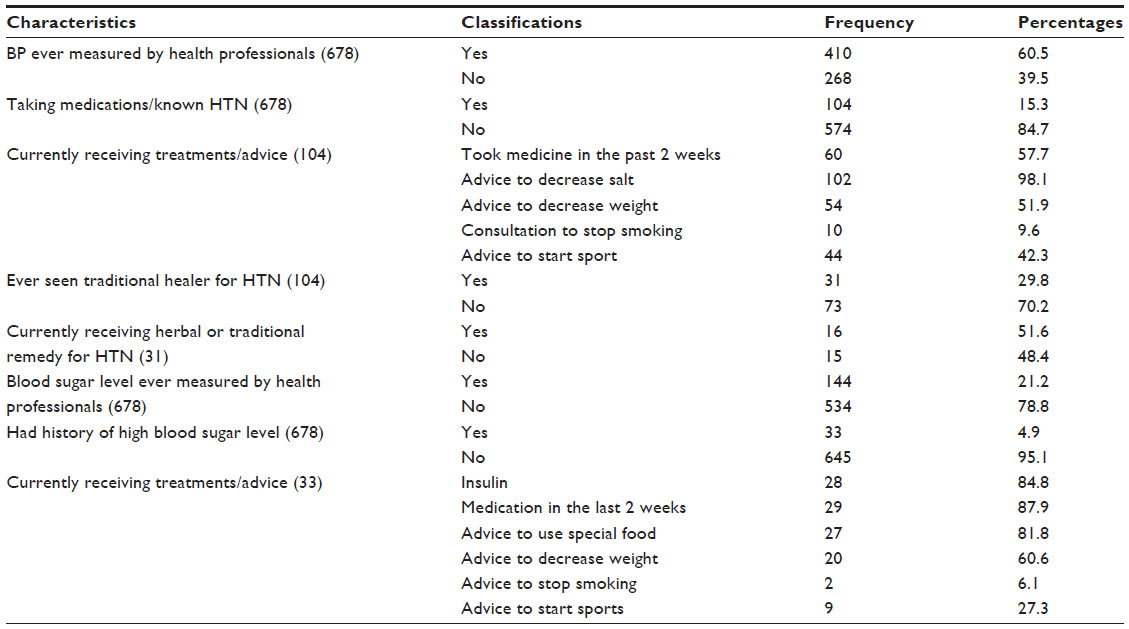 | Table 8 History and current hypertension status of adult population in Bahir Dar city, June 2014 |
Frequency distribution of BP, BMI, and waist-to-hip ratio among people in Bahir Dar city
The level of hypertension on screening tests had showed that 119 (17.6%), 134 (19.8%), and 15 (2.2%) respondents had prehypertension, hypertension stage I, and hypertension stage II, respectively, showing that the magnitude of respondents with systolic BP greater than or equal to 140 mmHg or diastolic BP greater than or equal to 90 mmHg was 149 (21.9%) on screening (Figure 1). However, the prevalence of known hypertensive patients who were taking antihypertensive drugs during the survey were 104 (15.3%). The overall prevalence of respondents whose systolic BP was greater or equal to 140 mmHg, whose diastolic BP was greater than or equal to 90 mmHg, or who were known hypertensive patients taking medications was 170 (25.1%).
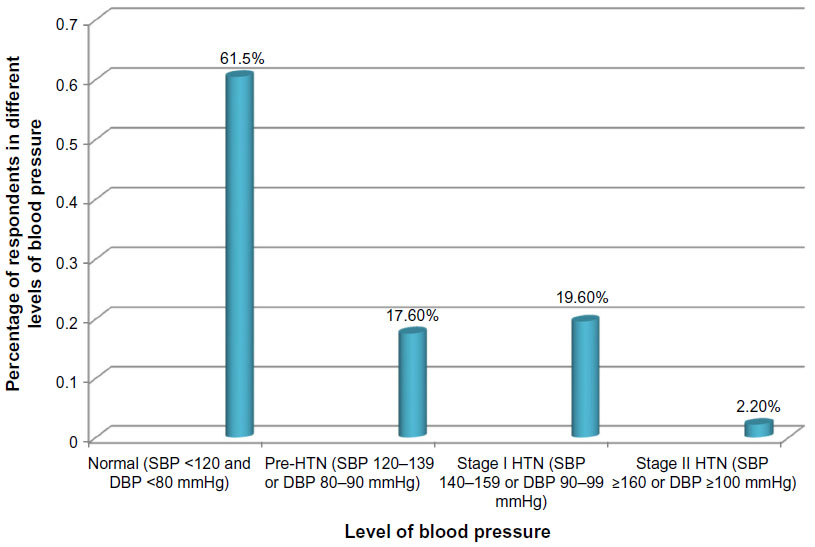 | Figure 1 Level of hypertension among people in Bahir Dar city, June 2014. |
Seventy-nine (76%) of the known hypertensive cases had systolic or diastolic BP of greater than 140 or 90 mmHg during the survey, respectively. Moreover, out of the total hypertensive patients, 66 (38.8%) were newly screened and unaware of being hypertensive during the survey (Table 9).
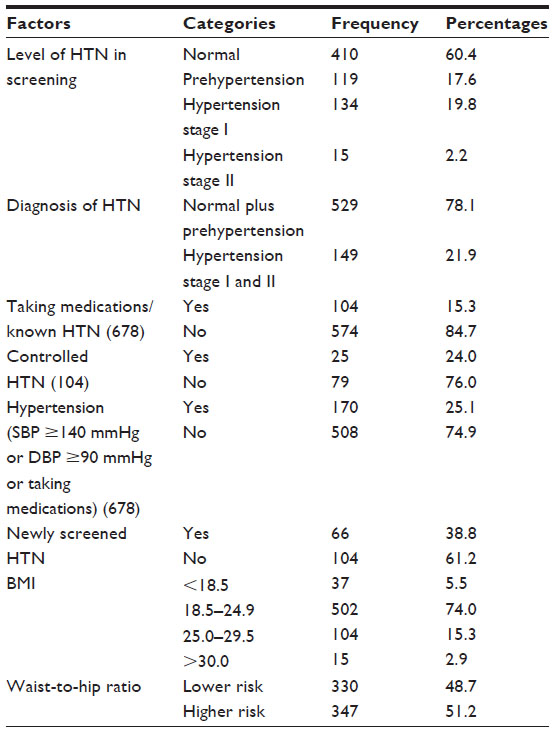 | Table 9 Frequency distribution of blood pressure, BMI, and waist-to-hip ratio among population of Bahir Dar city, June 2014 |
Regarding the BMI of the respondents, 104 (2.9%) and 20 (15.3%) respondents were found to be obese and overweight, respectively; of the total obese and overweight patients, 77 (62.1%) were females (Figure 2).
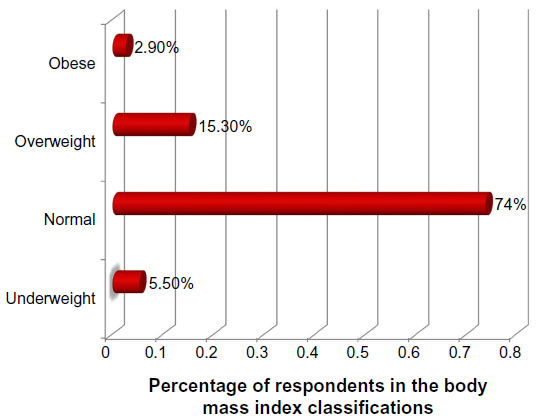 | Figure 2 Body mass index of adult population of Bahir Dar city, June 2014. |
The association between predictor variables and hypertension among the adult population in Bahir Dar city
Beyond the descriptive analysis on this study, the bivariate logistic regression analysis was computed. Accordingly, on the bivariate analysis, age; marital status; occupation; having ever smoked cigarettes; occupation with vigorous or moderate physical activity; walking or cycling to work; number of days walking per week; number of hours spent walking/cycling per day; number of hours spent watching TV; history of high blood sugar level; and BMI were found to be significantly associated with hypertension at P-value level of 0.2 (Table 10).
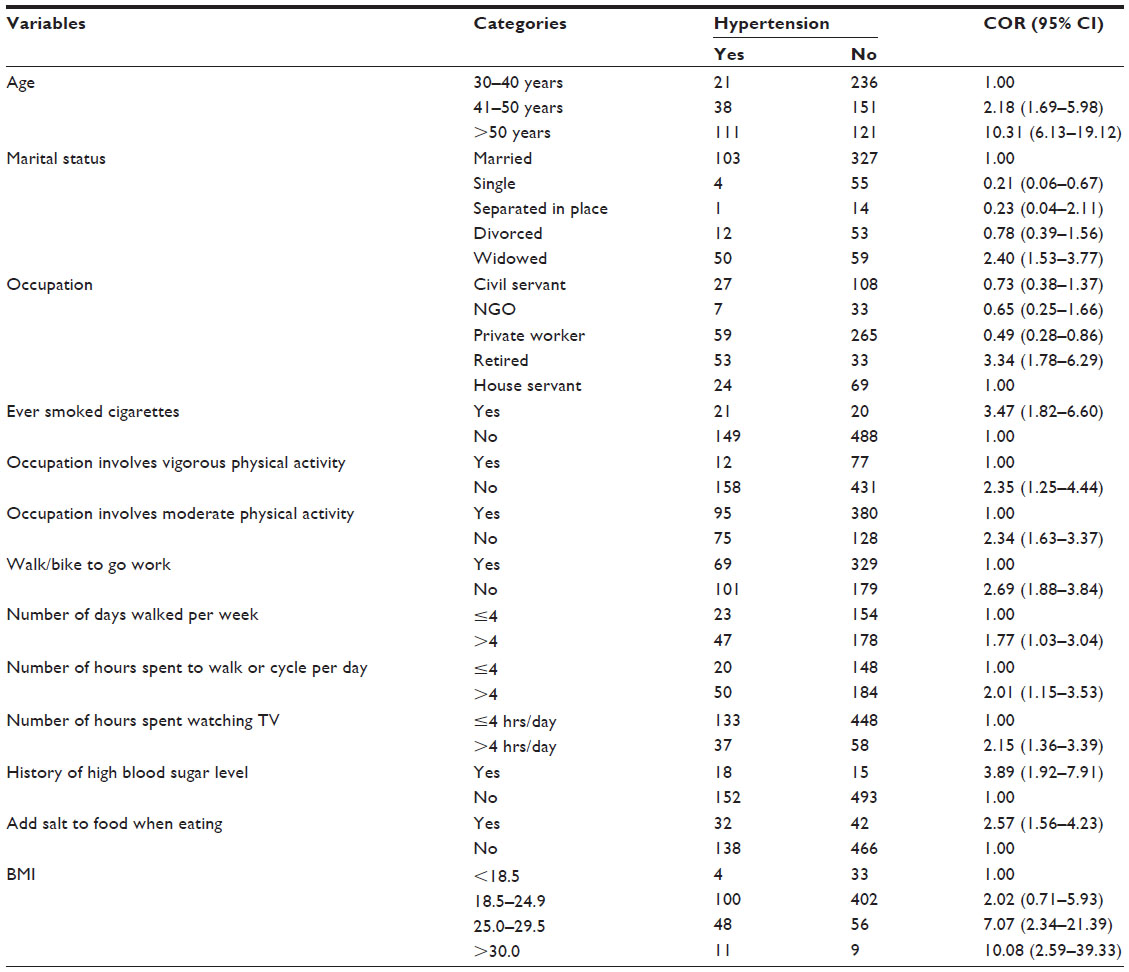 | Table 10 The association between selected predictor variables and hypertension on crude effect among adult population in Bahir Dar city, June 2014 |
Multivariate logistic regression analysis between predictor variables and hypertension among people living in Bahir Dar city
The effect of multicollinearity intra-predictor variables was tested observing the standard errors for beta coefficients. The assumptions of multiple logistic regression analysis were assessed using the Hosmer–Lemeshow model fitness test, resulting in a P-value of 0.985.
In the multivariate logistic regression analysis, age; having ever smoked cigarettes; number of hours spent walking/cycling per day; number of hours spent watching TV per day; history of high blood sugar level; adding salt to food in addition to the normal amount that was added to the food during cooking; and BMI were statistically significant predictors of hypertension.
Accordingly, the odds of developing hypertension among respondents of age 41–50 years and greater than 50 years were more than two- and seven-times more likely compared to those aged 30–40 years, respectively (adjusted odds ratio [AOR] =2.50, 95% CI: 1.25–5.02, and AOR =7.05, 95% CI: 3.51–14.15). The odds of developing hypertension among respondents who had ever smoked cigarettes was more than three-times more likely compared to the counterparts who had never smoked (AOR =3.2, 95% CI: 1.37–7.70). Respondents who spent 4 or more hours watching TV per day were more than two-times more at risk of developing hypertension compared to those spent less than 4 hours watching TV (AOR =2.1, 95% CI: 1.26–5.76).
Having history of high blood sugar level was the other significant predictor of hypertension, so that respondents who had a history of high blood sugar level were about three-times more likely to develop hypertension as compared to those had no history of high blood sugar level (AOR =2.8, 95% CI: 1.64–4.75). Also, respondents who add salt to food in addition to the normal amount that was added to the food during cooking were more than three-times more likely to have hypertension compared to those who do not add additional salt to food.
Moreover, the BMI of the respondents was statistically associated with developing hypertension, the odds of hypertension being more than six- and eleven-times higher among respondents whose BMI ranged from 25.0 to 29.9 and greater than 30.0 compared to whose BMI was less than 18.5, respectively (AOR =6.3, 95% CI: 2.16-20.49, and AOR =11.6, 95% CI: 2.93-46.21), respectively (Table 11).
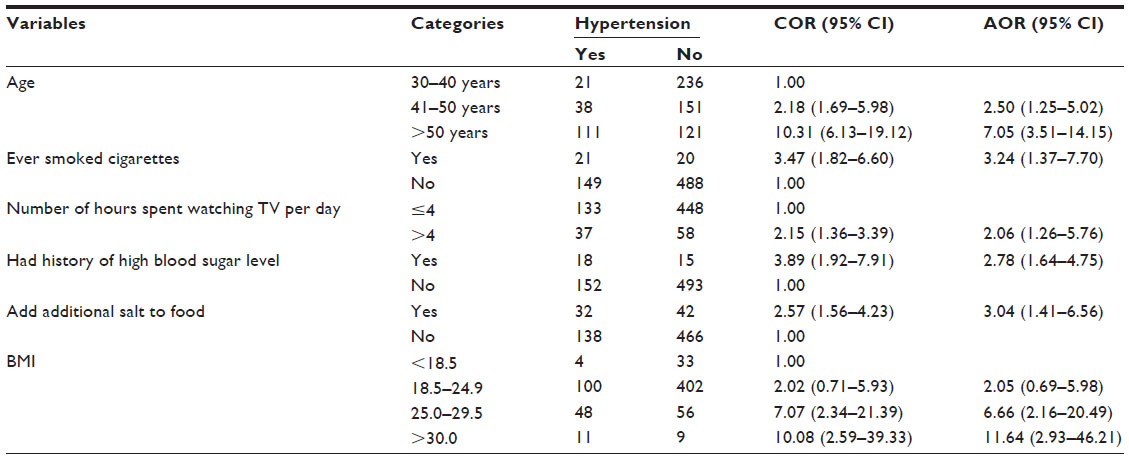 | Table 11 The correlation between selected predictor variables and hypertension after adjustment for confounding effect among people living in Bahir Dar city, June 2014 |
Discussion
The aim of this study was to determine the prevalence and factors associated with hypertension among an adult population. Accordingly, the prevalence of hypertension was 170 (25.1%). This finding is in line with other similar studies conducted in Durame and Gondar town where the magnitudes of hypertension were 22.4% and 28.3%, respectively.18,19 Also, our finding is in accordance with studies conducted in Jeddah, Egypt, and Maharashtra State, India, where the magnitudes of hypertension were 25.2% and 23%, respectively.20,21
However, our finding is lower than other similar studies conducted in different regions of Africa. A study conducted in Cameron found a much higher prevalence than our findings, with a prevalence of hypertension of 47.5%.13
Our finding is also much lower than that of a study conducted in Ghana and South Africa, where the magnitudes of hypertension among adult populations were 42.4% and 46%, respectively.22 However, our finding was higher than that of a study conducted in Bedele town, south Ethiopia, where the prevalence of hypertension was 16.9%.23 Also, the current study was much higher than that of a study conducted in River state in the Niger Delta region of Nigeria, where the magnitude of hypertension was 20.2%.24 The probable reason for the differences could be attributed to difference in sociodemographic characteristics, sample size, life style, and feeding habits.
About 61.2% of hypertension patients are aware of their hypertension status; however, 38.6% of hypertension patients are unaware of the condition, indicating that more than one out of three cases of hypertension do not know that they have it. This supports the notion that hypertension is a silent killer. This finding is in agreement with other similar studies, where 37% and 44.8% of hypertension patients did not know their status.18,23
Also, several variables were found to be significant predictors of hypertension. The odds of developing hypertension among respondents aged 41–50 years and greater than 50 years were more than two- and seven-times as likely compared to respondents aged less than 40 years, respectively (AOR =2.50, 95% CI: 1.25–5.02, and AOR =7.05, 95% CI: 3.51–14.15). This is in line with other studies where the risks of hypertension increase with age.20,22,25,26
The odds of developing hypertension among smokers was more than three-times as likely compared to their counter parts, who never smoked cigarette (AOR =3.2, 95% CI: 1.37–7.70). This supports that substance use is associated with cardiovascular diseases including hypertension. Our finding is in agreement with others similar studies where substance use was a significant predictor of hypertension.27,28
The study also revealed that self-reported diabetes was another significant predictor of hypertension. Diabetic patients were about three-times more likely to have hypertension as compared to those who had no history of high blood sugar level (AOR =2.8, 95% CI: 1.64–4.75). This finding was in accordance with other studies where high blood sugar level was significantly associated with hypertension.19,29
This study also indicated that respondents who added salt to food in addition to the normal amount that was added to the food during cooking were more than three-times as likely to have hypertension compared to those who did not added additional salt to food (AOR =3.04, 95% CI: 1.41–6.56). This finding is supported with evidence that high dietary salt consumption is associated with an increase in the mean population BP, as well as the prevalence of hypertension.30,31
Moreover, BMI was statistically associated with hypertension, with the odds of hypertension being more than six- and eleven-times higher among respondents who were overweight and obese as compared to respondents whose BMI was less than 18.5 (AOR =6.7, 95% CI: 2.16–20.49 and AOR =11.6, 95% CI: 2.93–46.21), respectively. This finding is in accordance with other similar studies, where higher BMI was associated with hypertension.18,19,21,23
Conclusion
This study showed that the prevalence of hypertension among a sample of the adult population in Bahir Dar city was 170 (25.1%). More than one out of three cases of hypertension (38.8%) did not know that they had the disease during the survey. The study further implies that 119 (17.6%) of the respondents were in prehypertension stage, which adds to the overall future risk of hypertension.
The analytic component of the study indicated that age; having ever smoked cigarettes; number of hours spent walking/cycling per day; number of hours spent watching TV per day; history of diabetes; adding salt to food in addition to the normal amount that was added to the food during cooking; and BMI were statistically significant predictors of hypertension.
Therefore, mass screening of hypertension, health education to prevent smoking, regular exercise, reducing salt consumption (especially discouraging adding salt to food in addition to the normal amount that was added to the food during cooking), and life style modifications are recommended.
Acknowledgments
We are indebted to all participants in this study. We thank our data collectors and supervisors for their valuable time spent collecting data. Also, we would like to acknowledge Bahir Dar University College of Medical Sciences where ethical approval for the study was obtained.
Author contributions
ZAA conceptualized the research problem and was involved in interpretation of data, report writing, and manuscript preparation. WAY was involved in writing the research proposal, data analysis, and manuscript writing. DBA was involved in writing the research proposal and the report, and was involved in manuscript preparation.
Disclosure
The authors report no conflicts of interest in this work.
References
Symposium on Non-Communicable Diseases in Ethiopia. The Harvard School of Public Health Multidisciplinary International Research Training (HSPH MIRT) Program, Addis Continental Institute of Public Health (ACIPH) and International Clinical Laboratories (ICL); November 8, 2012; Addis Ababa. | |
Hypertension [webpage on the Internet]. San Francisco: Wikimedia [updated April 28, 2013]. Available from: http://en.wikipedia.org/wiki/Hypertension. Accessed 16 May, 2014. | |
The Lancet publishes Global Burden of Disease 2010 study [webpage on the Internet]. Geneva: UICC [cited February 22, 2014]. Available from: http://www.uicc.org/lancet-publishes-global-burden-disease-2010-study. Accessed April 10, 2015. | |
The Sixth Session of the African Union Conference of Ministers of Health. Status Report on Hypertension in Africa. Addis Ababa Ethiopia, April 22, 2013. | |
Elliott WJ. The economic impact of hypertension. J Clin Hypertens (Greenwich). 2003;5(3 Suppl 2):3–13. | |
Centers for Disease Control and Prevention (CDC). Vital signs: prevalence, treatment, and control of hypertension – United States, 1999–2002 and 2005–2008. MMWR Morb Mortal Wkly Rep. 2011;60(4):103–108. | |
World Health Day, April 7, 2013: Hypertension. Nottingham: La Leche League GB; 2013 [cited May 16, 2014]. Available from: http://www.laleche.org.uk/content/world-health-day-april-7-2013-hypertension. Accessed April 10, 2015. | |
Appel LJ, Brands MW, Daniels SR, et al. Dietary approaches to prevent and treat hypertension: a scientific statement from the American Heart Association. Hypertension. 2006;47:296–308. | |
Srinath Reddy K, Katan MB. Diet, nutrition and the prevention of hypertension and cardiovascular diseases. Public Health Nutrition. 2004;7(1):167–186. | |
WebMD.com. Hypertension/High Blood Pressure Health Center [webpage on the Internet]. New York: WebMD [updated March 12, 2014]. Available from: http://www.webmd.com/hypertension-high-blood-pressure/tc/high-blood-pressure-hypertension-cause. Accessed April 10, 2015. | |
Mushtaq MU, Gull S, Mushtaq K, Shahid U, Shad MA, Akram J. Dietary behaviors, physical activity and sedentary lifestyle associated with overweight and obesity, and their socio-demographic correlates, among Pakistani primary school children. International Journal of Behavioral Nutrition and Physical Activity. 2011, 8:130. | |
Ogah OS, Okpechi I, Chukwuonye II, et al. Blood pressure, prevalence of hypertension and hypertension related complications in Nigerian Africans: A review. World J Cardiol. 2012;4(12):327–340. | |
Dzudie A, Kengne AP, Muna WF, et al. Prevalence, awareness, treatment and control of hypertension in a self selected sub-Saharan African urban population: a cross sectional study. BMJ Open. 2012;2(4). | |
Edwards R, Unwin N, Mugusi F, et al. Hypertension prevalence and care in an urban and rural area of Tanzania. J Hypertens. 2000;18: 145–152. | |
Tesfaye F, Byass P, Wall S. Population based prevalence of high blood pressure among adults in Addis Ababa: uncovering a silent epidemic. BMC Cardiovasc Disord. 2009;9:39. | |
National Heart, Lung and Blood Institute; National High Blood Pressure Education Program. Seventh Report of the Joint National Committee on Prevention, Detection, Evaluation, and Treatment of High Blood Pressure (JNC 7). 2004. Available from: http://www.nhlbi.nih.gov/sites/www.nhlbi.nih.gov/files/jnc7slides.pdf. Accessed April 10, 2015. | |
STEPwise approach to surveillance (STEPS) [webpage on the Internet]. Geneva: World Health Organization. Available from: www.who.int/chp/steps. Accessed April 10, 2015. | |
Helelo TP, Gelaw YA, Adane AA. Prevalence and associated factors of hypertension among adults in Durame Town, Southern Ethiopia. PLoS One. 2014;9(11):e112790. | |
Awoke A, Awoke T, Alemu S, Megabiaw B. Prevalence and associated factors of hypertension among adults in Gondar, Northwest Ethiopia: a community based cross-sectional study. BMC Cardiovasc Disord. 2012;12:113. | |
Ibrahim NK, Hijazi NA, Al-Bar AA. Prevalence and Determinants of Prehypertension and Hypertension among Preparatory and Secondary School Teachers in Jeddah. J Egypt Public Health Assoc. 2008;83(3–4):183–203. | |
Meshram II, Laxmaiah A, Mallikharjun Rao K, et al. Prevalence of Hypertension and Its Correlates among Adult Tribal Population (≥20 Years) of Maharashtra State, India. Int J Health Sci Res. 2014;4(1):130–139. | |
Gebreselassie KZ, Padyab M. Epidemiology of Hypertension Stages in Two Countries in Sub-Sahara Africa: Factors Associated with Hypertension Stages. Int J Hypertens. Article ID 959256. In press 2014. | |
Bonsa F, Gudina EK, Hajito KW. Prevalence of hypertension and associated factors in Bedele Town, Southwest Ethiopia. Ethiop J Health Sci. 2014;24(1):21–26. | |
Alikor CA, Emem-Chioma PC, Odia OJ. Hypertension in a rural community in Rivers State, Niger Delta Region of Nigeria: Prevalence and risk factors. Nigerian Health Journal. 2013;13(1):18–25. | |
Manimunda SP, Sugunan AP, Benegal V, Balakrishna N, Rao MV, Pesala KS. Association of hypertension with risk factors & hypertension related behaviour among the aboriginal Nicobarese tribe living in Car Nicobar Island, India. Indian J Med Res. 2011;133(3):287–293. | |
Jaddou HY, Batieha AM, Khader YS, Kanaan AH, El-Khateeb MS, Ajlouni KM. Hypertension prevalence, awareness, treatment and control, and associated factors: results from a national survey, Jordan. Int J Hypertens. Epub 2014 Dec 1. | |
Virdis A, Giannarelli C, Neves MF, Taddei S, Ghiadoni L. Cigarette smoking and hypertension. Curr Pharm Des. 2010;16(23):2518–2525. | |
Ferdinand KC. Substance abuse and hypertension. J Clin Hypertens (Greenwich). 2000;2(1):37–40. | |
Sowers JR, Epstein M. Diabetes mellitus and associated hypertension, vascular disease, and nephropathy. An update. Hypertension. 1995;26:869–879. | |
Alderman MH. Salt, blood pressure, and human health. Hypertension. 2000;36:890–893. | |
World Health Day 2013 [webpage on the Internet]. Geneva: World Health Organization; 2013. Available from: http://www.emro.who.int/world-health-days/2013/. Accessed April 10, 2015. |
 © 2015 The Author(s). This work is published and licensed by Dove Medical Press Limited. The full terms of this license are available at https://www.dovepress.com/terms.php and incorporate the Creative Commons Attribution - Non Commercial (unported, v3.0) License.
By accessing the work you hereby accept the Terms. Non-commercial uses of the work are permitted without any further permission from Dove Medical Press Limited, provided the work is properly attributed. For permission for commercial use of this work, please see paragraphs 4.2 and 5 of our Terms.
© 2015 The Author(s). This work is published and licensed by Dove Medical Press Limited. The full terms of this license are available at https://www.dovepress.com/terms.php and incorporate the Creative Commons Attribution - Non Commercial (unported, v3.0) License.
By accessing the work you hereby accept the Terms. Non-commercial uses of the work are permitted without any further permission from Dove Medical Press Limited, provided the work is properly attributed. For permission for commercial use of this work, please see paragraphs 4.2 and 5 of our Terms.