")
Back to Journals » Diabetes, Metabolic Syndrome and Obesity » Volume 12
Prevalence and clinical characteristics of metabolically unhealthy obesity in an Iranian adult population
Authors Rahmanian K, Shojaei M, Sotoodeh Jahromi A
Received 7 December 2018
Accepted for publication 24 July 2019
Published 13 August 2019 Volume 2019:12 Pages 1387—1395
DOI https://doi.org/10.2147/DMSO.S197476
Checked for plagiarism Yes
Review by Single anonymous peer review
Peer reviewer comments 2
Editor who approved publication: Prof. Dr. Juei-Tang Cheng
Karamatollah Rahmanian,1 Mohammad Shojaei,2 Abdolreza Sotoodeh Jahromi2
1Research Center for Social Determinants of Health, Community Medicine Department, Faculty of Medicine, Jahrom University of Medical Sciences, Jahrom, Iran; 2Research Center for Non-communicable Diseases, Internal Diseases Department, Faculty of Medicine, Jahrom University of Medical Sciences, Jahrom, Iran
Purpose: The incidence of obesity is globally increasing and it is a predisposing factor for morbidity and mortality. This study assessed the prevalence of metabolically unhealthy (MU) individuals and its determinants according to body mass index (BMI).
Materials and method: In our cross-sectional study, 891 persons aged 30 years or older participated. Participants were classified as obese (BMI ≥30 kg/m2), overweight (BMI 25–<30 kg/m2 and normal weight (BMI <25 kg/m2). Metabolic health status was defined using four existing cardio-metabolic abnormalities (elevated blood pressure, elevated serum concentrations of triglyceride and fasting glucose and a low serum concentration of high density lipoprotein cholesterol). Then, two phenotypes were defined: healthy (existence of 0–1 cardio-metabolic abnormalities) and unhealthy (presence of 2 or more cardio-metabolic abnormalities).
Result: Overall, 10.9% (95% confidence interval (CI): 8.8–13.0) and 7.2% (95% CI: 5.5–8.9) of participants were MU obese and metabolically healthy obese, respectively. The prevalence of MU was higher in overweight (55.6%; 95% CI: 50.6–60.6, p<0.001) and obese (60.2%; 95% CI: 52.8–67.6, p=0.001) subjects than in individuals with a normal weight (37.5%; 95% CI: 29.4–42.6). Multiple logistic regression analysis showed an association of a MU state with age and dyslipidaemia in the BMI subgroups and with female sex in the normal weight individuals.
Conclusion: The prevalence of a MU state increased with increasing BMI. Ageing and dyslipidaemia were associated with an unhealthy metabolic state in normal weight, overweight and obese subjects and with the female sex in normal weight subjects.
Keywords: metabolically healthy, metabolically unhealthy, obesity, overweight, prevalence, Iran
Introduction
The prevalence of obesity is increasing worldwide1 and it was reported in 2011–2013 that 16.5% of Iranian subjects older than 18 years were obese.2 Also, as part of the Jahrom Health Study (JHS), 9.9% of men and 24.8% of women aged 30 years or older were obese.3 Obesity is a strong risk factor for several chronic diseases, such as hypertension (HTN), pre-diabetes, diabetes mellitus type 2 (DMT2), dyslipidaemia and cardiovascular disease.4–9 According to a study conducted in Jahrom, the prevalence of cardiovascular risk factors in adults were 11.6% for diabetes mellitus,10 31.4% for hypertension,5 19.8% in men and 16.2% in women for hypertriglyceridemia3 and 9.4% in men and 13.3% in women for hypercholesterolemia.3
Most obese subjects have one or more metabolic abnormalities. In the JHS Study, 24.7% of men and 32.2% women had metabolic syndrome.11 However, some, but not all, obese subjects have obesity-related metabolic abnormalities that are collectively referred to as metabolically unhealthy obesity (MUO). Currently, the prevalence of the MUO phenotype varies from 10.6 to 20.1% according to diverse definitions of metabolic abnormalities.12 In a study conducted on subjects aged 35–74 years in Spain, the prevalence of MUO was 26.3%.13 In another study, the MUO phenotype was detected in 19.4% of Russian people aged 25–64 years.14 The prevalence of MUO varies in different populations according to the age of the participants and the definition of a metabolically unhealthy (MU) subject.
Cohort studies have evaluated the risk of MUO for several conditions. Many investigators found that the incidences of all-cause mortality,15 hypertension,16 acute myocardial infarction,17 subclinical atherosclerosis18 and coronary artery disease15 were increased in individuals with the MUO phenotype relative to the metabolically healthy obese (MHO) group. Also, the ischaemic stroke rate for the MUO subjects was significantly increased relative to the MHO and metabolically healthy normal weight (MHNW) groups during a mean follow-up of 7.4±1.5 years.19 Others have suggested that the risk of type 2 diabetes mellitus20–22 and abnormalities of serum liver enzymes including gamma glutamyl-transferase and alanine aminotransferase23 are increased in MUO compared with MHO.
Metabolic abnormalities are frequent in the general population of south of Iran,3,5,10 nevertheless information of metabolic deformities in obese individuals are infrequent. Therefore, the aim of the current study was to evaluate the prevalence and clinical characteristics of MU individuals according to body mass index (BMI) groups in an Iranian adult people aged 30 years or older in south region of Iran.
Materials and methods
This study was conducted using data obtained from the JHS. The JHS is a cross-sectional survey of the urban adult population (age ≥30 years) in Jahrom (population; near 120,000), in 175 kilometres in the south eastern region of Shiraz, Fars province, Iran. A multi-stage clustered probability design was applied to this survey.5 From all 10 urban health centres (with 9,000–15,000 people) and according to its population, sex, and age groups (male/female and aged 30–34, 35–39, 40–44, 45–49, 50–54, 55–59, 60–64, 65–69 and 70 years or older), a total of 1,000 individuals aged 30 years or over were randomly selected for the JHS. Thus, 891 subjects were included in the present study. All participants consent was written informed consent. The protocol of the JHS was approved by the Ethical Review Board of the Jahrom University of Medical Sciences (ethics code: JUMS.REC.1378.51.7). All procedures were performed in accordance with the Declaration of Helsinki.
All participants answered a questionnaire developed and administered by well-trained investigators, including data on smoking status (never, current), level of education (illiterate, primary school, secondary school, high school, university), marital status (married and single [unmarried, widow, or divorced]), history of hypertension, diabetes mellitus, dyslipidaemia, cardiovascular diseases, liver problems and renal disease, as well as current medications. Questionnaire filling, anthropometric and blood pressure measurements and fasting blood samples were conducted in the clinical and laboratory centre in the Paymanie Hospital at the Jahrom University of Medical Sciences.
Anthropometric measurements were obtained for all participants by a physician. Height was determined to the nearest 0.1 cm with a stadiometer and weight was measured to the nearest 0.1 kg on a portable Seca 700 (Seca, Germany). BMI was calculated as weight (kg) divided by height squared (m2). Blood pressure was measured on the right arm using a mercury sphygmomanometer (Richter, Germany) after the subject had rested for 5 mins in a seated position. Systolic blood pressure (SBP) and diastolic blood pressure (DBP) were measured two times at 5 min intervals and the average was used in the analyses. Hypertension was defined as an average SBP ≥140 mmHg, an average DBP ≥90 mmHg and/or self-reported current treatment for hypertension with antihypertensive medication.
Blood was taken from each participant by trained medical personnel after 8–10 hrs of overnight fasting. Blood glucose, total cholesterol (TC), low density lipoprotein cholesterol (LDL-C), high density lipoprotein cholesterol (HDL-C) and triglycerides (TG) were measured. TC and triglyceride levels were measured by enzymatic techniques using a Selectra E bio-chromatic analyser. HDL and LDL levels were measured after precipitation of the other lipoproteins with heparin and manganese chloride. Plasma glucose levels were measured by the glucose oxidase method.
Diabetes mellitus was defined as having two fasting serum glucose assessments of ≥126 mg/dl or being treated for diabetes. Dyslipidaemia was defined according to the recent recommendations of the American Heart Association; that is, TC ≥200 mg/dl and/or triglyceride ≥200 mg/dl and/or LDL cholesterol ≥130 mg/dl and/or HDL cholesterol <40 mg/dl. We used the cut-offs recommended by the National Cholesterol Education Programme Expert Panel on Detection, Evaluation and Treatment of High Blood Cholesterol in Adults (ATP III):24 hypercholesterolemia was set as a total serum cholesterol ≥240 mg/dl, high LDL-C as a level of LDL-C ≥160 mg/dl and hypertriglyceridemia as serum TG levels ≥200 mg/dl and/or current use of lipid lowering medication, while low HDL-C was set as <40 mg/dl for men and <50 mg/dl for women. Overweight was defined as a BMI between 25 kg/m2 and <30 kg/m2 and obesity was defined as a BMI 30 kg/m2 or higher.
Cardio-metabolic risk factors (CMRFs) were defined using the components of metabolic syndrome defined by the International Diabetes Federation: systolic or diastolic BP ≥130/85 mmHg or taking antihypertensive drugs; fasting blood glucose ≥100 mg/d or drug treatment for previously diagnosed diabetes; TG ≥150 mg/dl or lipid lowering medication use; HDL cholesterol <40 mg/dl in men and <50 mg/d in women or taking medication to treat hyperlipidaemia. Subjects with 0–1 CMRF were defined as metabolically healthy (MH) and those with at least 2 CMRFs were defined as metabolically unhealthy (MU). Metabolically healthy overweight (MHOW), metabolically unhealthy overweight (MUOW), metabolically healthy obesity (MHO), metabolically unhealthy obesity (MUO), MHNW and metabolically unhealthy normal weight (MUNW) phenotypes were classified according to overweight, obesity or normal weight and the presence or absence of CMRF(s).
Statistical analyses were performed with SPSS software, version 16 (SPSS, Chicago, USA). Continuous variables are expressed as the mean ± standard deviation and categorical variables are presented as the percentage. We compared the socio-demographic, anthropometric and cardio-metabolic factors such as sex, marital status, education levels, smoking status, diabetes mellitus, HTN, hypercholesterolemia, hypertriglyceridemia, high LDL-C and dyslipidaemia between the MH and MU subjects in each BMI group by chi squared tests. Also, we used one-way analysis of variance tests for comparing continuous variables such as age, SBP, DBP, FBS, TG, TC, LDL-C and HDL-C. A multiple logistic regression model was used to estimate the adjusted odds ratio (OR) and its 95% confidence interval for some variables for the MU and healthy at normal weight, overweight and obese participants. The variables age group, sex, education, marital status, smoking status, dyslipidaemia and hypercholesterolemia were included in the multiple logistic regression models. The age groups were categorised as 30–44, 45–59 and ≥60 years and the age group of 30–44 was considered as the reference category. Sex (female vs male), education level (educated vs illiterate, secondary-diploma vs illiterate, primary vs illiterate), smoking status (current smoker vs others) and marital status (married vs others) were compared. Dyslipidaemia and hypercholesterolemia were categorised as yes vs no. P-values <0.05 were considered to be statistically significant.
Results
In total, 891 subjects aged 30–91 years, mean age of 50.0±13.46 years, participated in our study. Among these, 405 (45.5%) individuals were male; 89.5% were married and 18.9%, 25.6%, 39.8% and 15.7%, respectively, were illiterate, primary education level, secondary education level and diploma and a higher academic degree.
The prevalence of MUO, MUOW and MUNW were 10.9%, 23.9% and 14.6%, respectively (Table 1). The prevalence of MU was significantly higher in obese (60.2%; 95% confidence interval (CI): 52.8–67.6, p<0.001) and overweight (55.6%; 95% CI: 50.6–60.6, p<0.001) subjects than in individuals with a normal weight (37.5%; 95% CI: 29.4–42.6).
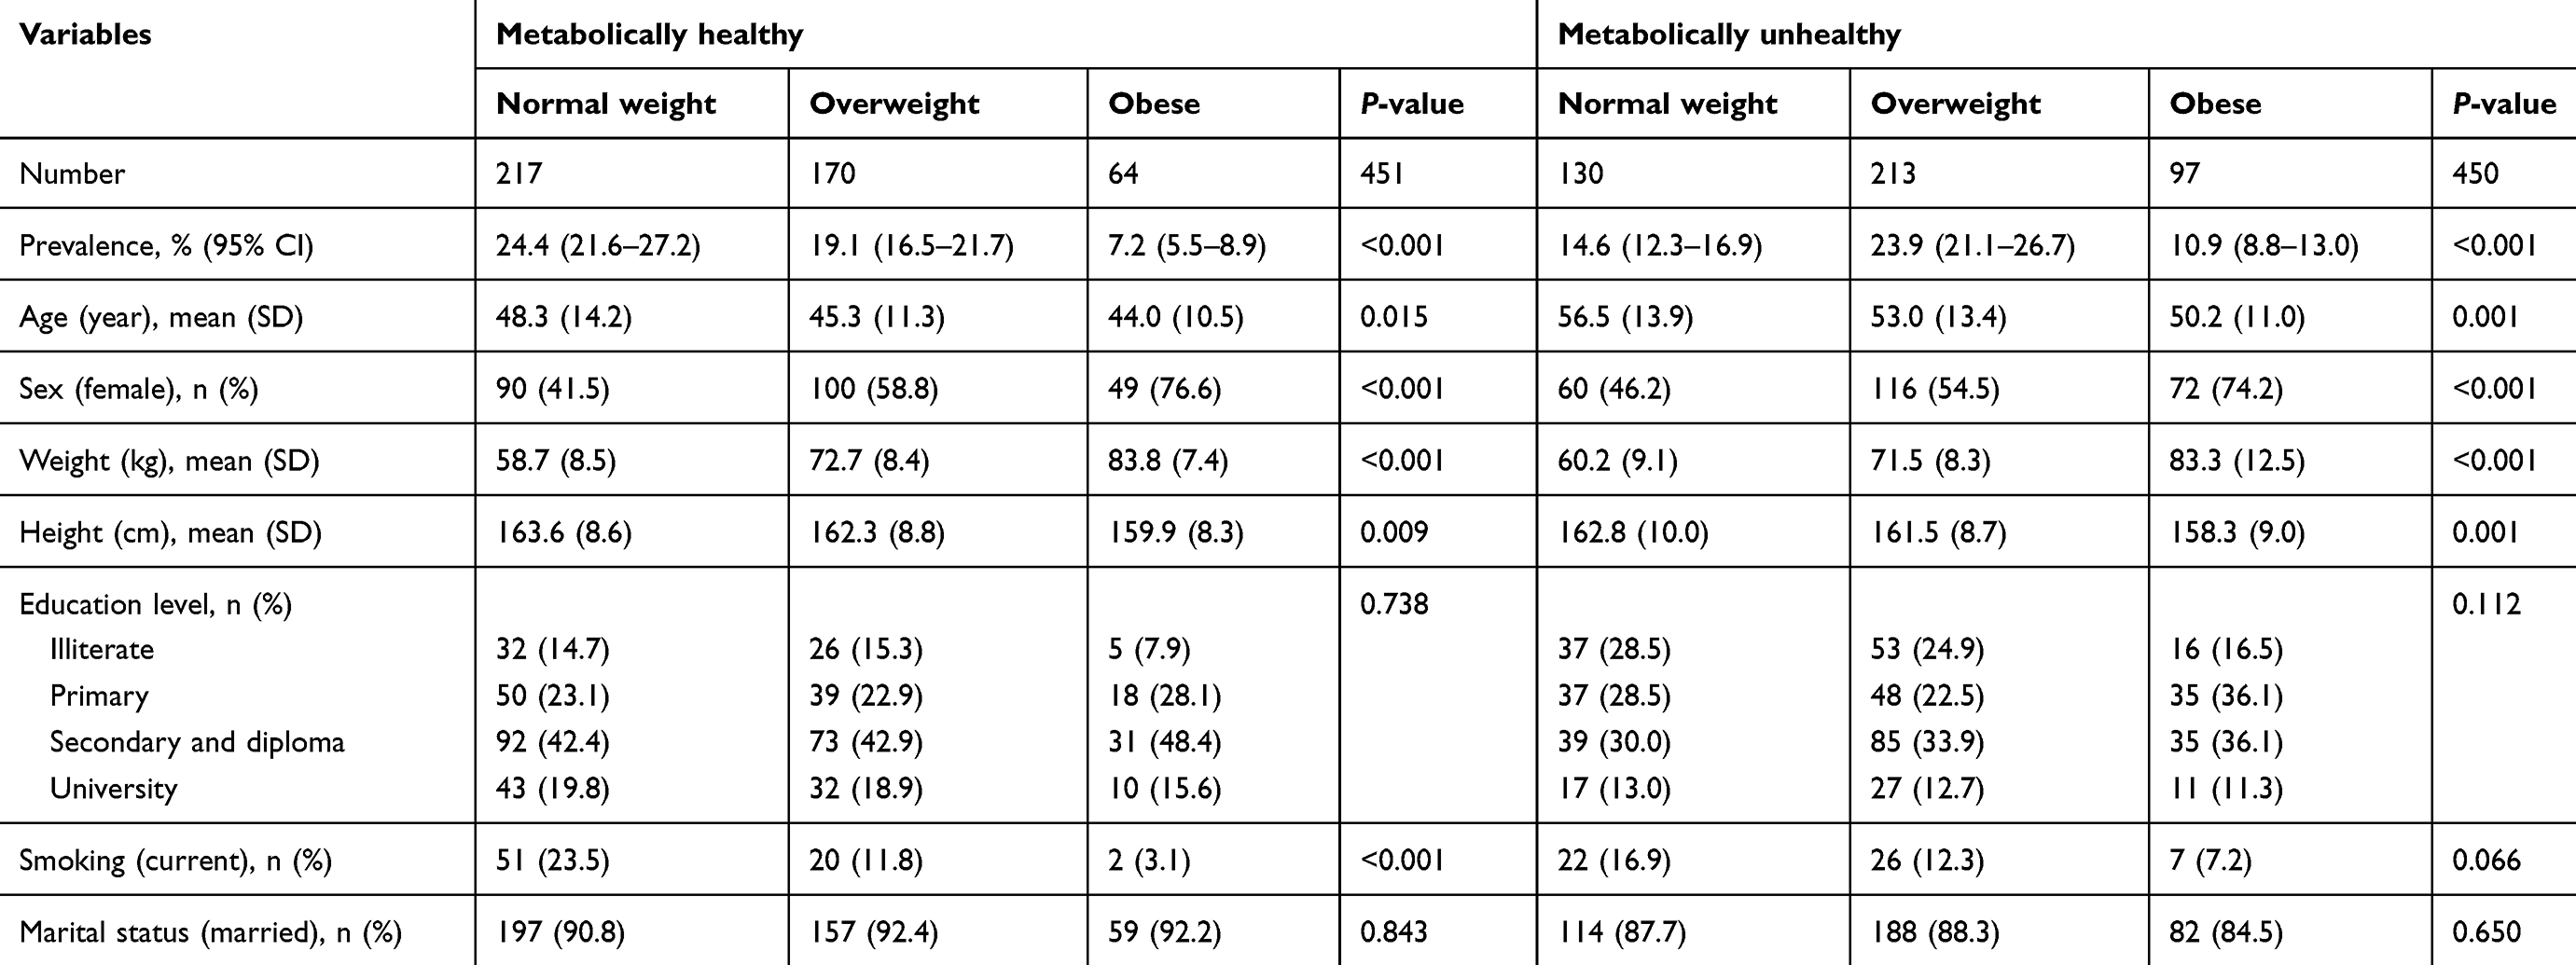 |
Table 1 Demographic, anthropometric and social factors among metabolically healthy and unhealthy subjects according to the body mass index groups |
As shown in Table 1, the distribution of age, sex, weight and height was significantly different among the MU and MH subjects according to the BMI groups but not significantly different for education level and marital status. In other words, the obese (p<0.001 and p=0.017) and overweight (p=0.017 and p=0.021) subjects were younger than the normal weight subjects in both the MU and MH groups. Also, the obese and overweight subjects were more likely to be female than normal weight individuals among both the MU and MH subjects. Not surprisingly, obese (p<0.001 and p<0.001) and overweight (p<0.001 and p<0.001) persons were heavier than subjects with a normal weight for both MU and MH individuals. In addition, obese subjects (p<0.001 and p=0.003) were significantly shorter than normal weight individuals for both MU and MH persons. Also, obese subjects (p=0.005) were shorter than overweight individuals among the MU persons. Current smoking status was significantly different for the MH individuals. Thus, normal weight and overweight subjects were more likely to be smokers than the obese participants.
In MH participants, there were no significant differences in SBP and serum concentration of FBS, TG and HDL-C, percent of HTN, DMT2, hypertriglyceridemia, hypercholesterolemia, high LDL-C, or low HDL-C according to BMI groups (Table 2). However, DBP was higher in the obese (p=0.002) and overweight (p=0.021) individuals. Also, serum levels of TC and LDL-C were significantly higher in obese (p=0.012 and p=0.020) and overweight (p<0.001 and p<0.001) subjects. Overweight subjects had a higher prevalence of dyslipidaemia (p<0.001) compared to normal weight and obese subjects. Similar to the MH group, in MU individuals, there were no significant differences in SBP and the serum concentrations of FBS, TG, HDL-C, percent of HTN, DMT2, hypertriglyceridemia, hypercholesterolemia, high LDL-C, or low HDL-C according to the BMI groups and also not for DBP, TC, LDL-C and dyslipidaemia.
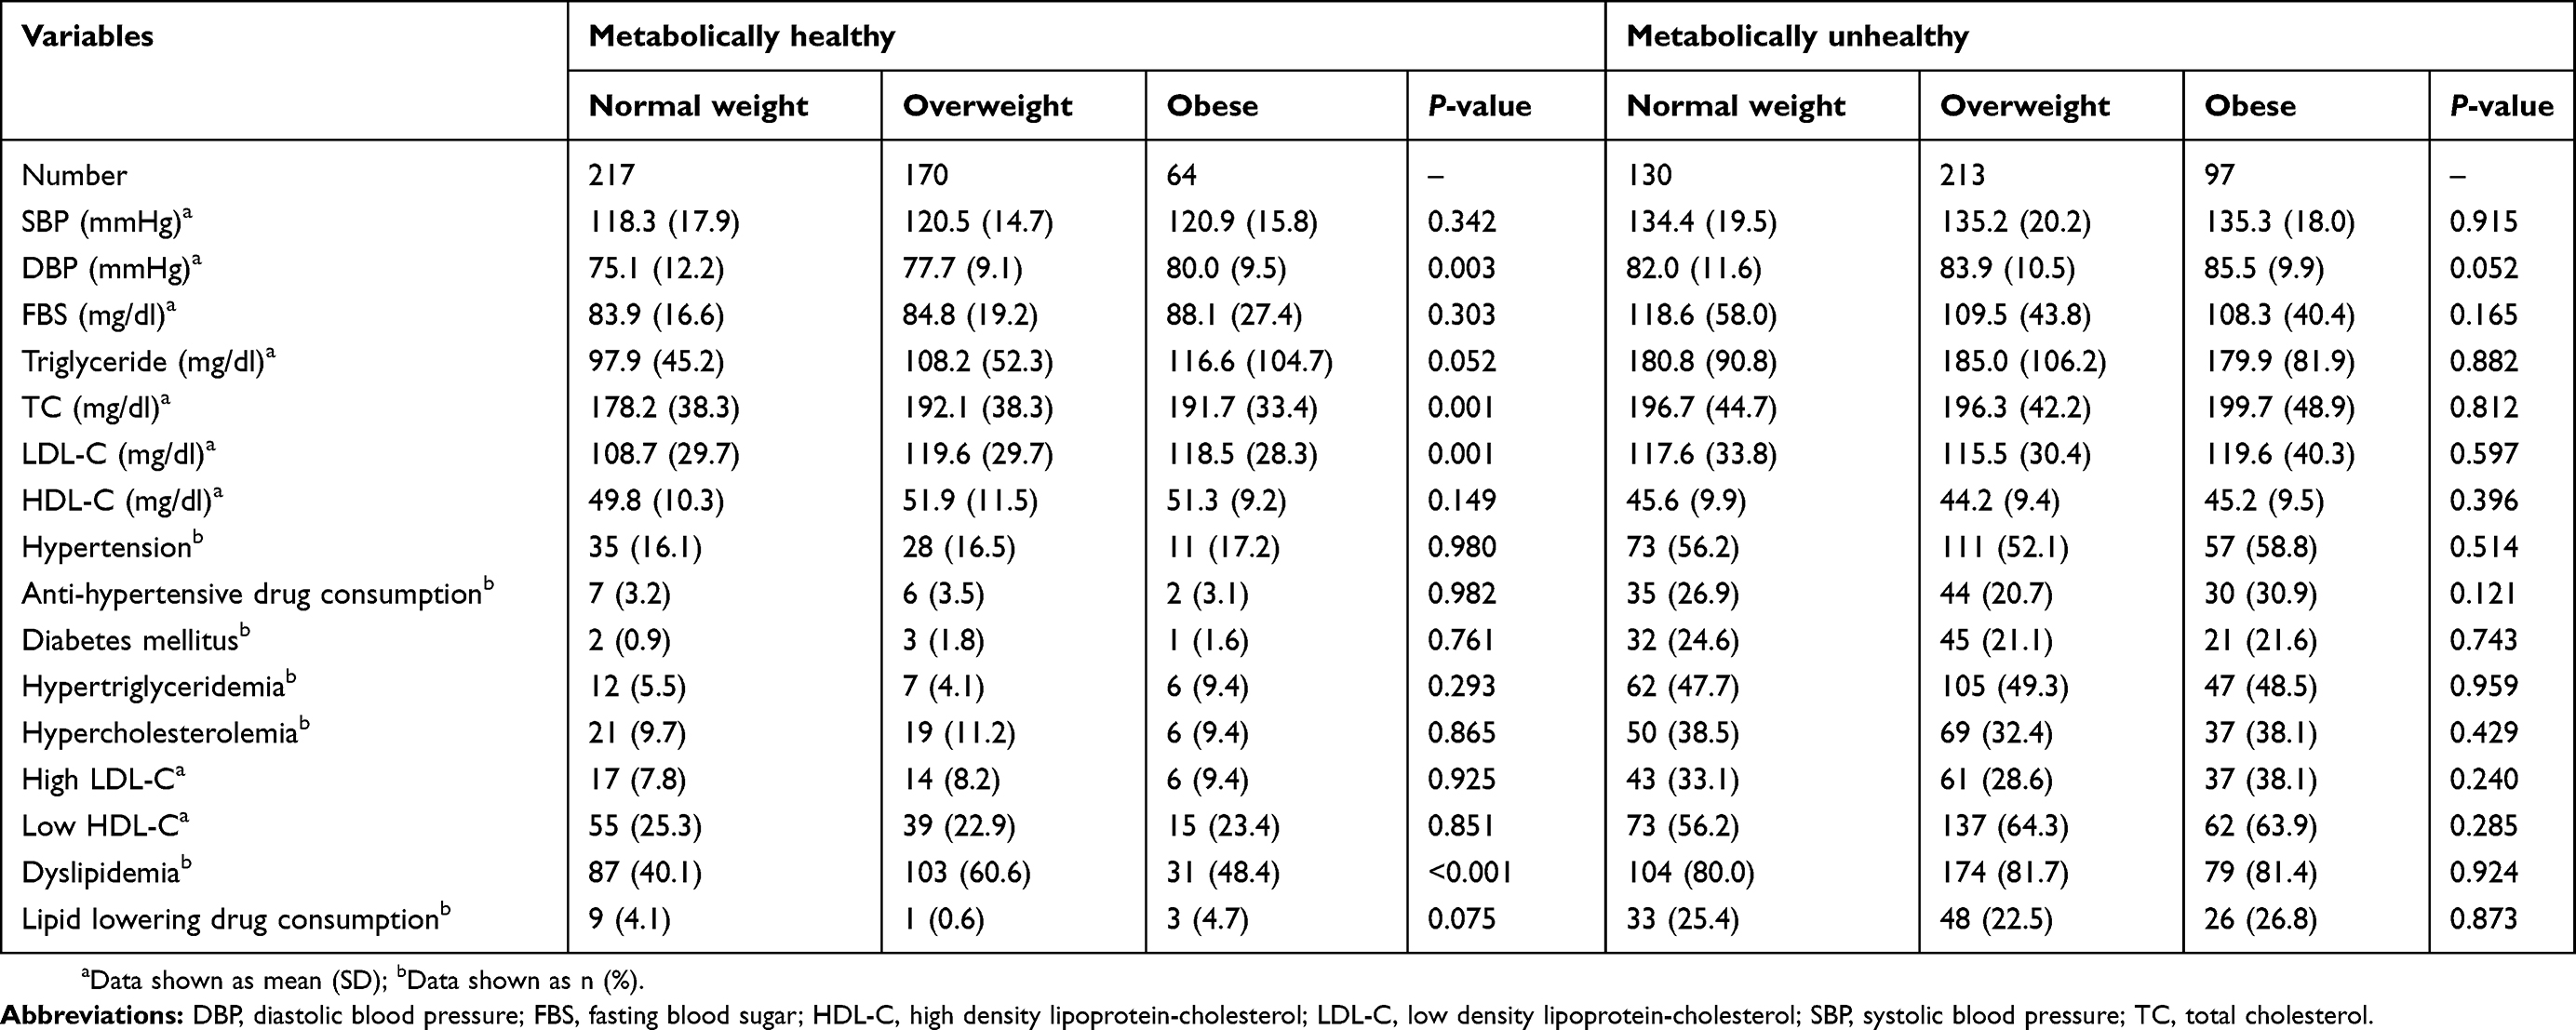 |
Table 2 Cardio-metabolic risk factors among metabolically healthy and unhealthy subjects according to the body mass index groups |
The multiple logistic regression results (Table 3) of obese participants showed a significant relationship to MUO with an age group of ≥60 years (p=0.026) and dyslipidaemia (p<0.001). Similarly, MUNW was associated with an age group of ≥60 years (p<0.001) and dyslipidaemia (p<0.001) and also with female sex (p=0.040). In overweight subjects, being MH in the MUOW was associated with an age 45–59 years (p=0.001), age ≥60 years (p<0.001), and dyslipidaemia (p<0.001).
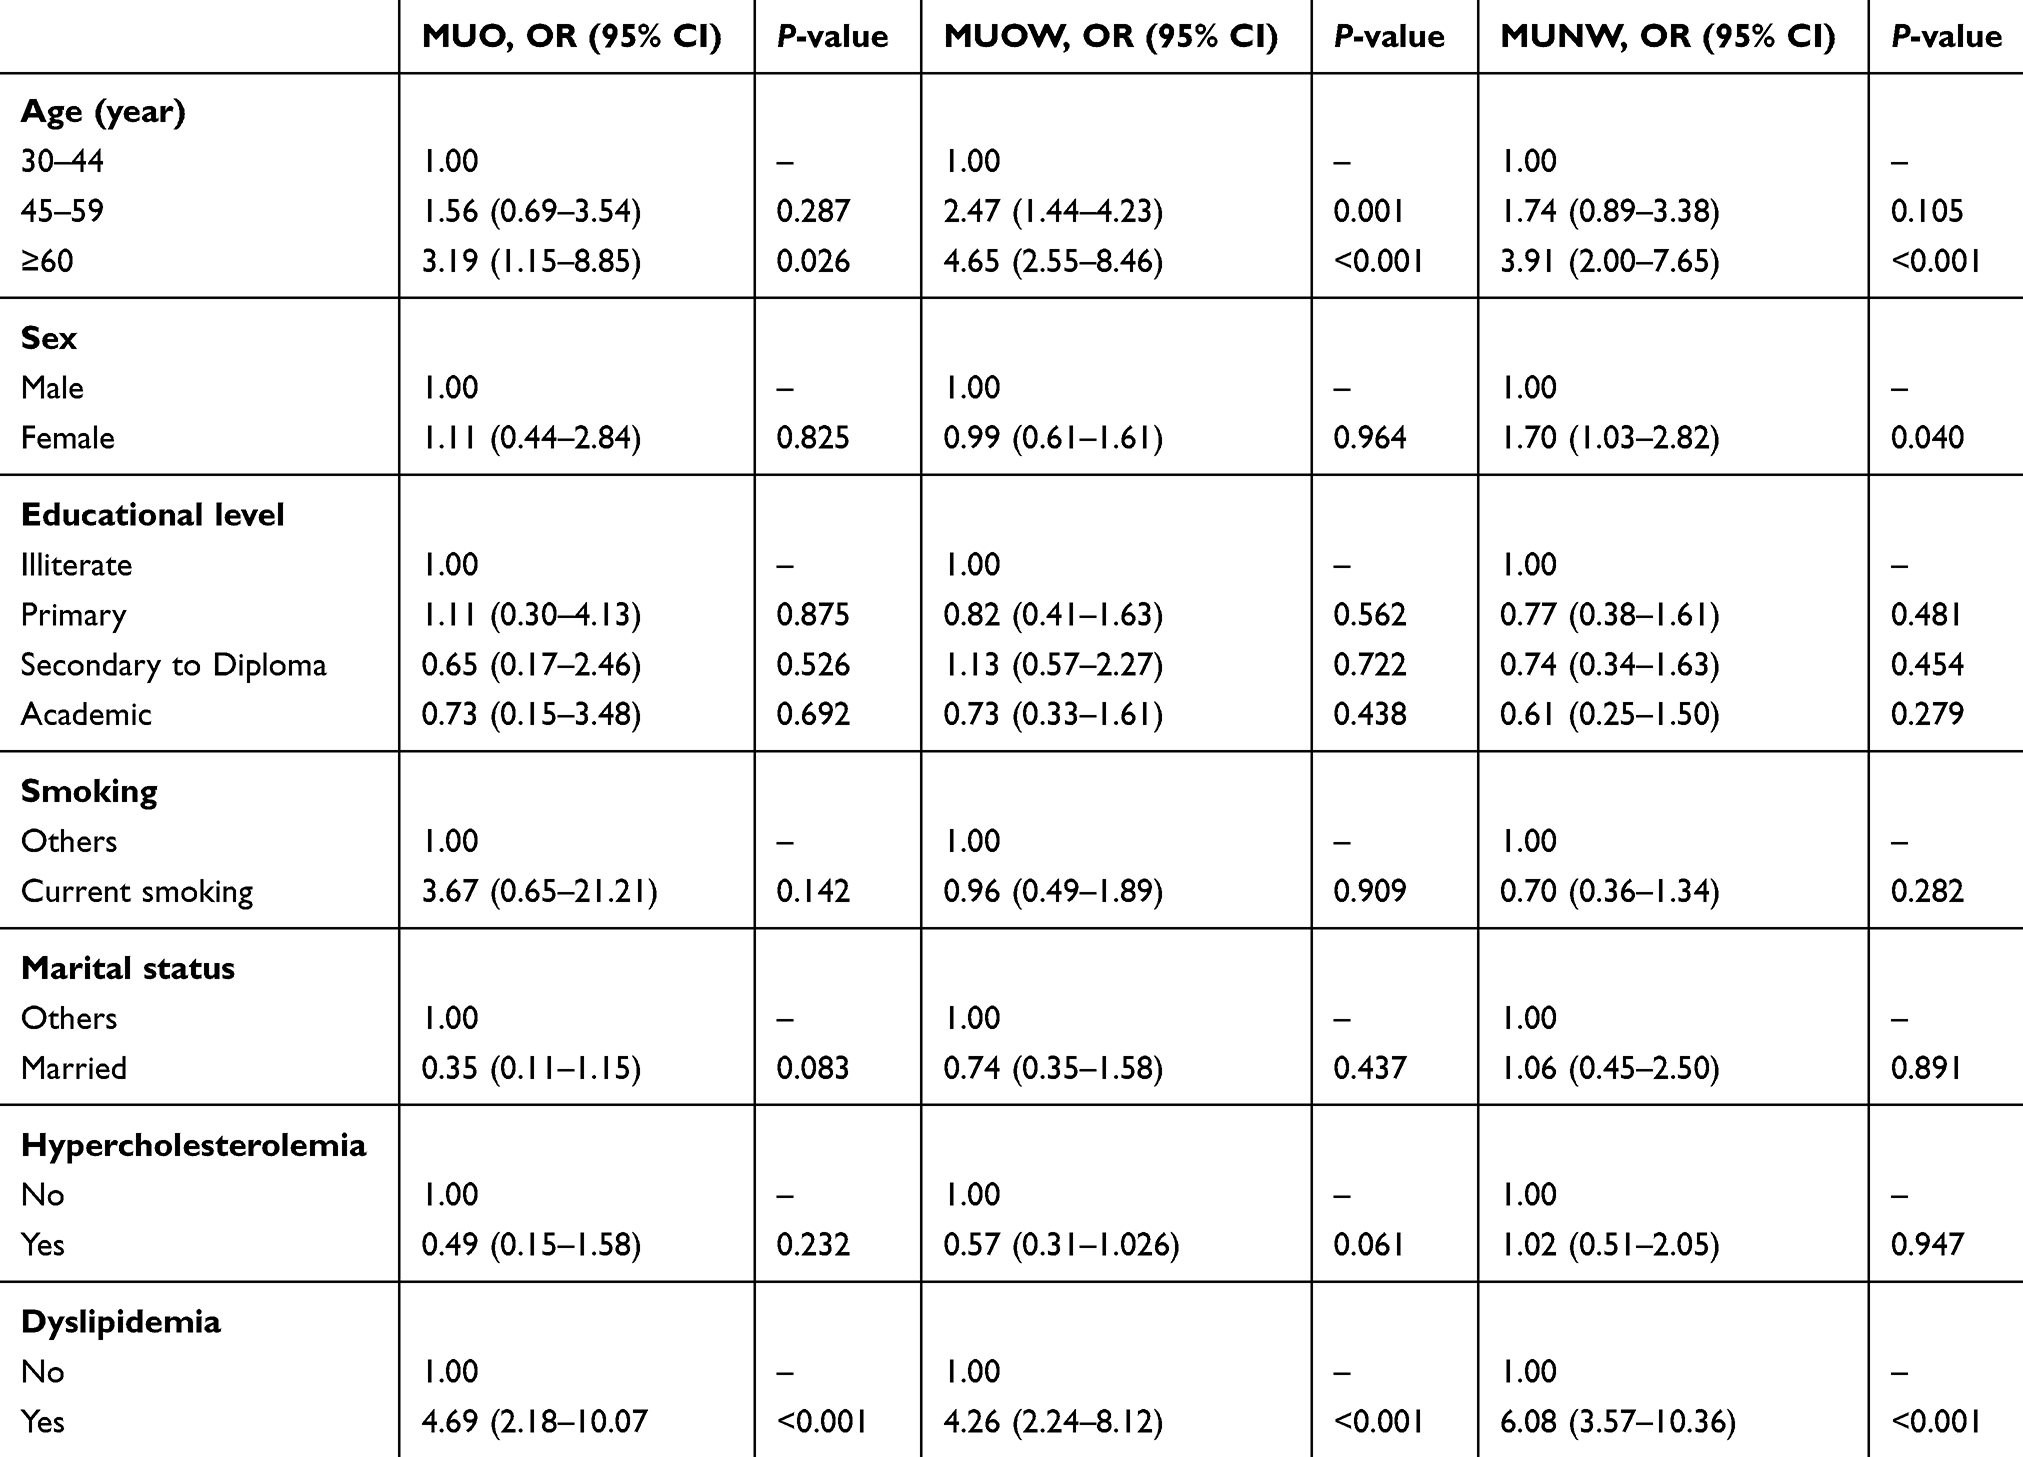 |
Table 3 Adjusted odds ratio (OR) and 95% confidence interval (CI) for study variables of the metabolically healthy among normal weight, overweight and obese subjects |
Discussion
Obesity and the presence of metabolic abnormalities increase the risk of type 2 diabetes mellitus, ischaemic stroke and coronary artery disease.19,25,26 Our multiple logistic regression results indicated an association of metabolically unhealthy in normal weight and obese participants with age ≥60 years and dyslipidaemia and also with female sex in MUNW. Furthermore, in overweight individuals, MU was associated with age ≥45 years and dyslipidaemia.
Nevertheless, these outcomes were incompletely consistent with the findings of former studies. In a study conducted by Zhang et al, independent determinant factors for MHO were age <55 years (OR: 1.659; p=0.001) and non-current smoking (OR: 1.397; p=0.038), whereas race, sex, marriage status and educational status were not significant contributors.27 In another study, age ≥50 years and current smoking was associated with an unhealthy state in normal weight subjects, whereas in overweight/obese subjects, an unhealthy state was inversely associated with age ≥50 years but positively with female sex.28 The authors found that individuals with MUNW compared to MHNW subjects were more likely to be male, former smokers, hypertensive and those with lower levels of physical activity.29 In a study carried out by Lopez-Garcia et al, lower age, being female and smoking were independently associated with MHO, but among normal weight subjects, a metabolic abnormal state was positively associated with age ≥45 years and inversely with female sex, former smoking status and education level.30
In our study, the prevalence of MUO was 10.9 (CI 95%: 8.8–13.0). Other researchers have reported a higher MUO prevalence than in our results.14,30–32 In one study on adults aged 20–70 years without lean individuals, the prevalence of MUO was higher (24.2%)28 than our results. Also, in a study conducted by Martinez-Larrad et al13 with a definition of metabolically unhealthy as having ≥2 cardio-metabolic abnormalities, the MUO prevalence was higher (26.3%) than that found in our study. In a study conducted by Liu et al,12 the prevalence of MUO ranged from 10.9% to 20.1% according to five different metabolic abnormality criteria. However, in studies conducted in the USA15 and England,20 the investigators reported a lower prevalence of MUO (8.3% and 5.3%, respectively) than our result. An explanation for these differences is that the prevalence of MUO differs because of the use of different definitions of metabolically unhealthy, the ethnicity of the population studied, the design of the study and the features of the participants.
As well as MUO status increasing the risk of mortality and the incidence of CVD and metabolic disorders,33–35 MHO individuals are at higher risk of all-cause mortality and chronic disorders such as diabetes mellitus, cardiovascular diseases, etc.19,20,35 The cumulative incidence of metabolic syndrome, DMT2 and hypertension in MHO and MUO individuals aged over 20 years was significantly higher compared with MHNW after 5 years of follow-up.35 Lee et al showed a significantly augmented risk for ischaemic stroke in MUO subjects during a follow-up of 7.4 years.19 The results of Hinnouho et al showed a significant association between metabolically healthy obesity and DMT2 and CVD over a median follow-up of 17.4 years.20 In a meta-analysis study, the pool adjusted relative risk for the incidence of DMT2 was 4.03 in MHO and 8.93 in MUO subjects compared with MHNW individuals.4 Kim et al during an analysis of 34,798 person years suggested a significant association of subclinical carotid atherosclerosis with MHO compared to MHNW individuals.18 A study showed that MHO individuals are at a higher risk of coronary heart disease, cerebrovascular disease and heart failure than normal weight MH individuals.36 But, these outcomes in the MHO subjects are controversial.19,37,38 Dhana et al have demonstrated that MHO does not correlate with CVD in elderly subjects.39 Also, a large meta-analysis demonstrated that MHO subjects are not at an increased risk of all-cause mortality and/or cardiovascular events at a mean follow-up of 11.5 years.40
Our study showed that dyslipidaemia was significantly higher in MU subjects as compared with MH in all normal weight, overweight and obese subgroups. In a study conducted by Tian et al, the prevalence of dyslipidaemia was higher in MU non-obese and obese subjects.16 Yoon et al reported that serum TG was higher in obese subjects among MH and MU subjects.41
Our study has limitations regarding the study design, which is cross-sectional, and thus the associations do not indicate causality. Our study also lacks any data on pro-inflammatory cytokines. We used fasting blood sugar as one of our criteria for the definition of metabolically healthy, but a previous study showed that 30% of BMI defined obese subjects classified as MHO according to fasting plasma glucose exhibited impaired glucose tolerance or even DMT2 when subjected to an oral glucose tolerance test.42 Conversely, the strength of our study is its population-based sample selection, suitable sample size and standardised methods of data collection.
In conclusion, the prevalence of MU in obese and overweight Iranian adults was higher than in subjects with a normal weight. Our data showed that ageing and dyslipidaemia in BMI subgroups and also female sex in normal weight subjects were associated with a MU state.
Acknowledgment
The authors would like to thank the Deputy of Research of Jahrom University of Medical Sciences for their support and the individuals for their participation in our study.
Disclosure
The authors report no conflicts of interest in this work.
References
1. Finucane MM, Stevens GA, Cowan M, et al. National, regional, and global trends in body-mass index since 1980: systematic analysis of health examination surveys and epidemiological studies with 960 country-years and 9.1 million participants. Lancet. 2011;377(9765):557–567. doi:10.1016/S0140-6736(10)62037-5
2. Fallahzadeh H, Saadati H, Keyghobadi N. Estimating the prevalence and trends of obesity in Iran populations from 2000 to 2011: a meta-analysis study. J Shahid Sadoughi Univ Medl Sci. 2017;25(9):681–689.
3. Shojaei M, Sotoodeh-Jahromi A, Rahmanian K, Madani AH. Gender differences in the prevalence of cardiovascular risk factors in an Iranian urban population. Online J Biol Sci. 2015;15(3):
4. Bell JA, Kivimaki M, Hamer M. Metabolically healthy obesity and risk of incident type 2 diabetes: a meta-analysis of prospective cohort studies. Obes Rev. 2014;15:504–515. doi:10.1111/obr.12157
5. Rahmanian K, Shojaie M. The prevalence of pre-hypertension and its association to established cardiovascular risk factors in south of Iran. BMC Res Notes. 2012;5:386. doi:10.1186/1756-0500-5-386
6. Rahmanian K, Shojaei M, Sotoodeh-Jahromi A, Madani A. The association between pre-diabetes with body mass index and marital status in an Iranian urban population. Glob J Health Sci. 2016;8(4):95–101. doi:10.5539/gjhs.v8n4p95
7. Lee DH, Keum N, Hu FB, et al. Comparison of the association of predicted fat mass, body mass index, and other obesity indicators with type 2 diabetes risk: two large prospective studies in US men and women. Eur J Epidemiol. 2018;33(11):1113–1123. doi:10.1007/s10654-018-0433-5
8. Ryu S, Frith E, Pedisic Z, Kang M, Loprinzi PD. Secular trends in the association between obesity and hypertension among adults in the United States, 1999–2014. Eur J Intern Med. 2019;62:37–42. doi:10.1016/j.ejim.2019.02.012
9. Chang K-T, Chen C-H, Chuang -H-H, et al. Which obesity index is the best predictor for high cardiovascular disease risk in middle-aged and elderly population? Arch Gerontol Geriatr. 2018;78:165–170. doi:10.1016/j.archger.2018.06.002
10. Rahmanian K, Shojaei M, Sotoodeh-Jahromi A. Relation of type 2 diabetes mellitus with gender, education, and marital status in an Iranian urban population. Rep Biochem Mol Biol. 2013;1(2):64–68.
11. Rahmanian K, Shojaie M. Prevalence of metabolic syndrome in an adult urban population in the south of Iran. Iran J Diabetes Obes. 2011;3(2):77–82.
12. Liu C, Wang C, Guan S, et al. The prevalence of metabolically healthy and unhealthy obesity according to different criteria. Obes Facts. 2019;12(1):78–90. doi:10.1159/000495852
13. Martinez-Larrad MT, Corbaton Anchuelo A, Del-Prado N, Ibarra Rueda JM, Gabriel R, Serrano-Rios M. Profile of individuals who are metabolically healthy obese using different definition criteria. A population-based analysis in the Spanish population. PLoS One. 2014;9(9):e106641. doi:10.1371/journal.pone.0106641
14. Rotar O, Boyarinova M, Orlov A, et al. Metabolically healthy obese and metabolically unhealthy non-obese phenotypes in a Russian population. Eur J Epidemiol. 2017;32(3):251–254. doi:10.1007/s10654-016-0221-z
15. Guo F, Garvey WT. Cardiometabolic disease risk in metabolically healthy and unhealthy obesity: stability of metabolic health status in adults. Obesity. 2016;24:516–525. doi:10.1002/oby.21344
16. Tian S, Xu Y, Dong H. The effect of metabolic health and obesity phenotypes on risk of hypertension: A nationwide population-based study using 5 representative definitions of metabolic health. Medicine. 2018;97(38):e12425. doi:10.1097/MD.0000000000012425
17. Morkedal B, Vatten LJ, Romundstad PR, Laugsand LE, Janszky I. Risk of myocardial infarction and heart failure among metabolically healthy but obese individuals: HUNT (Nord-Trøndelag Health Study), Norway. J Am Coll Cardiol. 2014;63(11):1071–1078. doi:10.1016/j.jacc.2013.11.035
18. Kim TJ, Shin H-Y, Chang Y, et al. Metabolically healthy obesity and the risk for subclinical atherosclerosis. Atherosclerosis. 2017;262:191–197. doi:10.1016/j.atherosclerosis.2017.03.035
19. Lee H-J, Choi E-K, Lee S-H, Kim Y-J, Han K-D, Oh S. Risk of ischemic stroke in metabolically healthy obesity: a nationwide population based study. PLoS One. 2018;13(3):e0195210. doi:10.1371/journal.pone.0195210
20. Hinnouho G-M, Czernichow S, Dugravot A, et al. Metabolically healthy obesity and the risk of cardiovascular disease and type 2 diabetes: the Whitehall II cohort study. Eur Heart J. 2015;36(9):551–559. doi:10.1093/eurheartj/ehu123
21. Twig G, Afek A, Derazne E, et al. Diabetes risk among overweight and obese metabolically healthy young adults. Diabetes Care. 2014;37(11):2989–2995. doi:10.2337/dc14-0869
22. Chang Y, Jung HS, Yun KE, et al. Metabolically healthy obesity is associated with an increased risk of diabetes independently of nonalcoholic fatty liver disease. Obesity. 2016;24(9):1996–2003. doi:10.1002/oby.21580
23. Xie J, Zhang S, Yu X, et al. Association between liver enzymes with metabolically unhealthy obese phenotype. Lipids Health Dis. 2018;17(1):198. doi:10.1186/s12944-018-0847-9
24. National Cholesterol Education Program (NCEP). Expert Panel on Detection, Evaluation, and Treatment of High Blood Cholesterol in Adults (adult treatment panel III): third report of the National Cholesterol Education Program (NCEP) expert panel on detection, evaluation, and treatment of high blood cholesterol in adults (adult treatment panel III) final report. Circulation. 2002;106(25):3143–3421.
25. Aung K, Lorenzo C, Hinojosa MA, Haffner SM. Risk of developing diabetes and cardiovascular disease in metabolically unhealthy normal-weight and metabolically healthy obese individuals. J Clin Endocrinol Metab. 2014;99:462–468. doi:10.1210/jc.2013-2832
26. Soriguer F, Gutiérrez-Repiso C, Rubio-Martín E, et al. Metabolically healthy but obese, a matter of time? Findings from the prospective pizarra study. J Clin Endocrinol Metab. 2013;98(6):2318–2325. doi:10.1210/jc.2012-4253
27. Zhang N, Chen Y, Guo X, Sun G, Sun Y. The prevalence and predictors of metabolically healthy obesity in obese rural population of China: a cross-sectional study. Psychol Health Med. 2017;22(3):303–309. doi:10.1080/13548506.2016.1220596
28. Hajian-Tilaki K, Heidari B. Metabolically healthy obese and unhealthy normal weight in Iranian adult population: prevalence and the associated factors. Diabetes Metab Syndr. 2018;12:129–134. doi:10.1016/j.dsx.2017.11.005
29. Eckel N, Mühlenbruch K, Meidtner K, Boeing H, Stefan N, Schulze MB. Characterization of metabolically unhealthy normal-weight individuals: risk factors and their associations with type 2 diabetes. Metabolism. 2015;64(8):862–871. doi:10.1016/j.metabol.2015.03.009
30. Lopez-Garcia E, Guallar-Castillon P, Leon-Muñoz L, Rodriguez-Artalejo F. Prevalence and determinants of metabolically healthy obesity in Spain. Atherosclerosis. 2013;231(1):152–157. doi:10.1016/j.atherosclerosis.2013.09.003
31. Shea JL, Randell EW, Sun G. The prevalence of metabolically healthy obese subjects defined by BMI and dual-energy X-ray absorptiometry. Obesity. 2011;19(3):624–630. doi:10.1038/oby.2010.204
32. Phillips CM, Dillon C, Harrington JM, et al. Defining metabolically healthy obesity: role of dietary and lifestyle factors. PLoS One. 2013;8(10):e76188. doi:10.1371/journal.pone.0076188
33. Stefan N, Schick F, Häring H-U. Causes, characteristics, and consequences of metabolically unhealthy normal weight in humans. Cell Metab. 2017;26(2):292–300. doi:10.1016/j.cmet.2017.07.008
34. Mongraw-Chaffin M, Foster MC, Anderson CAM, et al. Metabolically healthy obesity, transition to metabolic syndrome, and cardiovascular risk. J Am Coll Cardiol. 2018;71(17):1857–1865. doi:10.1016/j.jacc.2018.02.055
35. Latifi SM, Karandish M, Shahbazian H, Taha JM, Cheraghian B, Moradi M. Prevalence of Metabolically Healthy Obesity (MHO) and its relation with incidence of metabolic syndrome, hypertension and type 2 Diabetes amongst individuals aged over 20 years in Ahvaz: a 5 Year cohort Study (2009–2014). Diabetes Metab Syndr. 2017;11:S1037–S1040. doi:10.1016/j.dsx.2017.07.036
36. Caleyachetty R, Thomas GN, Toulis KA, et al. Metabolically healthy obese and incident cardiovascular disease events among 3.5 million men and women. J Am Coll Cardiol. 2017;70:1429–1437. doi:10.1016/j.jacc.2017.07.763
37. Matheson EM, King DE, Everett CJ. Healthy lifestyle habits and mortality in overweight and obese individuals. J Am Board Fam Med. 2012;25:9–15. doi:10.3122/jabfm.2012.01.110164
38. De Lorenzo A, Carazza M, Lima R. All-cause mortality of metabolically healthy or unhealthy obese: risk stratification using myocardial perfusion imaging. Arch Med Sci Atheroscler Dis. 2018;3:e90–e95. doi:10.5114/amsad.2018.76865
39. Dhana K, Koolhaas CM, van Rossum EF, et al. Metabolically healthy obesity and the risk of cardiovascular disease in the elderly population. PLoS One. 2016;11(4):e0154273. doi:10.1371/journal.pone.0154273
40. Kramer CK, Zinman B, Retnakaran R. Are metabolically healthy overweight and obesity benign conditions?: A systematic review and meta-analysis. Ann Intern Med. 2013;159(11):758–769. doi:10.7326/0003-4819-159-11-201312030-00008
41. Yoon JW, Jung C-H, Kim M-K, et al. Influence of the definition of “metabolically healthy obesity” on the progression of coronary artery calcification. PLoS One. 2017;12(6):e0178741. doi:10.1371/journal.pone.0178741
42. Iacobini C, Pugliese G, Blasetti Fantauzzi C, Federici M, Menini S. Metabolically healthy versus metabolically unhealthy obesity. Metabolism. 2019;92:51–60. doi:10.1016/j.metabol.2018.11.009
 © 2019 The Author(s). This work is published and licensed by Dove Medical Press Limited. The full terms of this license are available at https://www.dovepress.com/terms.php and incorporate the Creative Commons Attribution - Non Commercial (unported, v3.0) License.
By accessing the work you hereby accept the Terms. Non-commercial uses of the work are permitted without any further permission from Dove Medical Press Limited, provided the work is properly attributed. For permission for commercial use of this work, please see paragraphs 4.2 and 5 of our Terms.
© 2019 The Author(s). This work is published and licensed by Dove Medical Press Limited. The full terms of this license are available at https://www.dovepress.com/terms.php and incorporate the Creative Commons Attribution - Non Commercial (unported, v3.0) License.
By accessing the work you hereby accept the Terms. Non-commercial uses of the work are permitted without any further permission from Dove Medical Press Limited, provided the work is properly attributed. For permission for commercial use of this work, please see paragraphs 4.2 and 5 of our Terms.