")
Back to Journals » Clinical Audit » Volume 14
Prevalence and Classification of Misdiagnosis Among Hospitalised Patients in Five General Hospitals of Central Uganda
Authors Katongole SP , Akweongo P, Anguyo R, Kasozi DE, Adomah-Afari A
Received 21 April 2022
Accepted for publication 1 September 2022
Published 20 September 2022 Volume 2022:14 Pages 65—77
DOI https://doi.org/10.2147/CA.S370393
Checked for plagiarism Yes
Review by Single anonymous peer review
Peer reviewer comments 2
Editor who approved publication: Dr Zoka Milan
Simon Peter Katongole,1 Patricia Akweongo,2 Robert Anguyo,3 Daniel Evans Kasozi,4 Augustine Adomah-Afari2
1Simon Peter Katongole, School of Public Health, Gudie University Project, Kampala, Uganda; 2Department of Health Policy, Planning and Management, University of Ghana, Accra, Ghana; 3Monitoring, Evaluation, Technical Assistance and Research (METRe) Group; Department of International Public Health, Liverpool School of Tropical Medicine (LSTM), Liverpool, UK; 4The United States Agency for International Development, US Embassy Kampala, Kampala, Uganda
Correspondence: Simon Peter Katongole, Gudie University Project, P.O. Box 27450, Kampala, Uganda, Tel +256 702 830 019, Email [email protected]
Purpose: This study sought to determine the magnitude of patients’ misdiagnosis, classify the extent to which patients were misdiagnosed, determine the major diagnostic groupings and the topmost misdiagnosed diseases 11th version of the International Classification of Diseases (ICD-11).
Methods: We conducted a retrospective review of 2431 patients’ records. A patient was adjudged to have been misdiagnosed if there was a difference between the initial diagnosis and the final diagnoses which had been collectively and collaboratively agreed upon review on admission. Misdiagnosis was classified as Class I, Class II, Class III and Class IV. The Pareto analysis was used to determine the topmost misdiagnosed diseases and ICD-11 major diagnostic groupings. We established the three leading misdiagnosed diseases for each of the topmost ICD-11 major diagnostic groupings.
Results: The results indicate that 9.2% (223/2341) of the inpatients were initially misdiagnosed. There were 303 conditions involved in the misdiagnosis. The majority, 70.9% (158/223) of the misdiagnosed patients were classified as Class I. The ICD-11 major diagnostic groupings accounted for at least 80% of the misdiagnosis were certain infectious or parasitic diseases (32%), diseases of the digestive system (12%), diseases of the circulatory system (11%), endocrine, nutritional or metabolic disorders (9%), diseases of the respiratory system (7%), diseases of the genitourinary system 20/303 (7%), and diseases of blood and blood forming organs (5%). The 19 topmost misdiagnosed diseases or conditions included; peptic ulcer disease, severe malaria, hypertension, gastroenteritis, pneumonia, urinary tract infection, enteric fever, tuberculosis, septicemia, bacteremia, anaemia, congestive cardiac failure, diabetes mellitus, stroke, chronic obstructive pulmonary disease, respiratory tract infection, cystitis, cryptococcal meningitis, epilepsy and gastritis.
Conclusion: Efforts to improve patient diagnosis should focus on the “vital few” topmost misdiagnosed conditions and ICD-11 major diagnostic groupings that account for at least 80% of the burden of the misdiagnosis.
Keywords: prevalence, classification, misdiagnosis, general hospitals
Introduction
Making an accurate diagnostic decision to guide the management of a patient is among the chief desires of patients and health workers.1 To the physicians, making a timely and accurate diagnosis has become the benchmark for assessing one’s skills, abilities, competencies and self-image.2 From the patients’ perspective, since the timeliness and correctness of a diagnosis determines how quickly the patient will return to full health, much importance is attached to the diagnostic process than to any other healthcare processes.3 A correct diagnosis breeds much more confidence and trust to the patients that the rest of the care will ultimately be effective.4 In the quest for ensuring that optimal management is accorded to the patients to return them to full health, a diagnostic error is the worst of incidents that would be allowed to happen.5 The World Health Organization (WHO) has thus called for the introduction of measures to reduce misdiagnosis in order to improve the quality of care to patients.6
Misdiagnosis poses serious public health challenges to many healthcare systems including but not limited to unnecessary hospital visits and readmissions, wrong treatment being given to the patients as well as conducting unnecessary procedures.7,8 In 2015, a report by the National Academies of Sciences, Engineering, and Medicine (NAM), stated that misdiagnosis accounted for 5–17% of adverse events in hospitals as well as 10% attribution to patient deaths in America.4 Misdiagnosis can occur at any of the diagnostic stages and may affect anyone at one point in their lifetime.9,10 Consequently, the need to improve the diagnostic process in order to avert misdiagnosis is gradually receiving significant attention in different health systems.11 For the same reason, a call has been made to intensify research on misdiagnosis to bring to light this problem in various health systems.12
Research reporting on misdiagnosis and diagnostic error in general in low-income countries has largely been disease centric, especially for vertical programmes managed diseases and conditions.13 However, this approach has not unmasked the true burden of misdiagnosis.14,15 This study, therefore, sought to establish the proportion of patient misdiagnosis and to classify the extent to which patients were misdiagnosed in Ugandan hospitals. The study also set out to establish the topmost ICD-11 major diagnostic groupings where misdiagnosis occur as well the topmost misdiagnosed disease.
A general hospital in Uganda’s healthcare system is a mid-level healthcare facility that provides primary healthcare services to patients and serves as a referral centre for secondary-level care at the district level. General hospitals make referral of complicated cases or for tertiary-level care to regional or national referral hospitals.16 Patients in the general hospitals are generally seen by mid-level health professionals called clinical officers (physician assistants) having a diploma in clinical medicine or higher diploma qualification in a clinical area of specialization. On some occasions, this role is performed by nurses and clinical medicine students. Patients who need hospitalization are admitted on the wards from where their diagnoses are collectively and collaboratively reviewed by a team of health workers headed by a medical officer or physician either at arrival to the ward or during ward rounds. Based on this review, a final diagnosis is then assigned. This may include either retaining the initial diagnosis if they find it right or assigning a new one if the initial diagnosis was presumed to be wrong.
Methods
The Study Setting and Study Population
This study was conducted in five general hospitals of Kiboga, Nakaseke, Gombe, Kayunga and Mityana that are all located in Central Uganda. The study population included all patients who had been admitted for medical or pediatric conditions through the outpatient or emergency departments from July 1, 2019 to June 30, 2020. This period was considered long enough to cater for any variations in the diagnostic practices of the clinicians as well as for variations in the disease profile within the study hospitals.
Study Design
This was a quantitative descriptive cross-sectional study that involved retrospective review of paper-based records of hospitalized patients.
Sampling the Records Reviewed
The sample size for the records to be reviewed was arrived at based on the formula N=10k/p where p is the proportion of patients misdiagnosed. This was taken to be 5%, the lower threshold of as per the 2015 the National Academy of Medicine (NAM) report on diagnostic error.17 The letter k represents 12 covariates that were presumed to be associated with misdiagnosis but are not subjects of this article. These have been explained elsewhere.18 This gave a minimum sample size of 2400 records. To cater for missing information, 31 more records were included. Out of 12,345 patients’ records that had met the inclusion criteria, records of 2431 were sampled and reviewed. Proportionate sampling was used to divide the records first into children and adult patients. In Uganda, paediatric patients are considered those in the age bracket 0–9 years. The records of young adolescent patients (10–17 years) and those of adults age 18 years and above were combined in as one stratum. In addition, 40% of all admissions in the hospitals are pediatric patients aged 0–9 years.19 Accordingly, 192 pediatric patients’ records and 288 adolescent and adult patients’ records were respectively targeted for review based on the numbers hospitalized as a proportionate of all the hospitalized patients. A minimum of 480 patients’ records were proportionately sampled in each hospital with 40% being for paediatric patients as earlier explained.
Inclusion
Records of patients admitted with medical conditions (pediatric, adolescent or adult). All the records had to have both the admission and discharge/final diagnoses documented. The patients should not have been referred out to referred to another health facility for further management.
Exclusion Criteria
Records of the patients excluded were for those admitted for surgical and obstetric conditions since these tend to be admitted directly to the ward or to theatre without going through the outpatient or emergency department thus by passing the normal hospital procedures. In addition, patients whose records missed either the admission or discharge/final diagnosis were excluded. Similarly, records of patients who were referred to another health facility for further management and those who had died were excluded from this study.
Data Collection
The explicit data collection method was used for data collection. This meant that a data collection checklist was designed to guide the data extractors on how to and which data to collect. The data abstraction were designed by SPK and reviewed by PA, AAA and ARO. This study is part of a larger PhD thesis of SPK at the Department of Health Policy, Planning and Management (HPPM) at the University of Ghana (UG).20 Data collection was conducted by four research assistants (RAs) using an Android tablet device with Open Data Kit (ODK). The research assistants worked in close supervision of the first author. Whenever the data collection team could not clarify the information in the records, consultations were made with a clinician at the outpatient department. The data were extracted from the Health Management Information System (HMIS). The forms from which these data were extracted specifically included the HMIS form 051 (the inpatient treatment sheet where the admission diagnosis is written); the Inpatient Discharge Form (HMIS form 052 where the final or discharge diagnosis is noted and the discharge status of the patient) and the Inpatient Discharge Register (HMIS form 054 contains all the information about the treatment the patient had).21 The data were later extracted as an Excel sheet from the ODK server.
The Outcome Measure
The outcome measure for this study was misdiagnosis. The Initial diagnosis assigned at the outpatient department (OPD) or emergency department (ED) was compared with the discharge diagnosis. Misdiagnosis was considered if there was a difference between the initial diagnosis assigned at the OPD or ED during admission and the final (discharge) diagnosis which was assigned on the ward after the patient had been reviewed. The basis of considering a misdiagnosis using this approach has been well explained elsewhere.18
Data Analysis
The Proportion of Patients’ Misdiagnosis
This was established as the fraction of the misdiagnosed patients over the total number of patient records reviewed.
Classification of Misdiagnosis
Misdiagnosis was classified as Class I, Class II, Class III and Class IV guided by the International Classification of Diseases and related health problems (ICD-11) and the possible effects the final diagnosis had on the management of the patient. The ICD-11 is the latest World Health Organization’s standard way of recording, analyzing, reporting, interpreting and comparing morbidity and mortality data.22 The ICD-11 is used to classify misdiagnosis depending on the agreement or disagreement between the initial diagnosis and the final diagnosis as explained in Table 1.
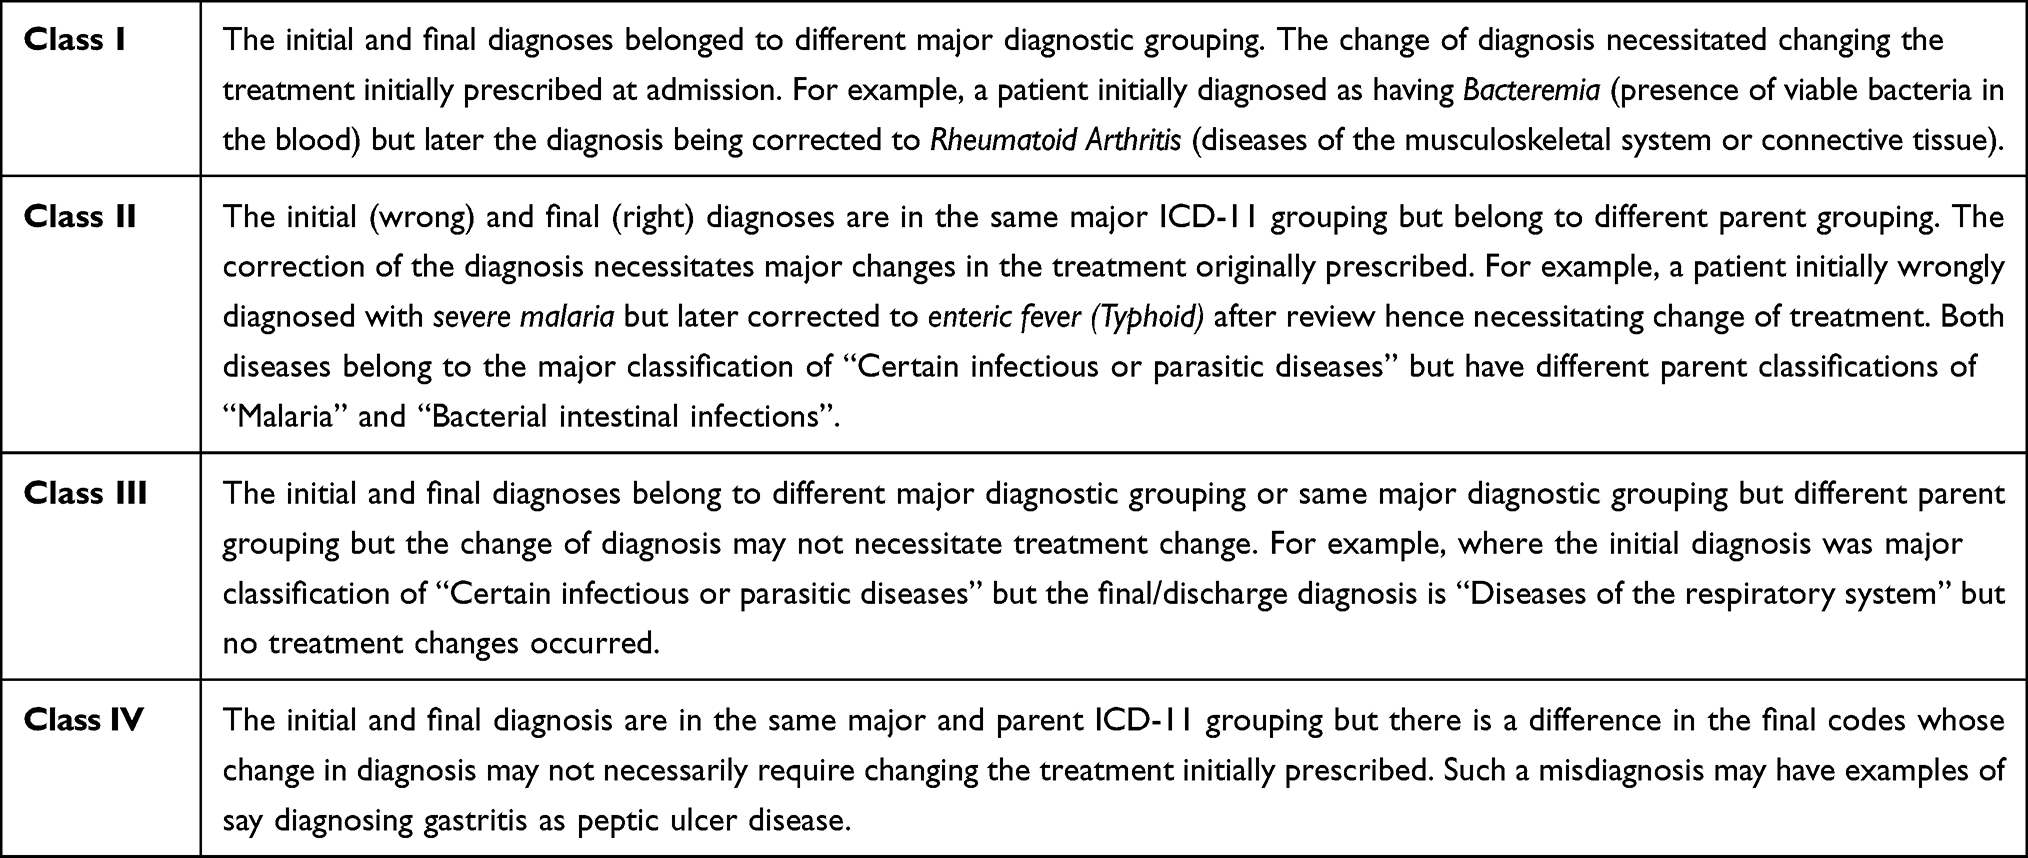 |
Table 1 Classification and Description of the Misdiagnosis Classification |
The Topmost Misdiagnosed Conditions and ICD-11 Major Diagnostic Grouping Accounting to the Highest Burden of Patient Misdiagnosis
The Pareto principle was used to draw a curve that helped us establish the diseases that cumulatively make up at least 80% of the misdiagnosed cases. In the theoretical Pareto chart, this should constitute 20% of the conditions associated with misdiagnosis. However, since there were many trivial diseases, we only considered diseases or conditions that had been misdiagnosed more than once. We preferred to concentrate on the diseases with the highest frequency to avoid an awkward zone where a clear break point between the vital few and trivial could have been uncertain.23 Besides, it was also deemed that placing efforts to improve diagnosis for conditions that had been misdiagnosed singly would not have yielded marked benefits in their individualistic capacity.24 We further classified the causes of misdiagnosis based on frequency of occurrence into common or uncommon causes among the misdiagnosed patients for both the major diagnostic grouping and the specific disease conditions.
The Topmost Misdiagnosed Conditions in Each of the Topmost ICD-11 Major Diagnostic Groupings
For each of the top major diagnostic grouping accounting for the 80% of the misdiagnosis, we established the leading three misdiagnosed diseases or conditions. This is meant to help identify which disease conditions that may need priority attention for diagnostic improvement. The results are reported with proportions.
Ethical Approval
Ethical approval was obtained from the University of Ghana Department of Health Policy, Planning and Management, the Mildmay Uganda Research Ethics Committee (MUREC) and the Uganda National Council of Science and Technology (UNCST) with ethical approval references of HP/AC.12/1/2017, REC REF 0505–2020 and HS826ES, respectively. The COVID-19 restrictions required researchers to minimize physical contact with study participants and exchange of objects such as pens and papers as much as possible. Therefore, in our application for ethical approval from MUREC, we applied for waiver of written informed consent based on this and due to the fact that the research posed minimal risk to the participants. We communicated that we were going to review patient records so we only needed the consent of the hospital directors. In our application for waiver of written consent, we communicated that we would not capture patients’ names from the records, so their information would be anonymous. We informed the hospital directors that the findings were to be published in a peer reviewed journal and no patient’s name or health worker was to be published. All the other guidelines as outlined in the Helsinki Declaration were adhered to.
Results
Of the 2431 reviewed records, 41.3% were for children aged 0–9 years, while 1262 (51.9%) and 1169 (48.1%) were for female and male patients, respectively. Out of the 2431 patients reviewed, 1991 (81.9%) had one disease diagnosis captured as the reason for admission and treatment. There were 2957 final diagnoses made among the patients. Majority (81.9%) of the patients had one final diagnoses, those with two and three or more final diagnoses were 16% and 2.1%, respectively. The ICD-11 major diagnostic groupings that accounted for 80% of the final diagnoses in the hospitals included certain infectious or parasitic disease (58.5%), diseases of the blood and blood forming organs (7.9%), diseases of the respiratory system and diseases of the digestive system with 7.4% and 5.9%, respectively.
We also categorised the final diagnoses into common and uncommon causes of patient admission to hospitals. The diseases or conditions that accounted for the common causes of patient admission were malaria (48.4%), pneumonia (6.6%), severe anaemia (3.7%), peptic ulcer disease (3.6%), gastroenteritis (3.3%), bacteraemia (2.3%), urinary tract infection (2.2%), respiratory tract infection (1.9%), septicaemia (1.9%), hypertension (1.5%), enteric fever (1.2%), sickle cell disease with crisis (1%), diabetes mellitus (0.9%), acute malnutrition (0.9%), and bacterial infection (0.9%).
Proportion of Patients Misdiagnosed
The results indicate that the proportion of patients who had been misdiagnosed was 9.2% (223/2431; [95% CI: ±1.2%]). With 62 (12.7% [95% CI: ±3]) misdiagnosed patients, Nakaseke hospital had the highest prevalence of misdiagnosis. The misdiagnosis in Nakaseke hospital accounted for 27.8% [95% CI: ±5.9] of the misdiagnosis in all the hospitals. Kiboga hospital with 32 misdiagnosed patients (6.7%, [95%: CI ±2.2]) had the lowest prevalence of misdiagnosis. The prevalence of misdiagnosis in Kiboga hospital accounted for 14.4% [95% CI: ±4.6] in all the hospitals. The results showing prevalence of misdiagnosis are displayed in Table 2.
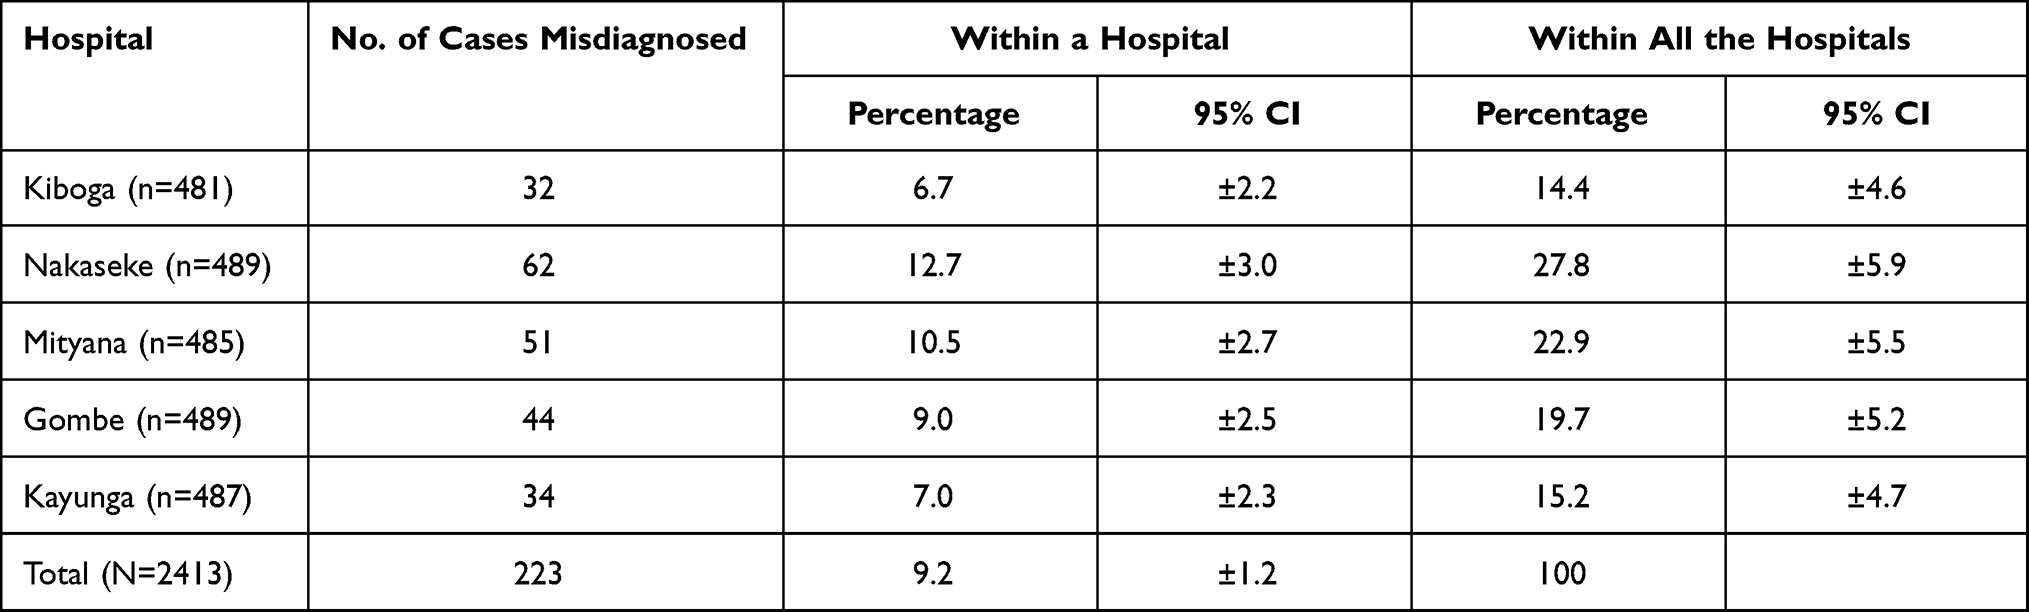 |
Table 2 Prevalence of Misdiagnosis |
Classification of the Misdiagnosis
Majority, 158 (70.9%) of the misdiagnosed patients were classified as Class I misdiagnosis. This meant that such patients’ initial and final diagnoses belonged to different ICD-11 major diagnostic grouping. The subsequent change of diagnosis by the reviewing team as they corrected the misdiagnosis necessitated major treatment changes. Only 21 of the 223 (9.4%), misdiagnosed patients were classified as Class IV misdiagnosis. Figure 1 displays the breakdown of the classification of misdiagnosis.
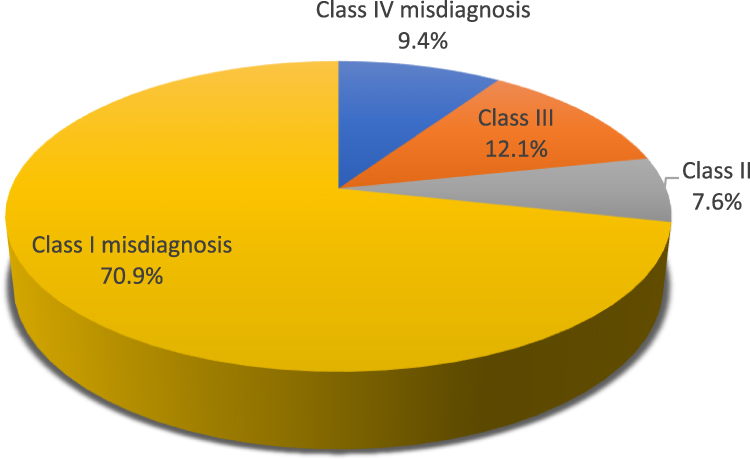 |
Figure 1 Classification of the misdiagnosis (n=223). |
Occurrence of Misdiagnosis Within the Major Diagnostic Groupings
The ICD-11 major diagnostic groupings that cumulatively account for 80% of the misdiagnosed conditions in descending order of frequency include certain infectious or parasitic diseases (32%), diseases of the digestive system (12%), diseases of the circulatory system (11%), endocrine, nutritional or metabolic disorders (9%), diseases of the respiratory system (7%), diseases of the genitourinary system 20/303 (7%), and diseases of blood and blood-forming organs (5%). This means that seven major ICD-11 grouping form at least 80% of the cumulative major diagnostic groupings misdiagnosed. Figure 2 illustrates the Pareto analysis of the topmost ICD-11 major diagnostic groupings where misdiagnosis occurred.
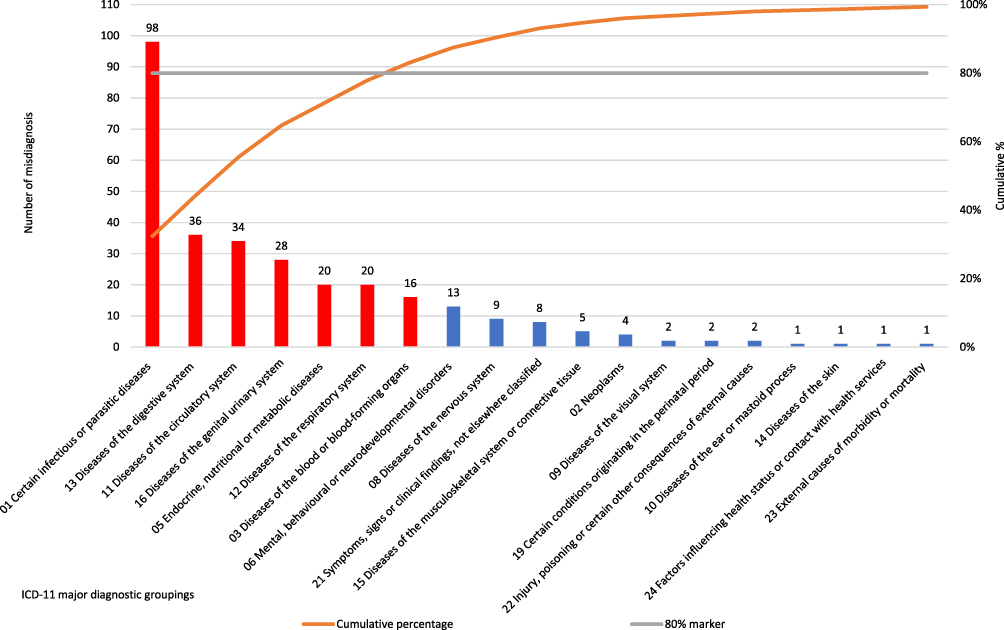 |
Figure 2 Frequency of misdiagnosis by major diagnostic grouping. |
Frequency of Misdiagnosis Within Each Major Diagnostic Grouping
We also established the frequency of misdiagnosis in each of the ICD-11 major diagnostic grouping. Based on this analysis, it was established that all patients treated for conditions in the ICD-11groupings of neoplasms and diseases of the visual system were misdiagnosed at the point of initial admission. The other ICD-11 groupings with high frequency of misdiagnosis included diseases of the musculoskeletal system or connective tissue, certain conditions originating in the perinatal period, diseases of the circulatory system, and mental, behavioural and neurodevelopmental disorders. It is also noted that in most of these ICD-11 major groupings, there were a few conditions although the few times conditions in these groups were the prime reasons for admission, the patients were in most cases first misdiagnosed. The results displaying how misdiagnosis occurred within each ICD-11 major diagnostic groupings can be viewed in Table 3.
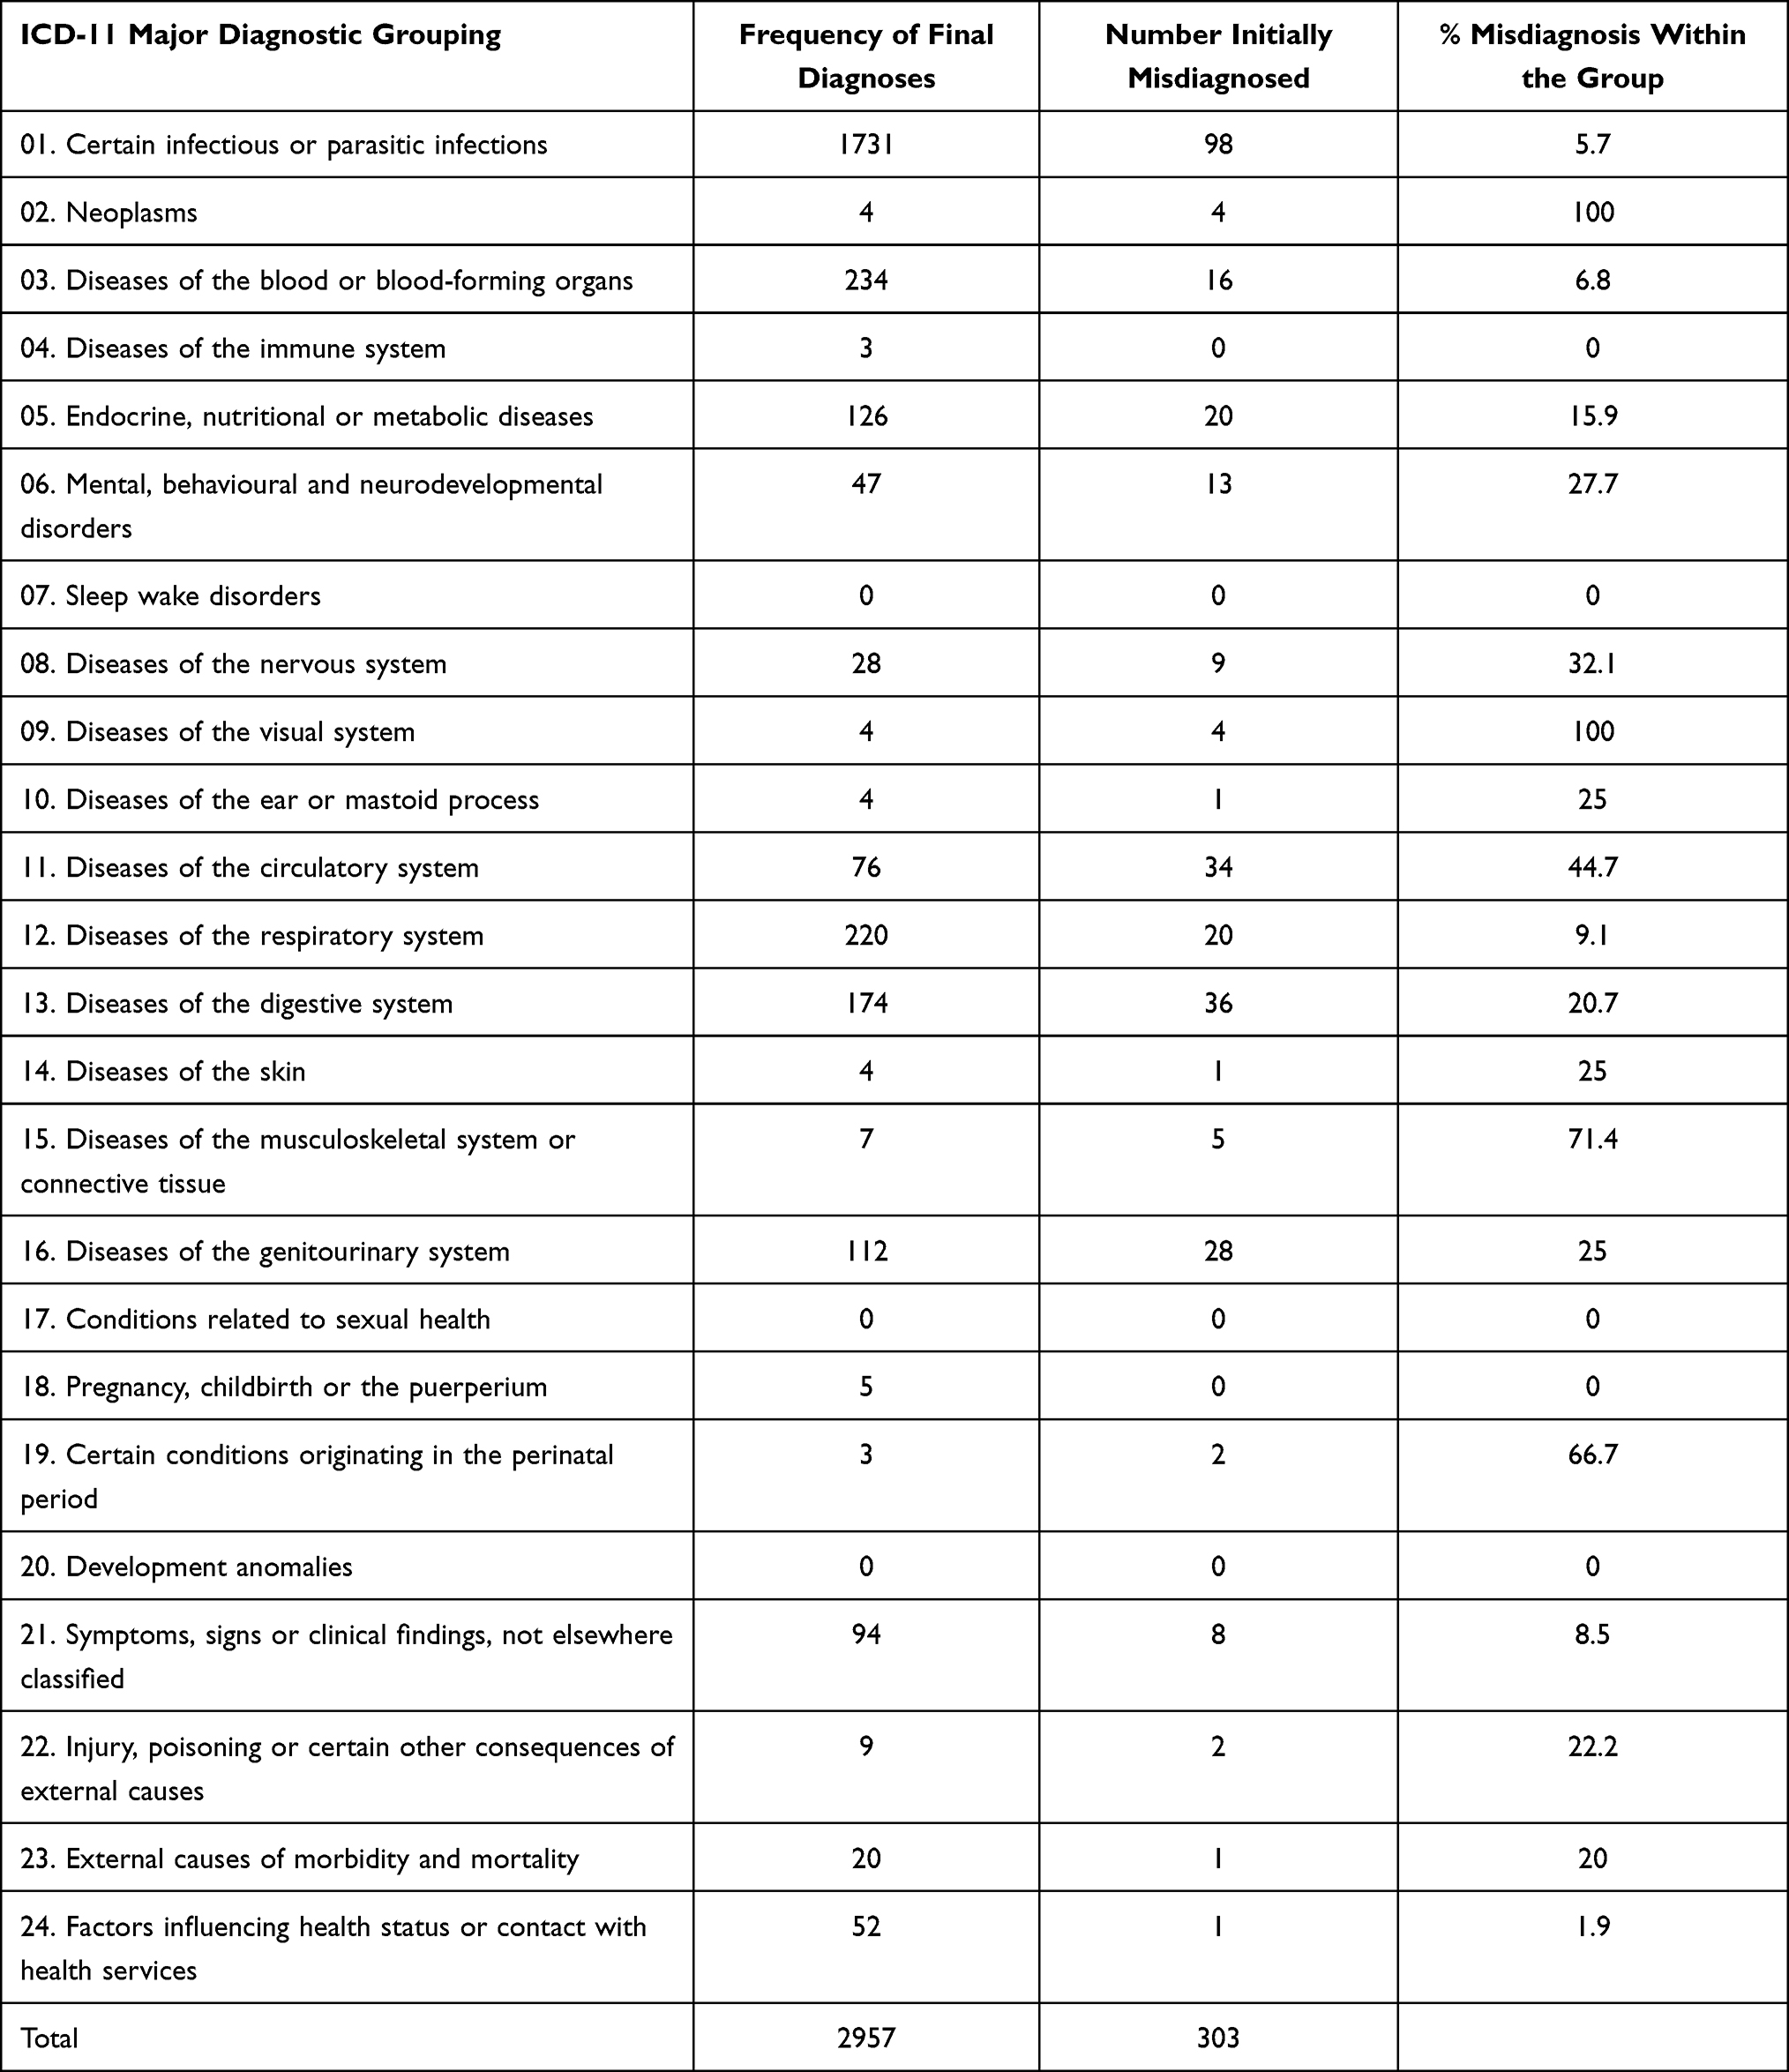 |
Table 3 Frequency of Misdiagnosis Within Each Major Diagnostic Grouping |
The Top Most Misdiagnosed Conditions in Each of the Major Misdiagnosed Groupings
The results obtained from the analysis of the three topmost misdiagnosed diseases in each of the topmost seven misdiagnosed ICD-11 major disease diagnostic groupings are summarised in Figure 3. There were 21 conditions that collectively accounted for 47.5% (n=144/303) of all the misdiagnoses and 64.6% (n=144/223) of all the misdiagnoses that occurred more than once. Among certain infections or parasitic diseases grouping, malaria is the top misdiagnosed condition. The top misdiagnosed diseases in the major groupings of digestive, circulatory system, genitourinary, and the respiratory systems were peptic ulcers, hypertension, urinary tract infection, and chronic obstructive pulmonary disease, respectively. The top misdiagnosed conditions for endocrine, nutritional and metabolic disorders as well as for diseases of blood and blood forming organs were diabetes mellitus and anaemia, respectively.
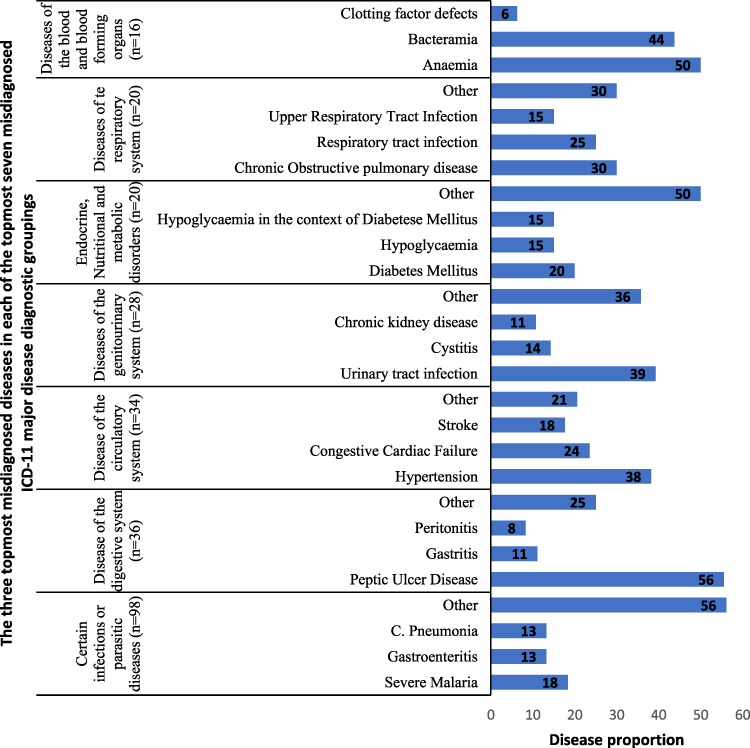 |
Figure 3 Top most misdiagnosed diseases for each of the top most misdiagnosed major diagnostic groupings. |
Top Most Misdiagnosed Diseases and Conditions
We used a Pareto chart analysis to obtain information about the conditions posing the highest misdiagnosis burden in the hospitals. This analysis only considered 226 conditions that had been misdiagnosed more than twice out of the 303 misdiagnosed conditions. Patients, out of the 226 conditions, 20 conditions emerged with the highest frequency, ie, make up to at least 80% of cumulative proportion of conditions misdiagnosed more than once. These are the conditions that accounted most to the misdiagnosis burden of in the hospitals studied.
Among these 20 diseases, 12 were common causes of admission and include peptic ulcer disease, severe malaria, hypertension, gastroenteritis, pneumonia, urinary tract infection, enteric fever, septicemia, bacteremia, severe anaemia, respiratory tract infection, and diabetes mellitus. The eight uncommon causes of admission among the diseases 20% leading misdiagnosed conditions include tuberculosis, congestive cardiac failure, stroke, chronic obstructive pulmonary disease, cystitis, cryptococcal meningitis, epilepsy and gastritis. Figure 4 displays the Pareto chart that portrays the topmost misdiagnosed diseases or conditions.
 |
Figure 4 Frequency of misdiagnosis by disease conditions. |
Note: The following conditions were misdiagnosed once and can be counted among the trivial many:
Acute appendicitis, acute hepatitis B, acute kidney infection, acute pyelonephritis, acute viral hepatitis, alcoholic intoxication alcoholic liver disease, allergic rhinitis, aspiration pneumonia, arthritis, bacterial infection, bilateral orchitis, bronchitis, cancer of the cervix cellulitis, cervical lymphadenitis, chicken pox, chronic cholecystitis, chronic myeloid leukemia, chronic renal failure, chronicsuperlative otitis media, clotting factors defects, congenitalmelena, constipation, conversion disorder, cor pulmonale, dementia-associated motor complex due to HIV depression, fear of HIV, diabetic neuropathy, drug-induced gastritis, drug-induced hepatitis, dysmenorrhea, esotropia, fatigue syndrome, food poisoning, functional level injury of the spinal (lumbar), fungal infection, head injury, hepato-splenomegaly, herpes zoster, hiccough, HIV disease clinical stage 4 with no TB OR malaria (TB Ruled out after investigation), HIV encephalopathy, HIV/AIDS defaulter admitted for counselling, hyperplasia of the prostate, hypoalbuminemia, hysteria, interstitial pneumonitis, ischemic heart disease, kaposi sarcoma, Langerhans cell histiocytosis, liver cirrhosis, lumbar disc prolapse, malnutrition in an adult, manic mood symptoms induced by drugs, mental confusion not specified, myelopathy, nephritis, neural syphilis, obesity, oculogyric crisis, oral candidiasis, organic brain syndrome, organophosphate poisoning, oral pharyngeal, candidiasis, palpitations, pharyngitis, physiological jaundice, pleurisy, protein energy malnutrition, psychosis, renal failure schizophrenia severe acute malnutrition, spinal cord compression, steven johnson syndrome, syncope, syphilis, spondylosis of lumbar spine, ulcerative colitis, underweight in an adult, upper gastrointestinal bleeding, viral meningitis, vitamin D deficiency, Wernicke encephalopathy.
Misdiagnosis Classification Based on Communicable or Non-Communicable Disease Status
Out of the 123 misdiagnosed conditions, 102 (82.9%) were non-communicable diseases/conditions while 21 (17.1%) were communicable diseases. Among the 20 commonly misdiagnosed diseases or conditions, 12 (63.2%) were non-communicable diseases, while eight (8) (36.8%) were communicable diseases. The non-communicable diseases among the commonly misdiagnosed diseases included peptic ulcer disease, hypertension, septicaemia, bacteraemia, severe anaemia, diabetes mellitus, congestive cardiac failure, stroke, chronic obstructive pulmonary disease, cystitis, cryptococcal meningitis and gastritis.
Discussion
The results show that 9.2% of the inpatients were misdiagnosed at admission and majority of the misdiagnosed patients had severe classification of misdiagnosis. This means that for every 100 patients admitted, approximately nine of them will have been misdiagnosed at the point the initial diagnosis was made. The proportion of misdiagnosed patients in this study is within the range of the level of misdiagnosis reported elsewhere. For example, misdiagnosis of admitted patients at the emergency department was reported in the range of 5–15%17 It is estimated that one in every seven diagnostic encounters are likely to be associated with misdiagnosis.8,25 The findings give an insight into how big the problem of misdiagnosis is in the hospitals.
Both common and uncommon causes of hospitalization, communicable and non-communicable diseases all made significant contribution to the list of common conditions that contribute to misdiagnosis among inpatients in our study hospitals. However, slightly higher number of communicable diseases than the non-communicable ones were more likely to be among the top causes of misdiagnosis. Common conditions such as severe malaria, pneumonia, urinary tract infections, peptic ulcer disease, and hypertension were among the diseases that contribute to the highest burden of misdiagnosis in the hospitals. These findings cast light on the problems that the hospitals need to solve for which a roadmap could be drawn on how and where to place emphasis for diagnostic improvement.
One of the most striking observations to emerge from this study is that most of the topmost misdiagnosed conditions were common health conditions for which patients are usually admitted in the hospitals. This finding mirrors those in a study conducted in Japan where it was revealed that common chronic conditions as the leading conditions involved in diagnostic error at primary healthcare centres.26 Also, perplexing in this study is that some of the leading misdiagnosed conditions such as peptic ulcers, severe malaria, and pneumonia are also those to which attention has been placed for improvement27 and this underpins the need for locally generated solutions to respond to misdiagnosis.
The inclusion of common conditions among the topmost misdiagnosed implies that at any point in time, there will mostly likely be high number of misdiagnosed patients in the hospitals’ inpatient wards. Given that majority of the misdiagnosed conditions had Class I classification, adverse outcomes associated with misdiagnosis such as delayed recovery, prolonged inpatient stay, high cost of care. At worst, death should be expected to occur in high numbers in our study context if such misdiagnoses are not timely corrected. Class I misdiagnosis not only depicts that the diagnoses of admitting and reviewing clinicians fall in different ICD-11 major diagnostic groupings but also implies the need for treatment change. This results in wastage of medicines. These findings underpin the need for routine surveillance of misdiagnosis in hospitals in order to take timely corrective action to prevent, avert or eliminate them, or mitigate their effects.
From the Pareto analysis, the topmost misdiagnosed diseases are into the ICD-11 grouping that for this study are termed as the “top seven”. These include certain infectious or parasitic disease, diseases of the digestive system, diseases of the circulatory system, endocrine, nutritional or metabolic disorders, diseases of the respiratory system, diseases of the musculoskeletal or connective tissue disorders, and diseases of blood and blood forming organs. Two of the major classifications above have been reported as part of the leading misdiagnosis classifications code named the “big three” which include; vascular diseases, infection, and cancer.28 Among these, only the classifications of certain infectious or parasitic infections in this study mirrors the above findings.
This difference could be explained by the fact that our study was carried out in general hospitals, that are mid-level primary health care facilities where conditions such as neoplasms and many of the cardiovascular diseases are referred out to higher level regional, national hospitals and specialised referral centres that have been well prepared to better diagnose and manage such conditions.29 Besides, the variation in the conditions accounting for the burden of misdiagnosis in the two studies could also be explained by the difference in disease burden in the two health systems where communicable diseases still pose the highest burden of diseases and admission to hospitals.
However, while the burden of conditions misdiagnosed for some of the major ICD-11 groupings may not be high in this study, on the few occasions, the diseases within such diagnostic grouping are admitted to hospitals, they are more likely to have first been misdiagnosed. These findings have policy and practice implication for diagnostic improvement. The conditions within the neoplasms and the diseases of the circulatory system groups are on high increase in sub-Saharan Africa.30 At present, priority of diagnostic improvement has been set to diseases that pose the highest diseases burden to the Uganda healthcare system which are mainly infections and respiratory system diseases. This could explain why within those major diagnostic grouping, the frequency of misdiagnosis is lower given the number of conditions handled. However, since the same diseases still pose the highest burden of misdiagnosis, they still need to be prioritised for diagnostic improvement.
Nevertheless, it must also be noted that most of these diseases are non-communicable diseases which formed the bulk (82.9%) of the conditions misdiagnosed most. In the longer plan, being cognizant of ICD-11 major diagnostic grouping where the frequency of misdiagnosing particular diseases seems to be higher and the conditions involved should be prioritised. Their rate of misdiagnosis should stir up action from policy makers and health practitioners. This is because with the increasing prevalence of such diseases and the persistency of common illnesses of the infectious nature, a double burden of both communicable and non-communicable diseases has been proclaimed.31–33 Consequently, diagnostic improvement strategies may also have to be targeted to uncommon and non-communicable diseases whose misdiagnosis may likely rise in tandem with their increasing prevalence.
Most of the trivial many conditions are among those that were less often misdiagnosed and are mostly uncommon conditions encountered in the study settings, and the clinicians may not be familiar with them. The reasons as to why uncommon diseases are likely to be misdiagnosed have been widely studied elsewhere.34,35 In the setting of this study, it is likely that these conditions featured less among misdiagnosed patients simply not because clinicians are better prepared to diagnose them but because of their rare occurrence. When patients present with such uncommon illnesses, they meet clinicians who are less prepared to diagnose them appropriately due to the lack information about such diseases.36 Consequently, case-specific analysis should be considered in more rigorous future studies in order to understand the extent of condition-specific misdiagnosis rate or proportion, including that of rare conditions.
Conclusion and Recommendations
The proportion of inpatients misdiagnosed at admission was 9.2% and most (70.6%) of the misdiagnosed patients had the classification of severe misdiagnosis. Both the common and uncommon causes of hospitalization comparably made up to the list of conditions that were commonly associated with misdiagnosis; 12 and eight of the common and uncommon conditions of hospital admission contributed to at least 80% of misdiagnosis. Improving diagnosis and eliminating misdiagnosis associated with these 20 conditions is likely to avert at least 80% of top most misdiagnosed conditions in the hospitals. Planners and managers of health services should prioritise diagnostic improvement interventions and resources on these (few) condition in order to eliminate the burden of misdiagnosis in hospitals of similar nature and scope. The health systems and disease dynamics keep changing and this means that the trajectory of the misdiagnosed conditions may as well change with time. There is need for hospitals to routinely monitor misdiagnosis and its causes with major focus on the vital few and those trivial many whose misdiagnosis may have catastrophic patient outcomes.
Study Limitations
This study was conducted in general hospitals which handle not so many complicated conditions. Many of the complex diseases like cancers (neoplasms) and mental health-related diseases are referred either to the regional or the national referral hospitals. Since the referred-out cases were excluded, it is possible that different results will have emerged if information from such files were included. Records of patients who have died were excluded from this study and this may have affected the results. Besides, being a record-based study, the quality of the records may have affected the findings in some way.
Abbreviations
OPD, outpatient department; ED, emergency department; HMIS, health management information system; ICD-11, international classification of diseases eleventh version.
Data Sharing Statement
The data for this study are available upon written request through the corresponding author as long as the request for data complies with the guideline of the Ethics Review Board.
Consent for Publication
All authors consented to having this work published.
Acknowledgments
The authors acknowledge the medical superintendents and staff of all the participating hospitals where this study was conducted. This study is part of a PhD thesis of SPK, the lead author who is a student at the Department of Health Policy, Planning and Management, University of Ghana, Legon.
Author Contributions
All authors significantly contributed to this work, whether it be in the conception, study design, implementation, data collection, analysis, and interpretation. They also participated in writing, revising, or critically evaluating the article, gave their final approval for the version that would be published, decided on the journal to which the article would be submitted, and agree to be responsible for all aspects of the work.
Disclosure
The authors report no competing interests in this work.
References
1. Zwaan L, Maude J, Lyratzopoulos G, ten Berg M. Diagnostic Error in Medicine 1st European Conference June 30–July 1, 2016. Diagnosis. 2016;3(2):eA1–eA36. doi:10.1515/dx-2016-0015
2. Graber ML, Wachter R, Cassel CK. Bringing diagnosis into the quality and safety equations. JAMA. 2012;308(12):1211–1212. doi:10.1001/2012.jama.11913
3. Graber M. Diagnostic error: learning resource for clinicians; 2015.
4. Chatterjee S, Ray K, Das AK. Gap analysis between provisional diagnosis and final diagnosis in government and private teaching hospitals: a record linked comparative study. J Fam Med Prim Care. 2016;5:637–640. doi:10.4103/2249-4863.197318
5. Khullar D, Jha AK, Jena AB. Reducing diagnostic errors-why now? HHS public access. N Engl J Med. 2015;373(26):2491–2493. doi:10.1056/NEJMp1508044.Reducing
6. World Health Organization. Diagnostic errors: technical series on safer primary care; 2016. Available from: http://apps.who.int/iris.
7. Singh H, Schiff GD, Graber ML, Onakpoya I, Thompson MJ. The global burden of diagnostic errors in primary care. BMJ Qual Saf. 2016;1–11. doi:10.1136/bmjqs-2016-005401
8. Schiff GD, Hasan O, Kim S, et al. Diagnostic error in medicine. Arch Intern Med. 2009;169(20):45.
9. Singh H, Schiff GD, Graber ML, Onakpoya I, Thompson MJ. The global burden of diagnostic errors in primary care. BMJ Qual Saf. 2017;26(6):484–494. doi:10.1136/bmjqs-2016-005401
10. Singh H, Meyer AND, Thomas EJ. The frequency of diagnostic errors in outpatient care: estimations from three large observational studies involving US adult populations. BMJ Qual Saf. 2014;23(9):727–731. doi:10.1136/bmjqs-2013-002627
11. Wachter RM. Diagnostic errors: central to patient safety, yet still in the periphery of safety’s radar screen1). Diagnosis. 2014;1(1):19–21. doi:10.1515/dx-2013-0035
12. Upadhyay DK, Sittig DF, Quality H, Singh H, Debakey ME, Affairs V. Ebola US Patient Zero: lessons on misdiagnosis and effective use of electronic health records. Diagnosis. 2015;1(4):1–7. doi:10.1515/dx-2014-0064.Ebola
13. Berenson RA, Upadhyay DK, Kaye DR. Placing diagnosis errors on the policy agenda. J Gen Int Med. 2014. doi:10.1007/s11606-014-2848-3
14. Weintraub R, Valtis YK, Bonis P. An online medical database is reducing diagnostic errors; 2015.
15. Wilson RM, Michel P, Olsen S, et al. Patient safety in developing countries: retrospective estimation of scale and nature of harm to patients. BMJ. 2012;832:e832. doi:10.1136/bmj.e832
16. Ministry of Health. Health Systems 20/20 and MUS of PH. Uganda Health System Assessment 2011; 2012.
17. NAM. Improving Diagnosis in Health Care. Balogh EP, Miller BT, Ball JR, editors. The National Academies Press; 2015. doi:10.17226/21794
18. Katongole SP, Akweongo P, Anguyo RD, Kasozi DE, Afari AA. Factors associated with misdiagnosis of Hospitalized patients in general hospitals of Central Uganda. PLOS ONE. 2022; In Press
19. Mukasa N. Uganda Healthcare system profile: background, organization, policies and challenges. J Sustain Reg Heal Syst. 2012;1(1):2–10.
20. Katongole, SP. Strengthening health systems for quality health care: A study of misdiagnosis among hospitalised patients in general hospitals in Uganda. 2022. The University of Ghana
21. The Republic of Uganda. The ministry of health health management information system manual; 2010:1–394.
22. World Health Organization. ICD-11 implementation or transition guide; 2019. Available from: https://icd.who.int/docs/ICD-11ImplementationorTransitionGuide_v105.pdf.
23. Britz G, Emerling D, Hare L, Hoerl R, Shade J. How to teach others to apply statistical thinking. Qual Prog. 1997;30(6):67–80.
24. Taylor JR. The handbook of quality and service improvement tools; 2010. Available from: www.institude.nhs.uk/qualitytools.
25. Graber ML. The incidence of diagnostic error in medicine. BMJ Qual Saf. 2013;22:21–27. doi:10.1136/bmjqs-2012-001615
26. Aoki T, Watanuki S. Multimorbidity and patient-reported diagnostic errors in the primary care setting: multicentre cross- sectional study in Japan. BMJ Open. 2020;10(8):e039040. doi:10.1136/bmjopen-2020-039040
27. The Republic of Uganda. The Uganda hospital and health centre IV census survey; 2014. Available from: https://www.who.int/healthinfo/systems/SARA_H_UGA_Results_2014.pdf?ua=1.
28. Newman-toker DE, Wang Z, Zhu Y, et al. Rate of diagnostic errors and serious misdiagnosis-related harms for major vascular events, infections, and cancers: toward a national incidence estimate using the “Big Three”. Diagnosis. 2021;8(1):67–84. doi:10.1515/dx-2019-0104
29. Martins T, Merriel SWD, Hamilton W. Routes to diagnosis of symptomatic cancer in sub-Saharan Africa: systematic review. BMJ Open. 2020;10(11):e038605. doi:10.1136/bmjopen-2020-038605
30. Yuyun MF, Sliwa K, Kengne AP, Mocumbi AO, Bukhman G. Cardiovascular diseases in sub-saharan Africa compared to high-income countries: an epidemiological perspective. Glob Heart. 2020;15(1). doi:10.5334/GH.403
31. Marquez PV, Farrington JL. The challenge of non-communicable diseases and road traffic injuries in Sub-Saharan Africa. An Overview. 2013. Available from: https://openknowledge.worldbank.org/handle/10986/16451.
32. Katende D, Mutungi G, Baisley K, et al. Readiness of Ugandan health services for the management of outpatients with chronic diseases. Trop Med Int Heal. 2015;20(10):1385–1395. doi:10.1111/tmi.12560
33. Etyang AO, Scott JAG. Medical causes of admissions to hospital among adults in Africa: a systematic review and 2003. Glob Health Action. 2013;6(1):19090. doi:10.3402/gha.v6i0.19090
34. Baynam GS, Groft S, Westhuizen FH. A call for global action for rare diseases in Africa. Nat Genet. 2020;52(1):21–26. doi:10.1038/s41588-019-0552-2
35. Dong D, Yat R, Chung N, Chan RHW, Gong S, Xu RH. Why is misdiagnosis more likely among some people with rare diseases than others? Insights from a population based cross sectional study in China. Orphanet J Rare Dis. 2020;15(1):1–12. doi:10.1186/s13023-020-01587-2
36. Nunn R. “It’ s not all in my head !” - The complex relationship between rare diseases and mental health problems. Orphanet J Rare Dis. 2017;12(1):1–3. doi:10.1186/s13023-017-0591-7
 © 2022 The Author(s). This work is published and licensed by Dove Medical Press Limited. The full terms of this license are available at https://www.dovepress.com/terms.php and incorporate the Creative Commons Attribution - Non Commercial (unported, v3.0) License.
By accessing the work you hereby accept the Terms. Non-commercial uses of the work are permitted without any further permission from Dove Medical Press Limited, provided the work is properly attributed. For permission for commercial use of this work, please see paragraphs 4.2 and 5 of our Terms.
© 2022 The Author(s). This work is published and licensed by Dove Medical Press Limited. The full terms of this license are available at https://www.dovepress.com/terms.php and incorporate the Creative Commons Attribution - Non Commercial (unported, v3.0) License.
By accessing the work you hereby accept the Terms. Non-commercial uses of the work are permitted without any further permission from Dove Medical Press Limited, provided the work is properly attributed. For permission for commercial use of this work, please see paragraphs 4.2 and 5 of our Terms.