")
Back to Journals » Diabetes, Metabolic Syndrome and Obesity » Volume 14
Presence of Adenovirus-36 DNA in Adipose Tissue of Women: Relationship with Adipocyte Morphology and the Expression of C/EBPβ and HIF-1α
Authors Barrera-Alcocer J, García-Benavides L, Muñoz-Valle JF, de la Cruz-Mosso U , González RA , Luquín S, Alarcón-Romero LDC , Marino-Ortega LA , Matia-Garcia I , Parra-Rojas I
Received 26 October 2020
Accepted for publication 26 December 2020
Published 3 February 2021 Volume 2021:14 Pages 477—486
DOI https://doi.org/10.2147/DMSO.S285341
Checked for plagiarism Yes
Review by Single anonymous peer review
Peer reviewer comments 2
Editor who approved publication: Professor Ming-Hui Zou
Jorge Barrera-Alcocer,1 Leonel García-Benavides,2 José F Muñoz-Valle,3 Ulises de la Cruz-Mosso,3 Ramón A González,4 Sonia Luquín,5 Luz del C Alarcón-Romero,1 Linda A Marino-Ortega,1 Ines Matia-Garcia,1 Isela Parra-Rojas1
1Facultad de Ciencias Químico Biológicas, Universidad Autónoma de Guerrero, Chilpancingo, Guerrero, México; 2Instituto de Terapéutica Experimental y Clínica, Centro Universitario de Ciencias de la Salud, Universidad de Guadalajara, Guadalajara, Jalisco, México; 3Instituto de Investigación en Ciencias Biomédicas, Centro Universitario de Ciencias de la Salud, Universidad de Guadalajara, Guadalajara, Jalisco, México; 4Centro de Investigación en Dinámica Celular, Instituto de Investigación en Ciencias Básicas y Aplicadas, Universidad Autónoma del Estado de Morelos, Cuernavaca, Morelos, México; 5Departamento de Neurociencias, Centro Universitario de Ciencias de la Salud, Universidad de Guadalajara, Guadalajara, Jalisco, México
Correspondence: Isela Parra-Rojas
Laboratorio de Investigación en Obesidady Diabetes, Facultad de Ciencias Químico Biológicas, Universidad Autónoma de Guerrero, Avenida Lázaro Cárdenas S/N, Ciudad Universitaria, Chilpancingo, Guerrero, 39090, México
Tel/Fax +52 7474719310
Email [email protected]
Background: Human adenovirus 36 (HAd36) infection has been associated with obesity. Experiments using 3T3-L1 adipocyte cultured cells and human adipose stem cells (hASCc) have shown that HAd36 stimulates the expression of genes implicated in cell differentiation and increased lipid accumulation. The presence of HAd36 in adipose tissue of overweight and obese women has also been confirmed. This study aims to analyze the presence of HAd36 DNA in the adipose tissue of women undergoing surgery for weight reduction and its relationship with obesity through changes in adipocyte morphology as well as the expression of C/EBPβ and HIF-1α.
Methods: Fifty-two subcutaneous adipose tissue biopsies were collected. The anthropometric parameters measured were weight, height, skin folds, body circumferences, and body fat percentage. Biochemical measures were performed for glucose, cholesterol, triglycerides, cholesterol HDL-c, and LDL-c. The presence of HAd36 DNA was performed by conventional PCR. Adipocyte morphology was analyzed in H&E-stained sections using ImageJ/Fiji software. The expression of genes C/EBPβ, HIF-1α and β-actin was determined using TaqMan probes.
Results: HAd36 DNA was detected in 31% of adipose tissue samples. The presence of viral DNA was not significantly associated with anthropometric, clinical, or metabolic measurements, or with changes in adipose tissue morphology. The levels of mRNA expression for C/EBPβ and HIF-1α did not show significant differences between positive and negative samples for HAd36 (p> 0.05).
Conclusion: The presence of HAd36 DNA in adipose tissue was identified, but it was not related to morphological changes of adipocytes, or the expression of C/EBPβ and HIF-1α. Further studies are needed to confirm these findings.
Keywords: human adenovirus 36, obesity, gene expression, adipose tissue
Introduction
In the year 2001, the term infectobesity was used to describe the infectious origin of obesity. Nowadays, it has been proposed that obesity may have a viral origin.1,2 The relationship of avian adenovirus SMAM-1 and human adenovirus 36 (HAd36) with obesity has been extensively studied, and adenovirus 36 has been consistently associated with obesity in both in vitro and in vivo assays and human studies.3
The first studies that analyzed the association between Human Adenovirus 36 (HAd36) and obesity were performed in animal models (mice, chickens, and non-human primates), reporting that infection with the virus was associated with the increase in body weight, fat mass gain, and a decrease in serum cholesterol and triglyceride levels.4–6
In human studies, the relationship between HAd36 and the development of obesity has also been analyzed; however, observational serological studies have shown contradictory results. Nonetheless, studies in children have found this association repeatedly, but in adults results are inconsistent.7 Several meta-analyses have concluded that infection by HAd36 confers an increased risk of obesity and weight gain, mainly with the accumulation of subcutaneous fat, but not for metabolic markers.7,8 This same relationship was reported in children who presented a greater risk for obesity.9
In vitro studies have attempted to elucidate the molecular mechanisms of the adipogenic potential of adenovirus 36. The adipogenic effect of HAd36 was assessed by Vangipuram et al, using in vitro models with murine preadipocytes (3T3-L1) infected with HAd36, observing a greater differentiation of preadipocytes and an increase in the total content of cellular lipids. The authors concluded that HAd36 could contribute to the development of obesity.10 Other researchers determined that HAd36 infection could regulate adipogenic genes, such as CCAAT/enhancer-binding protein-β (C/EBPα and C/EBPβ), peroxisome proliferator-activated γ (PPARγ) and glycerol-3-phosphate dehydrogenase (GPDH), which are specific activators of adipogenesis.11
To date, few studies have identified the presence of HAd36 in human adipose tissue.12,13 However, it is not clear if the virus is related to the development of obesity. Therefore, the objective of this study was to identify the presence of HAd36 DNA in adipose tissue of women undergoing surgery for weight reduction and its relationship with the morphological changes of adipocytes and the expression of genes, such as C/EBPβ and hypoxia-inducible factor-1α (HIF-1α) in the HAd36 positive samples.
Methods
Subjects
The study population consisted of 52 women from 19 to 60 years of age who underwent abdominal liposuction and/or lipectomy in clinics specializing in weight reduction surgery. The informed consent of all women was obtained before surgery for inclusion in the study.
The study was approved by the Research Ethics Committee of the University of Guerrero (CB-004/2017) and was conducted in accordance with the Declaration of Helsinki.
Anthropometric and Clinical Measurements
Of the 52 women included in the study, 16 had normal weight, 26 were overweight and 10 were obese. Before the surgical intervention, an anthropometric assessment was carried out by an electrical impedance technique using a body composition monitor (Tanita Ironman BC-553, Illinois, USA). The thickness of skinfolds (triceps, biceps and subscapular) and body circumferences (waist, hip, and arm) were measured twice, using a manual plicometer (Hergom-BF01, China) and a measuring tape (Seca 201, Hamburg, Germany), respectively. Waist-to-hip ratio (WHR) was calculated dividing the waist circumference by hip circumference. The biochemical parameters, glucose, total cholesterol, HDL cholesterol, LDL cholesterol, and triglycerides were determined by an automated analyzer (Mindray BS-200, Shenzhen, China).
Adipose Tissue Sampling and DNA Extraction
The samples of adipose tissue obtained during the surgical intervention consisted of approximately 50 mL of adipose tissue from liposuction (33 samples) and 10 to 20 mg of tissue from an abdominal lipectomy (19 samples). Approximately 10 to 15 cubic centimeters of adipose tissue from liposuction were used from each patient. The aspirated tissue was separated by centrifugation obtaining 3 fractions, 5 mL were taken from the intermediate fraction and 10 mL from the freezing medium (8% glycerol + 2% human albumin + 0.1 sucrose in physiological solution) were added and then stored at −80°C until analysis. The tissue obtained by abdominal lipectomy was fragmented in approximately 1 cm3 fragments and then washed with 0.9% saline. For the DNA extraction from adipose tissue, 300 μL from the lipoaspirate or 5.0 mg from the adipose tissue from the abdominal lipectomy were used, and both tissues were subsequently incubated in 500 µL of lysis buffer (10 mM Tris.HCl, 10 mM EDTA, 0.5% Triton X-100, pH 8.0) and proteinase K (Sigma, 0.4 mg/mL) for 1 hour at 37°C. The organic phase was obtained by adding 250 μL of phenol/chloroform/isoamyl alcohol (25/24/1), followed by chloroform/isoamyl alcohol (24/1). Next, isopropanol and NaCl2 were added to precipitate the DNA for 24 hours at −20°C. The washes were performed with 75% ethanol and the DNA was resuspended in 50 μL TE buffer (pH 8.0).
Adenovirus 36 DNA Detection
The protocol for HAd36 DNA detection was established in the present study. The DNA obtained from both adipose tissue samples was diluted to a final concentration of 100 ng/µL. To perform the PCR, a 300 ng concentration of DNA was used with the following primers: forward, 5ʹ-AGT CAG TGG ACT GAC AAA GAA CG-3ʹ and antisense reverse, 5ʹ-GTC TGC ATA TAT CTC TTC TTC ACC-3ʹ; these primers were directed to a conserved region of the HAd36 hexon protein gene, and a fragment of 171 bp was amplified. The PCR conditions were: 95°C of denaturation for 5 minutes, followed by 35 cycles, 95°C for 1 minute, 69°C for 1 minute, 72°C for 1 minute, and a final extension at 72°C for 3 minutes using a Veriti™ Thermal Cycler (Thermo Fisher Scientific, Massachusetts, United States). An internal positive control consisting of purified DNA from HAd36 was used. To evaluate the viability of the samples and rule out possible PCR inhibitors, the β-actin gene (a fragment of 290 bp) was also amplified, serving as a control for the PCR reaction. Samples were analyzed in duplicate to confirm the results. The visualization of the amplified products was performed using polyacrylamide gels (6%) stained with AgNO3 (0.3%).
Histological Analysis of Adipose Tissue
A total of 19 adipose tissue biopsies were obtained by lipectomy and fixed in 10% paraformaldehyde. Subsequently, tissue sections of approximately 1 cm2 were cut in a cryostat, mounted on glass slides, and stained with hematoxylin-eosin. The images were taken using a LEICA DM1000 (Wetzlar, Germany) optical microscope at 40X magnification, for the estimation of the adipocytes diameter 200 cells per patient were analyzed. The diameter was established taking as reference the scale images (200 µm). To evaluate the number of cells, two fields were quantified for each patient. The estimate of the cell diameter was obtained using the “measure and label” tool and for the number of cells per field “Multi-point” from the ImageJ/Fiji software. A limitation of this study is the morphological analysis used to determine the number of adipocytes to diagnose hyperplasia since it only allows an estimation of the number of cells found during the visual field assessments, so these results must be taken with reservations.
The diameter and number of adipocytes were analyzed in tertiles, using the 1st tertile as reference. The adipocytes that showed a diameter greater than the third tertile (>112.9 µm) were considered hypertrophic, and hyperplasia was considered when the number of cells was greater than the third tertile (>128 cells/field). The tissue samples were analyzed by two independent analysts for evaluation of adipocyte morphology. The results were reported as the average of both measurements. All samples were analyzed without prior knowledge of the clinical data from each patient.
Gene Expression Analysis
The product of adipose tissue harvested by liposuction was collected in 15 mL polypropylene conical tubes for the extraction of total RNA with TRIzol reagent and according to the protocol established by Chomczynski and Sacchi.14 To carry out the synthesis of cDNA, 1 µg of RNA was used with oligo dT and reagents for reverse transcription in accordance with the specifications of the manufacturer (Promega Corporation, USA). The cDNA was stored at −80°C until its use for real-time PCR. The expression of genes C/EBPβ, HIF-1α and β-actin, was carried out in duplicate and using TaqMan probes according to the manufacturer’s instructions in a CFX96 Touch Real-Time PCR Detection System (BIO-RAD, California, USA). Relative expression analysis of each gene of interest was performed using 2−ΔCt and 2−ΔΔCt methods, and β-actin was the reference gene.
Statistical Analysis
The data were captured in STATA (v 11.1) and GraphPad Prism 5 software. For the absolute and relative frequencies of qualitative variables, the comparison between groups was performed with the Chi-Square test (X2) or Fisher exact test, as appropriate. The comparison between groups using the Welch’s t-test for the parametric variables (data presented on average ±SD), and for non-parametric variables, the Mann–Whitney test (median and ranges percentiles) was used. A value of p<0.05 was considered statistically significant.
Results
The identification of viral DNA by PCR was performed from adipose tissue samples obtained from women undergoing abdominal liposuction or lipectomy, observing that the frequency of viral DNA in patients with normal weight was 44%, for overweight 25%, and 31% for obesity, although no significant differences were found when comparing the study groups (p=0.053) (Table 1).
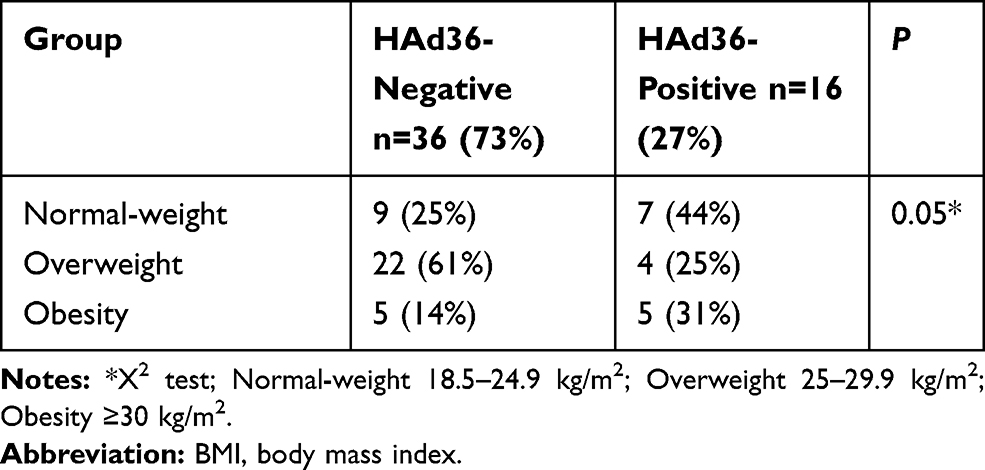 |
Table 1 Frequency of Viral DNA According to BMI Categories |
The PCR products were identified by electrophoresis on 6% polyacrylamide gels. In all cases, positive (purified HAd36 DNA) and negative control reactions were performed simultaneously with patient samples (Figure 1).
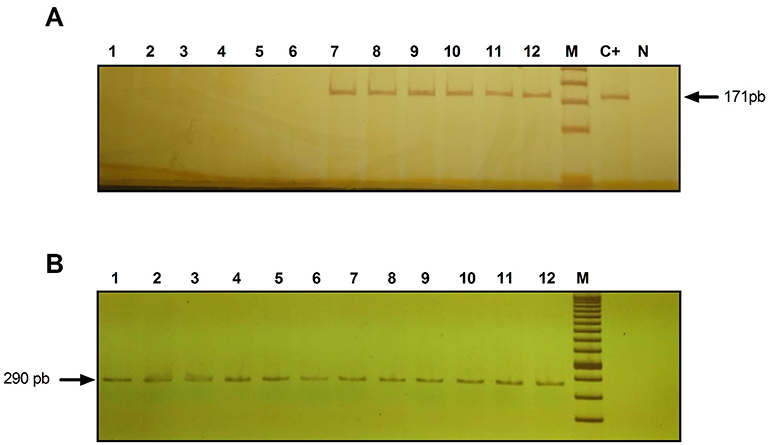 |
Figure 1 Identification of HAd36 DNA in 6% polyacrylamide gel stained with 0.3% AgNO3. (A) Lanes 1–6, negative samples for HAd36 and lanes 7–12, positive samples for HAd36. The PCR products correspond to an amplified fragment of 171 bp. (B) PCR products for β-actin, amplified fragment of 290 pb. M corresponds to the molecular marker of 50 bp. C+ indicates the positive control and N indicates the negative control. |
Table 2 shows the clinical and metabolic characteristics of patients grouped by BMI and viral DNA positivity, where the group of women with normal-weight who were positive for HAd36 presented lower tricipital skinfold thickness compared to women who were negative (20 vs 26 mm, p=0.03), and they also had higher levels of LDL-c compared to their counterparts (71 vs 53 mg/dL, p=0.03); however, no significant differences were observed with respect to other variables. In the overweight and obese groups, no statistically significant differences were found in the comparison of clinical and metabolic characteristics.
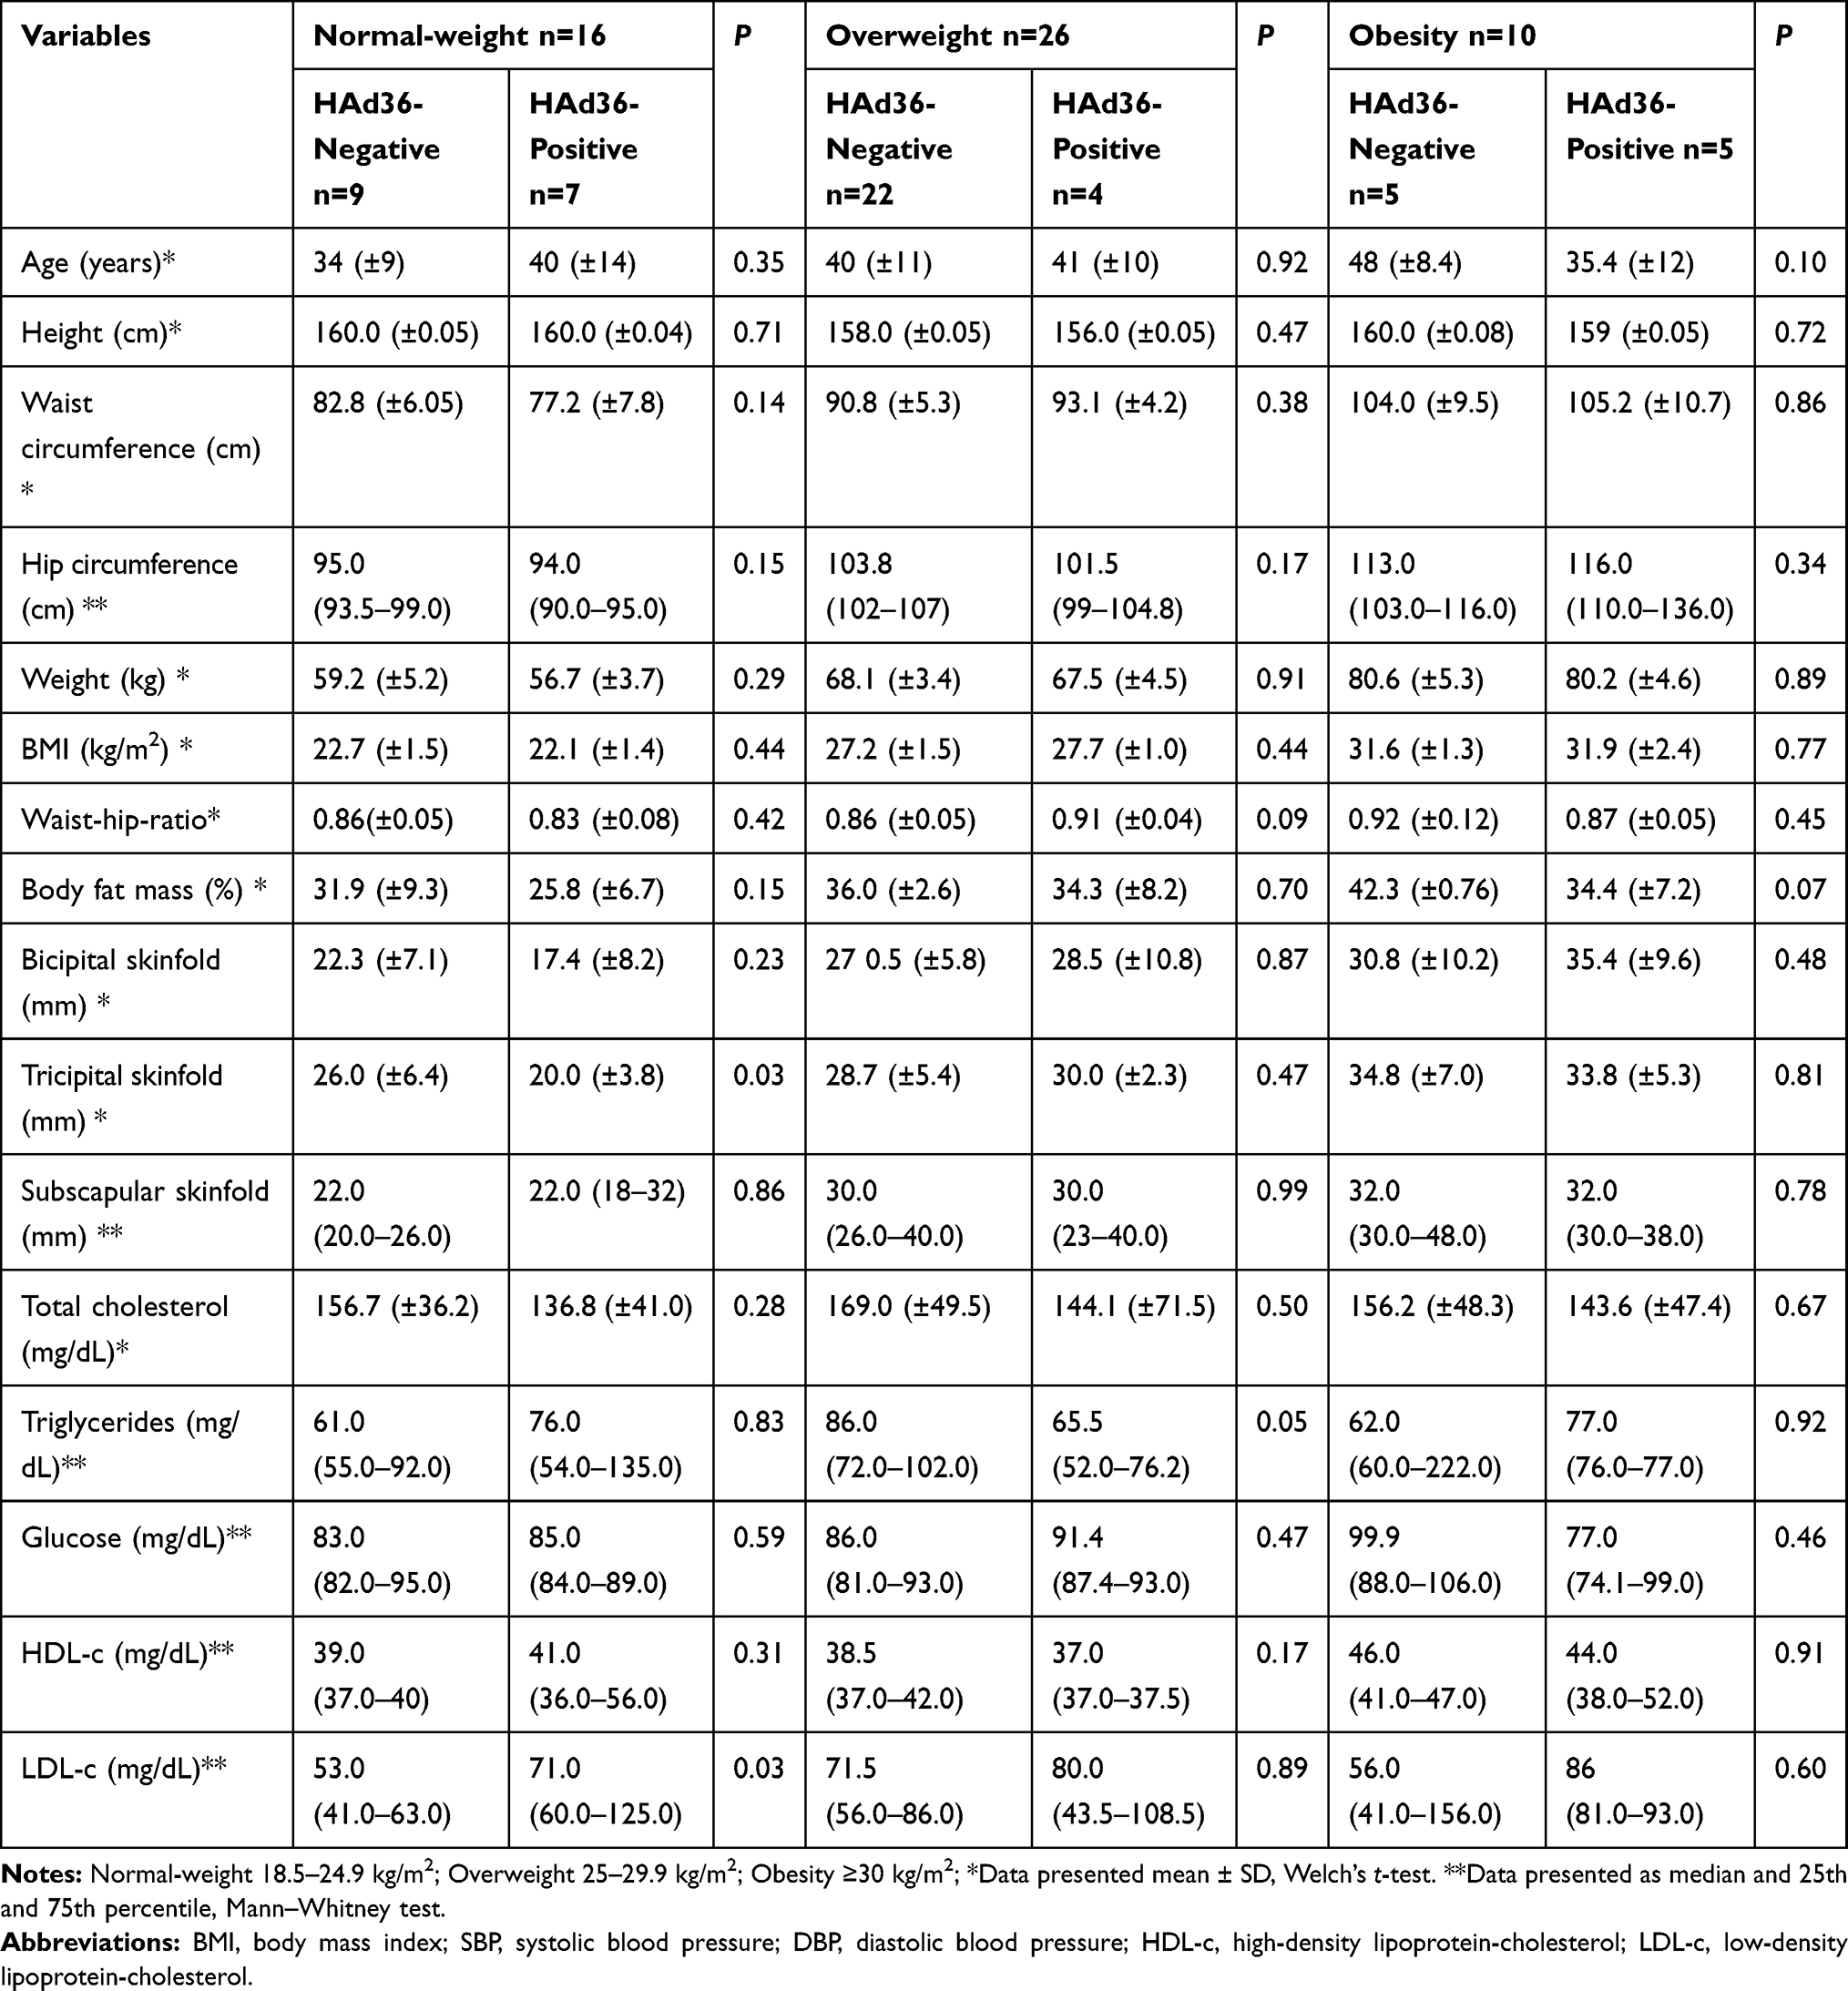 |
Table 2 Comparison of Clinical and Metabolic Characteristics According to BMI Categories and Viral DNA Positivity |
The results obtained from the cell morphology analysis of the adipose tissue obtained by lipectomy are presented in Figure 2. Regarding the number of cells, it was observed that HAd36-positive women had less variation in cell number per field (>100 to 159 adipocytes/field), in comparison with HAd36-negative women who had a wide range of variation in the number of cells (>100 to 190 adipocytes/field, Figure 2A). Regarding the estimation of cell diameter, results showed that adipocytes had a diameter between 100 and 149 μm for both HAd36-positive and negative groups (Figure 2B). Representative micrographs from histological sections of adipose tissue obtained by abdominal lipectomy from obese HAd36-positive (Figure 2C) and obese HAd36 negative (Figure 2D) women are shown; where it was observed that the HAd36-positive samples had a greater distribution of various cell sizes compared with the HAd36-negative samples.
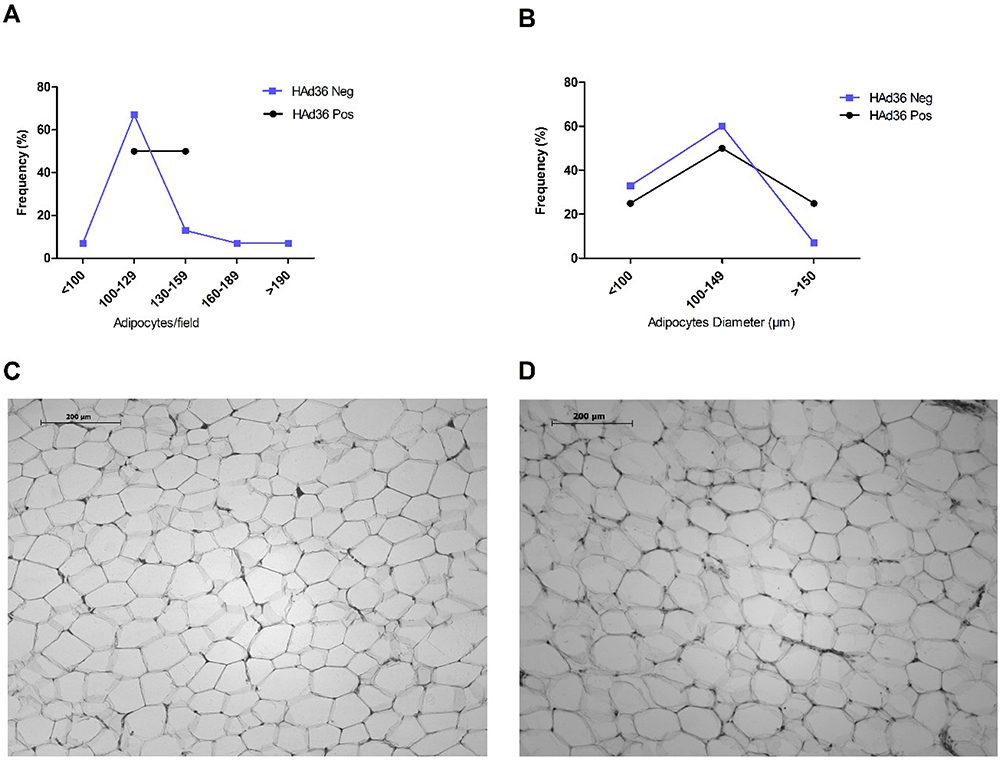 |
Figure 2 Morphological analysis and distribution of adipose tissue from women who underwent abdominal lipectomy. (A) Distribution (%) of positive and negative samples for HAd36 in relation to the number of adipose cells per field. (B) Distribution (%) of positive and negative samples for HAd36 in relation with cell diameter. (C) Representative photograph of an adipose tissue sample positive for HAd36, showing greater cellularity and adipocytes of variable size. (D) Representative photograph of an adipose tissue sample negative for HAd36, showing a more homogeneous distribution in the number and size of adipocytes. |
The morphological analysis of adipose tissue showed that women who were positive for HAd36 DNA presented a higher frequency of hyperplasia in comparison with HAd36-negative women (Figure 3); however, these differences were not statistically significant between study groups (p=0.37). With respect to hypertrophy, the results showed a slight increase in the size of HAd36-negative women with respect to positive ones, but these differences were also not significant (p=0.62).
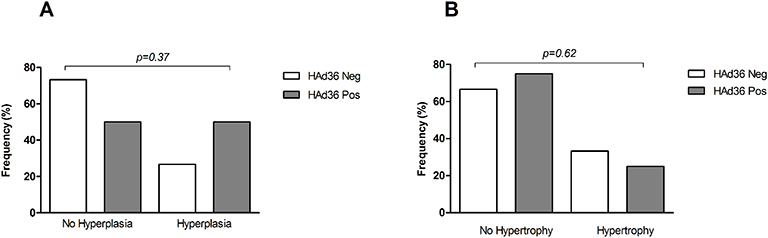 |
Figure 3 Morphological changes of subcutaneous adipose tissue from women subjected to abdominal lipectomy. (A) Frequency of fat cell hyperplasia in positive and negative women for HAd36. (B) Frequency of fat cell hypertrophy in positive and negative women for HAd36. The P value was calculated using Fisher’s exact test. |
In Figure 4, the statistical analyses of the mRNA expression levels for C/EBPβ and HIF-1α are shown, where no statistically significant differences were observed between HAd36-positive and negative women (p>0.05).
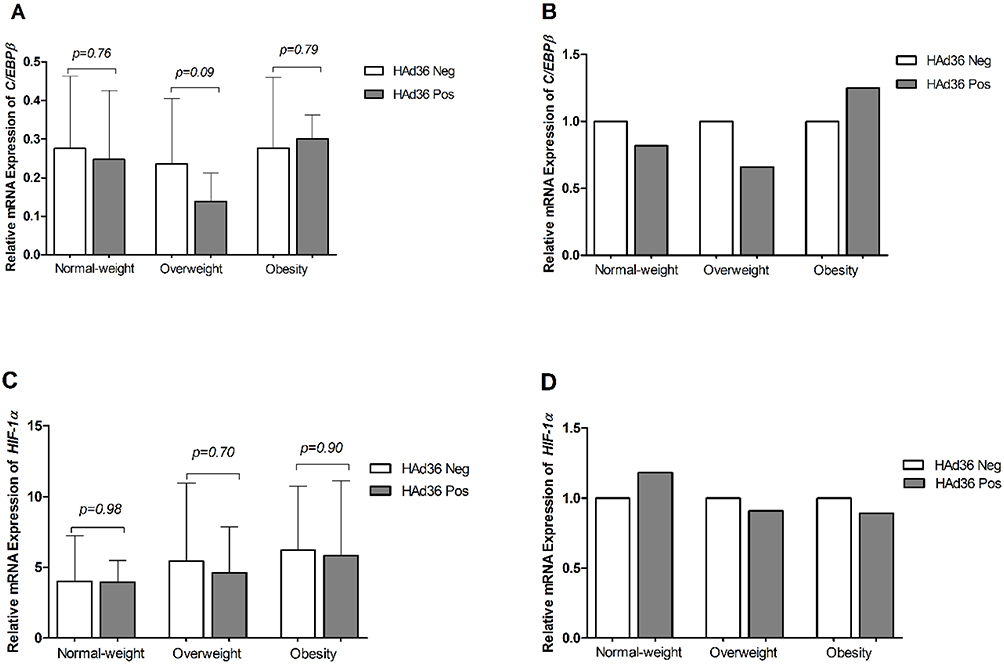 |
Figure 4 Relative mRNA expression of the C/EBPβ and HIF-1α genes is shown. (A, B) C/EBPβ mRNA expression between HAd36-positive and -negative samples by BMI category. (C, D) HIF-1α mRNA expression between HAd36-positive and -negative samples by BMI category. Relative expression analysis for each gene of interest was performed using 2−ΔCt (A and C) and 2−ΔΔCt (B and D) methods and β-actin was the reference gene. The P value was calculated using the Welch’s t-test. |
Discussion
In recent years, HAd36 infection has been associated with higher body weight and obesity in children and adults.6,7,15 Some studies have summarized the known facts about how HAd36 induced obesity, but more evidence are needed.16
Our initial aim was to know the overall frequency of HAd36 DNA in adipose tissue and we found 31% of positive samples (16 out of 52 samples), which is higher compared to 19% (4 out of 21 samples) reported by Ponterio et al, (2015) in visceral adipose tissue.13 These differences could be due to the specificity of the primers used in the PCR assay since the primers of our study were designed to amplify a conserved region of the gene that codes for the hexon protein, unlike those used by Ponterio et al, which were designed to amplify a fragment of the gene that codes for the fiber protein. Similarly, a study conducted in Turkish adults in the same year, failed to identify the presence of HAd36 genetic material in the lipoaspirate, and the primers used for the PCR were also directed to the HAd36 fiber gene.17 The first report that evidenced the presence of HAd36 DNA was from a clinical case published in 2010. The identification of viral DNA was performed in subcutaneous adipose tissue biopsies of a patient with visceral obesity. In this study, the same primers from the Turkish population were used; however, the presence of viral DNA was identified in three of the four tissue biopsies.12 According to these findings, we could speculate that the primer design, viral load, and the amount of adipose tissue used for the analysis are variables that should be considered for future viral DNA identification assays.
An intriguing question is how HAd36 enters the adipocyte; however, it was recently reported that the coxsackievirus and adenovirus receptor (CAR) is expressed in subcutaneous and visceral adipose tissue. Most adenovirus serotypes interact with CAR to enter the cell, and this protein is highly expressed in the gastric, respiratory, and ocular mucosa cells.18 Furthermore, it is suggested that the HAd36 fiber protein has highly conserved sites in the Tyr315 and Lys350, which would enable it to interact with sialic acid (SA), a component of the membrane involved in cell recognition.19,20 This background could provide a possible explanation for how adipose tissue is susceptible to HAd36 infection; however, the molecular mechanism by which the virus reaches adipose tissue deposits is still unknown.
In this study, we did not find an association between the presence of HAd36 DNA in adipose tissue with altered anthropometric and metabolic measurements. Similarly, in a study conducted in Italian patients where viral DNA was detected in abdominal adipose tissue, no significant differences were found in serum cholesterol, triglycerides, and glucose levels.13 Another study published in 2012 reported that there is no positive correlation between seropositivity of HAd36 with BMI. This same study showed that it was not possible to detect viral DNA by PCR in adipose tissue biopsies of 31 patients with severe obesity using primers directed to the gene that code for the hexon protein of HAd36.21 These results are not in accordance with a study carried out in a HAd36-induced obese rat model where the metabolic profile and the expression of adipokines were analyzed. Findings showed that in HAd36-induced obese rats, no ectopic fat deposition and no increase in serum triglycerides and glucose levels were found, and insulin sensitivity was normal. These results were attributed to the fact that these rats had a significant increase in the expression of adipokines, such as adiponectin which improves insulin sensitivity, Lipin 1 (Lpin1) was shown to favor the deposition of triglycerides in adipose tissue and prevent their ectopic accumulation, and glucose transporter 4 (Glut4) was also shown to favor glucose uptake in adipose tissue, compared to the control group consisting of rats with obesity induced by a high-fat diet.22 A limitation of our study is that the expression of adipokines was not measured; therefore, the relationship between adipokines, and biochemical parameters and body fat distribution could not be determined.
In terms of the morphological changes, once cut-off points were established for hyperplasia and hypertrophy of adipose tissue, the results showed that women who were positive for HAd36 presented a slight increase in the number of adipocytes per field; however, these differences were not significant in comparison with the negative group. Currently, there is no evidence linking HAd36 infection with hyperplasia and hypertrophy of human adipose tissue; however, some studies performed in animal models have confirmed that HAd36 infection increases fat deposits between 3 and 8 months after infection, and that adipose tissue gain is slow but not transient,11 and the same results have been observed in non-human primates, mice and chickens.4–6 This adipose tissue gain could be related to the adipogenic role of HAd36 since the protein encoded by the E4 open reading frame 1 gene (E4ORF1) is sufficient and necessary to induce adipogenesis.23 It has been reported that HAd36 stimulates differentiation of preadipocytes to adipocytes by promoting adipocyte hyperplasia and increasing intracellular lipid accumulation and higher levels of the glycerol 3-phosphate dehydrogenase (GPDH) protein, which favors adipocyte hypertrophy.16 Some genes related to adipogenesis, that were found to be upregulated in human mesenchymal stem cells (hMSCs) infected with HAd36 are C/EBPα, C/EBPβ, PPARγ, activating transcription factor 3 (ATF3), and fatty acid-binding protein 4 (FABP4).24 However, our results did not associate the presence of HAd36 DNA in the subcutaneous adipose tissue with differential expression of C/EBPβ mRNA between positive and negative women; therefore, other studies are needed to confirm the overexpression of adipogenic genes and their relationship with the increase in body fat during the course of viral infection in animal models.
A recent study found that the presence of antibodies against HAd36 was related to the expression of PPARγ and miRNAs in visceral adipose tissue, which participate in the regulation of adipogenesis. Results show that HAd36 seropositive subjects present higher expression of PPARγ and miR-17 (pro-adipogenic), but lower expression of miR-155 (anti-adipogenic), which may favor a proadipogenic state in these subjects.25 Therefore, the role of miRNAs in the epigenetic regulation of adipogenesis in HAd36 infection represents a new line of research that will continue to be developed to clarify the underlying mechanisms of this viral infection.
In regard to the expression of the transcription of the hypoxia-inducible factor-1α (HIF-1α), it has been reported that some infections due to viruses, such as hepatitis C virus, human cytomegalovirus, and human papillomavirus (HPV) have been linked to increased mRNA levels and the HIF-1α protein.26–28 In this sense, evidence suggests that the activity of HIF-1α is induced by low levels of oxygen in the adipose tissue that is characteristic of obesity,29 but when analyzing the results obtained from HIF-1α expression, no significant differences were found between positive and negative women to HAd36. However, it is important to mention that in our study only one adipogenic gene (C/EBPβ) and one gene associated with cellular metabolism (HIF-1α) were evaluated, and thus, establishing an association between the presence of viral DNA with hyperplasia and hypertrophy of adipose tissue is not sufficient. Therefore, the analysis of transcription factors and the genes they regulate is considered of utmost importance to determine the adipogenic pathways involved in the development of obesity in subjects with HAd36 DNA.
There were additional limitations in the present study, the small sample size reduces its statistical power; therefore, it is necessary to repeat it on a larger sample to confirm these results. In addition, only women were included, so it is important to replicate the study in men; besides matching them by gender, age, and body mass index, considering that hormonal regulation of metabolism is gender related.30 Another limitation of this study is that the serum neutralization assay was not carried out to analyze seropositivity for HAd36, and thus, we were unable to assess the concordance between seropositivity and the presence of viral DNA in adipose tissue.
Conclusion
In conclusion, our results show the presence of HAd36 DNA in subcutaneous adipose tissue; however, this finding was not associated with the morphological changes of adipose tissue or with the expression of some genes, such as C/EBPβ and HIF-1α related to obesity. However, more studies are needed to replicate these results.
Acknowledgments
The study was supported by the National Council of Science and Technology, Mexico, Grant CB-2014-01/238868 assigned to IPR. JBA was a recipient of a CONACyT fellowship.
Disclosure
The authors report no conflicts of interest in this work.
References
1. Dhurandhar NV. Infectobesity: obesity of infectious origin. J Nutr. 2001;131(10):2794S–2797S. doi:10.1093/jn/131.10.2794S
2. Mitra AK, Clarke K. Viral obesity: fact or fiction? Obes Rev. 2010;11(4):289–296. doi:10.1111/j.1467-789X.2009.00677.x
3. Akheruzzaman M, Hegde V, Dhurandhar NV. Twenty-five years of research about adipogenic adenoviruses: a systematic review. Obes Rev. 2019;20(4):499–509.
4. Dhurandhar N, Israel B, Kolesar J, Mayhew G, Cook M, Atkinson R. Transmissibility of adenovirus-induced adiposity in a chicken model. Int J Obes. 2001;25(7):990–996.
5. Dhurandhar NV, Whigham LD, Abbott DH, et al. Human adenovirus Ad-36 promotes weight gain in male rhesus and marmoset monkeys. J Nutr. 2002;132(10):3155–3160.
6. Dhurandhar NV, Israel BA, Kolesar JM. Increased adiposity in animals due to a human virus. Int J Obes Relat Metab Disord. 2000;24(8):989–996.
7. Yamada T, Hara K, Kadowaki T. Association of adenovirus 36 infection with obesity and metabolic markers in humans: a meta-analysis of observational studies. PLoS One. 2012;7(7):e42031.
8. Xu MY, Cao B, Wang DF, et al. Human Adenovirus 36 infection increased the risk of obesity: a meta-analysis update. Medicine. 2015;94(51):e2357.
9. Shang Q, Wang H, Song Y, et al. Serological data analyses show that adenovirus 36 infection is associated with obesity: a meta-analysis involving 5739 subjects. Obesity. 2014;22(3):895–900.
10. Vangipuram SD, Sheele J, Atkinson RL, Holland TC, Dhurandhar NV. A human adenovirus enhances preadipocyte differentiation. Obes Res. 2004;12(5):770–777. doi:10.1038/oby.2004.93
11. Pasarica M, Shin AC, Yu M, et al. Human Adenovirus 36 induces adiposity, increases insulin sensitivity, and alters hypothalamic monoamines in rats. Obesity. 2006;14(11):1905–1913. doi:10.1038/oby.2006.222
12. Salehian B, Forman SJ, Kandeel FR, Bruner DE, He J, Atkinson RL. Adenovirus 36 DNA in adipose tissue of patient with unusual visceral obesity. Emerg Infect Dis. 2010;16(5):850–852. doi:10.3201/eid1605.091271
13. Ponterio E, Cangemi R, Mariani S, et al. Adenovirus 36 DNA in human adipose tissue. Int J Obes. 2015;39(12):1761–1764. doi:10.1038/ijo.2015.163
14. Chomczynski P, Sacchi N. The single-step method of RNA isolation by acid guanidinium thiocyanate–phenol–chloroform extraction: twenty-something years on. Nat Protoc. 2006;1(2):581–585. doi:10.1038/nprot.2006.83
15. Atkinson RL, Dhurandhar NV, Allison DB, et al. Human adenovirus-36 is associated with increased body weight and paradoxical reduction of serum lipids. Int J Obes. 2005;29(3):281–286. doi:10.1038/sj.ijo.0802830
16. Kim J, Na H, Kim JA, Nam JH. What we know and what we need to know about adenovirus 36-induced obesity. Int J Obes. 2020;44(6):1197–1209. doi:10.1038/s41366-020-0536-4
17. Ergin S, Altan E, Pilanci O, et al. The role of adenovirus 36 as a risk factor in obesity: the first clinical study made in the fatty tissues of adults in Turkey. Microb Pathog. 2015;80:57–62. doi:10.1016/j.micpath.2015.02.008
18. Serrano M, Moreno M, Bassols J, et al. Coxsackie and adenovirus receptor is increased in adipose tissue of obese subjects: a role for adenovirus infection? J Clin Endocrinol Metab. 2015;100(3):1156–1163. doi:10.1210/jc.2014-3791
19. Arnold J, Jánoska M, Kajon AE, et al. Genomic characterization of human adenovirus 36, a putative obesity agent. Virus Res. 2010;149(2):152–161. doi:10.1016/j.virusres.2010.01.011
20. Traving C, Schauer R. Structure, function, and metabolism of sialic acids. Cell Mol Life Sci. 1998;54(12):1330–1349. doi:10.1007/s000180050258
21. Goossens VJ, de Jager SA, Grauls GE, et al. Lack of evidence for the role of human Adenovirus-36 in obesity in a European cohort. Obesity. 2011;19(1):220–221. doi:10.1038/oby.2009.452
22. Jiao Y, Liang X, Hou J, et al. Adenovirus type 36 regulates adipose stem cell differentiation and glucolipid metabolism through the PI3K/Akt/FoxO1/PPARγ signaling pathway. Lipids Health Dis. 2019;18(1):70. doi:10.1186/s12944-019-1004-9
23. Rogers PM, Fusinski KA, Rathod MA, et al. Human adenovirus Ad-36 induces adipogenesis via its E4 orf-1 gene. Int J Obes. 2008;32(3):397–406. doi:10.1038/sj.ijo.0803748
24. Na HN, Kim H, Nam JH. Novel genes and cellular pathways related to infection with adenovirus-36 as an obesity agent in human mesenchymal stem cells. Int J Obes. 2012;36(2):195–200.
25. Manriquez V, Gutierrez A, Morales A, et al. Influence of adenovirus 36 seropositivity on the expression of adipogenic microRNAs in obese subjects. Int J Obes. 2020;44(11):2303–2312.
26. Nakamura M, Bodily JM, Beglin M, Kyo S, Inoue M, Laimins LA. Hypoxia-specific stabilization of HIF-1alpha by human papillomaviruses. Virology. 2009;387(2):442–448.
27. McFarlane S, Nicholl MJ, Sutherland JS, Preston CM. Interaction of the human cytomegalovirus particle with the host cell induces hypoxia-inducible factor 1 alpha. Virology. 2011;414(1):83–90.
28. Nasimuzzaman M, Waris G, Mikolon D, Stupack DG, Siddiqui A. Hepatitis C virus stabilizes hypoxia-inducible factor 1 and stimulates the synthesis of vascular endothelial growth factor. J Virol. 2007;81(19):10249–10257.
29. Halberg N, Khan T, Trujillo ME, et al. Hypoxia-inducible factor 1 induces fibrosis and insulin resistance in white adipose tissue. Mol Cell Biol. 2009;29(16):4467–4483.
30. Dearden L, Bouret SG, Ozanne SE. Sex and gender differences in developmental programming of metabolism. Mol Metab. 2018;15:8–19.
 © 2021 The Author(s). This work is published and licensed by Dove Medical Press Limited. The full terms of this license are available at https://www.dovepress.com/terms.php and incorporate the Creative Commons Attribution - Non Commercial (unported, v3.0) License.
By accessing the work you hereby accept the Terms. Non-commercial uses of the work are permitted without any further permission from Dove Medical Press Limited, provided the work is properly attributed. For permission for commercial use of this work, please see paragraphs 4.2 and 5 of our Terms.
© 2021 The Author(s). This work is published and licensed by Dove Medical Press Limited. The full terms of this license are available at https://www.dovepress.com/terms.php and incorporate the Creative Commons Attribution - Non Commercial (unported, v3.0) License.
By accessing the work you hereby accept the Terms. Non-commercial uses of the work are permitted without any further permission from Dove Medical Press Limited, provided the work is properly attributed. For permission for commercial use of this work, please see paragraphs 4.2 and 5 of our Terms.