")
Back to Journals » Clinical Epidemiology » Volume 9
Prescription duration and treatment episodes in oral glucocorticoid users: application of the parametric waiting time distribution
Authors Laugesen K , Støvring H , Hallas J , Pottegård A , Jørgensen JOL , Sørensen HT , Petersen I
Received 9 August 2017
Accepted for publication 17 October 2017
Published 16 November 2017 Volume 2017:9 Pages 591—600
DOI https://doi.org/10.2147/CLEP.S148671
Checked for plagiarism Yes
Review by Single anonymous peer review
Peer reviewer comments 3
Editor who approved publication: Dr M Alan Brookhart
Kristina Laugesen,1 Henrik Støvring,2 Jesper Hallas,3 Anton Pottegård,3 Jens Otto Lunde Jørgensen,4 Henrik Toft Sørensen,1 Irene Petersen1,5
1Department of Clinical Epidemiology, Aarhus University Hospital, 2Department of Public Health, Aarhus University, Aarhus, 3Clinical Pharmacology and Pharmacy, Department of Public Health, University of Southern Denmark, Odense, 4Department of Endocrinology and Internal Medicine, Aarhus University Hospital, Aarhus, Denmark; 5Department of Primary Care and Population Health, University College London, London, UK
Purpose: Glucocorticoids are widely used medications. In many pharmacoepidemiological studies, duration of individual prescriptions and definition of treatment episodes are important issues. However, many data sources lack this information. We aimed to estimate duration of individual prescriptions for oral glucocorticoids and to describe continuous treatment episodes using the parametric waiting time distribution.
Methods: We used Danish nationwide registries to identify all prescriptions for oral glucocorticoids during 1996–2014. We applied the parametric waiting time distribution to estimate duration of individual prescriptions each year by estimating the 80th, 90th, 95th and 99th percentiles for the interarrival distribution. These corresponded to the time since last prescription during which 80%, 90%, 95% and 99% of users presented a new prescription for redemption. We used the Kaplan–Meier survival function to estimate length of first continuous treatment episodes by assigning estimated prescription duration to each prescription and thereby create treatment episodes from overlapping prescriptions.
Results: We identified 5,691,985 prescriptions issued to 854,429 individuals of whom 351,202 (41%) only redeemed 1 prescription in the whole study period. The 80th percentile for prescription duration ranged from 87 to 120 days, the 90th percentile from 116 to 150 days, the 95th percentile from 147 to 181 days, and the 99th percentile from 228 to 259 days during 1996–2014. Based on the 80th, 90th, 95th and 99th percentiles of prescription duration, the median length of continuous treatment was 113, 141, 170 and 243 days, respectively.
Conclusion: Our method and results may provide an important framework for future pharmacoepidemiological studies. The choice of which percentile of the interarrival distribution to apply as prescription duration has an impact on the level of misclassification. Use of the 80th percentile provides a measure of drug exposure that is specific, while the 99th percentile provides a sensitive measure.
Keywords: glucocorticoids, pharmacoepidemiology, prescription duration, parametric waiting time distribution
Background
Prescription registries offer huge potential for studying benefits and adverse effects of drugs. An important issue in many pharmacoepidemiological studies is timing of administration, duration of individual prescriptions, and definition of treatment episodes. Many prescription data sources, including the Danish, provide information only on the date of prescription redemption together with some information on the amount of medication dispensed.1 Thus, it is often necessary to make assumptions about the duration of single prescriptions when conducting pharmacoepidemiological research. Information on drug exposure must be handled cautiously to achieve meaningful results and to avoid false conclusions and it is well known that assigning treatment periods in pharmacoepidemiological studies is a source of bias.2,3
For some medications, clinical input may be used to guide the estimation of duration of individual prescriptions and to define treatment episodes. However, there is little consensus on how best to do this, and externally defined criteria may poorly reflect actual usage patterns.3 Støvring et al recently suggested that estimates be based instead on observed usage patterns using the parametric waiting time distribution (WTD).4 This method allows estimation of the time point at which a given proportion of users receiving continued treatment will have redeemed their next prescription, that is, the “inter-arrival time”. The method’s primary advantage is in assigning duration exposure to prescriptions based only on observed prescription redemption patterns.
Glucocorticoids are effective agents for treatment of, for example, rheumatic diseases, COPD as well as other autoimmune diseases.5 Annual prevalence of systemic glucocorticoid use is up to 3% in the Danish population6 and prevalence of long-term oral use (≥3 months) in the UK population has been estimated to 1%.7 Importantly, dosing regimens, treatment duration, and choice of glucocorticoid subtype vary substantially by treatment indication.8
To provide a framework for future pharmacoepidemiological studies on oral glucocorticoids, we aimed to use the parametric WTD to estimate duration of individual oral glucocorticoid prescriptions and length of continuous treatment episodes.
Methods
Setting
We used Danish national registries. Denmark provides its entire population with tax-supported health care, guaranteeing cost-free access to health care. A unique central personal registration number (the civil registration number) is assigned to all Danish residents at birth or upon immigration, enabling accurate and unambiguous individual-level linkage of health and administrative registries.9
Oral glucocorticoids
Oral glucocorticoids are available only by prescription in Denmark. We used the Danish National Prescription Registry1 to identify all persons in the Danish population who redeemed prescriptions for oral glucocorticoids between January 1, 1996 and December 31, 2014. The Danish National Prescription Registry records information on the customer’s civil registration number, the medication classification code (Anatomical Therapeutic Chemical classification system of the World Health Organization), date of dispensing, the number of packages dispensed, the number of tablets in a package, tablet strength, and amount dispensed, expressed according to “defined daily doses” (DDDs) developed by WHO. A DDD is defined as the assumed average maintenance dose per day for a drug used for its main indication in adults.10 ATC codes for glucocorticoids are provided in Table S1.
Statistical analyses
We first counted the total number of prescriptions redeemed for oral glucocorticoids during the study period, and the total number of individuals who redeemed these prescriptions. We described the cohort according to sex and age at first prescription. We tallied the total number of prescriptions and total DDDs redeemed for all oral glucocorticoids and for individual glucocorticoid substances.
Second, we estimated the duration of individual prescriptions by applying the parametric WTD. This method is based on the maximum likelihood estimation of a parametric 2-component mixture model for the WTD.4 The distribution component for prevalent users estimates the forward recurrence density, which is related to the inter-arrival density (distribution of time between subsequent prescription redemptions) for users receiving continued treatment. The inter-arrival density directly shows the probability of the appearance of a new prescription as a function of time. We estimated the 80th, 90th, 95th, and 99th percentiles for prescription duration (days) for oral glucocorticoid users each year from 1996 to 2014. The 80th, 90th, 95th, and 99th percentiles of assigned prescription duration in days corresponded to the time within which 80%, 90%, 95% and 99% of users, respectively, presented a new prescription. We applied the Log-Normal model in estimating the forward recurrence density.4 The parametric WTD relies on separation of users into 2 categories: prevalent users and incident users. To assess whether this method would work, we visually inspected the empirical WTD to discern if there was a distinct uniform tail toward the end of the observation window and a smoothly declining section in the beginning. We stratified subanalyses by sex, and age groups (0–19, 20–39, 40–79, ≥80 years of age), the number of tablets dispensed, and the amount (DDD) dispensed to investigate whether individual prescription durations differed according to these variables. The number of tablets dispensed was calculated as the number of tablets in a package times the number of packages dispensed and categorized as 10–30, 50–60, 100 and ≥200. The amount dispensed was calculated as the amount in a package times the number of packages dispensed and categorized as ≤25 DDD, 50–70 DDD, 100–150 DDD and 200–250 DDD.
Third, using each percentile estimated by the parametric WTD (80th, 90th, 95th, and 99th), we estimated length of first continuous treatment episodes. This was accomplished by adding the estimated prescription duration (results from the parametric WTD stratified by calendar year) to each prescription and then, for each subject, creating treatment episodes from overlapping prescriptions (i.e., periods with assumed continuous drug treatment). To estimate the length of first treatment episodes, we used the Kaplan–Meier survival function to ascertain the first, fifth, tenth, twenty-fifth, fiftieth, seventy-fifth, 90th, 95th and 99th percentiles (treating emigration as censoring and death as event).
Fourth, we excluded sporadic prescriptions to obtain a cohort of multiple-prescription use. For each prescription, we searched for prior or forthcoming prescriptions in the time interval defined by the 99th percentile as estimated by the WTD. If no prior or forthcoming prescriptions appeared in this time interval, we excluded the prescription, as this was regarded as a sporadic prescription. We described this cohort as we did above for the full cohort.
Statistical analyses were conducted using Stata 14. The study was approved by the Danish Data Protection Agency (Record number: 2016-051-000001, serial number 448).
Results
During the study period, 5,691,985 prescriptions for oral glucocorticoids (335,161,216 DDDs) were redeemed by 854,429 individuals (56% female). Median age at first prescription redemption was 60 years (Table 1). The number of persons who redeemed only 1 prescription during the study period was 351,202 (41% of the study population). Prednisolone was the most frequent subtype of oral glucocorticoid redeemed (4,662,315 prescriptions [82% of total prescriptions] and 269,275,861 DDDs [80% of total DDDs]) (Table 2). When excluding sporadic prescriptions (i.e., multiple-prescription use), 4,719,061 prescriptions (275,597,541 DDDs) were issued to 418,160 persons (56% female) and median age was 66 years (Table 1).
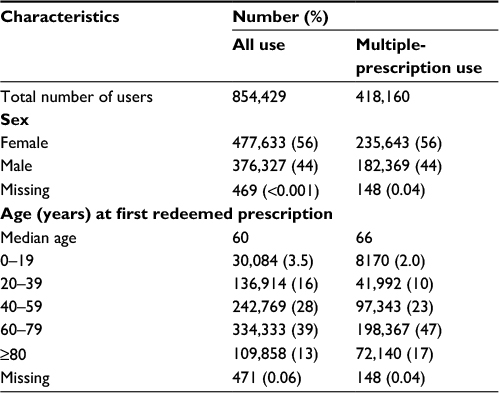 | Table 1 Sex and age distribution among all oral glucocorticoid use and multiple-prescription use, Denmark, January 1, 1996 – December 31, 2014 |
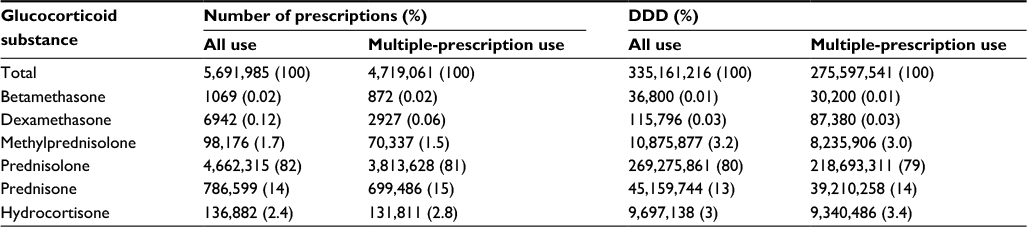 | Table 2 Number of prescriptions and DDDs redeemed by all oral glucocorticoid use and multiple-prescription use by medication subtype, Denmark, January 1, 1996–December 31, 2014 Abbreviation: DDDs, defined daily doses. |
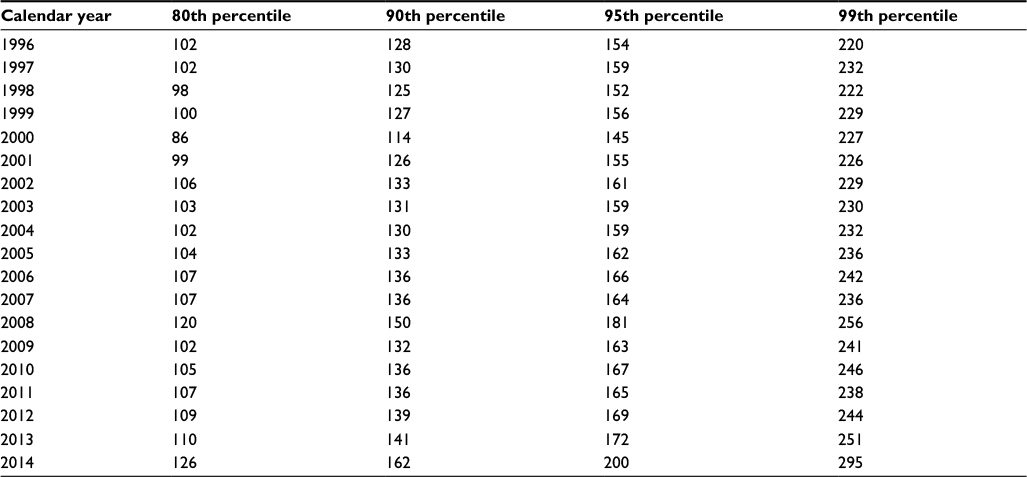
When we applied the parametric WTD, the 80th percentile for prescription duration estimated for each year ranged from 87 to 120 days; the 90th percentile ranged from 116 to 150 days, the 95th percentile from 147 to 181 days, and the 99th percentile from 228 to 259 days (Figure 1). Stratifying by sex did not change these estimates substantially (Figure 2). When we stratified by age group, the percentiles for 2 groups (40–79 years of age and ≥80 years of age) were similar to those for overall population (Figure 2). When we inspected the empirical WTD for the younger age groups, no clear separation of prevalent and incident users appeared. Thus, we did not perform analyses separately for these. When we stratified by the number of tablets, the 80th percentile ranged from 87 to 107 days in the category of 50–60 tablets, 89–120 for 100 tablets and 121–171 for ≥200 tablets (Figure 3). When we stratified by the amount, the 80th percentile ranged from 90 to 118 days for 50–70 DDD, 120–176 for 100–150 DDD and 96–132 for 200–250 DDD (Table S2). The empirical WTD in the categories of 10–30 tablets and ≤25 DDD showed no clear separation of prevalent and incident users. Thus, we did not perform analyses separately for these. When restricting to the cohort of multiple-prescription use, estimates of the 80th, 90th, 95th, and 99th percentiles of prescription duration did not change substantially (Table S3).
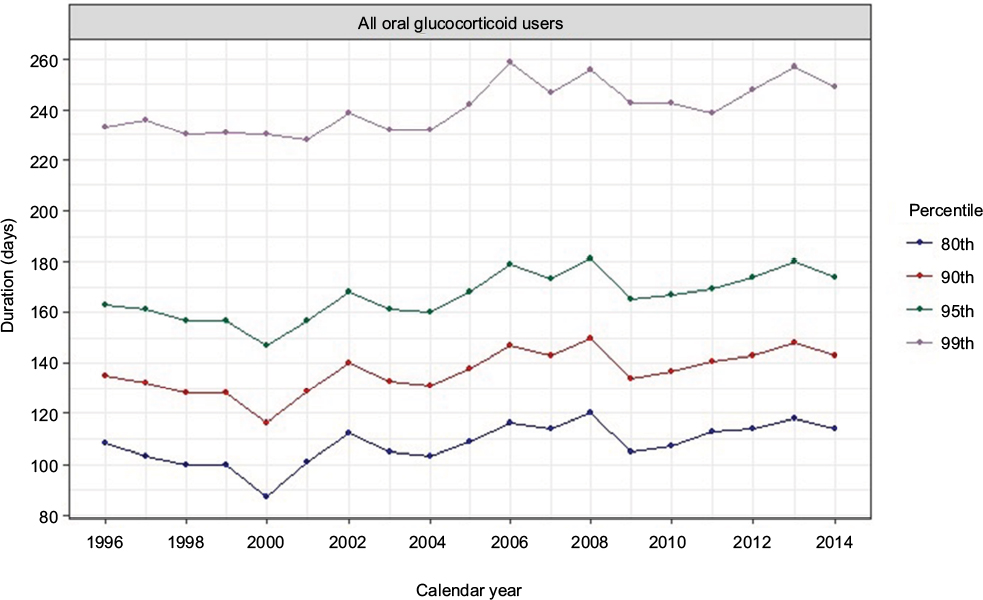 | Figure 1 Estimated 80th, 90th, 95th and 99th percentiles for prescription duration (days) in users of oral glucocorticoids, based on the parametric waiting time distribution. |
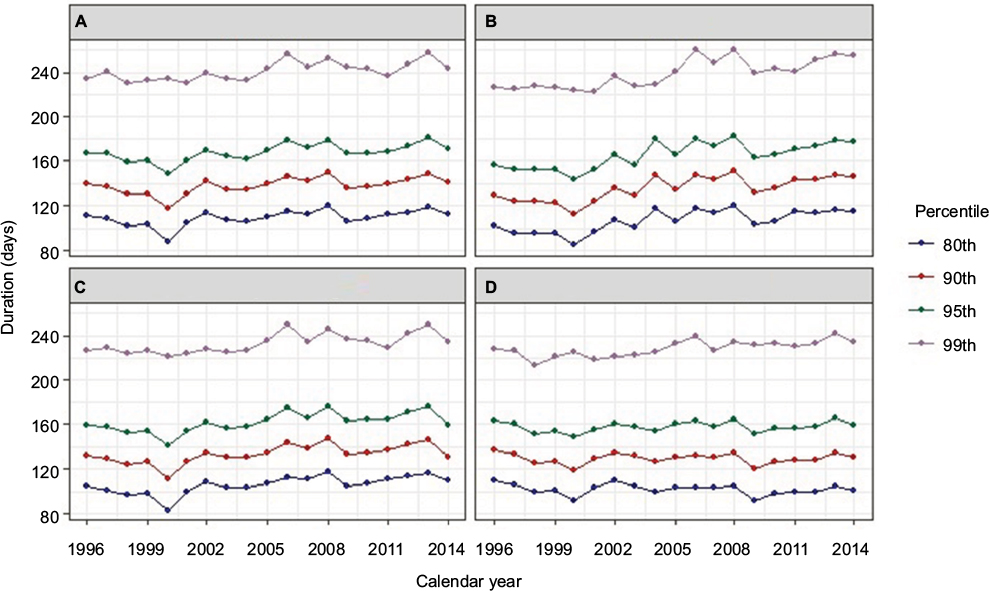 | Figure 2 Estimated 80th, 90th, 95th and 99th percentiles for prescription duration (days) in users of oral glucocorticoids using the parametric waiting time distribution, stratified by sex and age group. Note: (A) Women, (B) men, (C) age group 40–79 years of age, (D) age group ≥80 years of age. |
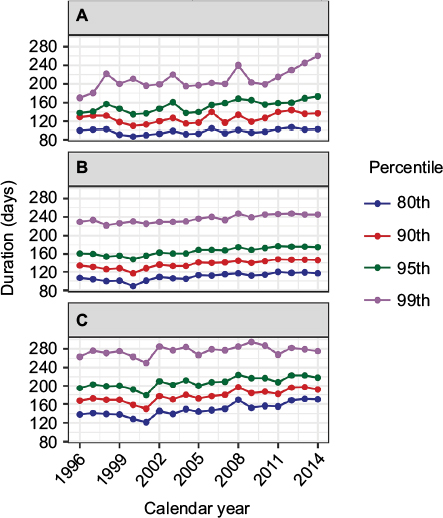 | Figure 3 Estimated 80th, 90th, 95th and 99th percentiles for prescription duration (days) in users of oral glucocorticoids using the parametric waiting time distribution, stratified by number of tablets dispensed (number of tablets in a package × number of packages dispensed). Note: (A) 50–60 tablets, (B) 100 tablets, (C) ≥200 tablets. |
When we applied the estimated durations of individual prescriptions to the full cohort, length of first treatment episodes varied depending on selection of percentiles. Applying the 80th percentile yielded a median episode length of 113 days (interquartile range [IQR]: 103–142 days). In contrast, applying the 90th, 95th and 99th percentiles yielded median episode lengths of 141 days (IQR: 132–184 days), 170 days (IQR: 160–224 days), and 243 days (IQR: 232–325 days), respectively (Table S4). In the multiple-prescription cohort, the 80th percentile yielded median episode length of 152 days (IQR: 109–252 days). Applying the 90th, 95th and 99th percentiles yielded median episode lengths of 200 days (IQR: 141–359 days), 248 days (IQR: 173–460 days), and 364 days (IQR: 255–691 days), respectively (Table S4).
Discussion
In this nationwide study, we estimated the duration of single prescriptions among users of oral glucocorticoids and described continuous treatment episodes using the parametric WTD. People who only redeemed 1 prescription in the whole study period accounted for 41% of the population. Prescription duration ranged from 87 to 299 days depending on choice of percentile, calendar year as well as number of tablets and amount dispensed. Application of the 80th, 90th, 95th and 99th percentiles yielded median lengths of first continuous treatment episodes of 113, 141, 170 and 243 days, respectively.
This study can provide important information for future studies of glucocorticoids. As well, the study provides a valuable framework for determining duration of prescribing episodes in pharmacoepidemiological studies. Prescription registries offer huge potential for studying benefits and adverse effects of drugs. However, information on drug exposure must be handled cautiously to achieve meaningful results and to avoid false conclusions. It is well known that assigning treatment periods in pharmacoepidemiological studies is a source of bias.2,3 Decisions about duration of single prescriptions and overall length of treatment are often not based on evidence. For example, duration of a single prescription is often assumed to be 3 months; a grace period of, for example, 3 weeks is often added for subsequent prescriptions to be considered a part of the same treatment episode. Such decisions clearly cause some degree of misclassification. Use of the parametric WTD to estimate a percentile of the inter-arrival density among continued users can be viewed as putting a limit on their misclassification. For example, with prescription duration defined on the basis of the 95th percentile, only 5% of continuous users will mistakenly be classified as having stopped use. When the 99th percentile is chosen, only 1% of continued users will be classified mistakenly as having stopped use. On the other hand, use of the 99th percentile is likely to classify a higher proportion of individuals as continued users when, in fact, they have stopped. In our study, the 80th percentiles were 87–120 days, whereas the 99th percentiles were 228 to 259 days. Intermittent users of oral glucocorticoids (e.g., COPD patient) may explain the high values of the 99th percentiles. The higher percentiles (e.g., the 99th) of the interarrival distribution are probably not a realistic estimate of prescription duration in our population but rather a measure of time since last prescription in the group of intermittent users. Notably, we found median length of continuous treatment episodes close to duration of individual prescriptions, which can be explained by the high proportion (41%) of people who only redeemed 1 prescription in the whole study.
The method used in this study cannot account for individual covariates that might be predictive of the length of the interval between 2 consecutive prescriptions. These include the number of tablets dispensed, the amount dispensed, frequency of daily intake, the administered dose, patient characteristics and any hospitalizations. However, we performed stratified analyses by the number of tablets as well as amount dispensed. A larger number of tablets yielded longer intervals between consecutive prescriptions, whereas when stratifying on amount the category of 100–150 DDD yielded longer intervals than the category of 200–250 DDD. The longer intervals found in the 100–150 DDD category compared with the 200–250 DDD category were explained by a larger number of tablets dispensed in the 100–150 DDD category than in the 200–250 category. For glucocorticoids, number of tablets dispensed may be a more logic predictor of time interval between consecutive prescriptions than amount dispensed. First, amount reflects a mixture of tablet strength and number of tablets in a package. Second, DDD does not correlate well with prescribed daily dose for glucocorticoids. In addition, we stratified by patient characteristics such as sex and age group and this did not change the estimates appreciably. Other relevant patient characteristics to consider could be treatment indication and disease severity; however, we were not able to identify these. Furthermore, the WTD requires reliable separation of current users into 2 categories: prevalent and incident users. Intermittent use may make the method less reliable. When there is substantial intermittent use, the parametric WTD approach becomes more sensitive to choice of parametric distribution, as it is difficult to separate the uniform distribution for incidence from a slowly declining forward recurrence density for prevalence. We investigated this issue by visually inspecting the empirical WTD, to see if there was a distinct uniform tail toward the end of the observation window and a smoothly declining section in the beginning. This was confirmed graphically. In addition, the Log-Normal distribution chosen in our analyses is highly robust in handling this issue.4
Conclusion
In conclusion, we estimated the duration of single prescriptions among users of oral glucocorticoids and described continuous treatment episodes using the parametric WTD. The choice of which percentile of the interarrival density to apply as prescription duration has an impact on the level of misclassification. Use of the 80th percentile provides a measure of drug exposure that is specific, while the 99th percentile provides a sensitive measure. In a population with intermittent users, as in oral glucocorticoid users, the higher percentiles (e.g., the 99th) are probably not a realistic estimate of prescription duration but rather a measure of time since last prescription in the group of intermittent users.
Author contributions
KL, HS, AP, JH, JOLJ, HTS, and IP made primary contributions to writing the manuscript. All authors contributed to the study conception, study design and interpretation of the results. KL performed statistical analyses. KL had full access to all the data in the study and takes responsibility for the integrity of the data and the accuracy of the data analyses. All authors contributed toward data analysis, drafting and revising the paper and agree to be accountable for all aspects of the work.
Disclosure
The authors report no conflicts of interest in this work.
References
Pottegard A, Schmidt SA, Wallach-Kildemoes H, Sorensen HT, Hallas J, Schmidt M. Data resource profile: the Danish National Prescription Registry. Int J Epidemiol. 2017;46(3):798. | ||
Nielsen LH, Lokkegaard E, Andreasen AH, Keiding N. Using prescription registries to define continuous drug use: how to fill gaps between prescriptions. Pharmacoepidemiol Drug Saf. 2008;17(4):384–388. | ||
Sinnott SJ, Polinski JM, Byrne S, Gagne JJ. Measuring drug exposure: concordance between defined daily dose and days’ supply depended on drug class. J Clin Epidemiol. 2016;69:107–113. | ||
Stovring H, Pottegard A, Hallas J. Determining prescription durations based on the parametric waiting time distribution. Pharmacoepidemiol Drug Saf. 2016;25(12):1451–1459. | ||
Bays AM, Gardner G. Pharmacologic therapies for rheumatologic and autoimmune conditions. Med Clin North Am. 2016;100(4):719–731. | ||
Laugesen K, Jorgensen JOL, Sorensen HT, Petersen I. Systemic glucocorticoid use in Denmark: a population-based prevalence study. BMJ Open. 2017;7(5):e015237. | ||
Fardet L, Petersen I, Nazareth I. Prevalence of long-term oral glucocorticoid prescriptions in the UK over the past 20 years. Rheumatology (Oxford). 2011;50(11):1982–1990. | ||
Buttgereit F, da Silva JA, Boers M, et al. Standardised nomenclature for glucocorticoid dosages and glucocorticoid treatment regimens: current questions and tentative answers in rheumatology. Ann Rheum Dis. 2002;61(8):718–722. | ||
Schmidt M, Pedersen L, Sorensen HT. The Danish Civil Registration System as a tool in epidemiology. Eur J Epidemiol. 2014;29(8):541–549. | ||
WHO Collaborating Centre for Drug Statistics Methodology. Definition and general considerations. Available from: https://www.whocc.no/ddd/definition_and_general_considera/. Accessed January 13, 2017. |
Supplementary materials
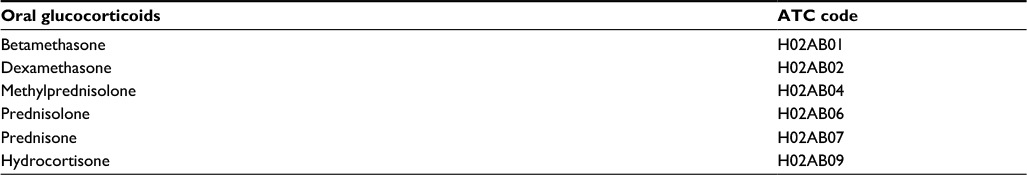 | Table S1 ATC codes for glucocorticoids Abbreviation: ATC, Anatomical Therapeutic Classification. |
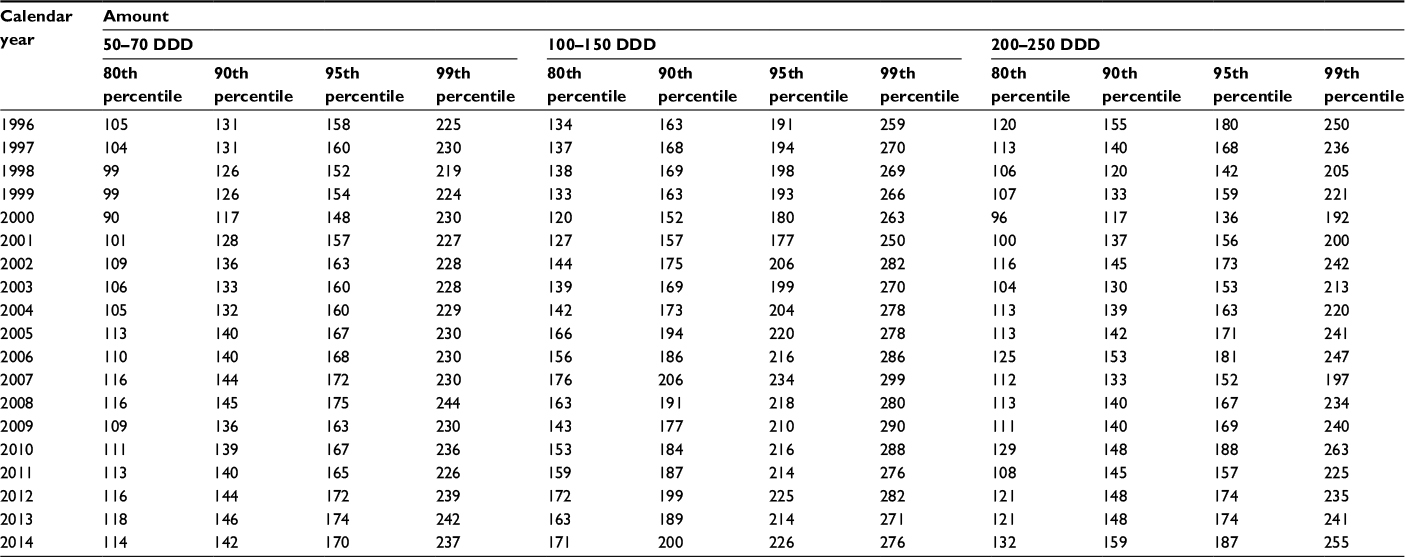 | Table S2 Estimated 80th, 90th, 95th and 99th percentiles for prescription duration (days) in users of oral glucocorticoids using the parametric waiting time distribution, stratified by amount dispensed (amount in a package × number of packages) Abbreviation: DDD, defined daily doses. |
 | Table S3 Estimated 80th, 90th, 95th, and 99th percentiles for prescription duration (days) in multiple-prescription use of oral glucocorticoids using the parametric waiting time distribution, by calendar year |
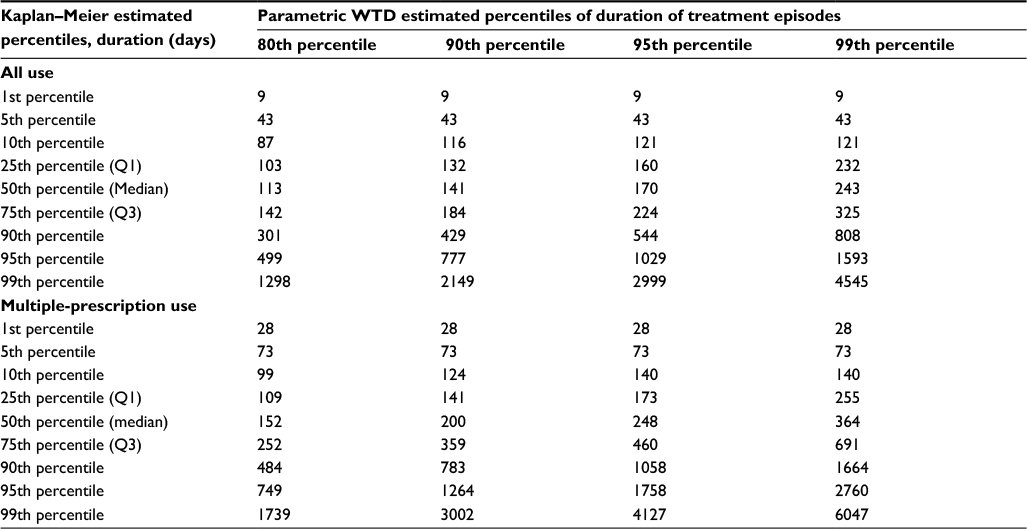 | Table S4 Duration (days) of first oral glucocorticoid continous treatment episodes among all use and multiple-prescription use estimated by the Kaplan–Meier survival function and presented as 1st, 5th, 10th, 25th, 50th, 75th, 90th, 95th and 99th percentiles Abbreviation: WTD, waiting time distribution. |
 © 2017 The Author(s). This work is published and licensed by Dove Medical Press Limited. The full terms of this license are available at https://www.dovepress.com/terms.php and incorporate the Creative Commons Attribution - Non Commercial (unported, v3.0) License.
By accessing the work you hereby accept the Terms. Non-commercial uses of the work are permitted without any further permission from Dove Medical Press Limited, provided the work is properly attributed. For permission for commercial use of this work, please see paragraphs 4.2 and 5 of our Terms.
© 2017 The Author(s). This work is published and licensed by Dove Medical Press Limited. The full terms of this license are available at https://www.dovepress.com/terms.php and incorporate the Creative Commons Attribution - Non Commercial (unported, v3.0) License.
By accessing the work you hereby accept the Terms. Non-commercial uses of the work are permitted without any further permission from Dove Medical Press Limited, provided the work is properly attributed. For permission for commercial use of this work, please see paragraphs 4.2 and 5 of our Terms.