")
Back to Journals » International Journal of Nanomedicine » Volume 12
Preparation of zein nanoparticles by using solution-enhanced dispersion with supercritical CO2 and elucidation with computational fluid dynamics
Received 21 February 2017
Accepted for publication 3 April 2017
Published 2 May 2017 Volume 2017:12 Pages 3485—3494
DOI https://doi.org/10.2147/IJN.S135239
Checked for plagiarism Yes
Review by Single anonymous peer review
Peer reviewer comments 3
Editor who approved publication: Dr Linlin Sun
Sining Li, Yaping Zhao
School of Chemistry and Chemical Engineering, Shanghai Jiao Tong University, Shanghai, China
Abstract: Nanoparticles have attracted more and more attention in the medicinal field. Zein is a biomacromolecule and can be used as a carrier for delivering active ingredients to prepare controlled release drugs. In this article, we presented the preparation of zein nanoparticles by solution-enhanced dispersion by supercritical CO2 (SEDS) approach. Scanning electron microscopy and transmission electron microscopy were applied to characterize the size and morphology of the obtained particles. The nozzle structure and the CO2 flow rate greatly affected the morphology and the size of the particles. The size of zein was able to be reduced to 50–350 nm according to the different conditions. The morphologies of the resultant zein were either sphere or the filament network consisted of nanoparticles. The influence of the nozzle structure and the CO2 flow rate on the velocity field was elucidated by using computational fluid dynamics. The nozzle structure and the CO2 flow rate greatly affected the distribution of the velocity field. However, a similar velocity field could also be obtained when the nozzle structure or the CO2 flow rate, or both were different. Therefore, the influence of the nozzle structure and the CO2 flow rate on the size and morphology of the particles, can boil down to the velocity field. The results demonstrated that the velocity field can be a potential criterion for producing nanoparticles with controllable morphology and size, which is useful to scale-up the SEDS process.
Keywords: nozzle structure, supercritical antisolvent, zein nanoparticles, computational fluid dynamics
Introduction
Nanoparticles have attracted more and more attention in the medicinal field because they are considered a significant strategy to deliver drugs including anticancer drugs, proteins, and vaccines. Several methods have been developed to prepare nanoparticles, such as lyophilization,1 spray drying,2 and supercritical fluid (SF) methods etc. Supercritical antisolvent (SAS) technology has been one of the hot spots because it has many advantages such as lower residual solvent in the final product, mild operating temperatures, and simple operational steps. For the SAS technique, the way of mixing fluids is a key step. Some modified SAS processes have been developed based on the mixing style of SF with solutions like aerosol solvent extraction systems, SAS with enhanced mass transfer, and solution-enhanced dispersion by supercritical fluids (SEDS).3–8 The key unit of the SEDS process is a special coaxial nozzle via which the SF and the liquid solution are injected into a high-pressure vessel simultaneously. In this way the SF acts both as an antisolvent and as a “spray enhancer” through hydro mechanical effects.9,10 Then, nanoparticles can be obtained because of the enhanced mixing of SF and the solution. Recently, many kinds of nanoparticles have been prepared using SEDS, including the single component particles: lactic acid polymers (l-polylactic acid [PLA], d,l-PLA), puerarin, and β-carotene;9,11,12 and multi-component composite particles: lysozyme-loaded poly(lactic-co-glycolic acid) (PLGA),13 β-carotene-loaded poly(3-hydroxybutyrate-co-3-hydroxyvalerate) (PHBV),12 and lutein/zein nanoparticles.14 The size of most of these particles is between 100–500 nm. However, as Miguel et al15 pointed out, the SEDS process was so complex that the understanding of the process was far from complete. Many factors could affect the SEDS process. Basically, we can divide these factors into two categories: thermodynamic factors and kinetic ones. Thermodynamic factors including temperature, pressure, and organic solvents affect the formation of the particle, including its size and morphology through influencing the equilibrium state phase of the system. It is generally recognized that the operational conditions should be above the critical point of the mixed solution for making desired particles.16–18 Kinetic factors include the flow rate of solution and supercritical CO2 (SC-CO2), the way of mixing the solution with SC-CO2, and the nozzle structure etc, which also affects the formation of the particle via influencing fluid flow and mass transfer. The nozzle structure plays an important role in the formation of the particles because it can determine the way of mixing the solution and SC-CO2, and exert a critical influence on the mass transfer between the two phases. However, little research on this aspect has been reported.19 Even though the effects of the flow rate on the particle formation were reported in a previous paper,20 few articles examined the influence of the velocity field on the morphology and size of the particles.
With the development of computational fluid dynamics (CFD) technology, the velocity field of mixing fluid can now be calculated by a computer. Cardoso et al reported application of the CFD method in the SAS process.21 However, to the best of our knowledge, research on the preparation of nanoparticles using SEDS combined with the CFD method is little. Zein is a kind of protein made from maize. It has been widely utilized in drug release systems because of its good biocompatibility, eg, 5-fluorouracil-loaded zein nanoparticles22 and lysozyme-loaded zein microcapsules,23 etc. It was also used as a carrier in release systems in the field of food engineering.23,24
The purpose of this research is to explore the preparation of nanoparticles by using the SEDS approach combining the CFD simulation. Zein was chosen as a model compound. A coaxial nozzle with an adjustable position of the inner tubule was used. CFD was applied to simulate the flow field of the mixing SC-CO2 and the solution.
Materials and methods
Materials
Zein was purchased from Sigma-Aldrich Co. (St Louis, MO, USA). Dichloromethane and ethanol with analytical reagent were purchased from Shanghai Lingfeng Chemical Reagent Co. Ltd, Shanghai, China. CO2 of 99.99% purity was purchased from Rui Li, Ltd., Shanghai, China.
Zein was dissolved in the mixture of ethanol and dichloromethane (volume ratio: 5:7) based on our preliminary experiments and Shukla and Cheryan’s paper,25 in which the concentration of the zein was fixed at 10 mg/mL.
SEDS apparatus and procedure
The schematic diagram of the experiment apparatus is shown in Figure 1. CO2 from the cylinder (Figure 1A) is condensed by a refrigerator and pumped into the precipitating vessel (Figure 1G) by the piston pump (Figure 1C) via the heat exchanger (Figure 1D). CO2 then goes into the dual decompression vessel (Figure 1H) from the precipitating vessel. The flow rate of CO2 is measured by a gas flow meter (Figure 1L). After the pressure and temperature reach the desired values, the liquid solution is injected though the inner tubule of the coaxial nozzle (Figure 1I, Φinner =100 μm, Φouter =1,000 μm, and the total orifice diameter is 1,000 μm) and mixed at the definite position of the nozzle with SC-CO2 which flows through the outer tubule of the coaxial nozzle simultaneously. The flow rate of the liquid solution is adjusted by an high performance liquid chromatography (HPLC) pump (Figure 1E) and the flow rate of the CO2 is adjusted by the piston pump (Figure 1C). After adding the solution is completed, SC-CO2 continues to be pumped into the vessel (Figure 1G) to remove the solvent residue of the samples for 30 minutes. The solvent is separated from CO2 in the decompression vessel at lower pressure (Figure 1H).
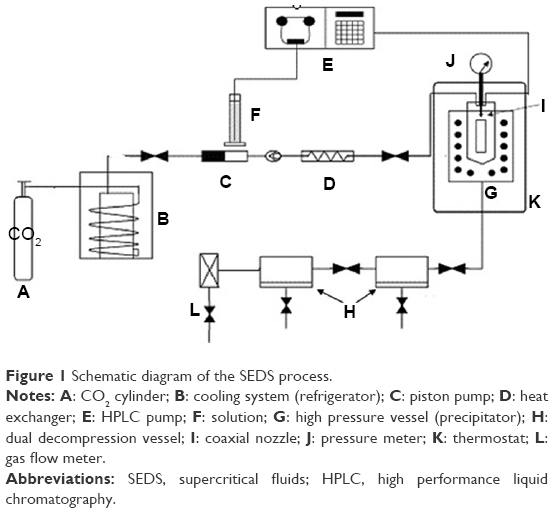 | Figure 1 Schematic diagram of the SEDS process. |
Adjustable coaxial nozzle
The adjustable coaxial nozzle was designed and fabricated at our lab. As shown in Figure 2, the relative position of the inner tubule (Figure 2A) and the outer tubule (Figure 2C) can be adjusted by regulating the device (Figure 2B). The coaxial nozzle can easily be switched from the convex type with the inner tubule protruding a desired value (Figure 2E) to a horizontal type (Figure 2F). The adjustment range of the inner tube is ±1.5 mm while taking the outlet of the outer tube as a baseline.
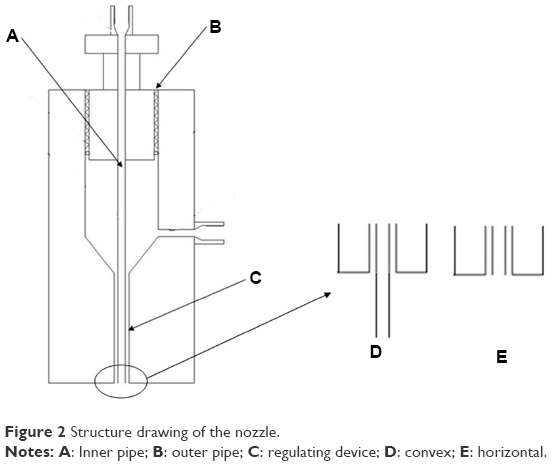 | Figure 2 Structure drawing of the nozzle. |
Characterization
The samples were characterized by scanning electron microscopy (SEM, JEM-7401F; JEOL, Tokyo, Japan), transmission electron microscopy (TEM, JEM2010F; JEOL) and X-ray diffraction respectively (XRD, D8 ADVANCE; Bruker Corporation, Billerica, MA, USA), respectively. Sample preparations were different for each characterization method. For SEM, a small amount of specimen was placed on one surface of a double-faced adhesive tape that stuck to the sample support and coated with gold under vacuum condition for about 20 s to enhance the electrical conductivity. For TEM, the sample was dispersed in anhydrous ethanol and then loaded in the copper web; for XRD, the samples were measured in 2θ angle range between 10° and 80°. The step scan mode was performed at a rate of 5°/min.
The particle size was obtained from the images of samples characterized by SEM and TEM. The 100 particles were selected from each relevant image randomly, and their size was measured. The standard deviation δ was calculated according to the following equation:
|
where N is the number of particles, xi is the feature size of each particle, and xm is the mean size diameter.
CFD simulation
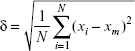
CFD calculations were performed using umoni 2.0 software (Nanjing Tongliu Software Co., Ltd., Najing, China). We assumed all fluids were incompressible at the given conditions to simplify calculation. SC-CO2 and the solvent used were defined as the SCF phase and the liquid phase, respectively, in the mixing system. The geometric model was based on the apparatus which had axial symmetry three-dimensional space. We established a two-dimensional graphic of the axis section, as shown in Figure 3. The calculation domain contained the nozzle end (Figure 3A) and the high-pressure vessel (Figure 3B). Details of the coaxial nozzle were expressed as the inner pipe (Figure 3C) and the outer pipe (Figure 3D). A freestyle mesh dissection was utilized for the generation of the grid. It can be expected that the flow rate of the fluids will change extensively at the nozzle’s exit as it comes out of the nozzle, due to the complex geometric boundary. So, we used adaptive grids in the region of the nozzle exit, as demonstrated in Figure 4.
 | Figure 3 Geometric model. |
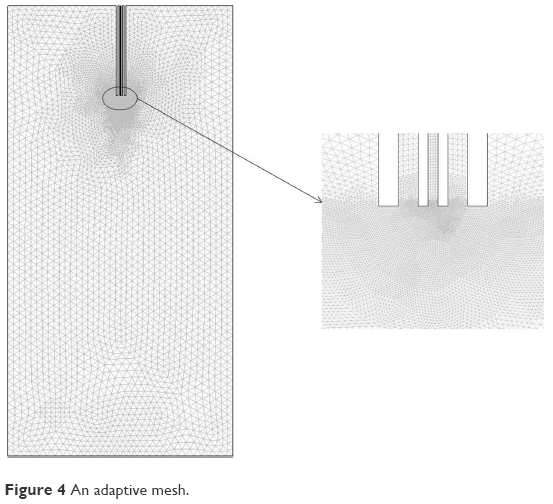 | Figure 4 An adaptive mesh. |
Results and discussion
In order to conveniently explore the impact of the nozzle structures and SC-CO2 flow rate on the formation of zein nanoparticles in the SEDS process, and to carry out the CFD investigation of its flow field, some operational parameters were fixed in the experiments according to the preliminary experiment results. The temperature and pressure were set at 45°C and 10 MPa, respectively, which were beyond the critical point of the mixed solution of SC-CO2 and solvent. The volume ratio of ethanol and dichloromethane of the mixed solvent was 5:7.25 The concentration of the zein solution was fixed at 10 mg/mL. The flow rate of feeding solution was set at 1 mL/min. The adjustable variables were the nozzle structure and SC-CO2 flow rate. The experimental conditions and results are listed in Table 1. The morphology and the size of the particles were obtained by analyzing the SEM and TEM images as shown in Figure S1, corresponding to the relevant experiment numbers in Table 1.
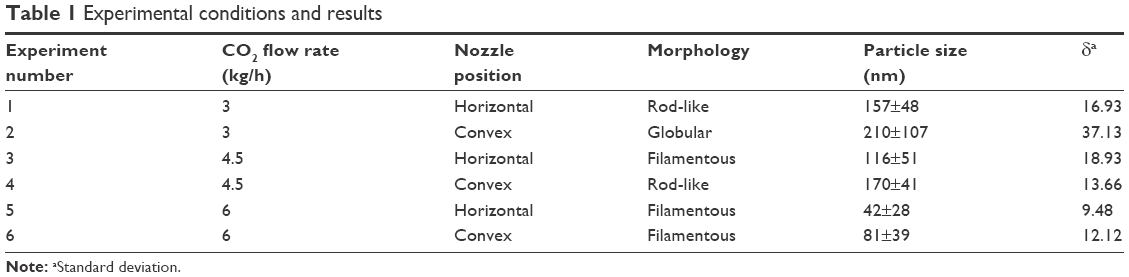 | Table 1 Experimental conditions and results |
Effect of nozzle structure and velocity field analysis
Two types of nozzle structures (horizontal and convex) were studied in this paper. As shown in the first four experiments of Table 1, the size and size distribution of particles obtained in the horizontal structure of the nozzle are generally smaller and narrower than that obtained in the convex structure for the same CO2 flow rate. The morphology of particles formed in the horizontal structure is rod-like and filamentous, while globular and rod-like particles formed in the convex structure under the same parallel conditions. But the size of particles in the horizontal structure is smaller than that in the convex structure, despite their filamentous morphology, as shown in experiments 5 and 6 of Table 1. The SEM and TEM images of the sample of experiment 6 in Table 1, as shown in Figure 5, display the particles’ filamentary structure, consisting of nano-spheres. Figure 6 depicts the SEM and TEM images of experiment 2 in Table 1. We can see that the particles’ globularity.
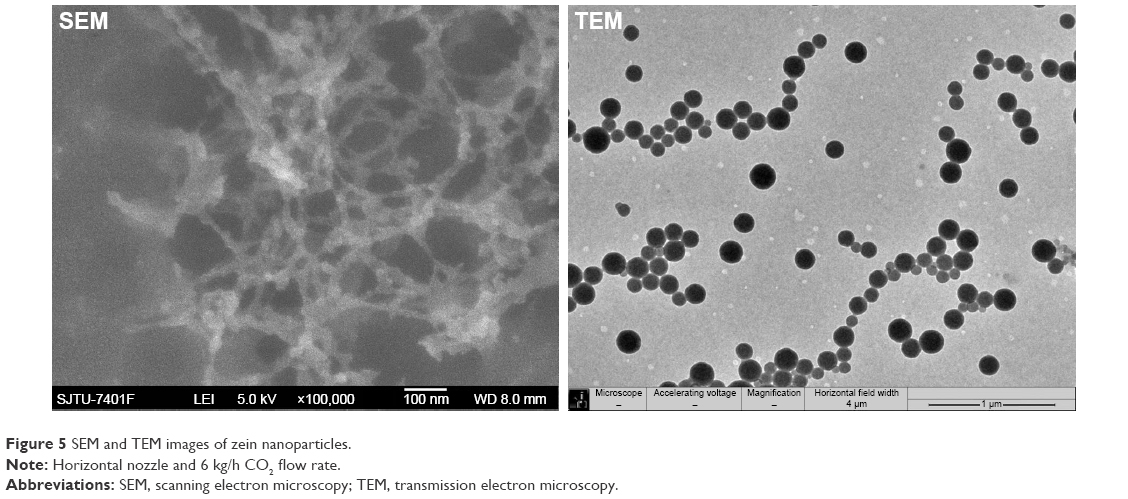 | Figure 5 SEM and TEM images of zein nanoparticles. |
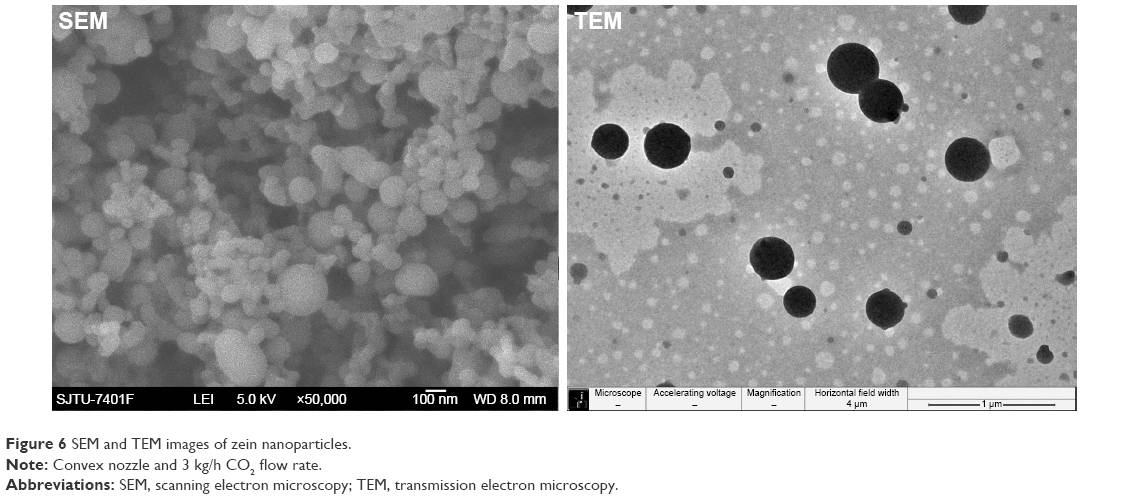 | Figure 6 SEM and TEM images of zein nanoparticles. |
We analyzed the XRD patterns of the raw and processed zein samples. As shown in Figure 7, the characteristic diffraction peak of zein appears at about 20°. After processing, the peak position moved to a higher angle 22°, meanwhile the intensity decreased. This is consistent with other researchers’ conclusion14,23 that the degree of crystallinity is reduced through the SAS process. The XRD spectra shown in Figure 7 also clearly indicate that the zein protein has an amorphous nature.26 Also, when the flow rate of CO2 is higher and the horizontal nozzle is used, the degree of crystallinity is reduced further.
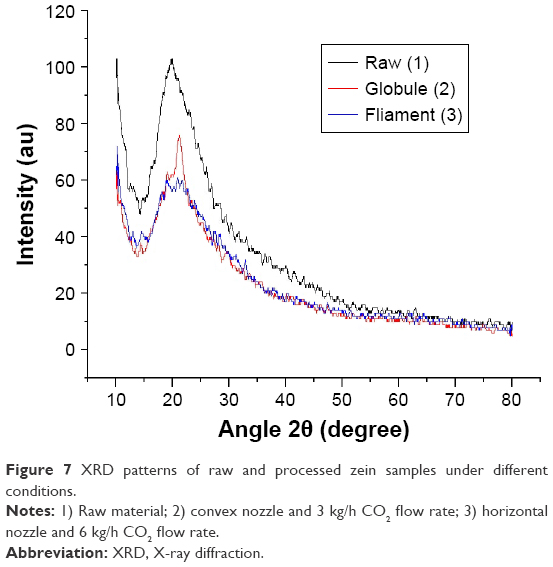 | Figure 7 XRD patterns of raw and processed zein samples under different conditions. |
We can explain the results mentioned above from the aspect of the flow field. A CFD model was established for analyzing the velocity fields of the experiments. The calculation method of the steady state provided by the software, was utilized to simulate the results of experiments 1–6 shown in Table 1, respectively. The simulated velocity fields of experiments 3 and 4 are presented in Figures 8 and 9, respectively. We can see that the instantaneous velocity changed rapidly near underneath the nozzle outlet for both the horizontal and convex nozzles. The maximum velocity occurred at the area close to the jet in which the two mixing phases were taking place. But, in the region just a small distance from the nozzle, the velocity decreased fast. The mean velocity was small in other regions of the vessel, especially the spaces above the nozzle and/or far from it. The particles are formed immediately when two fluids are mixed according to the principle of SEDS. This process depends on the formation of droplets27 which are determined by the mixture of two phases.28,29 The velocity field can indicate the mixing situation of two fluids, thus explaining the formation of particles. If comparing Figure 8 with Figure 9, we find that the velocity (8–10 m/s) close to the inner tubule in Figure 8 is much faster than that (3–4 m/s) in Figure 9, which can be seen clearly from the scale. It means that different nozzle structures can cause significant changes in the velocity field of the region close to the nozzle. It affects the formation of droplets, thereby influencing the formation of particles. So, the difference in size and morphology of the zein particles made by the convex and horizontal types might be ascribed to the difference in their velocity fields.
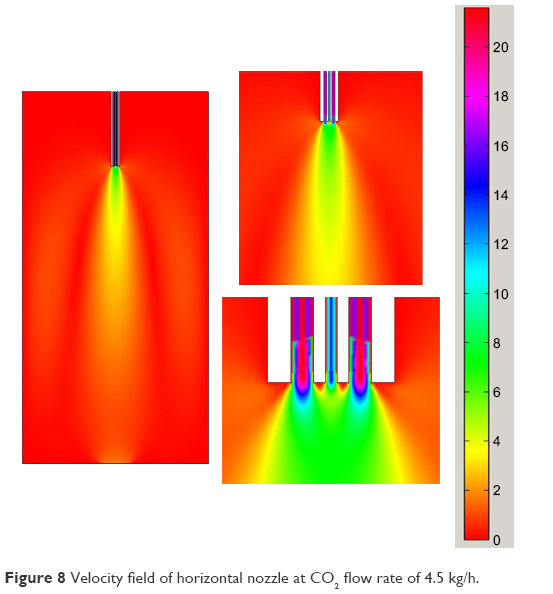 | Figure 8 Velocity field of horizontal nozzle at CO2 flow rate of 4.5 kg/h. |
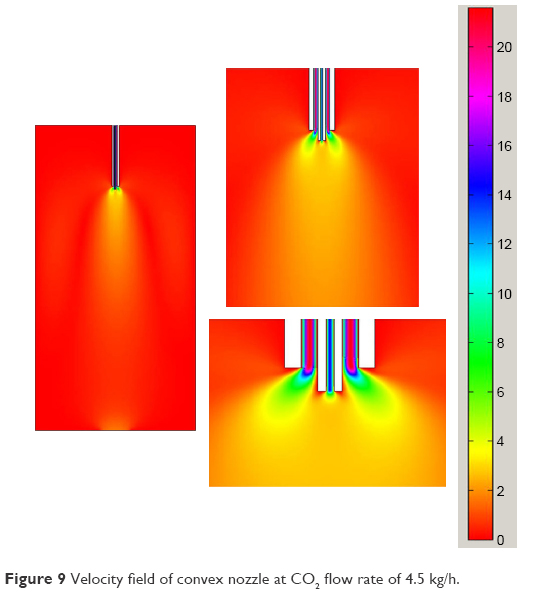 | Figure 9 Velocity field of convex nozzle at CO2 flow rate of 4.5 kg/h. |
Effect of SC-CO2 flow rate and velocity field analysis
The influence of the flow rate of CO2 on the size and morphology of zein particles is great, regardless of whether the nozzle structure is horizontal or convex. We can see from experiments 1, 3, and 5 in Table 1, that the size of the particles was reduced to less than 50 nm from the maximum of 200 nm when the flow rate of CO2 increased from 3 kg/h to 6 kg/h for the horizontal nozzle. The morphology changed from rod-like to a filamentous shape. For the convex nozzle, the size of the particles was reduced to around 100 nm from the maximum of 350 nm when the flow rate of CO2 increased from 3 kg/h to 6 kg/h as shown in experiments 2, 4, and 6. The morphology changed from spherical to rod-like, and finally to the filamentous shape as shown in the Supplementary materials.
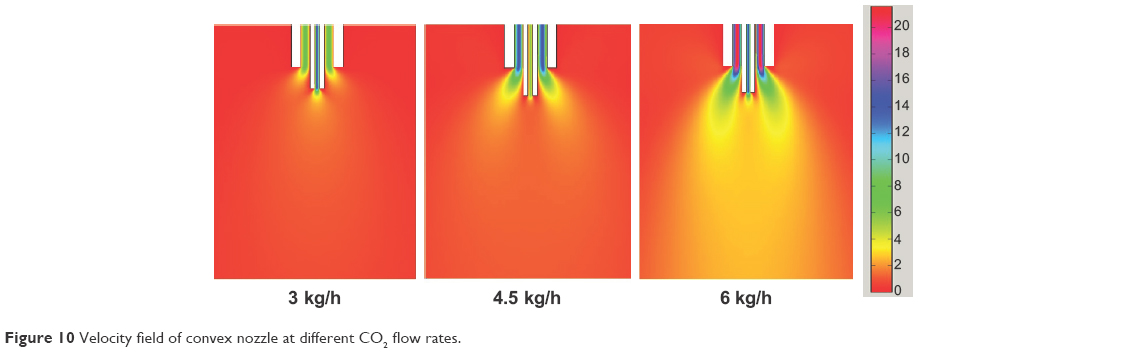
We applied a CFD model to illustrate the phenomena occurring in the convex nozzle mentioned previously, via analyzing the velocity fields of the mixing fluids under different conditions. The simulation velocity distribution in the region close to the nozzle is shown in Figure 10. It can clearly be seen that the CO2 flow rate has a considerable influence on the velocity field of the mixing area where the two-phase flow is mixed. The speed gradient in the region approximately 1–5 mm underneath the nozzle greatly increases with an increase of the flow rate of CO2. It suggests that a greater shear force could be generated, resulting in smaller droplets. In other words, increasing the flow rate of CO2 could generate smaller droplets, thus, resulting in smaller particles.27,28 In a similar way, the morphological change of the particles can be explained by the alteration of the droplet shape, made by the shear force. The shear force greatly affects the droplet shape of the fluid.30,31 When the shear force is small, the droplet shape could be regular; but when the shear force is greater, the droplet shape becomes irregular. Therefore, the relative flow rate of the two-phase flow can influence the particle morphology via affecting the droplet shape.
 | Figure 10 Velocity field of convex nozzle at different CO2 flow rates. |
The CO2 flow rate greatly affects the morphology of the particles. When the CO2 flow rate is low, relatively large single droplets are inclined to be formed, while the small pearl necklace droplets (small droplets linked together) would be formed when the CO2 flow rate is high.32 According to the principle that droplet size determines particle size,33 the relatively large droplets generate globules, while the small linked droplets result in small particles which are closely linked together. Small zein particles are easily merged with each other to form a filamentous structure.34 Therefore, the globules and filaments were generated at different CO2 flow rates.
Velocity field distribution as a criterion of forming nanoparticles
In the previous two sections we discussed the influence of the velocity field of the fluid, analyzed via CFD, on the zein nanoparticles. In a similar way, we can obtain similar results in terms of the size and morphology of the particles, provided the velocity field of the fluid is similar, regardless of a different nozzle structure or CO2 flow rate, or both. As shown in experiments 1 and 4 in Table 1, the obtained samples have the same morphology and size, even though the nozzle structure and CO2 flow rates were completely different. We can use the velocity field analysis to explain it. Figure 11 exhibits the velocity field distribution obtained at the conditions listed in experiments 1 and 4 of Table 1. It can be seen that the velocity field is the same although their operational conditions are different. This means the same velocity field can be obtained by the combination of different flow rates and nozzle structures. This leads us to conclude that the influence of the CO2 flow rate and the nozzle structure determine the velocity field. This suggests that it is not necessary to do more experiments to explore the influence of the operational conditions on the size and morphology of the particles. We can predict the expected results by simulating the velocity field at different conditions via CFD. Therefore, the velocity field distribution obtained via CFD can be a criterion of preparation of nanoparticles using SEDS. This is also useful in scaling-up the SEDS process.
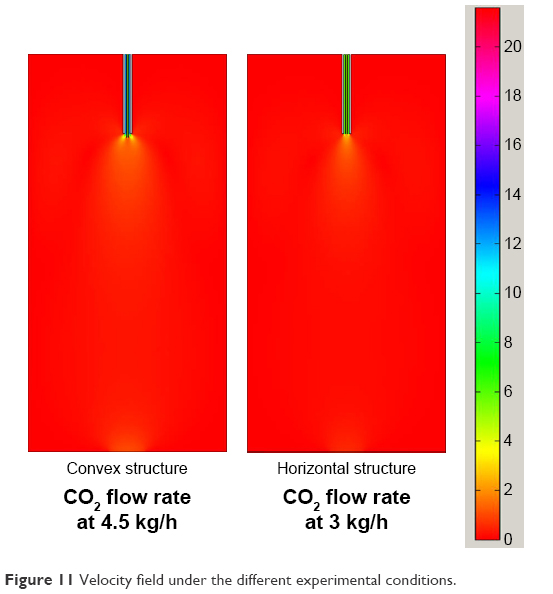 | Figure 11 Velocity field under the different experimental conditions. |
Furthermore, it can also be seen in Figure 11, that the maximum relative speed difference appeared just under the nozzle, whereas fluids were almost motionless in the rest of the vessel. It infers that nanoparticles could be formed only in a small region under the jet.27,29
Conclusion
Zein nanoparticles, with the smallest size of 50 nm and varied morphology, were successfully prepared via the SEDS process. The nozzle structure and the SC-CO2 flow rate impacted the morphology and size of the particles. CFD can be applied to elucidate the influence of the nozzle structure and CO2 flow rate on the velocity field. CFD simulation suggests that a similar velocity field could be obtained when the nozzle structure or CO2 flow rate, or both are different. The velocity field distribution determines the size and morphology of zein particles, which can be a criterion of the SEDS process of forming nanoparticles.
Acknowledgments
This research was supported by the National Natural Science Foundation of China (20976103). We are thankful to the Instrumental Analysis Center of Shanghai Jiao Tong University for assistance with TEM.
Disclosure
The authors report no conflicts of interest in this work.
References
Li F, Wang T, He HB, Tang X. The properties of bufadienolides-loaded nano-emulsion and submicro-emulsion during lyophilization. Int J Pharm. 2008;349(1–2):291–299. | ||
Lee SH, Heng D, Ng WK, Chan HK, Tan RB. Nano spray drying: a novel method for preparing protein nanoparticles for protein therapy. Int J Pharm. 2011;403(1–2):192–200. | ||
De Marco I, Reverchon E. Supercritical antisolvent micronization of cyclodextrins. Powder Technol. 2008;183(2):239–246. | ||
Reverchon E, Adami R, Cardea S, Della Porta G. Supercritical fluids processing of polymers for pharmaceutical and medical applications. J Supercrit Fluids. 2009;47(3):484–492. | ||
Reverchon E, De Marco I, Torino E. Nanoparticles production by supercritical antisolvent precipitation: a general interpretation. J Supercrit Fluids. 2007;43(1):126–138. | ||
Reverchon E, Della Porta G, De Rosa I, Subra P, Letourneur D. Supercritical antisolvent micronization of some biopolymers. J Supercrit Fluids. 2000;18(3):239–245. | ||
Yeo SD, Kiran E. Formation of polymer particles with supercritical fluids: a review. J Supercrit Fluids. 2005;34(3):287–308. | ||
Rantakylä M. Particle production by supercritical antisolvent processing techniques. Finland: Aalto University; 2004. | ||
Chen AZ, Li Y, Chau FT, et al. Application of organic nonsolvent in the process of solution-enhanced dispersion by supercritical CO2 to prepare puerarin fine particles. J Supercrit Fluids. 2009;49(3):394–402. | ||
Kang Y, Yin G, Quyang P, et al. Preparation of PLLA/PLGA microparticles using solution enhanced dispersion by supercritical fluids (SEDS). J Colloid Interface Sci. 2008;322(1):87–94. | ||
Debenedetti PG, Tom JW, San-Do Y, Gio-Bin L. Application of supercritical fluids for the production of sustained delivery devices. J Control Release. 1993;24(1–3):27–44. | ||
Franceschi E, De Cesaro AM, Feiten M, et al. Precipitation of beta-carotene and PHBV and co-precipitation from SEDS technique using supercritical CO2. J Supercrit Fluids. 2008;47(2):259–269. | ||
Kluge J, Fusaro F, Casas N, Mazzotti M, Muhrer G. Production of PLGA micro- and nanocomposites by supercritical fluid extraction of emulsions: I. Encapsulation of lysozyme. J Supercrit Fluids. 2009;50(3):327–335. | ||
Hu D, Lin C, Liu L, Li S, Zhao Y. Preparation, characterization, and in vitro release investigation of lutein/zein nanoparticles via solution enhanced dispersion by supercritical fluids. J Food Eng. 2012;109(3):545–552. | ||
Miguel F, Martin A, Gamse T, Cocero MJ. Supercritical anti solvent precipitation of lycopene: Effect of the operating parameters. J Supercrit Fluids. 2006;36(3):225–235. | ||
Lesoin L, Crampon C, Boutin O, Badens E. Preparation of liposomes using the supercritical anti-solvent (SAS) process and comparison with a conventional method. J Supercrit Fluids. 2011;57(2):162–174. | ||
Subra P, Berroy P, Vega A, Domingo C. Process performances and characteristics of powders produced using supercritical CO2 as solvent and antisolvent. Powder Technology. 2004;142(1):12–22. | ||
Weber A, Yelash LV, Kraska T. Effect of the phase behaviour of the solvent-antisolvent systems on the gas-antisolvent-crystallisation of paracetamol. J Supercrit Fluids. 2005;33(2):107–113. | ||
Bouchard A, Jovanovic N, de Boer AH, et al. Effect of the spraying conditions and nozzle design on the shape and size distribution of particles obtained with supercritical fluid drying. Eur J Pharm Biopharm. 2008;70(1):389–401. | ||
Zhao XH, Zu Y, Li Q, et al. Preparation and characterization of camptothecin powder micronized by a supercritical antisolvent (SAS) process. J Supercrit Fluids. 2010;51(3):412–419. | ||
Tavares Cardoso MA, Cabral JM, Palavra AM, Geraldes V. CFD analysis of supercritical antisolvent (SAS) micronization of minocycline hydrochloride. J Supercrit Fluids. 2008;47(2):247–258. | ||
Lai LF, Guo HX. Preparation of new 5-fluorouracil-loaded zein nanoparticles for liver targeting. Int J Pharm. 2011;404(1–2):317–323. | ||
Zhong QX, Jin MF, Davidson PM, Zivanovic S. Sustained release of lysozyme from zein microcapsules produced by a supercritical anti-solvent process. Food Chem. 2009;115(2):697–700. | ||
Zhong QX, Jin MF. Zein nanoparticles produced by liquid–liquid dispersion. Food Hydrocolloids. 2009;23(8):2380–2387. | ||
Shukla R, Cheryan M. Zein: the industrial protein from corn. Ind Crops Prod. 2001;13(3):171–192. | ||
Luo Y, Wang TT, Teng Z, Chen P, Sun J, Wang Q. Encapsulation of indole-3-carbinol and 3,3′-diindolylmethane in zein/carboxymethyl chitosan nanoparticles with controlled release property and improved stability. Food Chem. 2013;139(1–4):224–230. | ||
Vehring R, Foss WR, Lechuga-Ballesteros D. Particle formation in spray drying. J Aerosol Sci. 2007;38(7):728–746. | ||
Tice JD, Song H, Lyon AD, Ismagilov RF. Formation of droplets and mixing in multiphase microfluidics at low values of the Reynolds and the capillary numbers. Langmuir. 2003;19(22):9127–9133. | ||
Garstecki P, Fuerstman MJ, Stone HA, Whitesides GM. Formation of droplets and bubbles in a microfluidic T-junction-scaling and mechanism of break-up. Lab Chip. 2006;6(3):437–446. | ||
Lee LY, Lim LK, Hua JS, Wang CH. Jet breakup and droplet formation in near-critical regime of carbon dioxide–dichloromethane system. Chem Eng Sci. 2008;63(13):3366–3378. | ||
Wong DC, Simmons MJ, Decent SP, Parau EI, King AC. Break-up dynamics and drop size distributions created from spiralling liquid jets. Int J Multiphase Flow. 2004;30(5):499–520. | ||
Thorsen T, Roberts RW, Arnold FH, Quake SR. Dynamic Pattern formation in a vesicle-generating microfluidic device. Phys Rev Lett. 2001;86(18):4163–4166. | ||
Elversson J, Millqvist-Fureby A, Alderborn G, Elofsson U. Droplet and particle size relationship and shell thickness of inhalable lactose particles during spray drying. J Pharm Sci. 2003;92(4):900–910. | ||
Guo Y, Liu Z, An H, Li M, Hu J. Nano-structure and properties of maize zein studied by atomic force microscopy. J Cereal Sci. 2005;41(3):277–281. |
Supplementary materials
Scanning electron microscopy (SEM) and transmission electron microscopy (TEM) have been used as a way to determine the size of a particle and the size distribution.1 Therefore, we used SEM and TEM images to calculate the size of particles because they can display the morphology of the particles, regardless of the shape of the particles. These data were obtained mainly from the SEM and TEM images. We measured the size of the 100 particles selected randomly from each image, and obtained the results of the statistical distribution of the particles prepared under different conditions. The morphology and particle size of each experiment was obtained from either SEM or TEM images, as shown in Figure S1.
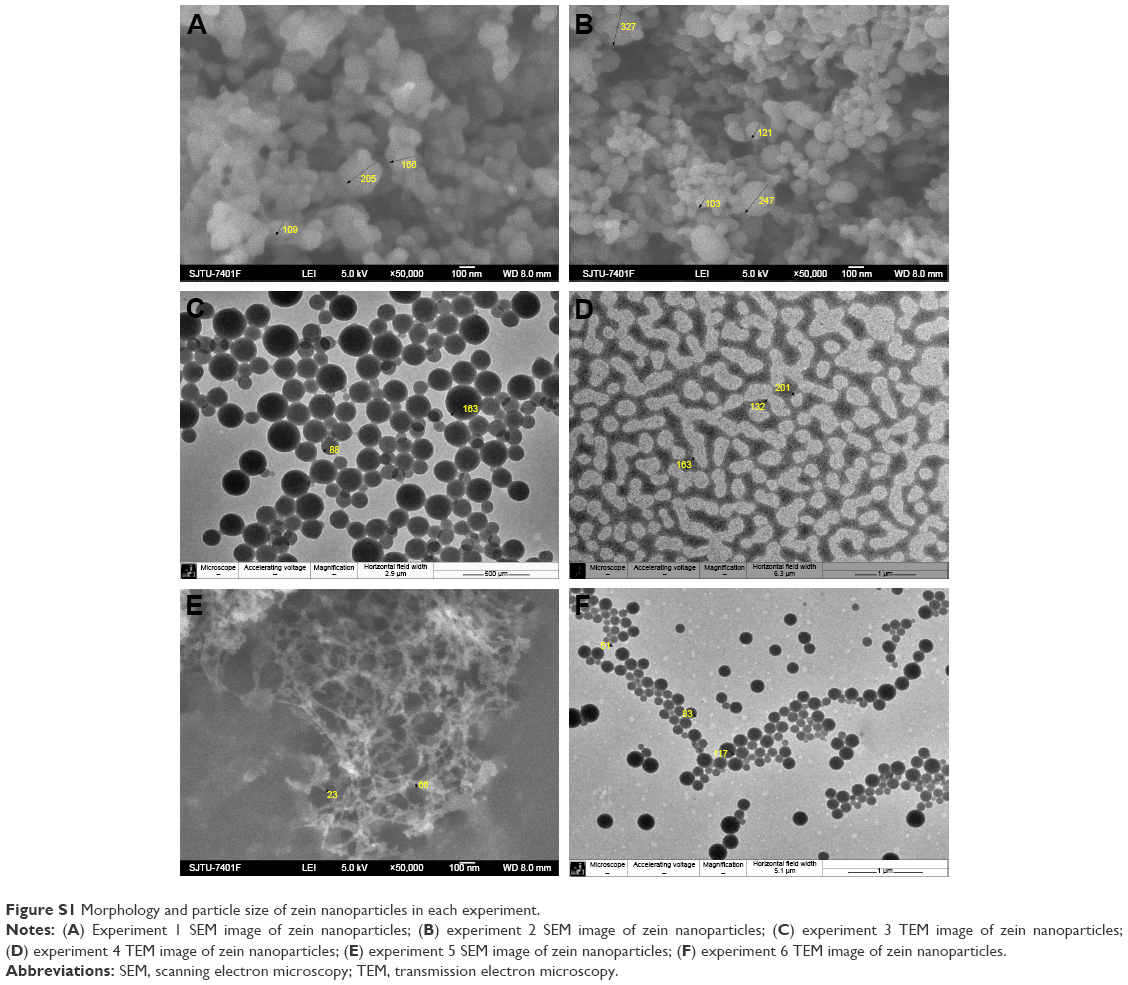 | Figure S1 Morphology and particle size of zein nanoparticles in each experiment. |
Reference
Jin HY, Hemingway M, Gupta RB, Xia F, Zhao Y. Preparation of thalidomide nano-flakes by supercritical antisolvent with enhanced mass transfer. Particuology. 2012;10(1):17–23. |
 © 2017 The Author(s). This work is published and licensed by Dove Medical Press Limited. The full terms of this license are available at https://www.dovepress.com/terms.php and incorporate the Creative Commons Attribution - Non Commercial (unported, v3.0) License.
By accessing the work you hereby accept the Terms. Non-commercial uses of the work are permitted without any further permission from Dove Medical Press Limited, provided the work is properly attributed. For permission for commercial use of this work, please see paragraphs 4.2 and 5 of our Terms.
© 2017 The Author(s). This work is published and licensed by Dove Medical Press Limited. The full terms of this license are available at https://www.dovepress.com/terms.php and incorporate the Creative Commons Attribution - Non Commercial (unported, v3.0) License.
By accessing the work you hereby accept the Terms. Non-commercial uses of the work are permitted without any further permission from Dove Medical Press Limited, provided the work is properly attributed. For permission for commercial use of this work, please see paragraphs 4.2 and 5 of our Terms.