")
Back to Journals » International Journal of Nanomedicine » Volume 12
Preparation of coffee oil-algae oil-based nanoemulsions and the study of their inhibition effect on UVA-induced skin damage in mice and melanoma cell growth
Authors Yang CC, Hung CF, Chen BH
Received 23 June 2017
Accepted for publication 2 August 2017
Published 5 September 2017 Volume 2017:12 Pages 6559—6580
DOI https://doi.org/10.2147/IJN.S144705
Checked for plagiarism Yes
Review by Single anonymous peer review
Peer reviewer comments 3
Editor who approved publication: Prof. Dr. Dongwoo Khang
Chu-Ching Yang,1,* Chi-Feng Hung,2,* Bing-Huei Chen1
1Department of Food Science, 2School of Medicine, Fu Jen Catholic University, Taipei, Taiwan
*These authors contributed equally to this work
Abstract: Coffee grounds, a waste by-product generated after making coffee, contains approximately 15% coffee oil which can be used as a raw material in cosmetics. Algae oil rich in docosahexaenoic acid (DHA) has been demonstrated to possess anticancer and anti-inflammation functions. The objectives of this study were to develop a gas chromatography-mass spectrometry (GC-MS) method for the determination of fatty acids in coffee oil and algae oil and prepare a nanoemulsion for studying its inhibition effect on ultraviolet A-induced skin damage in mice and growth of melanoma cells B16-F10. A total of 8 and 5 fatty acids were separated and quantified in coffee oil and algae oil by GC-MS, respectively, with linoleic acid (39.8%) dominating in the former and DHA (33.9%) in the latter. A nanoemulsion with a particle size of 30 nm, zeta potential -72.72 mV, and DHA encapsulation efficiency 100% was prepared by using coffee oil, algae oil, surfactant (20% Span 80 and 80% Tween 80), and deionized water. Differential scanning calorimetry (DSC) analysis revealed a high stability of nanoemulsion when heated up to 110°C at a pH 6, whereas no significant changes in particle size distribution and pH occurred over a 90-day storage period at 4°C. Animal experiments showed that a dose of 0.1% coffee oil-algae oil nanoemulsion was effective in mitigating trans-epidermal water loss, skin erythema, melanin formation, and subcutaneous blood flow. Cytotoxicity test implied effective inhibition of melanoma cell growth by nanoemulsion with an IC50 value of 26.5 µg/mL and the cell cycle arrested at G2/M phase. A dose-dependent upregulation of p53, p21, cyclin B, and cyclin A expressions and downregulation of CDK1 and CDK2 occurred. Also, both Bax and cytochrome c expressions were upregulated and bcl-2 expression downregulated, accompanied by a rise in caspase-3, caspase-8, and caspase-9 activities for apoptosis execution. Collectively, the apoptosis pathway of melanoma cells B16-F10 may involve both mitochondria and death receptor.
Keywords: coffee ground, coffee oil-algae oil nanoemulsion, DHA, melanoma cell apoptosis, mouse skin protection, GC-MS
Introduction
Coffee, one of the most popular drinks in the world due to its characteristic taste and rich flavor, is a vital agricultural crop and mainly produced in countries such as Brazil, Columbia, and Vietnam.1 According to a statistical report published in 2010, the total production yield of coffee reached 8,017,860 tons around the world.2 However, while making coffee from the coffee bean, a large amount of coffee waste or spent coffee grounds are produced, which pose a major threat to environmental protection if not further utilized. As coffee grounds contain approximately 15% oil, further utilization of coffee oil as a raw material to produce biodiesel through interesterification or defatted grounds to generate coffee biochar through slow pyrolysis has been well documented.3
Accordingly, coffee oil is mainly composed of triacylglycerol (75%) and a small amount of free fatty acid, wax, and unsaponifiable matters, including sterols, tocopherols, phosphatides, diterpenes, and ceramides.4 However, a high level (13.54%) of unsaponifiable matters was present in the species Coffea arabica, while a low level (0.36%) in C. kapakata.5 Furthermore, fatty acid composition in coffee oil obtained from green coffee bean was similar to that after baking, with the dominant fatty acids being linoleic acids (39.36%–47.80%) and palmitic acid (29.44%–35.55%).6 In addition to fatty acids, coffee grounds also contain diterpenes cafestol and kahweol, both of which have been shown to ameliorate CCl4-induced liver damage in mice through the inhibition of liver metabolic enzyme CYPZE1 activity and free radical formation.7
According to literature reports, coffee oil could also be used as raw materials for the production of cosmetics as both linoleic acid and palmitic acid were effective in mitigating skin inflammation and skin aging.4 For instance, Velazquez Pereda et al8 reported that following treatment with green coffee oil (3.12–25.0 mg/mL), both human derma fibroblast cell CC-2511 and human skin keratin cell HaCaT could induce the formation of collagen, elastin, and glycosaminoglycans by 1.8-, 1.5-, and 2-fold, respectively. In another study dealing with the preparation of emulsion with coffee oil as raw materials, Wagemaker et al9 illustrated that coffee oil was efficient in treating skin damage caused by ultraviolet B (UVB; 280–320 nm) radiation, with the sun protection factor (SPF) being 1.5. Moreover, following the emulsion smearing onto human skin, both the trans-epidermal water loss (TEWL) and erythema index showed a declined trend, demonstrating the light protective effect of coffee oil.9 Nevertheless, the inhibition effect of coffee oil on growth of melanoma cells and light protection on mouse skin remain unexplored.
In addition to linoleic acid and palmitic acid, the polyunsaturated fatty acids like docosahexaenoic acid (DHA) is also a vital fatty acid reported to possess many biological activities including anticancer, anti-inflammation, antibacteria, antidiabetes, and anticardiovascular disease.10–12 DHA, a kind of ω−3 fatty acids, is present in abundant amount in both fish oil and algae oil. However, there is a lack of data regarding the inhibition effect of algae oil on melanoma cells as well as protection effect on UV-induced skin damage in mice.
In recent years, the application of nanotechnology in cosmetics and pharmaceutical industry has become a promising field to develop amid its capability in enhancing aqueous solubility of lipophilic functional components, encapsulating unstable bioactive compounds, and elevating skin penetration and absorption of bioactive compounds.13 Among the various nanotechniques, the development of microemulsion or nanoemulsion is quite popular because of its ease in preparation. Accordingly, both microemulsion and nanoemulsion are composed of two immiscible phases, water and oil, and a surfactant in an appropriate proportion. Sometimes the cosurfactant or cosolvent can be added to minimize the surfactant dosage and lower surface tension of droplets.14 Comparatively, microemulsion is thermodynamically more stable than nanoemulsion, though both possess the same transparent or semi-transparent appearance, with the size of the former being ranged from 2 to 100 nm and the latter from 10 to 100 nm.14
For the selection of surfactants, the nonionic type like Tween 80 has been shown to be safer than the ionic type like sodium acetate. Furthermore, the hydrophilic–lipophilic balance (HLB) value is an important index for surfactant classification, that is, the water-in-oil (W/O) emulsion can be more readily formed with HLB <10, whereas the oil-in-water (O/W) emulsion can be formed with HLB >10.14 However, no information is available as to the preparation of microemulsion or nanoemulsion with coffee oil or algae oil as raw materials and its application in cosmetics and pharmaceutical fields.
The objectives of this study were to develop a nanoemulsion with both coffee oil and algae oil as raw materials and study its protective effect against UVA-induced skin damage in mice as well as antiproliferative effect and mechanism on melanoma cells B16-F10. In addition, the fatty acid composition in both coffee oil and algae oil was analyzed by gas chromatography-mass spectrometry (GC-MS).
Materials and methods
Materials
Coffee grounds were obtained from Sin-Tex Co. (Taipei, Taiwan), while algae oil (Lonza DHA CL) was from Da-Chang-Hua-Chia Co. (Taipei, Taiwan), and both were stored at 4°C prior to use.
Fatty acid methyl ester standards including decanoic acid methyl ester (C10:0), myristic acid methyl ester (C14:0), palmitic acid methyl ester (C16:0), stearic acid methyl ester (C18:0), oleic acid methyl ester (C18:1), linoleic acid methyl ester (C18:2), linolenic acid methyl ester (C18:3), arachidic acid methyl ester (C20:0), gadoleic acid methyl ester (C20:1), behenic acid methyl ester (C22:0), docosapentaenoic acid (DPA) methyl ester (22:5n6), and DHA methyl ester (22:6n3) were purchased from NU-Check-Prep Inc. (Elysian, MN, USA), with all the purities being 99%. Solvents including methanol, ethanol, hexane, hydrochloric acid, and dimethyl sulfoxide (DMSO) were from Merck Co. (Darmstadt, Germany). Deionized water was obtained from EMD Millipore (Billerica, MA, USA) by a Milli-Q water purification system. The derivatization agent BF3-CH3OH (13%–15%, w/v) was from Riedel-de Haën Co. (Seelze, Germany). Potassium hydroxide (KOH), anhydrous sodium sulfate, and sodium chloride were also from Riedel-de Haën Co. Surfactants such as Tween 80, Span 80, and Tween 20 were from Yi-Ba Enterprise Co. (Taipei, Taiwan). Test strips used to assess oil quality were from Advantec Co. (Tokyo, Japan).
Melanoma cell lines B16-F10 (BCRC 60031) were procured from Bioresource Collection and Research Center (BCRC), Taiwan Food Industry Research and Development Institute (FIRDI, Hsinchu, Taiwan). Both human fibroblast cell line CCD986SK and keratin cell line HaCaT were gifts from Dr Jih-Fung Lu and Dr Chi-Feng Hong, respectively, School of Medicine, Fu Jen University (New Taipei City, Taiwan). These two cell lines were also purchased from the accredited facility BCRC-FIRDI in Taiwan. Cell culture reagents including fetal bovine serum (FBS), culture Dulbecco’s Modified Eagle’s Medium (DMEM), penicillin-streptomycin, and Hank’s balanced salt solution (HBSS) were from Hyclone Co. (Logan, UT, USA). Trypan blue stain agent (0.4%), 0.25% trypsin-EDTA, and sodium pyruvate were from Thermo Fisher Scientific (Waltham, MA, USA). Propidium iodide (PI), RNase A, bovine serum albumin (BSA), sodium dodecyl sulfate (SDS), 3-(4,5-dimethylthoazol-2-yl)-2,5-diphenyltetrazolium bromide (MTT), and phosphoric acid were from Sigma–Aldrich Co. (St Louis, MO, USA). The Bradford reagent protein assay kit was from Bio-Rad Laboratories Co. (Hercules, CA, USA). N, N, N′, N′-tetramethylethylenediamine, ammonium persulfate (APS), glycine, Tris-base, and 30% acrylamide were from USB Co. (Cleveland, OH, USA). Amersham ECL prime Western blotting detection reagent and polyvinylidene fluoride (PVDF) blotting membrane were from GE Healthcare Bio-Sciences AB (Uppsala, Sweden). Both caspase-8 and caspase-9 fluorometric assay kits were from Biovision Co. (Milpitas, CA, USA). Both Annexin V:fluorescein isothiocyanate (FITC) apoptosis detection kit I and caspase-3 assay kit were from BD Biosciences (San Jose, CA, USA). The prestained protein ladder was from Bioman Co. (Taipei, Taiwan).
The primary antibodies include mouse monoclonal anti-α-tubulin antibody (Sigma–Aldrich Co.), mouse anti-cyclin A and rabbit anti-Bax (EMD Millipore), mouse anti-CDK2, mouse anti-cytochrome C, mouse anti-p21, mouse anti-cyclin B, and mouse anti-Bcl-2 (BD Biosciences), as well as anti-cdc2 (CDK1) and mouse anti-p53 (Novus Biologicals Co., Littleton, CO, USA). The secondary antibodies include peroxidase-conjugated goat anti-mouse IgG (Jackson ImmunoResearch Laboratories, Inc., West Grove, PA, USA) and peroxidase-conjugated goat anti-rabbit IgG (Anaspec Co., Fremont, CA, USA).
Instrumentation
The GC model 6890 equipped with flame ionization detector (FID) or mass spectrometer (model 5973) was from Agilent Technologies (Santa Clara, CA, USA). Three capillary columns including high-polar DB-Wax (60 m ×0.53 mm ID, 1-μm film thickness) with polyethylene glycol as stationary phase and high-polar HP-88 (100 m ×0.25 mm ID, 0.2-μm film thickness) with bicyanopropyl polysiloxane as stationary phase, and low-polar HP-5MS (30 m ×0.25 mm ID, 0.25-μm film thickness) with 5% diphenyl and 95% dimethyl polysiloxane as stationary phase were also from Agilent Technologies. The Eyela N-1 rotary evaporator was from Tokyo, Japan. The low-temperature circulation water bath was from Li-Chen Instrument Co. (Taoyuan, Taiwan). The high-speed centrifuge Sorvall RC5C was from Du Pont Co. (Wilmington, DE, USA), while the microcentrifuge Fresco 21 was from Thermo Scientific Heraeus Co. (San Jose, CA, USA). Both the sonicator (model DC400H) and laminar flow hood were from Hua-Hsia Scientific Co. (Taipei, Taiwan). The inverted microscope (Eclipse TS100) was from Nikon Corporation (Tokyo, Japan). The CO2 incubator (SCA-165DS) was from Astec Co. (Fukuoka, Japan). The enzyme-linked immunosorbent assay (ELISA) reader (model VersaMax) was from Molecular Devices LLC (Sunnyvale, CA, USA). The nanoparticle size analyzer/dynamic light scattering (DLS) (model 90 plus) with Avalanche photodiode detector and BIC particle sizing 90 plus software was from Brookhaven Instruments Co. (Holtsville, NY, USA). The differential scanning calorimeter (Q10) was from TA Instruments Co. (New Castle, DE, USA). The transmission electron microscope (TEM) (model JEM-1400) was from JEOL (Tokyo, Japan). The flow cytometer (model FC200) was from Beckman Coulter Co. (Fullerton, CA, USA). The blood cell analyzer (model Vet abc) was from SCIL Co. (Viernheim, Germany). The electrophoresis system was from Bio-Rad Laboratories Co. The multiple wavelength microplate analyzer (model Infinite 200 PRO series) was from TECAN Co. (Männedorf, Switzerland). The luminescence fluorescence image analyzer (model BioSpectrum 500) was from UVP Co. (Upland, CA, USA).
Processing of coffee oil
Approximately 100 kg of coffee grounds was dried in a large frying pan (90°C) for 2 h and then cooled to room temperature, after which a portion (15 kg) was collected and mixed with 30 L hexane for extraction at 40°C for 4 h. After filtration, crude coffee oil was obtained and stored at 4°C for further use. Next, a portion of crude coffee oil (150 mL) was refined by mixing with 2 mL of 25 N NaOH and stirring for 30 min, followed by adding 15 mL hexane, stirring for 30 min, centrifuging at 3,500 rpm for 30 min, collecting supernatant, and evaporating hexane under vacuum. After refining, the acid value of crude coffee oil was reduced from 8–15 to <2.0 as measured by a test strip.
Analysis of fatty acid in coffee oil and algae oil by GC-FID and GC-MS
Prior to analysis of fatty acids in coffee oil and algae oil by GC, methyl esterification has to be carried out to enhance volatility of fatty acids and improve resolution. Initially, 2 g of coffee oil or algae oil was mixed with 20 mL of 0.5 N NaOH-methanol solution, after which the mixture was heated to 50°C and reacted for 10 min. After cooling, methyl esterification was performed by adding 16 mL of 0.5 N BF3-methanol and reacting at 50°C for 5 min, followed by cooling, adding 16 mL hexane, heating at 50°C for 10 min, cooling, adding 60 mL of saturated NaCl solution, filtering to remove precipitate by suction, collecting supernatant, evaporating to dryness under vacuum, dissolving in hexane, and diluting to 10 mL for GC-FID and GC-MS analyses.
Three GC capillary columns as mentioned earlier were used for the comparison of separation efficiency of fatty acids in both coffee oil and algae oil. After GC analysis, the DB Wax capillary column was shown to provide a better resolution than the other two columns by employing the following conditions: the carrier gas was helium with flow rate at 4 mL/min, injection volume 1 μL with split ratio 20:1, injector and detector (FID) temperatures 240°C and 250°C, respectively. Also, the initial column temperature was 185°C, maintained for 1 min, raised to 230°C at 5°C/min and maintained for 8 min. A total of 8 fatty acid methyl esters in coffee oil and 5 fatty acid methyl esters in algae oil were separated within 18 min. The separation efficiency was evaluated based on k value (retention factor) and α value (separation factor). The various fatty acids in coffee oil and algae oil were identified by comparing retention times and mass spectra of unknown peaks with reference standards. For GC-MS analysis, the electron ionization (EI) source and total ion scanning mode were used with the electron energy being 70 eV, MS source temperature 230°C, and MS quad temperature 150°C. An internal standard decanoic acid methyl ester (C10:0) was used for quantitation by dissolving in hexane at a concentration of 1,000 μg/mL. Six concentrations (30, 50, 150, 200, 250, and 300 μg/mL) were each prepared for C16:0, C18:1, and C18:2, while 10, 30, 50, 75, 100, and 200 μg/mL prepared for C18:3, C20:0, C20:1, C22:0, and C22:6. Similarly, 6 concentrations (10, 30, 50, 100, 150, and 200 μg/mL) were prepared for C18:0. Each concentration of fatty acid methyl ester standard was prepared in hexane and then mixed with internal standard (C10:0) whose final concentration was 100 μg/mL. After GC-FID analysis, the standard curve of each fatty acid methyl ester was prepared by plotting concentration ratio (standard versus internal standard) against area ratio (standard versus internal standard). Both the linear regression equations and coefficient of determination (R2) were obtained automatically with a Microsoft EXCEL software system, with the former being used for calculation of the amounts of fatty acids in both coffee oil and algae oil.
Preparation of nanoemulsion
Initially, 0.5 g coffee oil and 0.3 g algae oil were mixed in a tube, after which 1 g surfactant (20% Span 80 and 80% Tween 80) was added and stirred at 70°C for 15 min. Then deionized water was added and diluted to 10 mL, followed by sonicating at 65°C for 2 h to obtain a nanoemulsion containing DHA at 114 mg/mL.
Particle size analysis
A portion of nanoemulsion (200 μL) was collected and diluted to 5 mL with 25 mM phosphoric acid dihydrogen potassium buffer solution (pH 5.3–5.5), after which 3 mL was filtered through a 0.45-μm membrane filter (Nylon, 13 mm) for the measurement of particle size distribution and polydispersity index (PDI) by DLS. The nanoemulsion without filtration through a 0.45-μm membrane filter was also determined by DLS. Quadruplicate analyses were conducted. For TEM analysis, 200 μL of nanoemulsion was diluted with deionized water 50 times, after which 20 μL was collected and dropped on copper grid for 30 s, followed by removing the excessive solution with a glass filter paper, negative staining with 20 μL of 0.2% phosphotungstic acid for 30 s, removing the excessive staining agent with a glass filter paper, and drying in a desiccator for 2 days. Both the particle size and the shape of nanoemulsion were then measured by enlarging 3×10⁵ times under 120 kV.
Stability of nanoemulsion during storage
Nanoemulsion samples were stored at 4°C, 25°C, and 40°C, and both particle size distribution and pH value on days 1, 7, 21, 30, 60, and 90 were determined by DLS and pH meter, respectively. For DSC analysis, 3–5 mg of nanoemulsion sample was collected in a small copper container and the same volume of 25 mM phosphoric acid dihydrogen potassium buffer solution (pH 6.0–7.0) was added, after which the solution was stirred, sealed, and stood at room temperature for 15 min. Then the pressure of DSC was raised to 500 psi with nitrogen gas with a flow rate at 20 mL/min to prevent thermal expansion, while the temperature was elevated from 40°C to 105°C at 10°C/min. For the determination of zeta potential, 0.1 g of nanoemulsion sample was diluted with deionized water 50 times, after which the solution was filtered through a 0.22-μm membrane filter and placed in a zeta potential analyzer for analysis at 25°C.
Determination of encapsulation efficiency
Nanoemulsion sample was collected in a centrifuged tube containing a dialysis membrane with the molecular weight cutoff 3 KD for dialysis. Unencapsulated DHA (free DHA) could penetrate into the membrane, and the dialysate was analyzed for DHA by GC-FID. The encapsulation efficiency was determined using the following formula:
|

where Wi, original DHA amount and Wf, free DHA amount.
UV irradiation experiment
Cells HaCaT (2.5×10³) were seeded in a 24-well plate and cultured overnight with the medium containing various proportions (0.01%, 0.033%, and 0.1%) of coffee oil-algae oil nanoemulsions, corresponding to 11.4, 37.6, and 114 μg/mL DHA, respectively, or the medium without serum, after which cells were washed with PBS twice and irradiated with UVA (20 J/cm2) or UVB (20 mJ/cm2). A Bio-Sun system illuminator (Vilber Lourmat, Collégien, France) was used to provide UVB (312 nm) and UVA (365 nm) with a 10-cm distance from sample, followed by adding the fresh medium without serum and incubating for 24 h. The treatment without coffee oil-algae oil nanoemulsion and without irradiation was used as control. Then the MTT assay was used to calculate the cell survival rate using the same formula as described earlier.
Animal experiment
A total of 24 6-week-old BALB/c mice were obtained from BioLASCO Laboratory Animal Center, and this study was approved by Fu Jen University Animal Subjects Review Committee, New Taipei City, Taiwan. The experiments were carried out following the ethical guidelines of the Care and Use of Animals in Research as recommended by the American Psychological Association.15 Prior to experiment, these mice were housed in ventilation cages in the Fu Jen University Laboratory Animal Center at an ambient temperature of 22°C±2°C for 12 h (7 AM to 7 PM). All mice were fed with a laboratory rodent diet 5001 (LabDiet Co., St Louis, MO, USA) ad libitum and strict regulations on human care for laboratory animals were adopted. Then all the 24 mice were divided into 4 groups of 6 each, with the first group receiving no treatment, the second group receiving UVA irradiation (6 J/cm2), the third group receiving 0.1% nanoemulsion, and the fourth group receiving 0.1% nanoemulsion plus UVA irradiation (6 J/cm2). A 6-day duration experiment was conducted for each group, with UVA irradiation being carried out on days 2, 4, and 6. A Bio-Sun system illuminator (Vilber Lourmat) was used with a dose of 6 J/cm2 until a total of 18 J/cm2 was accumulated on the same day. The distance between illuminator and mice was 10 cm. Also, after 1 h irradiation on each day, the TEWL, formation of erythema and melanin, as well as subcutaneous blood flow rate were determined by Tewameter (TM 300; Courage and Khazaka, Köln, Germany), Spectrocolorimeter (CD100; Yokogawa, Tokyo, Japan), and Laser Tissue Blood Flow Meter (FLO-N1; Omegawave, Tokyo, Japan), respectively.
Cell culture
Mouse melanoma cell line B16-F10 was cultured in a DMEM, which was prepared by mixing 67 g of DMEM powder containing 4 mM L-glutamine and 4.5 g/L glucose, 7.5 g of sodium bicarbonate, 50 mL of sodium pyruvate, 5,000 U/mL penicillin, and 5,000 U/mL streptomycin, followed by dissolving in 4,450 mL deionized water, adjusting pH to 7.2, diluting to 4,750 mL with deionized water, filtering through a 0.22-μm membrane filter and storing at 4°C for use. A portion of 950 mL was collected and mixed with 50 mL FBS. Both CCD986SK and HaCaT cell lines were also cultured in a DMEM prepared by the same method shown above with the exception that no sodium pyruvate was added.
Cells were collected from liquid nitrogen and thawed at 37°C, after which cell sap containing 7% DMSO was poured into a 75-T flask and 10 mL of DMEM containing 5% FBS was added gradually. Then cells were cultured in an incubator at 37°C and 5% CO2. After the cell density reached 80%–90% confluency, cells were washed with PBS 2–3 times and 1 mL of 0.25% trypsin-EDTA was added, followed by reacting in an incubator for 1–2 min, adding 1 mL medium, centrifuging at 1,000 rpm for 5 min, removing the supernatant and 1 mL of DMEM was added. Then a portion of cells were seeded in a new culture medium. For cell number count, cells were suspended in a medium and 20 μL was collected and mixed with the same volume of trypan blue, followed by pouring into a hemocytometer for counting under a microscope. The cell concentration was then calculated by using a formula as described by Chang and Chen.16
MTT assay
The cell suspension containing B16-F10 or CCD986SK was seeded in a 96-well plate with each well containing 7×10² cells or 6×10³ cells, respectively, and cultured overnight for cell adhesion. Then the culture medium was removed and replaced with different proportions (0.01%, 0.013%, 0.02%, 0.04%, and 0.1%) of coffee oil-algae oil nanoemulsion, corresponding to 11.4, 15.2, 22.8, 45.6, and 114 μg/mL DHA, respectively. Triplicate experiments were carried out for each concentration. After 48 h, the culture medium was discarded and PBS was added to remove the residual medium, followed by adding 0.2 mL MTT reagent (0.5 mg/mL), reacting in an incubator for 2 h, adding 0.2 mL DMSO to dissolve purple crystal, and measuring absorbance at 570 nm with an ELISA reader.
Cell cycle analysis
Cells (B16-F10) were seeded in a 6-well plate with each well containing 3×10⁴ cells and cultured for 24 h for cell adhesion. Then the medium was removed and washed with PBS, followed by adding different proportions (0.013%, 0.02%, and 0.04%) of coffee oil-algae oil nanoemulsions, corresponding to 15.2, 22.8, and 45.6 μg/mL DHA, respectively. After 48 h of incubation, cells were washed with PBS and suspended with trypsin-EDTA, followed by collecting in a tube for centrifugation at 1,000 rpm for 5 min, removing supernatant, washing cells with PBS twice, adding 1 mL 70% ethanol solution, and standing at 4°C overnight for cell fixing. Next, cells were centrifuged again to remove ethanol and washed with PBS twice, followed by adding 0.1 mL RNase (1 mg/mL) and 0.1 mL staining agent PI (0.1 mg/mL), and reacting at 37°C for 30 min in the dark. The stained cells were then analyzed by a flow cytometer for cell cycle distribution after filtration through a 40-μm nylon screen.
Annexin V/PI staining assay
Cells (B16-F10) were seeded in a 6-well plate with each well containing 3×10⁴ cells and cultured overnight for cell adhesion, after which the medium was removed, washed with PBS, and different proportions (0.013%, 0.02%, and 0.04%) of coffee oil-algae oil nanoemulsions, corresponding to 15.2, 22.8, and 45.6 μg/mL DHA, respectively, were added for further incubation for 48 h. Then the cells were washed with PBS and suspended with trypsin-EDTA, followed by collecting in a tube, centrifuging at 1,000 rpm for 5 min, removing supernatant, washing with PBS twice, adding 0.1 mL of 1× binding buffer to suspend cells, adding 5 μL of FITC-Annexin V and 10 μL staining agent PI, reacting at room temperature for 15 min in the dark, adding 0.4 mL of 1× binding buffer, and analyzing by a flow cytometer.
Western blotting
Cells (1.5×10⁵) were seeded in a 10-cm plate and cultured overnight, after which the medium was removed, washed with PBS, and replaced with different proportions (0.013%, 0.02%, and 0.04%) of coffee oil-algae oil nanoemulsions, corresponding to 15.2, 22.8, and 45.6 μg/mL DHA, respectively, for further incubation for 48 h. Then the cells were washed with PBS and trypsin-EDTA added to suspend cells. Both medium and cell suspension were collected in a tube and centrifuged at 1,000 rpm for 5 min. Then the supernatant was removed, followed by washing cells with PBS (4°C), adding cell lysis buffer (100 μL), dispersing cells, storing at −20°C overnight, centrifuging at 12,000 rpm for 30 min, and collecting the supernatant as protein extract. BSA was used as standard for protein quantitation by preparing 7 concentrations of 0.5, 1, 2, 4, 6, 8, and 10 μg/mL containing 1× Bradford reagent. The BSA standard curve was prepared by plotting concentration against absorbance at 595 nm in a 96-well plate. Likewise, the cell extract (200 μL) was collected in a 96-well plate for absorbance measurement at 595 nm, and protein was quantified based on the standard curve.
For SDS-PAGE electrophoresis, 40–70 μg protein extract was collected and sample buffer was added for reaction in a 95°C water bath for 10 min, followed by cooling on ice, adding prestained protein ladder, and sample into a tank for separation of protein with the upper and lower voltage being 70 and 110 V, respectively.
For Western blotting, the PVDF membrane was activated in methanol for 30 s and then immersed in IX transfer buffer for 5 min. After incubating at 4°C for 90 min (100 V), the PVDF membrane was soaked in blocking buffer (TBST buffer solution containing 5% skim milk), reacted at room temperature for 1 h to prevent noise. Then the TBST buffer solution containing 0.1% Tween 20 was added, washed 3 times to remove unattached protein, and the primary antibody was added in an appropriate ratio shown below: cyclin A (1:1,000), cyclin B (1:1,000), p53 (1:1,000), p21 (1:500), CDKI (1:2,000), CDK2 (1:5,000), cytochrome C (1:500), Bcl-2 (1:2,500), and Bax (1:2,000). After reacting at 4°C overnight, the TBST buffer was added for washing 3 times with 10 min each, followed by adding the horseradish peroxidase (HRP)-conjugated secondary antibody (anti-mouse conjugate IgG), reacting at room temperature for 1 h, adding the TBST buffer solution for washing several times, adding the ECL reagent for chemiluminescence production and detection by a fluorescence image system, and quantitation by a Gelpro 32 software system.
Expression of caspase-3, −8, and −9
Cells (3×10⁴) were seeded in a 6-well plate and cultured for 24 h for cell adhesion, after which the medium was removed and replaced with different proportions (0.013%, 0.02%, and 0.04%) of coffee oil-algae oil nanoemulsions, corresponding to 15.2, 22.8, and 45.6 μg/mL DHA, respectively, for further incubation for 48 h. Then PBS (4°C) was added for washing and trypsin-EDTA added to suspend cells. Both medium and cell suspension were collected in a tube, centrifuged at 1,000 rpm for 5 min, and the supernatant was removed. Then PBS was added for washing cells, followed by adding cell lysis buffer (100 μL), dispersing cells, storing at −20°C for 30 min, centrifuging at 12,000 rpm for 30 min, collecting supernatant (25 μL) in a 96-well plate, adding 100 μL 1× HEPES buffer containing 2.5 μL of Ac-DEVD-AMC, reacting at 37°C for 1 h, and measuring the absorbance with a fluorometer with the excitation wavelength at 380 nm and the emission wavelength at 460 nm.
For caspase-8 and caspase-9, the method was similar to that of caspase-3 with the exception that after centrifugation, the supernatant (50 μL) was collected in a 96-well plate and 50 μL 2× reaction buffer containing 0.5 μL of 1.0 M DTT, 5 μL of 1 mM LEHD-AFC was added, and the absorbance was measured with a fluorometer with the excitation and emission wavelength at 400 and 505 nm, respectively.
Statistical analysis
All the experimental data were analyzed by analysis of variance and Duncan’s multiple range test for significant difference (p<0.05) in mean comparison by using the Statistical Analysis System.17
Results and discussion
Fatty acid analysis in coffee oil and algae oil
As described in the “Materials and method” section, 3 GC capillary columns were used for comparison of separation efficiency of fatty acids in coffee oil and algae oil. After various studies, the DB-WAX column was shown to provide a better resolution than the other two columns, HP-88 and HP-5MS, implying that a high-polar stationary phase is necessary to attain an adequate separation of fatty acids. A similar outcome was reported by Goding et al,18 who studied the effect of GC column stationary phase on separation efficiency of fatty acids in biodiesel fuels. Figure 1 shows the GC chromatogram of fatty acids in coffee oil (A) and algae oil (B) by using a DB-WAX column and GC conditions shown in the “Materials and methods” section. The retention time (Rt), retention factor (k), and separation factor (α) of fatty acid methyl esters in coffee oil and algae oil are shown in Table 1, which ranged from 4.19 to 11.48 min, 4.36 to 13.68, and 1.04 to 1.61 for the former, respectively, as well as 2.66 to 16.64 min, 2.37 to 20.09, and 1.13 to 2.43 for the latter, respectively. This result further demonstrated that a satisfactory separation of fatty acids in coffee oil and algae oil was obtained. A total of 8 fatty acids including palmitic acid, stearic acid, oleic acid, linoleic acid, linolenic acid, arachidic acid, gadoleic acid, and behenic acid were identified in coffee oil, while a total of 5 fatty acids including myristic acid, palmitic acid, oleic acid, DPA, and DHA were identified in algae oil. For quantitation, the regression equations of palmitic acid, stearic acid, oleic acid, linoleic acid, linolenic acid, arachidic acid, gadoleic acid, behenic acid, and DHA were y=1.3023x+0.0438, y=0.6396x+0.0073, y =1.2501x+0.0565, y=1.1945x+0.0734, y=1.1866x+0.0043, y =0.6589x+0.0149, y =0.1112x−0.0037, y=0.7269x−0.0116, and y=0.5486x+0.0148, with the coefficient of determination (R2) being all higher than 0.99.
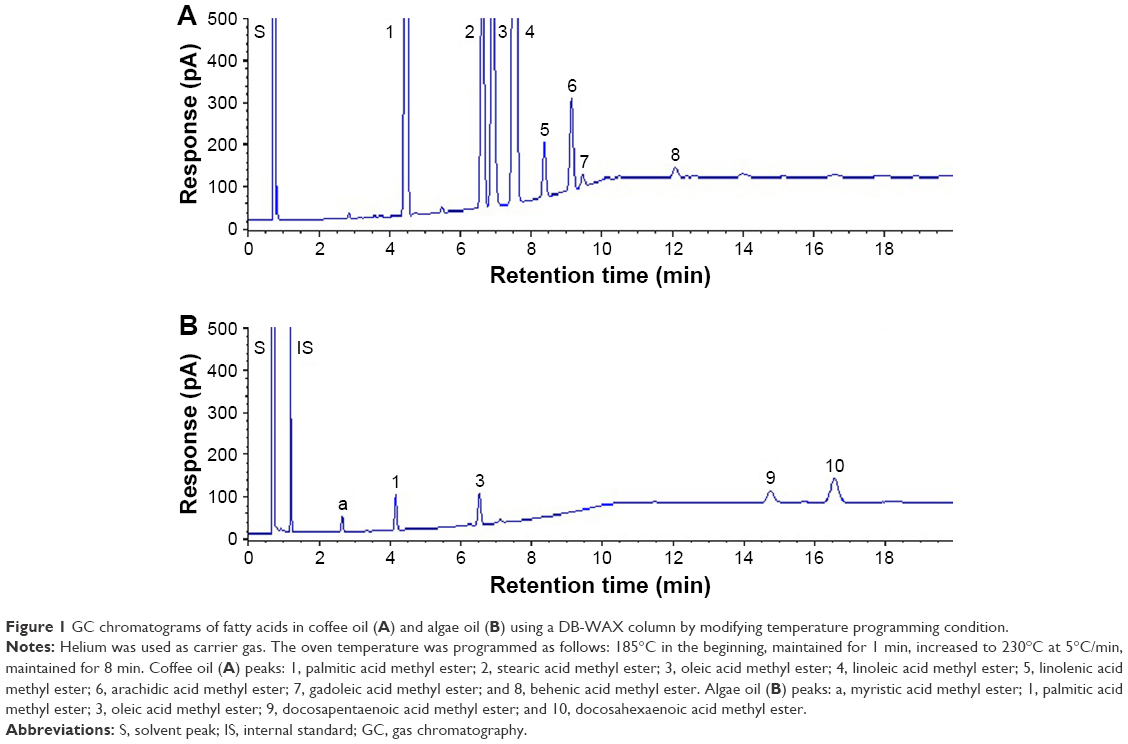 | Figure 1 GC chromatograms of fatty acids in coffee oil (A) and algae oil (B) using a DB-WAX column by modifying temperature programming condition. |
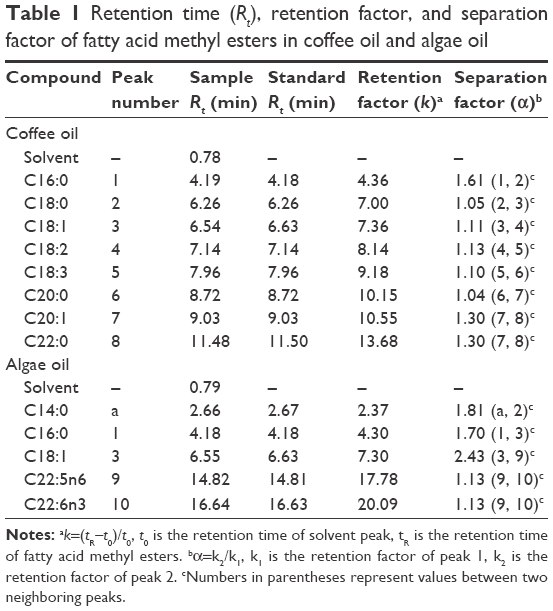 | Table 1 Retention time (Rt), retention factor, and separation factor of fatty acid methyl esters in coffee oil and algae oil |
Comparatively, linoleic acid was present in the largest amount (39.79% or 115.26 mg/g) in coffee oil, followed by palmitic acid (28.59% or 82.82 mg/g), stearic acid (12.89% or 37.80 mg/g), oleic acid (7.99% or 23.16 mg/g), arachidic acid (4.72% or 13.68 mg/g), gadoleic acid (3.93% or 11.38 mg/g), linolenic acid (1.12% or 3.24 mg/g), and behenic acid (0.88% or 2.24 mg/g). But for algae oil, DHA was present in the largest amount (338.96 mg/g). According to literature reports, coffee oil obtained from coffee grounds contained about 80%–90% glycerides and a small amount of free fatty acid, diterpene, sterol, and α-tocopherol.19,20 However, both Ferrari et al21 and de Oliveira et al4 pointed out that coffee oil obtained from green coffee bean was composed of about 75% triacylglycerol, a small amount of free fatty acid, and unsaponifiables including sterol, tocopherol, phospholipid, and diterpene. This outcome indicated that coffee oil recovered from coffee grounds or green coffee bean possessed a similar composition. Nevertheless, the fatty acid composition and amount could be affected by coffee bean growth location, species, extraction, and derivatization conditions.2,22 Furthermore, the acid value of coffee oil obtained in our study was 8–15 mg KOH/g, which equaled 3.99%–7.49% free fatty acid. But after refining with KOH, the acid value as measured by a test strip could be reduced to <2 to meet the national standard. Among the various coffee bean species, Robusta and Arabicas were the most common, with the major fatty acids of both being linoleic acid (39.36%–47.80%), palmitic acid (29.44%–35.55%), stearic acid (6.28%–8.96%), and oleic acid (7.13%–13.56%). For the extraction of coffee oil, polar solvents such as acetone, ethanol, and isopropyl alcohol were shown to extract more free fatty acids than nonpolar solvents such as hexane.2 Thus, hexane was often adopted to extract coffee oil from coffee grounds or green coffee bean.
Preparation of coffee oil-algae oil nanoemulsion
As mentioned in the previous section, coffee oil is a rich source of linoleic acid (about 40%), which has been reported to ameliorate eczema and skin inflammation.5 Likewise, DHA, the most abundant fatty acid in algae oil, was reported to be protective against inflammation and minimize skin erethyma formation caused by UV radiation.11,23 Furthermore, in our pretrials, algae oil was shown to be more efficient in protecting UVA-induced skin inflammation in mice than coffee oil. Thus, in our study, both coffee oil and algae oil were combined as raw materials for the preparation of nanoemulsion. Initially, 0.5 g coffee oil and 0.3 g algae oil were mixed and different proportions of Tween 80 (HLB=15) and Span 80 (HLB=4.3) were added for the calculation of HLB value, followed by mixing thoroughly, diluting to 10 mL with deionized water, and sonicating for 2 h. After various studies, the HLB values ranged from 12.86 to 15 were shown to result in transparent appearance of the nanoemulsion with the average particle size being 35.2±0.4 to 31.6±0.1 nm by DLS analysis (Figure 2). However, for the subsequent experiment, the HLB value 12.86 was selected as it was reported that the nanoemulsion stability could be greatly enhanced by incorporation of mixed surfactants.24 Thus, by mixing two surfactants (20% Span 80 and 80% Tween 80) in an appropriate proportion (10% or 12% of the nanoemulsion), the transparent nanoemulsions containing a high DHA level (114 mg/mL) with the average particle size 36.7±0.2 nm and 32.9±0.4 nm, respectively, were successfully prepared (Figure 3). However, the proportion of 10% was chosen in practice to avoid the toxicity effect of surfactants toward normal cells.
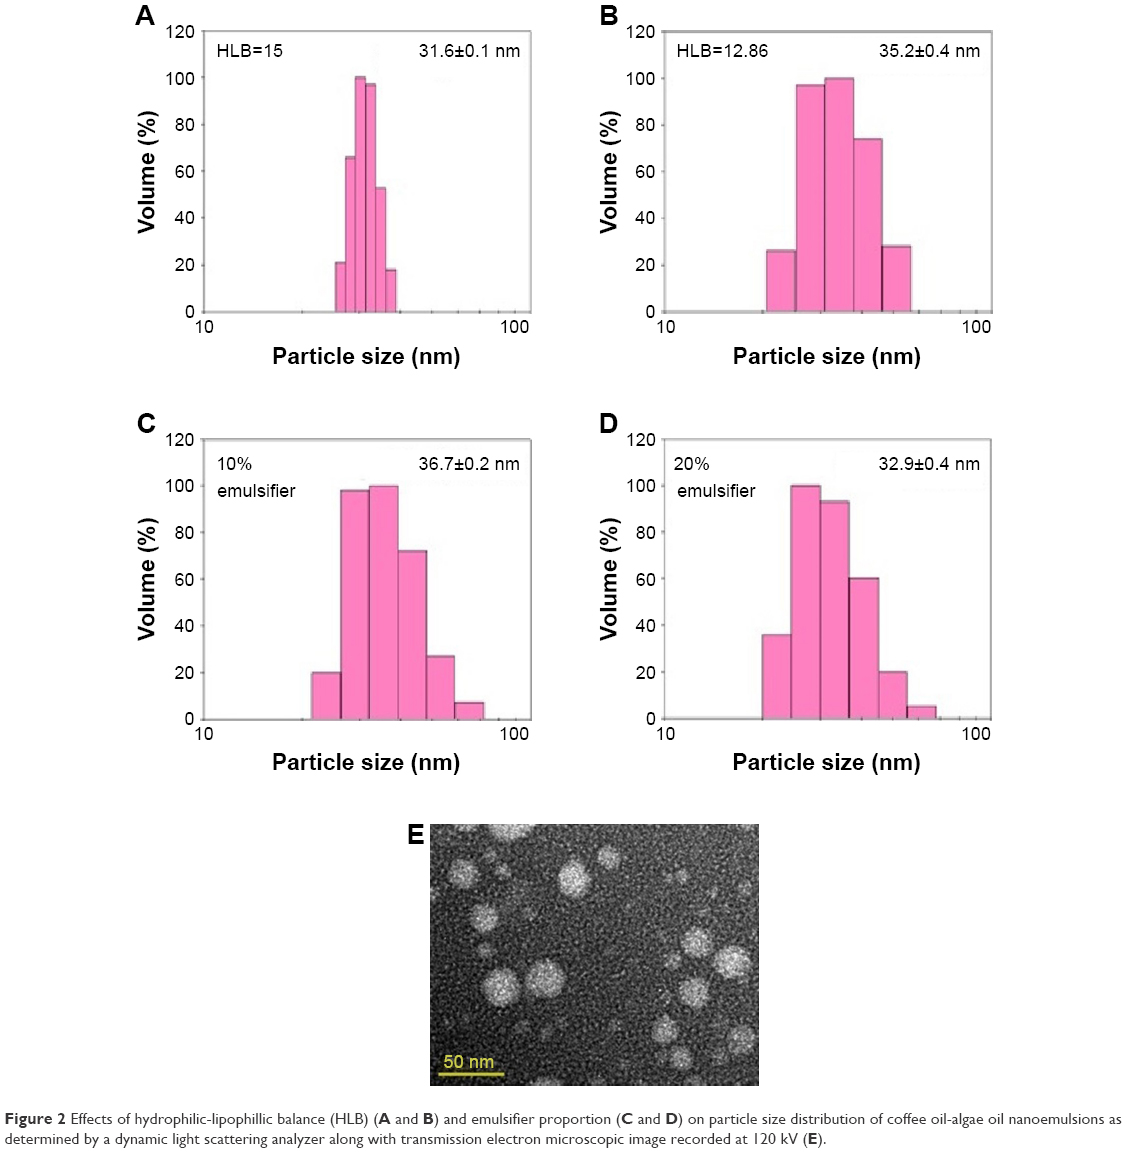 | Figure 2 Effects of hydrophilic-lipophillic balance (HLB) (A and B) and emulsifier proportion (C and D) on particle size distribution of coffee oil-algae oil nanoemulsions as determined by a dynamic light scattering analyzer along with transmission electron microscopic image recorded at 120 kV (E). |
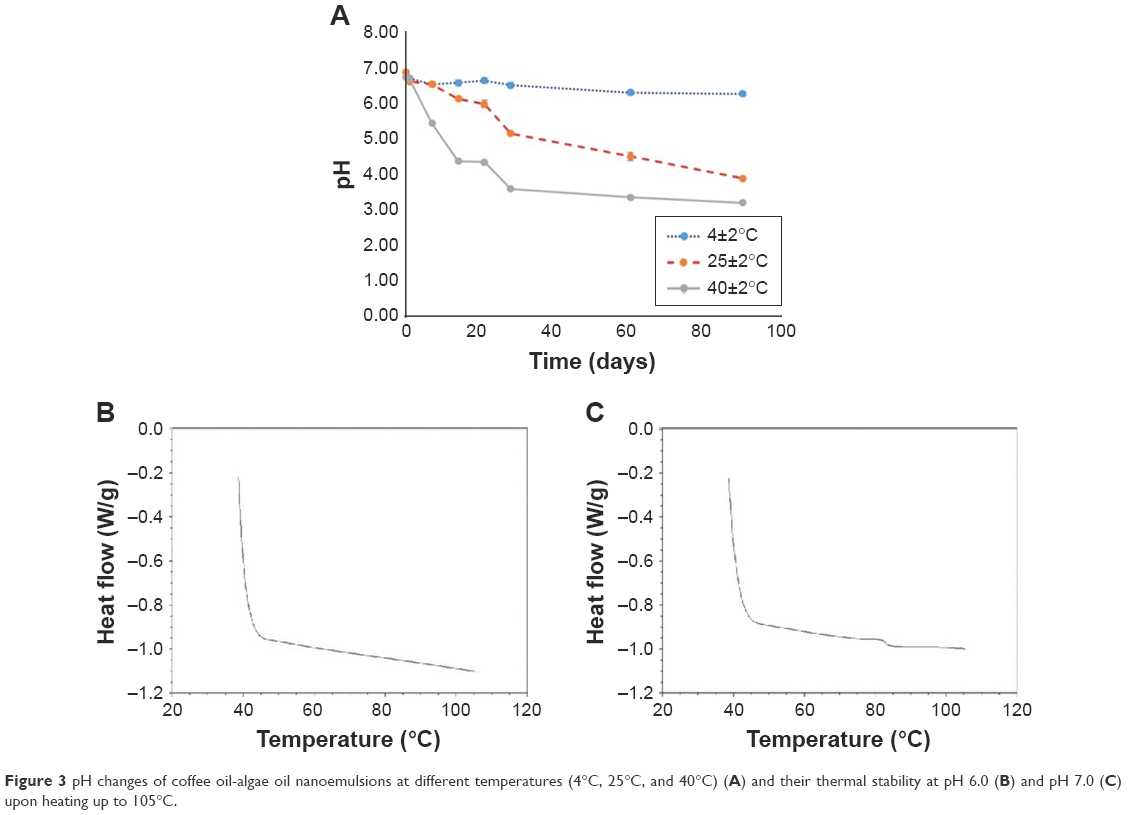 | Figure 3 pH changes of coffee oil-algae oil nanoemulsions at different temperatures (4°C, 25°C, and 40°C) (A) and their thermal stability at pH 6.0 (B) and pH 7.0 (C) upon heating up to 105°C. |
Particle size and stability of nanoemulsion
Based on DLS analysis, the average particle size of nanoemulsion with and without filtration through a 0.2-μm membrane filter was 36.7±0.2 nm and 38.5±0.2 nm, respectively, implying that the membrane filtration step could be eliminated during the preparation of coffee oil-algae oil nanoemulsion. For TEM analysis, an average particle size of 30.2±2.46 nm with spherical shape was observed (Figure 2E), which was smaller than that obtained by DLS (36.7±0.2 nm). This phenomenon can be attributed to the difference in detection principle, that is, TEM was used to determine hard-sphere diameter while DLS measured hydrodynamic diameter. Furthermore, both negative staining and drying for 2 days was required prior to TEM analysis, which in turn resulted in shrinkage of nanoparticles and reduction of particle size.25 In addition, the copper grid may combine with oil droplets in the emulsion leading to a further reduction in particle size.25–27
Compared to published reports, the size of nanoemulsion prepared in our experiment was smaller. For instance, Morral-Ruiz et al25 prepared nanoemulsions composed of medium-chain fatty acid, Tween 80, water, isophorone diisocyanate, and PEG 400 or L-lysine; the average particle size was determined to be 68±10 nm or 52±7 nm by TEM, respectively, as well as 72.1 nm or 55.7 nm by DLS. Similarly, Nam et al26 used tocopheryl acetate as oil phase, polyethylene oxide-block-poly(ε-caprolactone) as cosolvent, phospholipon and hydrogenated soy lecithin as mixed surfactants to prepare nanoemulsion; the average particle size was 60–80 and 100.2±2.8 nm by TEM and DLS analyses, respectively. In a later study, Wang et al27 prepared an algae oil-based nanoemulsion with poloxamer as surfactant; the average particle size was 131.9±1.6 nm. Qu et al28 also prepared a barley oil-based nanoemulsion with Labrafil M 1944CS as cosolvent and both RH40 and PEG400 as surfactants for encapsulation of triterpene; the average particle size was from 41.13±4.11 to 47.59±5.55 nm. Collectively, the difference in particle size of nanoemulsion can be attributed to difference in variety, composition, and amount of oil phase and surfactants, as well as method of preparation.
For the nanoemulsion stability study, pH can be used as an indicator as it was reported that the oil phase used to prepare nanoemulsion may undergo oxidation or hydrolysis to form free fatty acids during storage, leading to a reduction in pH.29,30 The pH changes of nanoemulsions stored at 4°C, 25°C, and 40°C over a 90-day storage period is shown in Figure 3A. The initial pH of the nanoemulsions stored at 4°C, 25°C, and 40°C on day 0 was 6.95±0.03, 6.96±0.03, and 6.81±0.04, respectively. However, the pH followed a declined trend during storage at 25°C and 40°C, as evident by a pH drop to 3.92±0.06 and 3.22±0.05 on day 90, respectively. Conversely, only a minor change in pH (6.34±0.01) was shown on day 90 at 4°C. A similar phenomenon was observed by Bernardi et al,29 demonstrating that the lower the storage temperature, the higher the nanoemulsion stability. Moreover, during storage for 1 day and 90 days at 4°C, the average particle size was 37.7±0.3 and 31.9±0.2 nm, respectively, as was 37.5±0.2 and 35.3±0.2 nm at 25°C, as well as 36.8±0.2 and 47.5±1.2 nm at 40°C. It may be postulated that the nanoparticle flocculation and charge redistribution may occur during storage at high temperature, probably caused by the degradation of nanoparticle structure, exposure of hydrophobic group from structure inside to outside, and agglomeration between nanoparticles because of hydrophobic interaction. In a similar study, Qian et al31 prepared a nanoemulsion composed of orange oil, β-carotene, Tween 20, and water; the average particle size was determined to be 78.5, 79.3, 79.7, and 82 nm, respectively, after storage at 5°C, 20°C, 37°C, and 55°C for 15 days. A similar trend was observed for PDI in our study, as shown by 0.065 and 0.087 on day 1 and days 90 at 4°C, 0.093 and 0.124 at 25°C, as well as 0.076 and 0.050 at 40°C, respectively. All the data suggested that a single distribution of nanoparticles was maintained even after 90-day storage at 4°C, 25°C, and 40°C. Nevertheless, the most optimal storage temperature of the nanoemulsion prepared in our study should be at 4°C as both lipid oxidation and hydrolysis could be minimized when compared at 25°C and 40°C. In addition, the nanoemulsion thermal stability was also determined by DSC (Figure 3B and C). By controlling the pH of nanoemulsion at 6, no thermal conversion phenomenon was observed, demonstrating a high stability of this nanoemulsion when heated up to 110°C. However, by raising the pH of the nanoemulsion to 7, an unstable thermal conversion phenomenon occurred at 80°C. As pointed out by Rao and McClements,32 an inappropriate pH could affect charge distribution of nanoparticle and may lead to hydrolysis or flocculation depending on the degree of hydrolysis. In other words, the flocculation may be caused by high degree of hydrolysis. However, by taking the pH of human skin (4.2–5.9) into account, the pH of coffee oil-algae oil nanoemulsion prepared in our study should be controlled at 6 to mitigate skin sensitivity and irritability for future application. In addition to PDI, zeta potential is a vital index of polydispersity or stability, as high stability of nanoemulsion can be obtained by controlling the zeta potential at >30 mV or <−30 mV.33 Compared to many published reports, the zeta potential of the nanoemulsion prepared in our study was much lower (−72.72±3.61 mV), demonstrating a high stability, probably caused by partial hydrolysis of coffee oil or algae oil to produce free fatty acid with negative charge during the preparation or storage. Also, the encapsulation efficiency of DHA in nanoemulsion was 100%. In a similar study dealing with the preparation of nanoemulsion with algae oil (15%–50%) and stearic acid as oil phase, poloxamer 188 as surfactant, and water as aqueous phase, the authors27 reported the encapsulation efficiency of DHA to be 100%–88.83%, depending on the algae oil level, that is, the higher the level of algae oil, the lower the encapsulation efficiency of DHA. The authors further explained that solid lipid (stearic acid) may act as lipid carrier, and during crystallization, unencapsulated liquid oil (algae oil) may accumulate on the surface of the nanoparticle, leading to a decline in the encapsulation efficiency of DHA.27
Inhibition of nanoemulsion on keratin cells HaCaT
Figure 4 shows the cell viability of HaCaT as affected by irradiation with (A) UVA and (B) UVB in the presence and absence of coffee oil-algae oil nanoemulsion. The cell viability of HaCaT remained unaffected when treated with coffee oil-algae oil nanoemulsion without irradiation. However, following UVA irradiation, the cell viability declined to 30%. Conversely, with 0.01% nanoemulsion treatment, the cell viability raised to 44.8%. The same phenomenon also occurred for both doses of 0.033% and 0.1% nanoemulsions. Similarly, following UVB irradiation, the cell viability decreased to 40% and remained unaffected even after treatment with 0.01%, 0.033%, and 0.1% nanoemulsions. Thus, UVA was used for subsequent animal experiment as a dose of 0.01% coffee oil-algae oil nanoemulsion was effective in repairing UVA-induced cell damage.
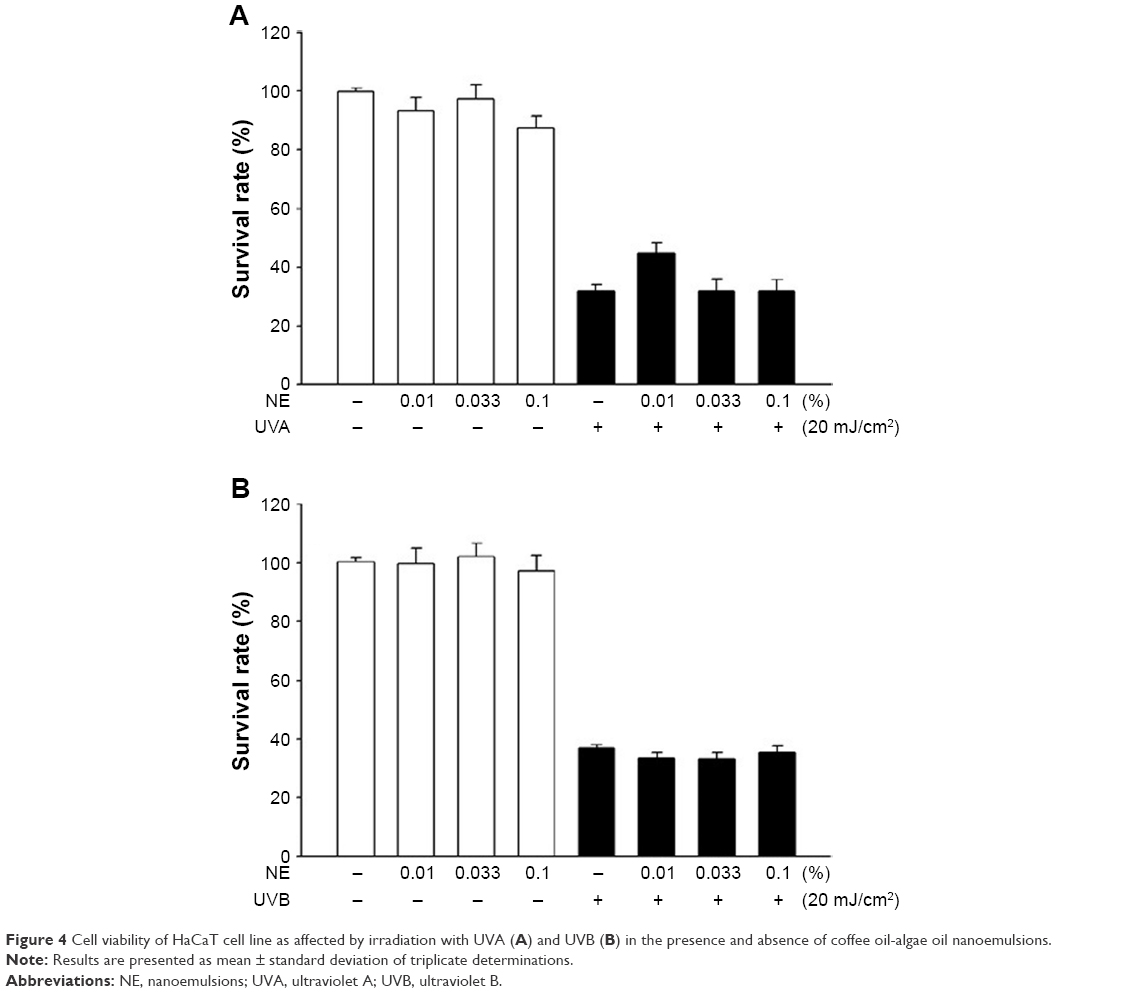 | Figure 4 Cell viability of HaCaT cell line as affected by irradiation with UVA (A) and UVB (B) in the presence and absence of coffee oil-algae oil nanoemulsions. |
In the literature reports, there is a lack of data as to the effect of DHA on repairing UVA-induced skin cell damage. DHA, a ligand of peroxisome proliferator-activated receptor (PPAR), has been shown to activate PPAR-γ to promote keratin cell differentiation, repair skin wound, enhance skin lipid synthesis, and maintain oil–water balance of skin.34 In addition to PPAR-γ, the activation of PPAR-β could assist in repairing skin damage and PPAR-α could mitigate skin inflammation caused by irradiation of HaCaT cells.34 Thus, the DHA-containing nanoemulsion prepared in our experiment was effective in inhibiting UVA-induced inflammation of HaCaT cells through PPAR activation.
Animal experiment
For the animal experiment, a dose of 0.1% nanoemulsion was smeared on the mouse skin on day 1 and then irradiated with UVA at a dose of 6 J/cm2 on days 2, 4, and 6 until 18 J/cm2 was accumulated on the same day. Mice without irradiation and nanoemulsion treatments were used as control. After 1 h irradiation, the physiological data of skin including TEWL, formation of erythema and melanin, color, and subcutaneous blood flow rate were measured each day for both irradiation and control treatments. A wound was observed on the mouse skin on day 3 after irradiation and became more severe following a rise in the duration of irradiation (Figure 5A). However, no significant change in the mouse skin was shown for both control and 0.1% nanoemulsion treatments without UVA irradiation, revealing that the nanoemulsion treatment did not show toxicity toward the mouse skin. Compared to the treatment of mouse skin with UVA irradiation, a smaller wound was found on the mouse skin irradiated with UVA in the presence of 0.1% nanoemulsion, implying that the DHA-containing nanoemulsion was effective in repairing UVA-induced damage in mouse skin. Accordingly, TEWL can be used as an index for the evaluation of physiological condition of skin, especially skin damage. Figure 5B shows the TEWL change as affected by 0.1% coffee oil-algae oil nanoemulsion during irradiation. Only minor change in TEWL was shown between control (7.6–7.9 g/m2/h) and 0.1% nanoemulsion (7.75–7.95 g/m2/h) treatments. After 1-day and 2-day irradiation with UVA, the TEWL were 7.8 and 7.7 g/m2/h, respectively, but further increased to 23.1, 47.8, 51.9, and 55.5 g/m2/h on days 3, 4, 5, and 6, respectively. This outcome clearly indicated that the water-holding capacity of the skin declined by following a time-dependent response during irradiation. However, in the presence of 0.1% nanoemulsion, the TEWL dropped to 7.65, 7.7, 13.3, 27.5, 31.8, and 34.35 g/m2/h on days 1, 2, 3, 4, 5, and 6, respectively. This result further demonstrated that the incorporation of 0.1% nanoemulsion could minimize water loss during irradiation with UVA in skin.
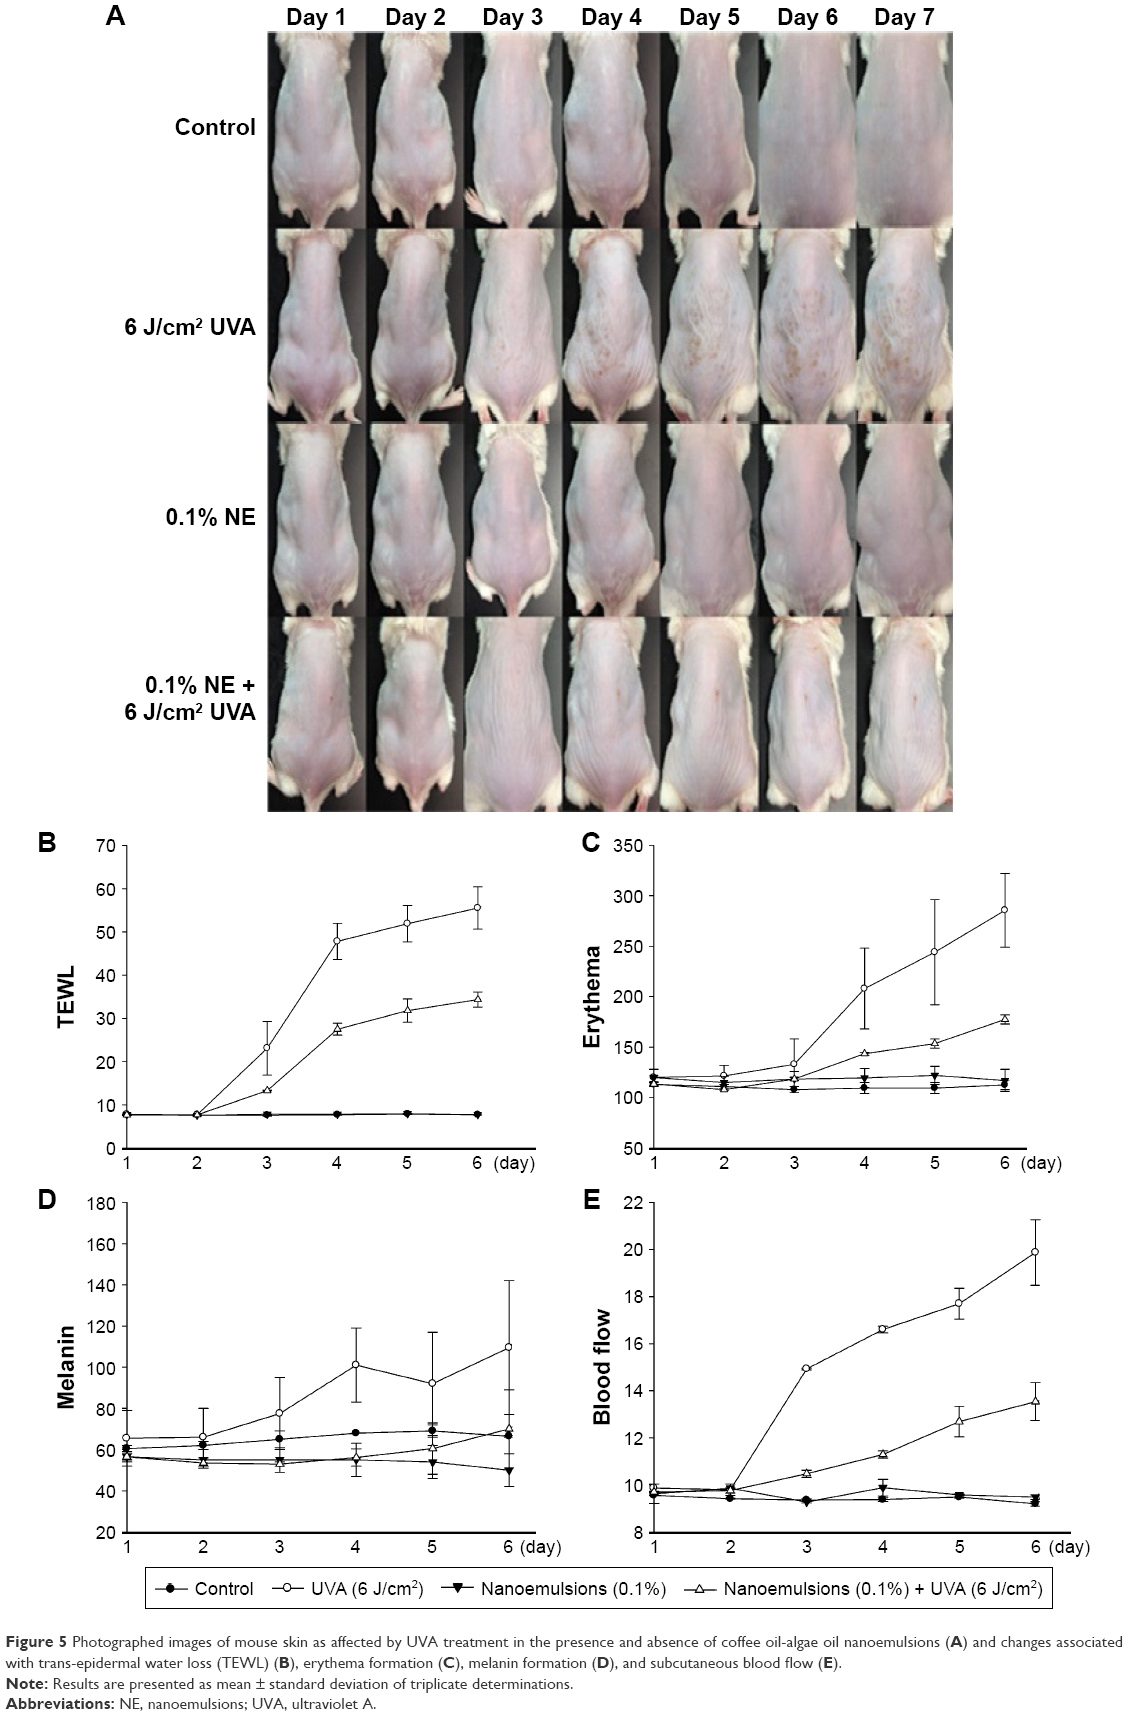 | Figure 5 Photographed images of mouse skin as affected by UVA treatment in the presence and absence of coffee oil-algae oil nanoemulsions (A) and changes associated with trans-epidermal water loss (TEWL) (B), erythema formation (C), melanin formation (D), and subcutaneous blood flow (E). |
In addition to TEWL, erythema can also be formed on skin during irradiation or inflammation, and thus can be used as an index of SPF or skin damage.35 The erythema formation as affected by 0.1% coffee oil-algae oil nanoemulsion during irradiation is shown in Figure 5C. The amounts of erythema formed were similar to both control and 0.1% nanoemulsion treatments, with the former ranging from 108 to 113 and the latter from 115 to 122 over a 6-day period without irradiation. However, during irradiation, the erythema level followed a time-dependent increase and reached a peak (285.5) on day 6. Also, in the presence of 0.1% nanoemulsion, the erythema level followed a time-dependent rise but attained only 177.5 on day 6. Comparatively, during 6-day irradiation, the erythema level was reduced by 62.17% after the incorporation of 0.1% nanoemulsion, demonstrating the efficiency of this nanoemulsion in inhibiting UVA-induced erythema formation on mouse skin.
Accordingly, both UVB and UVA can induce melanin formation through different routes: the former can penetrate into skin to cause DNA damage, leading to delayed tanning caused by the activation of tyrosinase and synthesis of melanin; the latter can induce melanin secretion by melanocytes, resulting in both delayed tanning and immediate pigment darkening caused by the migration of melanin to epidermis for pigment precipitation of skin.36 Thus, the melanin formation can be used as an index for skin resistance to UV (Figure 5D). After treatment with 0.1% nanoemulsion alone for 6 days, the melanin formed were similar to control, which ranged from 50 to 56.5 and 60.5 to 69, respectively. Conversely, the melanin formation followed a time-dependent rise for the UVA treatment alone and reached a plateau (109.5) on day 6. However, in the presence of 0.1% nanoemulsion during UVA irradiation for 6 days, only 53–70 melanins were generated. Compared to the UVA treatment alone, the melanin formation was reduced by 63.92% for 0.1% nanoemulsion, demonstrating the skin protection effect of the nanoemulsion prepared in our study.
In addition to the formation of erythema and melanin, the UV irradiation can also induce the production of nitric oxide and free radical, as well as cause dilatation of blood vessel and increase subcutaneous blood flow rate. Thus, subcutaneous blood flow rate can be used as an index of skin inflammation.37 Figure 5E shows the subcutaneous blood flow rate as affected by UVA irradiation in the presence and absence of 0.1% nanoemulsion. The subcutaneous blood flow rates of the control treatment were from 9.20 to 9.56 mL/min/100 g over a 6-day irradiation period, which were similar to that of the 0.1% nanoemulsion treatment alone (9.27–9.88 mL/min/100 g). In contrast, a time-dependent rise in subcutaneous blood flow rate was shown for the UVA treatment alone, and a peak (19.88 mL/min/100 g) was reached on day 6. However, in the presence of 0.1% nanoemulsion during UVA irradiation, a very low subcutaneous blood flow rate (13.54 mL/min/100 g) was observed on day 6, demonstrating that the nanoemulsion prepared in our study was effective in reducing UVA-induced increase in subcutaneous blood flow rate and skin inflammation.
In several published reports, Ribeiro et al38 extracted coffee oil from recovered coffee grounds or green coffee waste and mixed with Tego®Care 450, Abill® 350, Cutina® GMS, MultiEx Naturotics®, propylene glycol, and water in different proportions to prepare cream and study its effect on skin protection of healthy female subjects aged 18–25 years over a 28-day duration. Both GreenCofOil cream and SpentCofOil cream showed a TEWL value of 5.5–6.0 g/h·m2, which was smaller than the control treatment without cream (6.5–7.0 g/h·m2) and the cream without coffee oil (6.5 g/h·m2). This outcome revealed that both the creams were effective in elevating the water-holding capacity of the skin. In another study, Wagemaker et al5 further pointed out that the SPF of coffee oil extracted from C. arabica green coffee waste was about 1.5 as it could absorb UVB irradiation. In recent two studies, Wagemaker et al9,39 prepared a cream composed of green coffee oil, cetearyl alcohol, ceteareth-20, glycerol, methyldibromo glutaronitrile, and butylated hydroxytoluene. Following the treatment of HaCaT cells with cream (10–100 μg/mL) for 24 h, the cell viability was >100%, implying that this cream did not show toxicity toward HaCaT cells. Also, this cream could enhance the water-holding capacity of the skin of 19 female subjects with an average age of 27±6 years over a 3-day duration.9 More importantly, no skin erythema formation and inflammation was observed for this cream. Similarly, Wagemaker et al39 conducted an animal experiment by irradiation of hairless mice smeared with green coffee oil cream and reported that the SPF of green coffee oil cream was proportional to the coffee oil content. Furthermore, the SPF of the cream (2.3) containing 15% green coffee oil was much higher than control (1.0). However, there was no significant difference (p>0.05) in erythema index between cream containing 5% green coffee oil and control treatment. Also, the cream containing 5% green coffee oil could reduce 60% TEWL caused by UV irradiation. This phenomenon is similar to the finding in our experiment. Comparatively, the nanoemulsion prepared in our study was more effective in inhibiting the formation of skin erythema than cream, which can be attributed to a combination of coffee oil and algae oil as raw materials, especially the presence of a high amount of DHA in algae oil. Theoretically, DHA should be more effective in absorbing UVA or UVB irradiation than linoleic acid, the major fatty acid in coffee oil, due to the presence of 6 double bonds of the former.
Cell viability of B16-F10 and CCD986SK cells
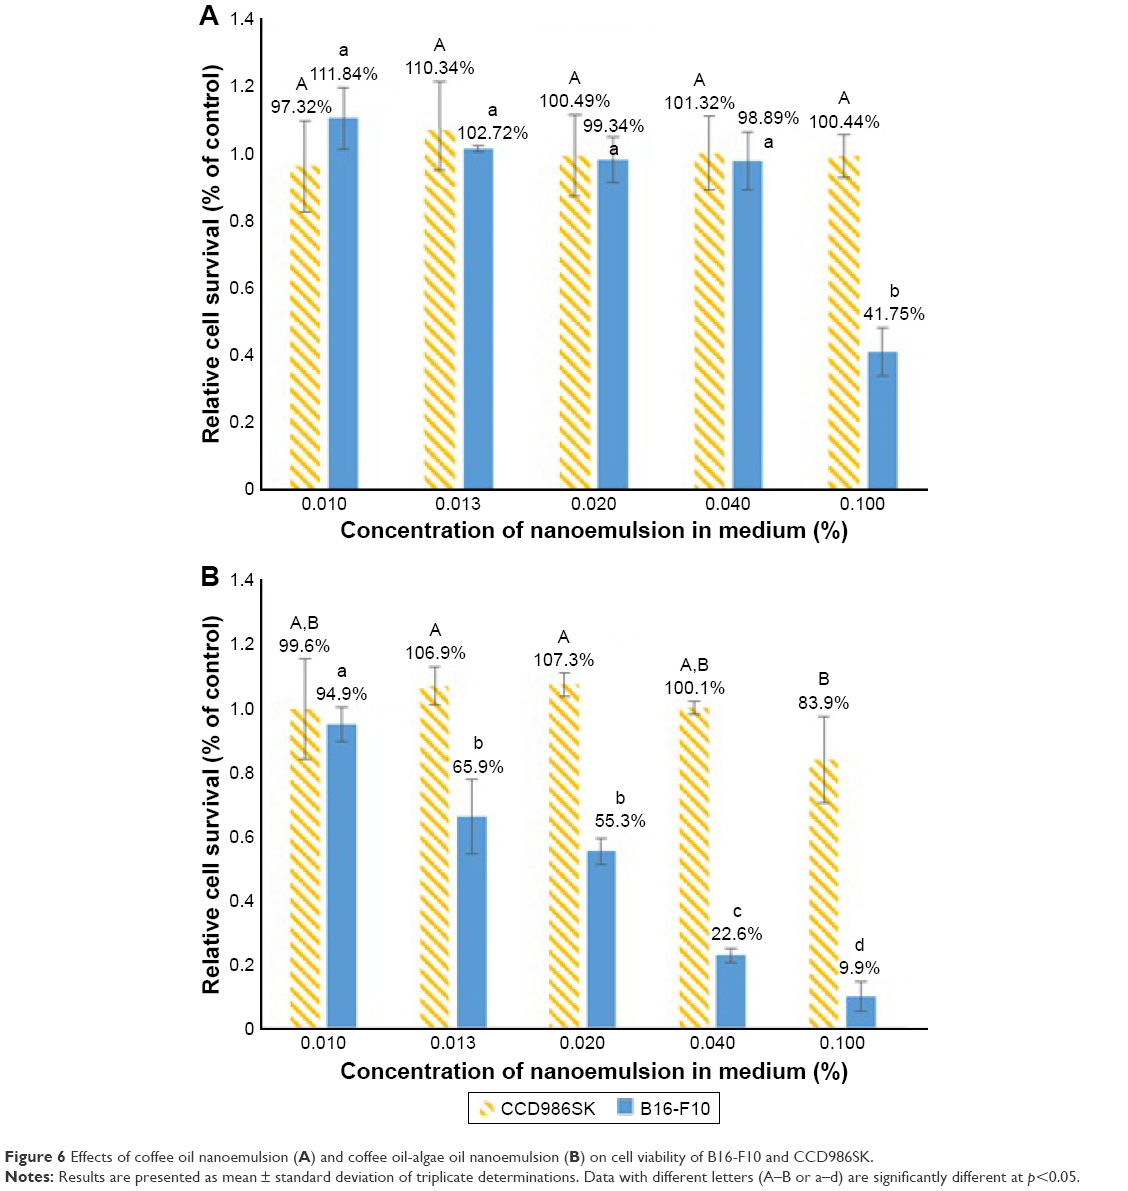
The cell viability of both the cell lines B16-F10 and CCD986SK as affected by coffee oil nanoemulsion and coffee oil-algae oil nanoemulsion is shown in Figure 6A and B, respectively. A dose-dependent decrease in cell viability of B16-F10 was shown for the coffee oil-algae oil nanoemulsion treatment (Figure 6B). However, for the coffee oil nanoemulsion treatment, the cell viability of B16-F10 did not show a declined trend until the dose reached 0.1% (Figure 6A). Comparatively, at the same dose, coffee oil-algae oil nanoemulsion was more effective in inhibiting the growth of melanoma cells B16-F10 than coffee oil nanoemulsion. Conversely, for the normal cells CCD986SK, there was no significant difference (p>0.05) in cell viability between the coffee oil nanoemulsion (0.01%–0.1%) and coffee oil-algae oil nanoemulsion (0.01%–0.04%). But for 0.1% coffee oil-algae oil nanoemulsion, the CCD986SK cell viability dropped to 83.9%, implying a slight inhibition effect at high dose (Figure 6B). As mentioned above, the presence of high-level DHA in algae oil should play a vital role in inhibiting melanoma cell growth. In several published reports, most studies deal with the effect of DHA standard on the inhibition of cancer cell growth. For instance, Andrade et al40 studied the effect of EPA or DHA standard (100–200 μM) on the growth of melanoma cell B16-F10 and SK-Mel28, and no inhibition effect was observed. In contrast, in a study dealing with the effect of DHA standard on the inhibition of melanoma cells A-375, the IC50 was 160 μM,41 which was much higher than the IC50 shown in our study (80.67 μM), demonstrating a higher inhibition efficiency of the coffee oil-algae oil nanoemulsion. For some other types of cancer cells, Kim et al42 studied the effect of DHA standard (10–60 μM) on the growth of lung cancer cells H1299 and A549; a dose-dependent decrease in cell viability was observed with the IC50 being 46 and 40 μM, respectively. Similarly, the IC50 was 50 and 9.7 μM, respectively, after the treatment of lung cancer cells H1299 and A549 with DHA standard (1–100 μM)43 and was 162.5 μM for liver cancer cells MHCC97L when treated with DHA standard (0–200 μM).44 For breast cancer cells MCF-7, MDA-MB-231, and MDA-MB-435, the IC50 were 20.2, 57.4, and 70 μM, respectively, when treated with DHA.45 However, a smaller IC50 was shown for ovarian cancer cell PA-1, lung cancer cell H1299, glial tumor cell D54MG, and cervical cancer cell SiHa, which equaled 15.485, 26.914, 27.136, and 23.974 μM, respectively, when treated with 0–60 μM DHA.46 Apparently, the inhibition efficiency of DHA toward cancer cell growth can be varied, depending on dose, type of cancer cells, and incubation time.
 | Figure 6 Effects of coffee oil nanoemulsion (A) and coffee oil-algae oil nanoemulsion (B) on cell viability of B16-F10 and CCD986SK. |
Cell cycle analysis
On the basis of MTT assay, the coffee oil-algae oil nanoemulsion was effective in inhibiting melanoma cell B16-F10 growth, and its effect on cell cycle distribution needs further investigation (Table 2). No significant difference (p>0.05) was shown in sub-G1 and S phases between control and the other three doses (15.2, 22.8, and 45.6 μg/mL) of the coffee oil-algae oil nanoemulsion. However, for the G0/G1 proportion, there was no significant difference (p>0.05) between control and two doses (15.2 and 22.8 μg/mL) of the nanoemulsion, while the nanoemulsion at high dose (45.6 μg/mL) was lower than control. Likewise, both the nanoemulsions at 22.8 and 45.6 μg/mL were significantly higher (p<0.05) than control in G2/M proportion. Collectively, the B16-F10 growth was arrested at G2/M phase after treatment with coffee oil-algae oil nanoemulsion.
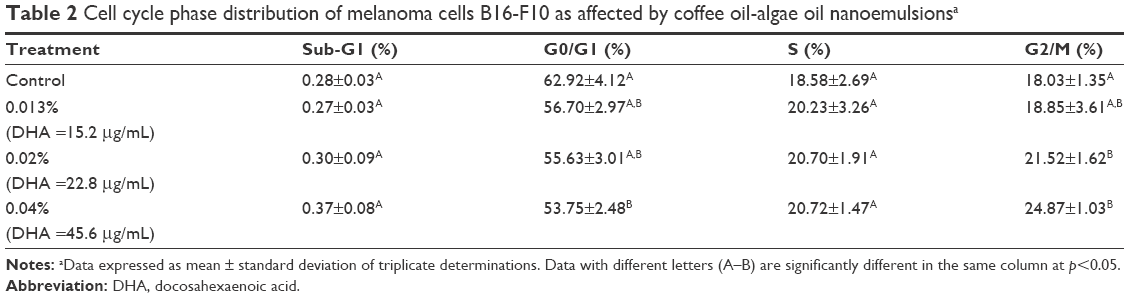 | Table 2 Cell cycle phase distribution of melanoma cells B16-F10 as affected by coffee oil-algae oil nanoemulsionsa |
In a similar study, Albino et al47 investigated the effect of DHA standard (0.5–2 μg/mL) on cell cycle distribution of melanoma cells SK-Mel-29 and SK-Mel-110 and reported that the cell cycle was arrested at G0/G1 and S phases. This outcome indicated that the cell cycle arrest at a certain phase can be varied depending on melanoma cell type. Furthermore, SK-Mel-110 was more sensitive to DHA than SK-Mel-29. For some other types of cancer cells, Jordan and Stein48 used DHA-containing fish oil as a raw material to prepare emulsion for encapsulation of anticancer drug 5-fluorouracil and study its effect on cell cycle distribution of colon cancer cells Caco-2; the cell cycle was arrested at S phase. Interestingly, the cell cycle was arrested at G2/M phase when treated with the same emulsion without 5-fluorouracil. Similar findings were reported by Siddiqui et al49 and Merendino et al,50 who studied the effect of DHA standard on cell cycle distribution of leukemia cell clone-E6-1 and pancreatic cancer cell PaCa-44, respectively, and the cell cycle was arrested at S phase for the former and G0/G1 phase for the latter. Obviously, the cell cycle distribution and arrest can be affected by the difference in cancer cell type, DHA standard dose, and method of preparation of DHA emulsion.
Apoptosis of melanoma cells B16-F10
Table 3 shows the apoptosis of B16-F10 cells as affected by coffee oil-algae oil nanoemulsion. Compared to control, no significant difference (p>0.05) was shown in the proportions of viable cells (B3), early apoptosis cells (B4), late apoptosis cells (B2), and necrosis cells (B1) for the 0.013% nanoemulsion treatment. However, following an increase in dose to 0.02% nanoemulsion, the proportions of both late apoptosis and necrosis cells were significantly higher (p<0.05) than control, while there was no significant difference (p>0.05) in early apoptosis cells. A similar trend was shown for 0.04% nanoemulsion, with the exception that the proportion of early apoptosis cells was higher than control. In addition, a dose-dependent rise was observed for early apoptosis, late apoptosis, and necrosis cells, while a reversed tendency was found for viable cells. All the data suggested that the nanoemulsion treatment could induce melanoma cells B16-F10 to undergo early apoptosis, late apoptosis, or necrosis.
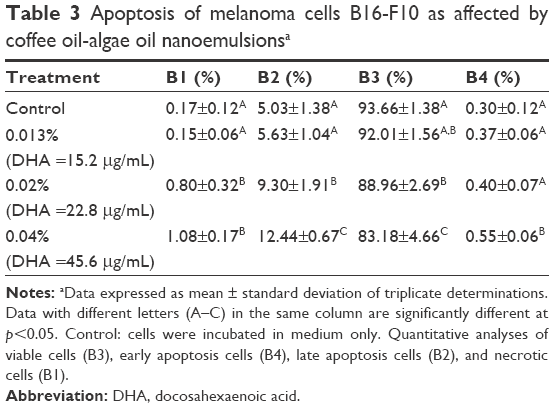 | Table 3 Apoptosis of melanoma cells B16-F10 as affected by coffee oil-algae oil nanoemulsionsa |
In several previous studies dealing with the effect of DHA on apoptosis of cancer cells, both early and late apoptosis cells followed a dose-dependent rise in liver cancer cells Bel-7402 when treated with DHA standard (0–200 μM).51 The same findings were shown for prostate cancer cell PC-3,52 breast cancer cell MCF-7,45 colon cancer cell HT-29,53 and pancreatic cancer cell PaCa-44.50 Taken together, DHA can induce apoptosis of various types of cancer cells by following a time- or dose-dependent response.
Protein expression associated with cell cycle and apoptosis
On the basis of cell cycle analysis, the expressions of both cyclin A and cyclin B as well as CDK1 and CDK2 need to be further explored. Accordingly, cyclin B can form a complex with CDK1 (cyclin B-CDK1) for mitosis and regulation of G2/M phase, while cyclin A can be activated at S and G2 phases for DNA synthesis and mitosis and formation of cyclin A-CDK2 complex at S phase, as well as formation of cyclin A-CDK1 complex at G2 prephase.54 In addition, cyclin E-CDK2 complex can be formed at G1 phase, with CDK1 being responsible for the regulation of G2/M phase for mitosis.55,56 The effect of coffee oil-algae oil nanoemulsion on cyclin B, CDK1, cyclin A, and CDK2 expressions in B16-F10 cells is shown in Figure 7A. Compared to control, expressions of both cyclin B and cyclin A followed a dose-dependent rise and reached a plateau by 1.53- and 1.65-fold for the 0.04% nanoemulsion treatment, respectively. Conversely, both CDK1 and CDK2 expressions showed a dose-dependent decline and a minimum was reached by 0.39- and 0.07-fold for the same treatment, respectively.
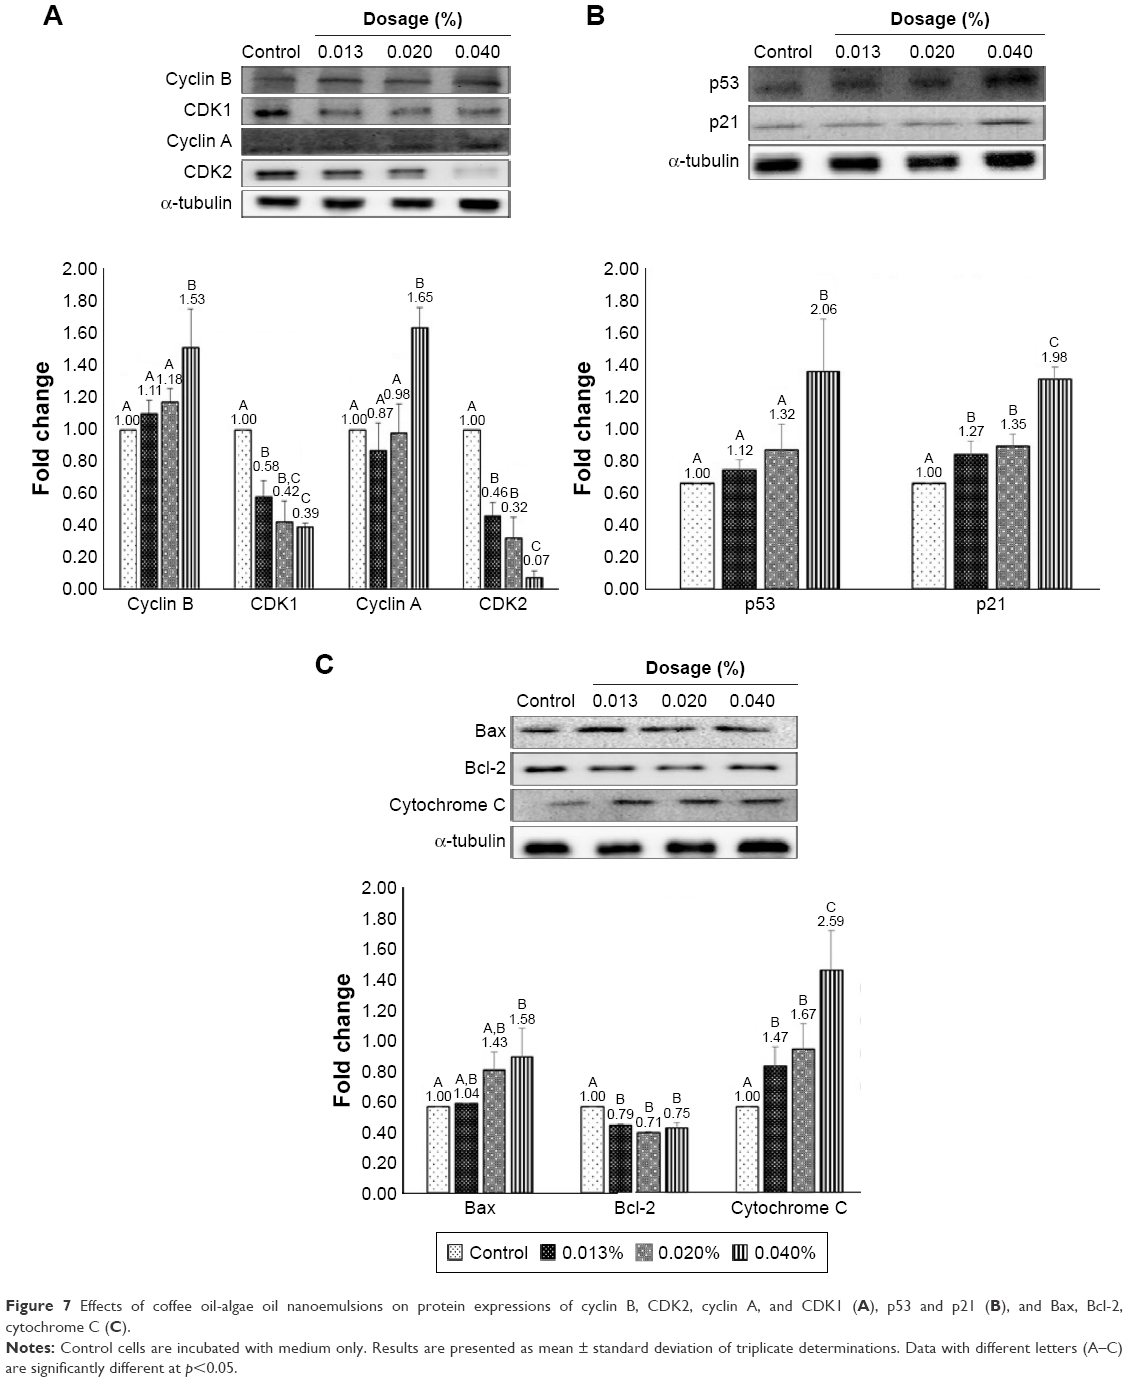 | Figure 7 Effects of coffee oil-algae oil nanoemulsions on protein expressions of cyclin B, CDK2, cyclin A, and CDK1 (A), p53 and p21 (B), and Bax, Bcl-2, cytochrome C (C). |
Both p53 and p21 are vital proteins for the regulation of cell cycle and apoptosis. Also, when DNA is damaged, the former can be activated to retard cell cycle for cell repair, and apoptosis can occur for unrepaired cells. Figure 7B shows the effect of coffee oil-algae oil nanoemulsion on p53 and p21 expressions in B16-F10 cells. A dose-dependent increase in p53 and p21 expressions was shown and reached a peak by 2.06- and 1.98-fold for the 0.04% nanoemulsion treatment, respectively, compared to control. However, only the dose of 0.04% nanoemulsion showed a significantly higher (p<0.05) p53 expression than control, whereas all the three doses (0.013%, 0.02%, and 0.04%) of nanoemulsion showed a significantly higher (p<0.05) p21 expression. This outcome revealed that the p21 expression rose through p53-dependent regulation and inhibition of both CDK1 and CDK2 expressions, leading to cell cycle retardation or apoptosis.
The Bcl-2 family is responsible for signal transduction of cell apoptosis through mitochondria route, and the associated proteins include pro-apoptotic Bax, anti-apoptotic Bcl-2, and cytochrome C. In addition, p53 can enhance Bax activity through transcription or combine with Bcl-2 to promote cell apoptosis. Figure 7C shows the effect of coffee oil-algae oil nanoemulsion on expressions of Bax, Bcl-2, and cytochrome C in B16-F10 cells. Both Bax and cytochrome C expressions followed a dose-dependent increase, while a reversed trend was shown for Bcl-2 expression. However, compared to control, only the dose of 0.04% nanoemulsion was significantly higher (p<0.05) in Bax expression. But for the cytochrome C expression, all the three doses (0.013%, 0.02%, and 0.04%) of nanoemulsion were significantly higher (p<0.05) than control. Furthermore, no significant difference (p>0.05) in Bcl-2 expression was observed between 0.013% and the other two doses (0.02% and 0.4%) of nanoemulsion. This finding implied that following treatment with coffee oil-algae oil nanoemulsion, both Bax and cytochrome C expressions could be elevated and Bcl-2 expression declined.
Cell apoptosis can be regulated through mitochondria, death receptor, or endoplasmic reticulum pathways, in which the caspase family plays a key role in signal transduction of apoptosis. Among various caspases, both caspase-8 and caspase-9, also known as “initiator,” can activate apoptotic protein, while caspase-3, known as “executioner,” can promote protein hydrolysis to generate apoptotic bodies. Furthermore, caspase-3 can be activated through death receptor and mitochondria pathways, while caspase-8 can be activated through the former and caspase-9 through the latter. Also, following a decline in Bcl-2 activity, cytochrome C can be released from mitochondria to form complex with pro-caspase-9 for caspase-9 activation. The activities of caspase-3, caspase-8, and caspase-9 in B16-F10 cells as affected by coffee oil-algae oil nanoemulsions are shown in Figure 8. A dose-dependent rise was shown for caspase-3, caspase-8, and caspase-9 activities. However, for both caspase-8 and caspase-9, only the 0.04% nanoemulsion treatment showed a significantly higher (p<0.05) activity than control. But for caspase-3 activity, all the three doses of nanoemulsion were significantly higher (p<0.05) than control. This finding further demonstrated that both mitochondria and death receptor pathways may be responsible for apoptosis of B16-F10 cells.
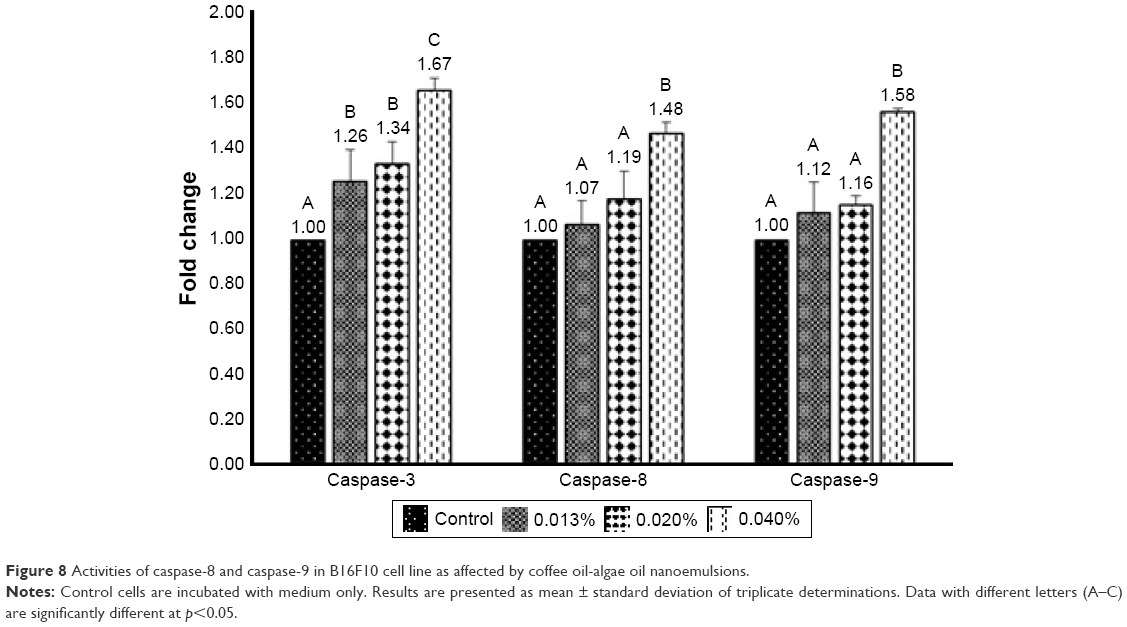 | Figure 8 Activities of caspase-8 and caspase-9 in B16F10 cell line as affected by coffee oil-algae oil nanoemulsions. |
In most published reports, only the effect of DHA standard on the inhibition of cancer cells growth was studied. For instance, Chen and Istfan57 studied the effect of DHA standard on the inhibition of colon cancer cells HT-29 and reported that the expressions of cyclin D, cyclin E, and cyclin A followed a declined trend along with the arrest of cell cycle at G0/G1 phase. However, the cell cycle of leukemia cell clone E6-1 was arrested at S phase after treatment with DHA standard (10 μM), accompanied by a time-dependent decrease in expressions of cyclin A, CDK2, and procaspase-3, as well as an increase in p21 expression.49 Similarly, the expressions of cyclin A, cyclin B, and CDK1 followed a time-dependent decline after the treatment of breast cancer cells MDA-MB-231 with DHA standard (50 μM), but the cell cycle was arrested at G2/M phase.58 In a later study dealing with the effect of DHA standard (0–200 μM) on the inhibition of liver cancer cells MHCC97L, the expressions of CDK2, cyclin E, and cyclin A showed a dose-dependent decrease, but the cell cycle was arrested at sub-G1 phase.44 Interestingly, in another study, Slagsvold et al59 illustrated that the cell cycle of colon cancer cells SW620 was arrested at G1 and G2 phases after treatment with DHA standard (70 μM), accompanied by a rise in p21 expression and decline in cdc25c and CDK1 expressions.
In addition, Chiu et al60 studied the effect of 80 μM DHA (purity 98.6%) extracted from microalgae on the inhibition of breast cancer cells MCF-7 and found a time-dependent increase in Bax expression and decrease in Bcl-2 expression. Likewise, the expressions of p53, Bax, and cytochrome C followed a time-dependent increase after the treatment of gastric cancer cell AGS with 150 μM DHA standard.61 Giros et al62 also reported a rise in caspase-3, caspase-8, and caspase-9 activities in colon cancer cells Caco-2 and HT-29 when treated with DHA standard, accompanied by a decrease in Bcl-XL expression and increase in Bax and Bak expressions. This outcome indicated that the cell apoptosis pathways may include both mitochondria and death receptor. Similarly, a dose-dependent increase in Bax expression and caspase-3 activity, as well as a dose-dependent decrease in Bcl-2 expression were observed in melanoma cells WM115 and WM266-4 when treated with DHA standard (0–30 μM).63
Conclusion
In conclusion, a GC-MS method was developed to determine 8 and 5 fatty acids in coffee oil and algae oil, respectively, with linoleic acid dominating in the former and DHA in the latter. A nanoemulsion composed of coffee oil, algae oil, Tween 80, Span 80, and deionized water was successfully prepared with the mean particle size being 30 and 36.7 nm by TEM and DLS analyses, respectively. A high stability of this nanoemulsion was shown over a 90-day storage period at 4°C. This nanoemulsion was efficient in ameliorating TEWL, skin erythema, and melanin formation, as well as subcutaneous blood flow rate during irradiation of mice. In addition, this nanoemulsion was effective in inhibiting melanoma cell growth with the cell cycle arrested at G2/M phase. The expressions of p53, p21, cyclin B, cyclin A, Bax, and cytochrome C were upregulated, while that of CDK1, CDK2, and Bcl-2 were downregulated in a dose-dependent manner, accompanied by an increase in the activities of caspase-3, caspase-8, and caspase-9 for apoptosis of melanoma cells B16-F10.
Acknowledgment
The authors wish to thank Mr Yen-Sheng Wu from Tzong Jao Hang’s Electron Microscope Laboratory, School of Medicine, Fu Jen Catholic University, Taipei, Taiwan for technical assistance in recording the transmission electron microscopic image.
Disclosure
The authors report no conflicts of interest in this work.
References
Speer K, Kölling-Speer I. The lipid fraction of the coffee bean. Braz J Plant Physiol. 2006;18:201–216. | ||
Al-Hamamre Z, Foerster S, Hartmann F, Kröger M, Kaltschmitt M. Oil extracted from spent coffee grounds as a renewable source for fatty acid methyl ester manufacturing. Fuel. 2012;96:70–76. | ||
Vardon DR, Moser BR, Zheng W, et al. Complete utilization of spent coffee grounds to produce biodiesel, bio-oil, and biochar. ACS Sust Chem Eng. 2013;1:1286–1294. | ||
de Oliveira PMA, de Almeida RH, de Oliveira NA, Bostyn S. Enrichment of diterpenes in green coffee oil using supercritical fluid extraction-characterization and comparison with green coffee oil from pressing. J Supercrit Fluids. 2014;95:137–145. | ||
Wagemaker TAL, Carvalho CRL, Maia NB, Baggio SR, Filho GO. Sun protection factor, content and composition of lipid fraction of green coffee beans. Ind Crops Prod. 2011;33:469–473. | ||
Martín MJ, Pablos F, González AG, Valdenebro MS, León-Camacho M. Fatty acid profiles as discriminant parameters for coffee varieties differentiation. Talanta. 2001;54:291–297. | ||
Choi SY, Lee KJ, Kim HG, et al. Protective effect of the coffee diterpenes kahweol and cafestol on tert-butyl hydroperoxide-induced oxidative hapatotoxicity. Bull Korean Chem Soc. 2006;27:1386. | ||
Velazquez Pereda MdealC, Dieamant GdeC, Eberlin S, et al. Effect of green Coffee arabica L. seed oil on extracellular matrix components and water-channel expression in in vitro and ex vivo human skin models. J Cosmet Dermatol. 2009;8:56–62. | ||
Wagemaker TA, Silva SA, Leonardi GR, Campos PMM. Green Coffee arabica L. seed oil influences the stability and protective effects of topical formulations. Ind Crops Prod. 2015;63:34–40. | ||
Klinkesorn U, Sophanodora P, Chinachoti P, McClements DJ, Decker EA. Increasing the oxidative stability of liquid and dried tuna oil-in-water emulsions with electrostatic layer-by-layer deposition technology. J Agric Food Chem. 2005;53:4561–4566. | ||
Gogus U, Smith C. n-3 Omega fatty acids: a review of current knowledge. Int J Food Sci Technol. 2010;45:417–436. | ||
Lorente-Cebrián S, Costa AG, Navas-Carretero S, et al. An update on the role of omega-3 fatty acids on inflammatory and degenerative diseases. J Physiol Biochem. 2015;71:341–349. | ||
Sharma S, Sarangdevot K. Nanoemulsions for cosmetics. Int J Adv Res Pharmaceut Biosci. 2012;1:408–415. | ||
McClements DJ. Nanoemulsions versus microemulsions: terminology, differences, and similarities. Soft Matter. 2012;8:1719–1729. | ||
American Psychological Association (APA). Guidelines for ethical Conduct in the Care and Use of Nonhuman Animals in Research. Washington, DC: APA Council of Representatives, Office of Research Ethics; 2012. | ||
Chang HB, Chen BH. Inhibition of lung cancer cells A549 and H460 by curcuminoid extracts and nanoemulsions prepared from Curcuma longa Linnaeus. Int J Nanomedicine. 2015;10:5059–5080. | ||
Statistical Analysis System (SAS). SAS Procedures and SAS/Graph User’s Guide, Version 6. Cary, NC: SAS Institute Inc; 2014. | ||
Goding J, Ragon D, O’Connor J, Boehm S, Hupp A. Comparison of GC stationary phases for the separation of fatty acid methyl esters in biodiesel fuels. Anal Bioanal Chem. 2013;405:6087–6094. | ||
Cruz R, Cardoso MM, Fernandes L, et al. Espresso coffee residues: a valuable source of unextracted compounds. J Agric Food Chem. 2012;60:7777–7784. | ||
Jenkins RW, Stageman NE, Fortune CM, Chuck CJ. Effect of the type of bean, processing, and geographical location on the biodiesel produced from waste coffee grounds. Energy Fuels. 2014;28:1166–1174. | ||
Ferrari M, Ravera F, De Angelis E, Liverani FS, Navarini L. Interfacial properties of coffee oils. Coll Surf A. 2010;365:79–82. | ||
Murthy PS, Naidu MM. Sustainable management of coffee industry by-products and value addition: a review. Resour Conserv Recycl. 2012;66:45–58. | ||
Nicolaou A, Pilkington SM, Rhodes LE. Ultraviolet-radiation induced skin inflammation: dissecting the role of bioactive lipids. Chem Phys Lipids. 2011;164:535–543. | ||
Peng LC, Liu C, Kwan CC, Huang KF. Optimization of water-in-oil nanoemulsions by mixed surfactants. Coll Surf A. 2010;370:136–142. | ||
Morral-Ruíz G, Solans C, García ML, García-Celma MJ. Formation of pegylated polyurethane and lysine-coated polyurea nanoparticles obtained from O/W nano-emulsions. Langmuir. 2012;28:6256–6264. | ||
Nam YS, Kim JW, Park J, et al. Tocopheryl acetate nanoemulsions stabilized with lipid-polymer hybrid emulsifiers for effective skin delivery. Colloids Surf B Biointerfaces. 2012;94:51–57. | ||
Wang JL, Dong XY, Wei F, et al. Preparation and characterization of novel lipid carriers containing microalgae oil for food applications. J Food Sci. 2014;79:E169–E177. | ||
Qu D, He J, Liu C, Zhou J, Chen Y. Triterpene-loaded microemulsion using Coix lacryma-jobi seed extract as oil phase for enhanced antitumor efficacy: preparation and in vivo evaluation. Int J Nanomedicine. 2014;9:109. | ||
Bernardi DS, Pereira TA, Maciel NR, et al. Formation and stability of oil-in-water nanoemulsions containing rice bran oil: in vitro and in vivo assessments. J Nanobiotechnol. 2011;9:1–9. | ||
Rao J, McClements DJ. Food-grade microemulsions and nanoemulsions: role of oil phase composition on formation and stability. Food Hydrocolloids. 2012;29:326–334. | ||
Qian C, Decker EA, Xiao H, McClements DJ. Physical and chemical stability of β-carotene-enriched nanoemulsions: influence of pH, ionic strength, temperature, and emulsifier type. Food Chem. 2012;132:1221–1229. | ||
Rao J, McClements DJ. Formation of flavor oil microemulsions, nanoemulsions and emulsions: influence of composition and preparation method. J Agric Food Chem. 2011;59:5026–5035. | ||
Silva HD, Cerqueira MÂ, Vincente AA. Nanoemulsions for food applications: development and characterization. Food Bioproc Technol. 2012;5:854–867. | ||
McCusker MM, Grant-Kels JM. Healing fats of the skin: the structural and immunologic roles of the ω−6 and ω−3 fatty acids. Clin Dermatol. 2010;28:440–451. | ||
Harrison GI, Young AR. Ultraviolet radiation-induced erythema in human skin. Methods. 2002;28:14–19. | ||
Wicks NL, Chan JW, Najera JA, Ciriello JM, Oancea E. UVA phototransduction drives early melanin synthesis in human melanocytes. Curr Biol. 2011;21:1906–1911. | ||
Alder BL, Friedman AJ. Nitric oxide therapy for dermatologic disease. Future Sci OA. 2015;1:FS037. | ||
Ribeiro H, Marto J, Raposo S, et al. From coffee industry waste materials to skin-friendly products with improved skin fat levels. Eur J Lipid Sci Technol. 2013;115:330–336. | ||
Wagemaker TA, Rijo P, Rodrigues L, Campos MP, Fernandes A, Rosado C. Integrated approach in the assessment of skin compatibility of cosmetic formulations with green coffee oil. Int J Cosmet Sci. 2015;37:506–510. | ||
Andrade LN, de Lima TM, Curi R, Castrucci AM. Toxicity of fatty acids on murine and human melanoma cell lines. Toxicol In Vitro. 2005;19:553–560. | ||
Chiu L, Tong K, Ooi V. Cytostatic and cytotoxic effects of cyclooxygenase inhibitors and their synergy with docosahexaenoic acid on the growth of human skin melanoma A-375 cells. Biomed Pharmacother. 2005;59:S293–S297. | ||
Kim N, Jeong S, Jing K, et al. Docosahexaenoic acid induces cell death in human non-small cell lung cancer cells by repressing mTOR via AMPK activation and P13K/Akt inhibition. BioMed Res Int. 2015; 2015:239764. | ||
Yang P, Cartwright C, Chan D, et al. Anticancer activity of fish oils against human lung cancer is associated with changes in formation of PGE2 and PGE3 and alteration of Akt phosphorylation. Mol Carcinog. 2014;53:566–577. | ||
Lee CYK, Sit WH, Fan ST, et al. The cell cycle effects of decosahexaenoic acid on human metastatic hepatocellular carcinoma proliferation. Int J Oncol. 2010;36:991–998. | ||
Kang KS, Wang P, Yamabe N, Fukui M, Jay T, Zhu BT. Docosahexaenoic acid induces apoptosis in MCF-7 cells in vitro and in vivo via reactive oxygen species formation and caspase 8 activation. PLoS One. 2010;5:e10296. | ||
Jeong S, Jing K, Kim N, et al. Docosahexaenoic acid-induced apoptosis is mediated by activation of mitogen-activated protein kinases in human cancer cells. BMC Cancer. 2014;14:481. | ||
Albino AP, Juan G, Traganos F, et al. Cell cycle arrest and apoptosis of melanoma cells by docosahexaenoic acid: association with decreased pRb phosphorylation. Cancer Res. 2000;60:4139–4145. | ||
Jordan A, Stein J. Effect of an omega-3 fatty acid containing lipid emulsion alone and in combination with 5-fluorouracil (5-FU) on growth of the colon cancer cell line Caco-2. Eur J Nutr. 2003;42:324–331. | ||
Siddiqui R, Jenski L, Harvey K, Wiesehen J, Stillwell W, Zaloga G. Cell-cycle arrest in Jurkat leukemia cells: a possible role for docosahesaenoic acid. Biochem J. 2003;371:621–629. | ||
Merendino N, Loppim B, D’Aquino M, et al. Decosahexaenoic acid induces apoptosis in the human PaCa-44 pancreatic cancer cell line by active reduced glutathione extrusion and lipid peroxidation. Nutr Cancer. 2005;52:225–233. | ||
Sun SN, Jia WD, Chen H, et al. Docosahexaenoic acid (DHA) induces apoptosis in human hepatocellular carcinoma cells. Int J Clin Exp Pathol. 2013;6:281–289. | ||
Baumgarter M, Sturlan S, Roth E, Wessner B, Bachleitner-Hofmann T. Enhancement of arsenic trioxide-mediated apoptosis using docosahexaenoic acid in arsenic trioxide-resistant solid tumor cells. Int J Cancer. 2004;112:707–712. | ||
Cai F, Sorg O, Granci V, et al. Interaction of ω−3 polyunsaturated fatty acids with radiation therapy in two different colorectal cancer cell lines. Clin Nutr. 2014;33:164–170. | ||
Wang Z, Fan M, Candas D, et al. Cyclin B1/CdK1 coordinates mitochondrial respiration for cell-cycle G2/M progression. Dev Cell. 2014;29:217–232. | ||
Davies TG, Tunnah T, Meijer L, et al. Inhibitor binding to active and inactive CDK2: the crystal structure of CDK2-cycclin A/indirubin-5-sulphonate. Structure. 2001;9:389–397. | ||
Marko D, Schätzle S, Friedel A, et al. Inhibition of cyclin-dependent kinase 1 (CDK1) by indrubin derivatives in human tumour cells. Br J Cancer. 2001;84:283–289. | ||
Chen ZY, Istfan N. Docosahexaenoic acid, a major constituent of fish oil diets, prevents activation of cyclin-dependent kinases and S-phase entry by serum stimulation of HT-29 cells. Prostaglandins Leukot Essent Fatty Acids. 2001;64:67–73. | ||
Barascu A, Besson P, Le Floch O, Bougnoux P, Jourdan ML. CDK1-cyclin B1 mediates the inhibition of proliferation induced by omega-3 fatty acids in MDA-MB-231 breast cancer cells. Int J Biochem Cell Biol. 2006;38:196–208. | ||
Slagsvold JE, Pettersen CH, Størvold GL, Follestad T, Krokan HE, Schønerg SA. DHA alters expression of target proteins of cancer therapy in chemotherapy resistant SW620 colon cancer cells. Nutr Cancer. 2010;62:611–621. | ||
Chiu LC, Wong EY, Ooi VE. Docosahexaenoic acid from a cultured microalga inhibits cell growth and induces apoptosis by upregulating Bax/Bcl-2 ratio in human breast carcinoma MCF-7 cells. Ann N Y Acad Sci. 2004;1030:361–368. | ||
Lee SE, Lim JW, Kim H. Activator protein-1 mediates docosahexaenoic acid-induced apoptosis of human gastric cancer cells. Ann N Y Acad Sci. 2009;1171:163–169. | ||
Giros A, Grzybowski M, Sohn VR, et al. Regulation of colorectal cancer apoptosis by the n-3 polyunsaturated fatty acids docosahexaenoic and Eicosapentaenoic. Cancer Prev Res. 2009;2:732–742. | ||
Serini S, Fasano E, Piccioni E, et al. DHA induces apoptosis and differentiation in human melanoma cells in vitro: involvement of HuR-mediated COX-2 mRNA stabilization and β-catenin nuclear translocation. Carcinogenesis. 2012;33:164–173. |
 © 2017 The Author(s). This work is published and licensed by Dove Medical Press Limited. The full terms of this license are available at https://www.dovepress.com/terms.php and incorporate the Creative Commons Attribution - Non Commercial (unported, v3.0) License.
By accessing the work you hereby accept the Terms. Non-commercial uses of the work are permitted without any further permission from Dove Medical Press Limited, provided the work is properly attributed. For permission for commercial use of this work, please see paragraphs 4.2 and 5 of our Terms.
© 2017 The Author(s). This work is published and licensed by Dove Medical Press Limited. The full terms of this license are available at https://www.dovepress.com/terms.php and incorporate the Creative Commons Attribution - Non Commercial (unported, v3.0) License.
By accessing the work you hereby accept the Terms. Non-commercial uses of the work are permitted without any further permission from Dove Medical Press Limited, provided the work is properly attributed. For permission for commercial use of this work, please see paragraphs 4.2 and 5 of our Terms.