")
Back to Journals » International Journal of Nanomedicine » Volume 9 » Issue 1
Preparation and properties of BSA-loaded microspheres based on multi-(amino acid) copolymer for protein delivery
Authors Chen X, Lv G, Zhang J, Tang S, Yan Y, Wu Z, Su J, Wei J
Received 4 November 2013
Accepted for publication 15 January 2014
Published 7 May 2014 Volume 2014:9(1) Pages 1957—1965
DOI https://doi.org/10.2147/IJN.S57048
Checked for plagiarism Yes
Review by Single anonymous peer review
Peer reviewer comments 3
Xingtao Chen,1 Guoyue Lv,1 Jue Zhang,2 Songchao Tang,2 Yonggang Yan,1 Zhaoying Wu,2 Jiacan Su,2 Jie Wei2
1College of Physical Science and Technology, Sichuan University, Chengdu, 2Key Laboratory for Ultrafine Materials of Ministry of Education, East China University of Science and Technology, Shanghai, People’s Republic of China
Abstract: A multi-(amino acid) copolymer (MAC) based on ω-aminocaproic acid, γ-aminobutyric acid, L-alanine, L-lysine, L-glutamate, and hydroxyproline was synthetized, and MAC microspheres encapsulating bovine serum albumin (BSA) were prepared by a double-emulsion solvent extraction method. The experimental results show that various preparation parameters including surfactant ratio of Tween 80 to Span 80, surfactant concentration, benzyl alcohol in the external water phase, and polymer concentration had obvious effects on the particle size, morphology, and encapsulation efficiency of the BSA-loaded microspheres. The sizes of BSA-loaded microspheres ranged from 60.2 µm to 79.7 µm, showing different degrees of porous structure. The encapsulation efficiency of BSA-loaded microspheres also ranged from 38.8% to 50.8%. BSA release from microspheres showed the classic biphasic profile, which was governed by diffusion and polymer erosion. The initial burst release of BSA from microspheres at the first week followed by constant slow release for the next 7 weeks were observed. BSA-loaded microspheres could degrade gradually in phosphate buffered saline buffer with pH value maintained at around 7.1 during 8 weeks incubation, suggesting that microsphere degradation did not cause a dramatic pH drop in phosphate buffered saline buffer because no acidic degradation products were released from the microspheres. Therefore, the MAC microspheres might have great potential as carriers for protein delivery.
Keywords: poly (amino acid) copolymer, release, degradation
Introduction
During the past decades, many researchers have paid much attention to exploring drug delivery systems with a longer parenteral dosing interval, which would increase patient acceptance and improve drug management.1,2 With the development of biotechnology, many pharmacologically active peptides and proteins are becoming good candidates for use as therapeutic agents for treatment.3 Most proteins are relatively large molecules with complex architecture, and they are very sensitive to environmental conditions. Moreover, most of these proteins have short half-lives in body fluid and must be administered frequently in high doses to obtain therapeutic efficacy.4 Thus, there has been considerable interest in developing effective delivery devices for proteins in order to provide their controllable release as well as maintain their structural integrity.
With the development of modern microencapsulation of bioactive agents, drug-loaded microspheres made of biodegradable polymers have become one of the most important delivery devices for therapeutic proteins.5 Both natural and synthetic degradable polymers have been investigated for drug release. Among these polymers, poly (lactic acid) (PLA), poly (lactic-co-glycolic acid) (PLGA), chitosan, etc, were found to be remarkable for their application in drug delivery due to their excellent biocompatibility and degradability.6,7 PLA and PLGA, degradable polymers approved by the US Food and Drug Administration, have been widely investigated for drug delivery applications.6 However, the acidic micromilieu caused by the degradation products of PLA and PLGA microspheres could potentially lead to deterioration of proteins, including denaturation, aggregation, and even chemical degradation. In addition, the decrease in pH value of the adjacent microenvironment often induces side effects such as inflammation.8,9 Hence, it is necessary to explore new degradable polymers with good biocompatibility to prevent encapsulated proteins from losing their biological activity.
Microspheres containing protein or peptide have been widely used as drug-release devices for the treatment of human diseases and animal health.1,2 A fundamental understanding of the relationship between the size of microspheres, encapsulation efficiency, and protein-release property is essential to design microsphere delivery systems.7,8 Poly (α-L-amino acids) copolymers based on α-L-amino acids can degrade into their original monomers, and has been proved to be biocompatible, less acidic, and absorbable as nutriments when used as biomedical materials.10–12 Multi-(amino acid) copolymer (MAC) is the ideal degradable polymers, which has been investigated as biomaterials for bone repair and drug carriers.13,14 Compared to the most widely used PLGA, MAC can prevent moisture-induced protein aggregation. Also, the pH value of the degrading medium does not drop as severely as that of PLGA, thus providing a more suitable microclimate for protein molecules.9 In the present study, a MAC composed of six amino acids including Ω-aminocaproic acid, γ-aminobutyric acid, L-alanine, L-lysine, L-glutamate, and hydroxyproline was synthetized, and MAC microspheres loaded with bovine serum albumin (BSA) were prepared by a double-emulsion solvent extraction method. The aim of this study was to investigate the size, morphology, encapsulation efficiency, in vitro protein release, and degradation of BSA-loaded microspheres based on MAC.
Materials and methods
Preparation of MAC
MAC was synthesized by an acid-catalyzed condensation reaction. Briefly, 78.7 g ω-aminocaproic acid, 18.6 g γ-aminobutyricacid, 10.7 g L-alanine, 7.3 g L-lysine, 2.9 g L-glutamate, 3.9 g hydroxyproline, and 50 mL deionized water were added into a 250 mL three-necked flask. Phosphorus acid (0.5 mL of concentration 1 mol/L) was used as the catalyst and N2 was introduced into the flask in order to avoid undesirable oxidation reactions in high temperature. The mixture was heated to 200°C with continuous stirring until the water in the flask was fully evaporated. The reaction was then carried out at 210°C for 1 hour and continued at 220°C for an additional 1 hour, and then the MAC was collected. After cooling to room temperature, the obtained MAC was comminuted with a grinder and then repeatedly washed, first with excess amounts of ethanol and then with deionized water. The Ω-aminocaproic acid, γ-aminobutyric acid, L-alanine, L-lysine, L-glutamate, and hydroxyproline were all purchased from Shijiazhuang Kairuijie Science&Technology Co., Ltd (Shijiazhuang, People’s Republic of China).
Preparation of BSA-loaded microspheres
The BSA-loaded MAC microspheres were fabricated by a double-emulsion solvent extraction method. Briefly, 1 mL of a 50 mg/mL solution of BSA (Chengdu Xiya Chemical Technology Co, Chengdu, People’s Republic of China) was emulsified into a 10 mL polymer/benzyl alcohol solution for 2 minutes while stirring at about 2,000 rpm with a magnetic stirrer. The BSA solution served as the internal water phase, and the polymer solution served as the oil phase for the primary emulsion.
The w/o emulsion was dispersed into 150 mL benzyl alcohol-saturated aqueous phase including the surfactant mixture of Span 80 and Tween 80 with an emulsifying machine (JRJ300-S; Shanghai Specimen Model Factory, Shanghai, People’s Republic of China) and stirred at 800 rpm for 2 minutes. This water/oil/water emulsion was then poured into 850 mL of the external water phase and stirred gently with a mechanical agitator for 2 hours to extract benzyl alcohol from the oil phase. The acquired microspheres containing BSA were filtered out and subsequently washed three times first with deionized water and then with ethanol. The BSA-loaded microspheres were then vacuum dried overnight and stored at 4°C for further investigation. The MAC microspheres without BSA load were prepared using deionized water as the internal water phase.
In order to investigate the effect of parameters on the particle size and morphology encapsulation efficiency of BSA-loaded microspheres, the following parameters and operating conditions were investigated: type of surfactant (a mixture of surfactant with different ratios of Tween 80 to Span 80 of 4:1, 7:3, and 3:2), type of external water phase (the presence or absence of extra benzyl alcohol), polymer concentration of the oil phase (90, 120, and 150 mg/mL), and mixtures of surfactants Tween 80 and Span 80 with different concentration (0.9%, 1.2%, and 1.5%).
Particle size and morphology of BSA-loaded microspheres
The mean particle size of the BSA-loaded microspheres was determined by a laser particle size analyzer (JL-1177; Chengdu Jingxin Powder Analyzer Instruments Co, Chengdu, People’s Republic of China). The microspheres were suspended in deionized water followed by sonication at a voltage of 60 W for 60 seconds prior to measurement. The morphology of the BSA-loaded MAC microspheres was observed by scanning electron microscopy (SEM) (S-450; Hitachi Ltd, Tokyo, Japan). Dried microspheres were mounted onto metal stubs with double-sided adhesive tape and then coated with gold in a vacuum prior to observation. In addition, the MAC, MAC microspheres, and BSA-loaded microspheres were analyzed by Fourier transform infrared spectrometry (FTIR) (Nicolet 6700; Thermo Fisher Scientific, Waltham, MA, USA) and X-ray diffraction (XRD) using an X’Pert Pro MPD diffractometer (PANalytical, Almelo, the Netherlands).
Determination of BSA content in the microspheres
The Bradford method was adopted to determine the actual contents of BSA in MAC microspheres after the extraction of BSA from the microspheres. Dried microspheres (10 mg) were dissolved in 1 mL benzyl alcohol followed by the addition of 9 mL distilled water and then vigorously shaken for 12 hours to extract BSA into the aqueous phase from the organic solution. After centrifugation at 2,000 rpm, the aqueous solution was used to determine the BSA content. The BSA concentration in the solutions was analyzed by the coomassie brilliant blue G250 protein assay. All experiments were run in triplicate, and the data are shown as mean ± standard deviation (SD). The encapsulation efficiency was calculated using the formula,

BSA release from microsphere and degradation
BSA-loaded microspheres (100 mg) were dispersed in a 10 mL capped centrifuge tube containing 8 mL phosphate buffered saline (PBS) (pH=7.4) and incubated at 37°C in a shaking water bath set at 70 rpm. At intervals of 1, 2, 4, 6, and 8 weeks of incubation, samples were centrifuged at 2,000 rpm for 5 minutes, and 4 mL of each supernatant was replaced with an equal amount of fresh PBS. The BSA concentrations in the supernatants were determined using the coomassie brilliant blue G250 protein microassay. The BSA-release profile from the microspheres was generated in terms of cumulative release percentage versus incubation time.
The obtained precipitates were washed with distilled water, vacuum dried, and weighed. The weight loss was calculated as the mass percentage of each sample prior to and after incubation. The pH values of the supernatants were tested with a pH meter (PS-25; Shanghai Leici Chuangyi Apparatus and Instrument Co, Shanghai, People’s Republic of China).
Statistical analysis
Statistical analysis was performed using one-way ANOVA with post hoc tests. All samples were run in triplicate and the data points are expressed as mean ± SD.
Results and discussions
XRD and FTIR analysis of BSA-loaded microspheres
Figure 1 shows the XRD spectra of MAC, MAC microspheres, and BSA-loaded MAC microspheres. MAC had two crystalline peaks at 2θ=19.9° and 2θ=23.5°, which agreed with previous studies.14,15 The intensity of the two peaks in the MAC microspheres and BSA-loaded microspheres decreased significantly compared to the MAC raw material. The results suggest that crystallinity of the microspheres decreased throughout the double-emulsion solvent extraction process after the formation of microspheres because the solvent evaporated rapidly in a short time, and the copolymer crystallized and had loose structure in the inner water phase.16 The two peaks at 2θ=19.9° and 2θ=23.6° in the MAC microspheres were close to the peaks at 2θ=20.1° and 2θ=23.8° in BSA-loaded microspheres, which were also similar to the two peaks in the MAC. Therefore, no new peaks occurred among the three samples, suggesting that their basic crystal structure was not changed when the microspheres formed.
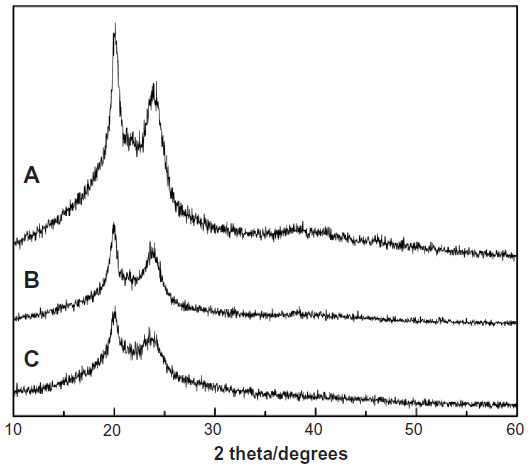 | Figure 1 XRD of MAC (A), MAC microsphere (B), and BSA-loaded microspheres (C). |
Figure 2 shows the FTIR spectra of MAC, MAC microspheres, and BSA-loaded MAC microspheres. The peaks at 2,931 cm−1 and 2,861 cm−1 were typical of C-H stretch vibration. A broad absorption band at 3,431 cm−1 was attributed to the stretching vibration of -NH2 while the peaks at 1,639 cm−1, 1,549 cm−1, and 1,266 cm−1 corresponded to I, II, and III, respectively. Compared to MAC, the peak of -NH2 stretching vibration in both unloaded and BSA-load microspheres shifted from 3,431 cm−1 to 3,303 cm−1 and became wider, implying that hydrogen bonds in the microspheres significantly decreased. No obvious differences were found among the MAC, unloaded, and BSA-loaded microspheres, indicating that the basic chemical bond of the MAC was not altered by the process of fabricating microspheres through the double-emulsion method.
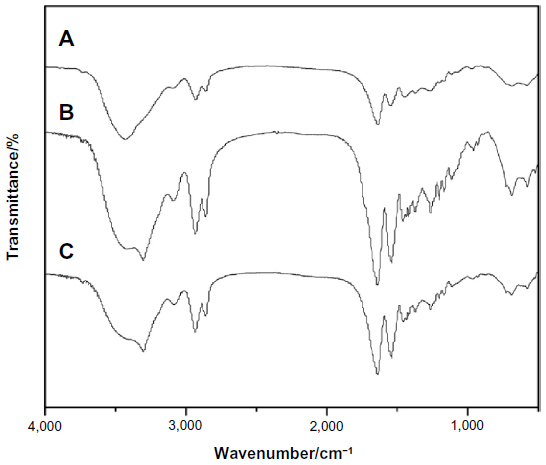 | Figure 2 FTIR of MAC (A), MAC microsphere (B), and BSA-loaded (C) microspheres. |
No significant change in the bands was found in the spectra of the BSA-loaded microspheres. The FTIR spectrum of BSA had an amide carbonyl group at 1,658 cm−1 and a carboxyl group at 1,539 cm−1. Due to similar basic chemical bonds (amide bond) resulting in similar characteristic absorption peaks, no distinct peaks corresponding to BSA were found in the BSA-loaded microspheres compared to the MAC microspheres. Therefore, the MAC microspheres could certainly envelop BSA, and strong chemical interactions between BSA and MAC were absent.
Particle size, morphology, and encapsulation efficiency of BSA-loaded microspheres
Effects of surfactant ratio
Table 1 shows the effects of the surfactant ratio of Tween 80 to Span 80 on particle size and encapsulation efficiency of BSA-loaded microspheres with a polymer concentration of 120 mg/mL and surfactant concentration of 1.5 w%. The mean size of BSA-loaded microspheres decreased with the decrease of the surfactant ratio of Tween 80 to Span 80 (4:1, 7:3, and 3:2). In addition, the encapsulation efficiency of BSA-loaded microspheres increased with the decrease of the mean size of microspheres. When the ratio of Tween 80 to Span 80 was 4:1, the mean size of microspheres was 70.6 μm, which yielded the lowest encapsulation efficiency of 38.5%. However, when the ratio of Tween 80 to Span 80 was 3:2, the mean size of microspheres was 65.7 μm, which attained the highest encapsulation efficiency at 46.9%. The results indicate that the ratio of Tween 80 to Span 80 had obvious effects on the particle size and encapsulation efficiency of BSA-loaded microspheres because the mixture of surfactant of Tween 80 and Span 80 was essential for the droplets to be well formed, and the ratio of Tween 80 to Span 80 played an important role in the different water/oil/water emulsions. The particle size of microspheres was related to the surfactant ratio used in the mixture preparation of the inner emulsion. When the inner emulsion was prepared by probe sonication, the overall microsphere size was much smaller.
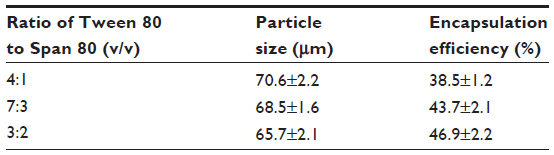 | Table 1 Effects of surfactant ratio of Tween 80 to Span 80 on the particle size and encapsulation efficiency of BSA-loaded microspheres |
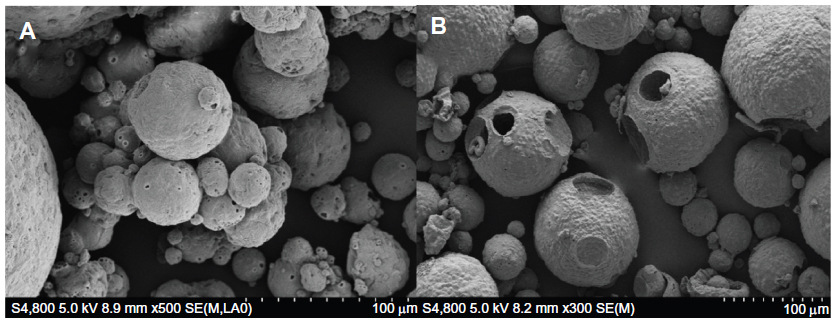
Figure 3 shows the SEM images of morphology of BSA-loaded microspheres prepared with surfactant Tween 80 to Span 80 ratios of 4:1, 7:3, and 3:2. Different surface structures of microspheres appeared to correspond to different surfactant ratios. BSA-loaded microspheres displayed well-shape spheres with corrugated and compact surfaces when the surfactant ratio of Tween 80 to Span 80 was 3:2, as shown in Figure 3A and B. However, the BSA-loaded microspheres presented more irregular shape and rough surface structure when the ratio was 7:3 (Figure 3C). Furthermore, the surface BSA-loaded microspheres got even rougher and more folded when the ratio was 4:1 (Figure 3D). A clear trend was observed of decreasing size of microspheres as the surfactant ratio of Tween 80 to Span 80 decreased. The results revealed that the mixture of surfactant ratio of Tween 80 to Span 80 of 3:2 yielded the double emulsion with the best stability, hindered BSA diffusion into the external water phase, and attained the highest encapsulation efficiency.
 | Figure 3 SEM images of morphology of BSA-loaded microspheres prepared with different surfactant ratios of Tween 80 to Span 80 of 3:2 (A and B), 7:3 (C), and 4:1 (D). |
Effects of benzyl alcohol in external water phase
Figure 4 shows SEM images of morphology of BSA-loaded microspheres with benzyl alcohol in the solidification step and without benzyl alcohol in the external water phase in the emulsification step. Some pores were observed on the two types of microspheres surfaces, and the surfaces of the microspheres were wrinkled and porous when extra benzyl alcohol was added into the aqueous phase (Figure 4A). Furthermore, the microspheres showed over-porous surfaces with big holes when no benzyl alcohol was present in the external water phase in the emulsification step (Figure 4B).
 | Figure 4 SEM images of morphology of BSA-loaded microspheres with benzyl alcohol in the solidification step (A) and without benzyl alcohol in the external water phase in the emulsification step (B). |
Table 2 shows the effects of the addition of benzyl alcohol on particles size and encapsulation efficiency of BSA-loaded microspheres with the surfactant ratio of 3:2 and polymer concentration of 120 mg/mL. The mean particle size of the BSA-loaded microspheres was of 66.1 μm and encapsulation efficiency was of 26.4% when extra benzyl alcohol was added into the aqueous phase. However, the particle size of the BSA-loaded microspheres was of 73.7 μm and encapsulation efficiency was 23.2% when benzyl alcohol absent. The results show that the particle size decreased and the encapsulation efficiency increased when benzyl alcohol was added in the external water phase in the emulsification step.
 | Table 2 Effects of addition of benzyl alcohol on particle size and encapsulation efficiency of BSA-loaded microspheres |
It can be suggested that the presence of benzyl alcohol may have prolonged the solidification period, which provided more time for BSA leakage, and a large quantity of solvent present in the continuous phase facilitated the diffusion of BSA into the continuous phase while the aggregation of the droplets evidently did not occur.17 However, in the absence of benzyl alcohol, the solvent extraction rate was too rapid for the microspheres to be well formed, and more BSA was entrained into the continuous phase by the higher mass flux of solvent, which was driven by the diffusion from the dispersed phase into the continuous phase.18
Effects of surfactant concentration
Surfactant concentration in the external water phase is known to be an important factor influencing the characteristics of the microspheres.19 Table 3 lists the particle size and encapsulation efficiency of BSA-loaded microspheres prepared with different surfactant concentration (0.9%, 1.2%, and 1.5%) when the polymer concentration was 120 mg/mL and the surfactant ratio of Tween 80 to Span 80 was 3:2. As shown in Table 3, the increasing surfactant concentration in the external water phase significantly reduced the particle size of BSA-loaded microspheres. A higher surfactant concentration could increase the stability of emulsion droplets formed during homogenization because the increased viscosity of the external water phase would prevent emulsion droplets from coalescing and result in smaller emulsion droplets and microspheres.20 These emulsion droplets gradually hardened to form microspheres as the solvent in the emulsion droplets continued to evaporate. Therefore, the size of the microspheres relied on the size of the emulsion droplets formed during homogenization. In addition, higher surfactant concentration increased the viscosity of the external water phase and yielded a more stable emulsion, resulting in increased difficulty for the BSA solution to diffuse out.21 Therefore, the smaller sizes of microspheres would cause lower encapsulation efficiency.
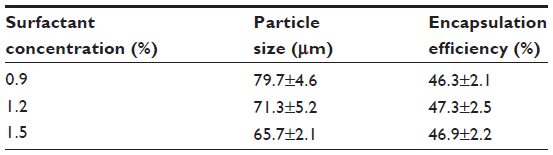 | Table 3 Effects of ratio of surfactant concentration on particle size and encapsulation efficiency of BSA-loaded microspheres |
Increased surfactant concentration significantly reduced the microsphere sizes while the encapsulation efficiency did not increase accordingly. The maximum encapsulation efficiency of 46.9% was obtained when surfactant concentration was 1.5% (Table 3). This might be due to the role surfactant played. Below a critical concentration, the amount of surfactant in the medium was not enough to stabilize the microspheres, and thus some of the BSA was dissolved in the aqueous phase and was lost before the solvent evaporated. On the other hand, when the amount of surfactant exceeded the critical level, it coated all the surfaces excessively and might have interacted with available free BSA during microspheres formation that would have leaked into the aqueous phase.22
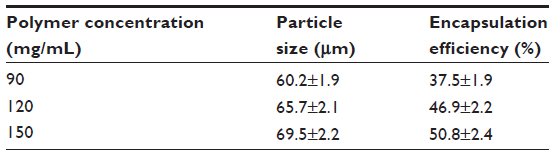
Effects of polymer concentration
Table 4 shows the effects of polymer concentration on the size and encapsulation efficiency of BSA-loaded microspheres with a surfactant ratio of Tween 80 to Span 80 of 3:2 and a surfactant concentration of 1.5 w%. The size of the BSA-loaded microspheres increased with increasing polymer concentrations of 90, 120, and 150 mg/mL (Table 4). In addition, the encapsulation efficiency of BSA-loaded microspheres increased with increasing polymer concentration. The average size of microspheres was 69.5 μm when the polymer concentration was 150 mg/mL, which yielded the highest encapsulation efficiency of 50.8%. However, the average size of microspheres was 60.2 μm when the polymer concentration was 90 mg/mL, which could attain the highest encapsulation efficiency of 37.5%. The results indicate that the polymer concentration had a greater impact on the size and encapsulation efficiency of BSA-loaded microspheres.
 | Table 4 Effects of polymer concentration on particle size and encapsulation efficiency of BSA-loaded microspheres |
Polymer concentration is a key factor influencing the characteristics of microspheres. The high polymer concentration increased the mean size as well as the encapsulation efficiency, which was in accordance with many other studies.19,21,23 An increase in polymer concentration would increase the viscosity of the dispersed phase, leading to bigger droplets and decelerating the diffusion rate of BSA into to the external water phase.17,23 Therefore, the viscosity of the polymer solution had a significant effect on the size of the microspheres. The solidification of microspheres was faster at higher polymer concentration, which might result in a viscous polymer layer at the microsphere droplet, and it hindered the diffusion of BSA into the external water phase. As a consequence, higher polymer concentration yielded higher encapsulation efficiency of BSA.
BSA release from microspheres and microsphere degradation
BSA release from microspheres
Figure 5 shows the release-time profiles of BSA from microspheres prepared with different polymer concentrations (90, 120, and 150 mg/mL) into PBS. The slope of the release curves of microspheres increased as the polymer concentration decreased, and the BSA released from all of the microspheres showed a massive initial burst of BSA, which reached a plateau during the first week and continued to be slowly released from the microsphere for another 7 weeks. A relatively fast release of BSA within the first week was attributed to the presence of BSA on the microsphere surfaces. Afterwards, about 7 weeks of sustained release occurred due to diffusion, followed by a slow release related to the erosion of the copolymer. BSA release from microspheres with a polymer concentration of 90 mg/mL was the fastest among all formulations, with 32.5% of the protein released within 1 week while the percent protein release from microspheres with polymer concentrations of 120 mg/mL and 150 mg/mL was 25.5% and 22.5%, respectively (Figure 5).
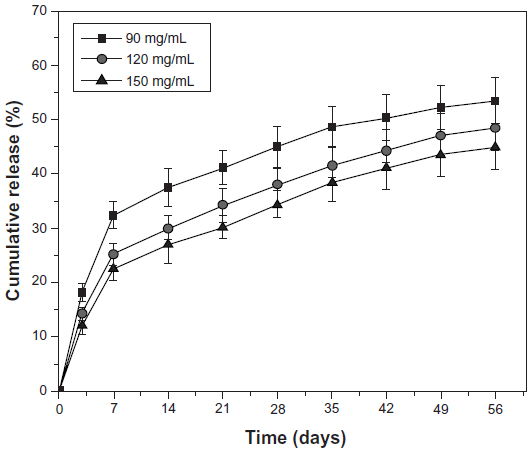 | Figure 5 Profiles of BSA release from microspheres prepared with different polymer concentrations into PBS over time. |
The lower polymer concentration yielded microspheres with a more rapid release profile, particularly a fast initial burst release. This might be caused by three factors: 1) microspheres resulting from a low polymer concentration were smaller and had a shorter pathway for diffusion;24 2) the internal aqueous droplets in the low polymer concentration solution could coalesce together more easily, leading to bigger pores within the microspheres;19,21 and 3) the solidification process of the low polymer concentration solution was prolonged and yielded a loose structure of microspheres. The results show that BSA release from the microspheres was governed by two mechanisms: diffusion of the BSA through the polymeric matrix and liberation from the matrix with polymer erosion. After the BSA absorbed on the microsphere surfaces was liberated, BSA release was controlled by diffusion through a swelling matrix related to water absorption. The rest release superimposed the polymer erosion and often became extremely slow.25,26
The in vitro release of BSA showed that the polymer concentration played an important role in controlling the release from the microspheres. A higher polymer concentration resulted in a microsphere layer with higher density and thickness. As a consequence, the diffusion of BSA through the microsphere layers was slowed down, resulting in a lower release ratio and more sustained delivery of the payload. Similarly, a thicker layer of microspheres delayed the degradation of the microspheres thus additionally slowing down the release of the encapsulated proteins. Therefore, the polymer concentration is an effective tool to modulate release of proteins from microspheres.
Degradation of microspheres and pH change of PBS
The degradation experiments of unloaded and BSA-loaded MAC microspheres were conducted by testing the weight loss ratio and the pH value change of PBS as a function of the incubation time. Figure 6 shows the degradation profiles based on weight loss data. Both unloaded and BSA-loaded microspheres showed a rapid weight loss rate during the first week, followed by a slightly slow weight loss until the end of incubation time. After 1 week of degradation, the cumulative percentage weight loss was approximately 15 w% for the two cases. No obvious differences for weight loss were found between unloaded and BSA-loaded microspheres. The results indicate that the microspheres loaded with BSA had no obvious effects on the degradation because of a small amount of BSA in the microspheres.
 | Figure 6 Weight loss of unloaded and BSA-loaded microspheres in PBS over time |
Figure 7 shows the change of pH values in the PBS during the degradation of unloaded and BSA-loaded microspheres with time. The pH values of the incubation fluids decreased to approximately 7.1 during the 1-week degradation. After 1 week, the pH values tended to slightly decrease while remaining higher than 7.0 until the end of incubation time. No significant difference due to pH value change was observed between the unloaded and BSA-loaded microspheres soaking in PBS for 8 weeks. Proteins are complex three-dimensional molecules, whose higher-order structure as well as function is prone to chemical and physical alterations. Therefore, the environment of a protein delivery vehicle is a critical parameter for protein release. Biodegradable polymeric microspheres used in protein delivery could protect the protein from the physiological environment.27
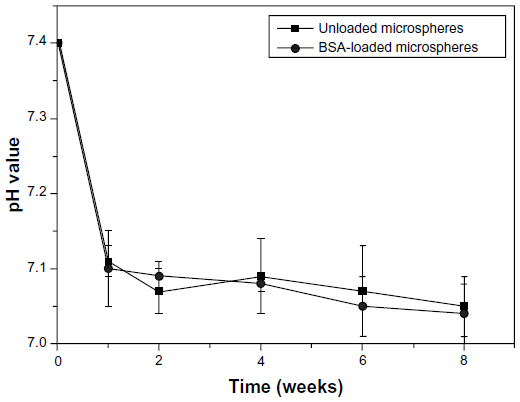 | Figure 7 Change of pH in PBS after immersion of unloaded microspheres and BSA-loaded microspheres over time. |
PLGA microsphere degradation caused a dramatic pH drop in the release medium after incubation.26,28 Unlike PLGA, a relatively neutral pH was retained in the PBS for BSA-loaded microspheres formulations, thus providing a suitable environment for proteins. Clearly, almost no acidic degradation products were released from the BSA-loaded microspheres, and thus no acidic micromilieu would be produced. Accordingly, protein denaturation and inflammatory responses might not occur when BSA-loaded microspheres are implanted in vivo. In short, the BSA-loaded MAC microspheres might have great potential as carriers for protein delivery.
Conclusion
Protein-based therapies are becoming increasingly prevalent. In this study, a degradable MAC was synthesized and the BSA-loaded microspheres were fabricated by a double-emulsion method. The results show that several parameters including the surfactant ratio of Tween 80 to Span 80, surfactant concentration, addition of benzyl alcohol in the external water phase, and polymer concentration had significant effects on the particle size, morphology, and encapsulation efficiency of the BSA-loaded microspheres. The particle size of the microspheres ranged from 60.2 μm to 79.7 μm and showed different degrees of porous structure depending on the different preparation parameters. BSA release from microspheres showed the classic biphasic profile, which was governed by diffusion and polymer erosion. BSA-loaded microspheres could degrade gradually in PBS buffer, and the pH values of the solution remained higher than 7.0 until the end of incubation time. In short, the MAC was successfully applied as matrix materials for protein-loaded microspheres, and BSA-loaded microspheres showed their potential application as release devices for protein delivery.
Acknowledgments
The authors are grateful for the financial support from the International Cooperation Project of the Ministry of Science and Technology of China (2013DFB50280), the National Natural Science Foundation of China (No 81271705, 51173041, 31271031), the Nano Special Program of Science and Technology Development of Shanghai (No 12nm0500400), and the Key Medical Program of Science and Technology Development of Shanghai (No 12441903600).
Disclosure
The authors report no conflicts of interest in this work.
References
Sinha VR, Trehan A. Biodegradable microspheres for protein delivery. J Control Release. 2003;90(3):261–280. | |
Dai C, Wang B, Zhao H. Microencapsulation peptide and protein drugs delivery system. Colloids Surf B Biointerfaces. 2005;41(2–3):117–120. | |
Rafati A, Boussahel A, Shakesheff KM, et al. Chemical and spatial analysis of protein loaded PLGA microspheres for drug delivery applications. J Control Release. 2012;162(2):321–329. | |
Freiberg S, Zhu XX. Polymer microspheres for controlled drug release. Int J Pharm. 2004;282(1–2):1–18. | |
Zeng W, Huang J, Hu X, et al. Ionically cross-linked chitosan microspheres for controlled release of bioactive nerve growth factor. Int J Pharm. 2011;421(2):283–290. | |
Shive MS, Anderson JM. Biodegradation and biocompatibility of PLA and PLGA microspheres. Adv Drug Del Rev. 1997;28(1):5–24. | |
Nath SD, Son S, Sadiasa A, Min YK, Lee BT. Preparation and characterization of PLGA microspheres by the electrospraying method for delivering simvastatin for bone regeneration. Int J Pharm. 2013;443(1–2):87–94. | |
Wang M, Feng Q, Niu X, Tan R, She Z. A spheres-in-sphere structure for improving protein-loading poly(lactide-co-glycolide) microspheres. Polym Degrad Stabil. 2010;95(1):6–13. | |
Lee ES, Park KH, Kang D, et al. Protein complexed with chondroitin sulfate in poly(lactide-co-glycolide) microspheres. Biomaterials. 2007;28(17):2754–2762. | |
Zhang W. Synthesis and characterization of biodegradable copolymers based on 6-aminocaproic acid and α-L-alanine. Polym Bull. 2008;60(2):323–330. | |
Leopold CS, Friend DR. In vitro study for the assessment of poly(L-aspartic acid) as a drug carrier for colon-specific drug delivery. Int J Pharm. 1995;126(1):139–145. | |
Zhang W, Huang Y. Biodegradable copoly(amino acid)s based on 6-aminocaproic acid and L-leucine. J Polym Environ. 2011;19(1):177–181. | |
Li H, Yan Y, Wei J, et al. Bone substitute biomedical material of multi-(amino acid) copolymer: in vitro degradation and biocompatibility. J Mater Sci Mater Med. 2011;22(11):2555–2563. | |
Zhao Z, Shan W, Zhang Y, Li X, Ma J, Yan Y. Fabrication and properties of degradable poly(amino acid)/nano hydroxyapatite bioactive composite. J Appl Polym Sci. 2012;125(4):2502–2509. | |
Jiang J, Zhao Z, Guo Y, Yan Y, Wu D. Syntheses and evaluation of copolymer 6-aminohexanoic acid and 4R-hydroxy-L-proline for bone repair. Advanced Materials Research. 2012;562–564:506–511. | |
Izumikawa S, Yoshioka S, Aso Y, Takeda Y. Preparation of poly(l-lactide) microspheres of different crystalline morphology and effect of crystalline morphology on drug release rate. J Control Release. 1991;15(2):133–140. | |
Freytag T, Dashevsky A, Tillman L, Hardee GE, Bodmeier R. Improvement of the encapsulation efficiency of oligonucleotide-containing biodegradable microspheres. J Control Release. 2000;69(1):197–207. | |
Li M, Rouaud O, Poncelet D. Microencapsulation by solvent evaporation: state of the art for process engineering approaches. Int J Pharm. 2008;363(1–2):26–39. | |
Yang YY, Chung TS, Ng NP. Morphology, drug distribution, and in vitro release profiles of biodegradable polymeric microspheres containing protein fabricated by double-emulsion solvent extraction/evaporation method. Biomaterials. 2001;22(3):231–241. | |
Ito F, Fujimori H, Makino K. Factors affecting the loading efficiency of water-soluble drugs in PLGA microspheres. Colloids Surf B Biointerfaces. 2008;61(1):25–29. | |
Yamada T, Onishi H, Machida Y. Sustained release ketoprofen microparticles with ethylcellulose and carboxymethylethylcellulose. J Control Release. 2001;75(3):271–282. | |
Yu Y, Lu T, Zhao W, Sun W, Chen T. Preparation and characterization of BSA-loaded microspheres based on polyanhydrides. J Appl Polym Sci. 2011;121(1):352–358. | |
Yang CY, Tsay SY, Tsiang RC. An enhanced process for encapsulating aspirin in ethyl cellulose microcapsules by solvent evaporation in an O/W emulsion. J Microencapsul. 2000;17(3):269–277. | |
Falco N, Reverchon E, Della Porta G. Injectable PLGA/hydrocortisone formulation produced by continuous supercritical emulsion extraction. Int J Pharm. 2013;441(1–2):589–597. | |
Faisant N, Akiki J, Siepmann F, Benoit JP, Siepmann J. Effects of the type of release medium on drug release from PLGA-based microparticles: experiment and theory. Int J Pharm. 2006;314(2):189–197. | |
Ford Versypt AN, Pack DW, Braatz RD. Mathematical modeling of drug delivery from autocatalytically degradable PLGA microspheres – a review. J Control Release. 2013;165(1):29–37. | |
Bilati U, Allémann E, Doelker E. Strategic approaches for overcoming peptide and protein instability within biodegradable nano- and microparticles. Eur J Pharm Biopharm. 2005;59(3):375–388. | |
Chi EY, Krishnan S, Randolph TW, Carpenter JF. Physical stability of proteins in aqueous solution: mechanism and driving forces in nonnative protein aggregation. Pharm Res. 2003;20(9):1325–1336. |
 © 2014 The Author(s). This work is published and licensed by Dove Medical Press Limited. The full terms of this license are available at https://www.dovepress.com/terms.php and incorporate the Creative Commons Attribution - Non Commercial (unported, v3.0) License.
By accessing the work you hereby accept the Terms. Non-commercial uses of the work are permitted without any further permission from Dove Medical Press Limited, provided the work is properly attributed. For permission for commercial use of this work, please see paragraphs 4.2 and 5 of our Terms.
© 2014 The Author(s). This work is published and licensed by Dove Medical Press Limited. The full terms of this license are available at https://www.dovepress.com/terms.php and incorporate the Creative Commons Attribution - Non Commercial (unported, v3.0) License.
By accessing the work you hereby accept the Terms. Non-commercial uses of the work are permitted without any further permission from Dove Medical Press Limited, provided the work is properly attributed. For permission for commercial use of this work, please see paragraphs 4.2 and 5 of our Terms.