")
Back to Journals » International Journal of Nanomedicine » Volume 9 » Issue 1
Preparation and evaluation of microemulsion-based transdermal delivery of total flavone of rhizoma arisaematis
Authors Shen L, Zhang Y, Wang Q, Xu L, Feng N
Received 19 April 2014
Accepted for publication 25 May 2014
Published 22 July 2014 Volume 2014:9(1) Pages 3453—3464
DOI https://doi.org/10.2147/IJN.S66524
Checked for plagiarism Yes
Review by Single anonymous peer review
Peer reviewer comments 4
Li-Na Shen,1 Yong-Tai Zhang,1 Qin Wang,2 Ling Xu,2 Nian-Ping Feng1
1Department of Pharmaceutical Sciences, 2Department of Oncology, Longhua Hospital, Shanghai University of Traditional Chinese Medicine, Shanghai, People’s Republic of China
Abstract: The aims of the present study were to investigate the skin permeation and cellular uptake of a microemulsion (ME) containing total flavone of rhizoma arisaematis (TFRA), and to evaluate its effects on skin structure. Pseudo-ternary phase diagrams were constructed to evaluate ME regions with various surfactants and cosurfactants. Eight formulations of oil-in-water MEs were selected as vehicles, and in vitro skin-permeation experiments were performed to optimize the ME formulation and to evaluate its permeability, in comparison to that of an aqueous suspension. Laser scanning confocal microscopy and fluorescent-activated cell sorting were used to explore the cellular uptake of rhodamine 110-labeled ME in human epidermal keratinocytes (HaCaT) and human embryonic skin fibroblasts (CCC-ESF-1). The structure of stratum corneum treated with ME was observed using a scanning electron microscope. Furthermore, skin irritation was tested to evaluate the safety of ME. ME formulated with 4% ethyl oleate (weight/weight), 18% Cremophor EL® (weight/weight), and 18% Transcutol® P, with 1% Azone to enhance permeation, showed good skin permeability. ME-associated transdermal fluxes of schaftoside and isoschaftoside, two major effective constituents of TFRA, were 3.72-fold and 5.92-fold higher, respectively, than those achieved using aqueous suspensions. In contrast, in vitro studies revealed that uptake by HaCaT and CCC-ESF-1 cells was lower with ME than with an aqueous suspension. Stratum corneum loosening and shedding was observed in nude mouse skin treated with ME, although ME produced no observable skin irritation in rabbits. These findings indicated that ME enhanced transdermal TFRA delivery effectively and showed good biocompatibility with skin tissue.
Keywords: microemulsion, transdermal, nanocarrier, cellular uptake
Introduction
Rhizoma arisaematis (RA), a traditional Chinese medicine recorded in the Chinese Pharmacopoeia, is mostly used as an analgesic agent and delivered transdermally.1 Previous studies have demonstrated good sedative, analgesic, and anti-inflammatory effects of RA; these effects were largely attributable to the flavonoids present in RA.1 However, toxic effects of RA have been reported previously, and the use of conventional dosage forms, such as cataplasm and tincture, resulted in poor drug delivery across the lipid stratum corneum (SC), which can necessitate the use of an increased dosage or frequency and increase the risk of side effects.2
A microemulsion (ME) is a novel transdermal delivery system, conventionally composed of oil, surfactant, cosurfactant, and aqueous phases, with several advantages (eg, good thermodynamic stability, ease of manufacturing, enhanced drug solubility, and permeability) over conventional formulations.3 ME carriers of hydrophilic and lipophilic drugs have been developed for both synthetic chemical compounds and active constituents of natural products, including botanical extracts.4–7 It has been reported that ME may enhance transdermal drug delivery by improving drug solubility, thereby increasing the molecular concentration gradient, as well as by altering the SC structure.8,9
In the current study, an ME vehicle of total flavone of RA (TFRA) was formulated, with the aim of improving its transdermal delivery. The characteristics and skin permeation of the prepared MEs were evaluated in vitro and in vivo. For observation of the ME effect on skin surface and SC explicitly, nude mice were used and their skin treated with ME in vivo and examined using scanning electron microscopy (SEM). New Zealand White rabbits, a laboratory animal used extensively in skin-irritant testing, were selected to evaluate ME safety. Laser scanning confocal microscopy (LSCM) and fluorescence-activated cell sorting (FACS) were employed to evaluate in vitro cellular uptake of fluorescently labeled ME by human epidermal keratinocyte (HaCaT) and human embryonic skin fibroblast (CCC-ESF-1) cell lines, facilitating elucidation of the transdermal delivery mechanism of ME.10,11
Materials and methods
Materials
Apigenin (98% pure, as determined using high-performance liquid chromatography [HPLC]) was purchased from the Shanghai Institute for Drug Control (Shanghai, People’s Republic of China [PRC]). Schaftoside and isoschaftoside (purity ≥98%, determined using HPLC) were purchased from Chengdu Mansite Pharmaceutical Co., Ltd. (Chengdu, PRC). RA was purchased from Sichuan Chengdu Lotus Pond Traditional Chinese Medicine Professional Market (Chengdu, PRC). TFRA was prepared in our laboratory, and contained 0.73%±0.04% schaftoside, 0.21%±0.01% isoschaftoside (determined by HPLC), and 2.16%±0.06% total flavones (assayed by ultraviolet spectrophotometry using the method described in the Chinese Pharmacopoeia). Cremophor EL was obtained from BASF (Ludwigshafen, Germany), Transcutol® P from Gattefossé (Paris, France), and high-glucose Dulbecco’s modified Eagle’s medium (DMEM-high) from Thermo Fisher Scientific (Waltham, MA, USA). Trypsin 0.25%, 0.02% ethylenediaminetetraacetic acid (EDTA), fetal calf serum (FCS), and phosphate-buffered saline (PBS) were obtained from Shanghai Usen Biotechnology (Shanghai, PRC). All other chemicals were from Sinopharm Chemical Reagent (Shanghai, PRC), and were of HPLC or analytical grade.
Animals and cell lines
Male Sprague Dawley rats weighing 200±20 g, nude mice weighing 25±5 g, and New Zealand White rabbits weighing 2.0–2.5 kg were used in the present study, which was conducted with the approval of the Animal Ethical Committee, Shanghai University of Traditional Chinese Medicine (permit SYXK [Hu] 2009-0069). The animals were kept in an agreeable environment with free access to rodent diet and water, and were acclimatized for at least 1 week before the start of the study. The HaCaT cell line was purchased from the American Type Culture Collection (Manassas, VA, USA), and the CCC-ESF-1 cell line was obtained from the Chinese Academy of Medical Sciences (Beijing, PRC).
Methods
Preparation of TFRA
RA was crushed into a coarse powder, mixed with 70% ethanol (volume/volume [v/v]) at a ratio of 1:8 (weight/volume), and extracted by heating reflux for 1.5 hours with the water bath at 100°C. The extraction solution was then collected and replaced with fresh 70% ethanol. This extraction procedure was repeated twice. The extraction solutions were combined and concentrated at 60°C by rotary film evaporation, before enrichment with AB-8 macroporous resin (Anhui Sanxing Resin Technology Co., Ltd., Bengbu, PRC). Extracts were prepared by eluting the macroporous resin with 50% ethanol and vacuum-drying at 60°C.
HPLC analysis
Schaftoside and isoschaftoside were analyzed using a LC-2010A HT liquid chromatography system (Shimadzu, Kyoto, Japan) with a Diamonsil® C18 reverse-phase column (5 μm, 4.6 mm inner diameter ×25 cm; Welch Materials, Shanghai, PRC). The mobile phase was acetonitrile/water (v/v) containing 0.2% (v/v) phosphoric acid, using a gradient elution sequence (acetonitrile/water: 10/90 to 13/87, 0–10 minutes; 13/87 to 14/86, 10–35 minutes; 14/86, 35–50 minutes), with a flow rate of 1 mL/minute. The column temperature was constant at 30°C, and the detection wavelength was 340 nm. The inter- and intra-day relative standard deviation values for schaftoside were 1.52% and 2.12%, respectively, and the corresponding values for isoschaftoside were 2.96% and 2.56%. Samples from experiments were filtered through a 0.45 μm filter membrane before automatic injection into the HPLC system.
Screening of surfactant and cosurfactant
To select the appropriate surfactant and cosurfactant, the solubility of flavonoids was measured in Cremophor EL (polyoxyethylene [35] castor oil) and TWEEN® 80 (polyoxyethylene [20] sorbitan monooleate; Sigma-Aldrich Co., St Louis, MO, USA), surfactants, and in Transcutol® P (diethylene glycol monoethyl ether) and polyethylene glycol (PEG) 400 cosurfactants. Excess TFRA was added to 1 mL of each solvent at a temperature of 37°C±0.5°C, stirred with a magnetic bar at 300 rpm for 24 hours, and then centrifuged (MiniSpin®; Eppendorf, Hamburg, Germany) at 10,000 rpm for 10 minutes. The supernatant was diluted and assayed using HPLC.
Pseudo-ternary phase diagrams
Pseudo-ternary phase diagrams were constructed using water titration at room temperature. The weight ratios of surfactant to cosurfactant (Km) were set at 1:3, 1:2, 1:1, 2:1, and 3:1, and the weight ratios of oil to mixed surfactant and cosurfactant (S/Cos) were 1:9, 2:8, 3:7, 4:6, 5:5, 6:4, 7:3, 8:2, and 9:1. The oil and S/Cos were mixed homogeneously, and purified water was added dropwise under magnetic stirring (300 rpm) at room temperature until a transparent ME was produced, showing the Tyndall effect. A pseudo-ternary phase diagram was plotted using the concentrations of these components.
Preparation of ME and aqueous suspensions
ME formulations (ME1–ME8) (Table 1) were selected from suitable regions of the pseudo-ternary phase diagrams. TFRA was dissolved in the lipid excipients (mixture of surfactant, cosurfactant, and oil) before adding purified water dropwise to form an ME at room temperature. An aqueous suspension was prepared with the same TFRA content and 1% azone, dissolved in purified water.
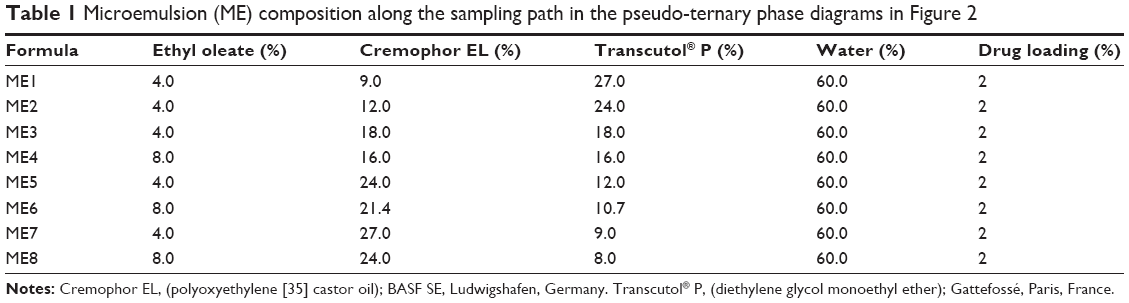 | Table 1 Microemulsion (ME) composition along the sampling path in the pseudo-ternary phase diagrams in Figure 2 |
The rhodamine 110-labeled ME and aqueous suspension were prepared by replacing TFRA with rhodamine 110 dissolved in ethanol (1.0 mg/mL). The concentration of rhodamine 110 in the prepared ME and in the aqueous suspension was 50 μg/mL.
Characteristics of ME
Characteristics of the MEs were analyzed after being formulated for 24 hours at room temperature. The size distribution and polydispersity index of each ME preparation was measured using dynamic light scattering with a computerized Malvern Autosizer Nano ZS90 inspection system (Malvern Instruments, Malvern, UK). ME transparency was analyzed using an ultraviolet spectrophotometer (UV-765; Shanghai Jingke Scientific Instrument, Shanghai, People’s Republic of China) at a wavelength of 600 nm. Viscosity was determined at 25°C±0.1°C, by using an MCR101 rheometer (Anton Paar, Graz, Austria) at 100 rpm. The pH values of the prepared ME systems were obtained using a Jenway Digital pH meter (Bibby Scientific, Stone, UK) at room temperature.
The appearance of the ME was examined using transmission electron microscopy (TEM) (Tecnai 12; Philips, Amsterdam, Netherlands). Samples were prepared for negative staining as follows: copper nets carrying formvar-supporting film (Zhong Jing Ke Yi Technology Inc., Beijing, PRC) were placed onto a stencil plate. MEs were dropped gently onto the film, and the film was allowed to dry for about 20 minutes. A drop of 2% phosphotungstic acid was then added to the film and allowed to dry for 10 minutes, before observation of the film under TEM.
In vitro permeation studies
The rat abdominal skins were shaved, excised, and the subcutaneous fat was removed, before washing the skin and examining its integrity. A Franz diffusion cell (Tianjin Fulansi Electronic Science and Trade, Tianjin, PRC) was fitted with excised rat skin. Each donor compartment had a diffusion area of 2.0 cm2. Each receptor compartment was filled with 12.5 mL of freshly prepared 30% ethanol in water (3:7 v:v) to provide sink conditions, maintained at 37°C±0.5°C, and stirred with a magnetic bar at 300 rpm. Two milliliters of ME or aqueous suspension was placed in the donor compartment by using a pipette (Eppendorf), and sealed with parafilm. Each experiment was performed in triplicate. At predetermined time points, a sample was removed from the receptor compartment and replaced with an equal volume of receptor fluid, equilibrated to 37°C±0.5°C. The receptor fluid sample was concentrated to 0.5 mL in a rotary evaporator at 60°C, before filtration and HPLC analysis.
Cell culture
HaCaT and CCC-ESF-1 cell lines were removed from storage in liquid nitrogen and placed in a 37°C water bath for 1 minute. Then, 10 mL of fresh culture medium (DMEM-high) containing 10% FCS (v/v) was added to the culture dish and mixed uniformly. Cell cultures were incubated at 37°C under humidified conditions with 5% CO2 (Forma 3111; Thermo Fisher Scientific) in DMEM-high containing 10% FCS. All cell-handling procedures were performed on a clean bench (VCM-620; Dabao Instrument, Suzhou, PRC), and aseptic techniques were employed. Cultures were maintained at 37°C under humidified conditions with 5% CO2.
Cellular uptake of rhodamine 110-labeled ME and aqueous suspension
At predetermined times, rhodamine 110-labeled ME or aqueous solution (100 μL) was added to the culture dish and incubated for 8 hours. The culture medium was then removed and the cells washed three times with 1 mL of PBS. Cells for LSCM analysis were fixed with 4% paraformaldehyde, then optically scanned at different increments through the z-axis of an LSCM (Tcs Sp2; Leica Microsystems, Wetzlar, Germany). Optical excitations were performed with a 554 nm argon laser beam, and fluorescence emission was detected at 575 nm.
For FACS determination, cells were suspended in 2 mL of trypsin–EDTA solution, transferred into 5-mL BD tubes (Falcon 352002; BD, Franklin Lakes, NJ, USA), and then centrifuged at 1,500 rpm at 25°C in a refrigerated centrifuge (Thermo Fisher Scientific). The supernatant was removed, and the cells were suspended by adding 0.5 mL of PBS (containing 1% FCS, v/v) to each BD tube. FACS was carried out with a flow cytometer (BD). For each analysis, 20,000 events were collected, and cells that had not been incubated with any fluorophore served as the blank control.
Effect of ME treatment on SC structure
A nude mouse was anesthetized, and its abdominal skin region was divided into two areas; a plastic cap serving as a drug pool with an area of 1 cm2 was fixed to one skin area. ME (1 mL) was added to the drug pool, and the other skin area was maintained as control. After 8 hours, the mouse was humanely killed; the abdominal skin was excised, washed with normal saline, fixed with glutaraldehyde for 24 hours, washed with PBS, and fixed in 1% osmic acid. The skin was dehydrated with ethanol, dried using CO2 critical point drying, sputtered with platinum, and observed using SEM (Quanta FEG250; FEI, Hillsboro, USA).
Skin irritation
The hair on the backs of the rabbits was shaved before randomly dividing them into two study groups: an intact-skin group, and a skin-injury group. In the latter group, skin was injured by drawing “#” on the skin with a blade until capillary hemorrhage was observed. ME (0.5 mL), with or without TFRA, was applied to 3×3 cm2 regions and left for 4 hours, before removing the formulations by gentle washing with warm water. After 1 hour, the skin was inspected to determine whether erythema and/or edema were present. For intact skin, this test procedure was performed once a day for 3 consecutive days, and the skin was examined for erythema and/or edema at 24, 48, and 72 hours after treatment with the experimental formulations.
Finally, the rabbits were killed, and the tested skin regions were excised and fixed in 10% buffered formaldehyde solution for 72 hours. The skins were then embedded in paraffin and sliced transversely. The sections were dehydrated stepwise with alcohol, stained with hematoxylin and eosin, and observed using an optical microscope (BH-2; Olympus, Tokyo, Japan).
Statistical analysis
Data are presented as means ± standard deviation. Statistical data were analyzed using one-way analysis of variance with SPSS software (version 19.0; IBM, Armonk, NY, USA). P-values less than 5% were considered to be significant.
Results and discussion
ME preparation and characterization
The solubility of schaftoside and isoschaftoside in surfactants and cosurfactants is shown in Figure 1. Since schaftoside and isoschaftoside exhibited higher solubility in Cremophor EL and Transcutol® P than in the other excipients tested, these were selected to construct pseudo-ternary phase diagrams, with ethyl oleate as the oil phase. As shown in Figure 2, the area of oil-in-water ME regions was enlarged following the Km-value increase, which was in agreement with the findings of Shakeel et al indicating that a higher level of surfactant can reduce the interfacial tension of the colloidal solution more effectively, thereby improving the fluidity of the interface and increasing the entropy of the system.12 However, too much surfactant may cause skin irritation.5 To identify a formulation using the lowest amount of surfactant but with good transdermal permeability, eight ME formulations were selected for further evaluation.
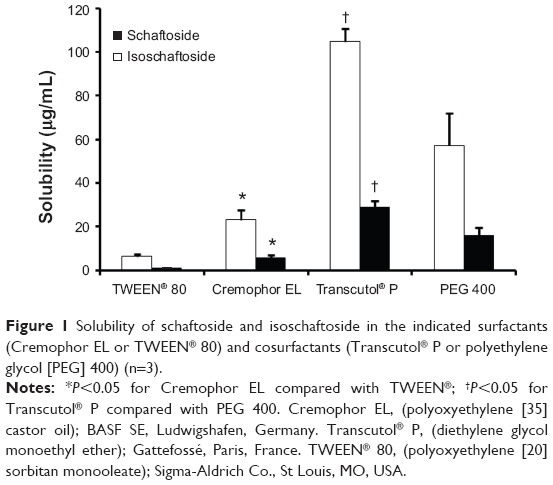 | Figure 1 Solubility of schaftoside and isoschaftoside in the indicated surfactants (Cremophor EL or TWEEN® 80) and cosurfactants (Transcutol® P or polyethylene glycol [PEG] 400) (n=3). |
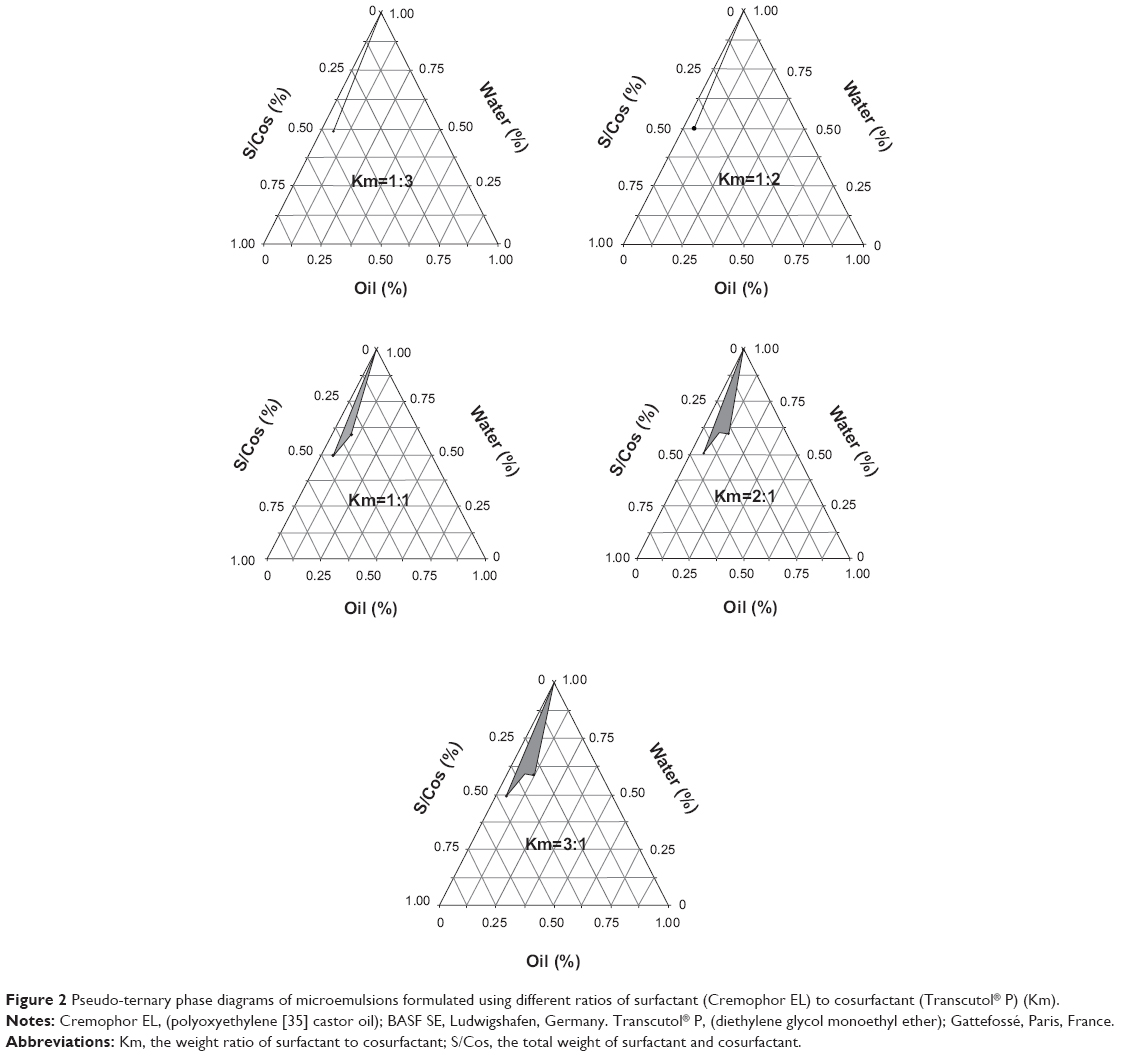 | Figure 2 Pseudo-ternary phase diagrams of microemulsions formulated using different ratios of surfactant (Cremophor EL) to cosurfactant (Transcutol® P) (Km). |
The physical properties of ME1–ME8 are listed in Table 2. Mean droplet sizes of these MEs ranged from 31.09 nm to 83.15 nm, with polydispersity-index values of 0.07–0.30, indicating a uniform nanoemulsion with a narrow size distribution. The droplet size increased in proportion to the oil content, but decreased as the Km value increased. These observations could be attributed to the expansion of the ME oil core, and the high concentration of S/Cos forcefully reducing the oil–water interfacial tension to reduce droplet size, respectively.13,14 Transparency of the preparations increased as the ME size declined.15 Elevated ME viscosity was observed as the surfactant level increased. The pH values of all of the MEs were in the appropriate range of 4.0–5.0.16 The micrographs revealed separate single ME3 droplets with a spherical outline (Figure 3).
 | Table 2 Microemulsion (ME) characteristics (n=3) |
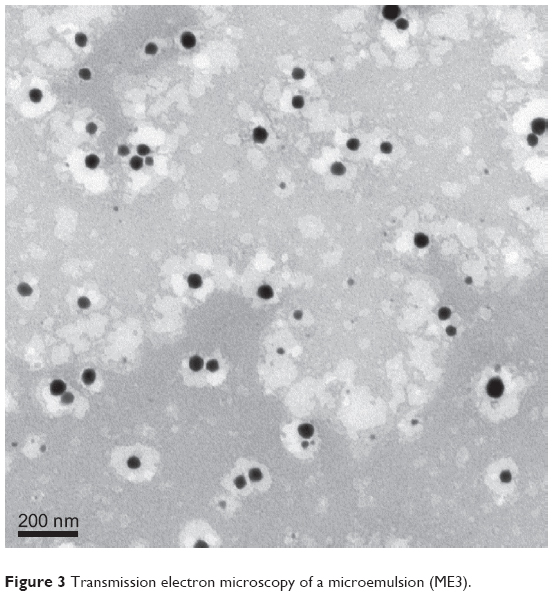 | Figure 3 Transmission electron microscopy of a microemulsion (ME3). |
In vitro skin permeation
The transdermal flux of drug versus time is presented in Figure 4 for ME1–ME8. The permeation profiles of all the tested vehicles followed zero-order kinetics. As shown in Figure 5, ME3 provided the highest flux of both schaftoside and isoschaftoside (0.119±0.010 μg/cm2/hour [h] and 0.027±0.004 μg/cm2/h, respectively). These findings demonstrated that good skin permeation could be achieved using the appropriate S/Cos. Surfactants can enhance skin permeation by increasing membrane fluidity, drug solubilization, and extraction of lipid from the SC.17 However, as the level of surfactant increases, the thermodynamic activity of the ME drug cargo may decrease, leading to decreased drug transport.18 In addition, permeation profiles are affected by droplet size and viscosity, whereby low viscosity and small size tend to increase skin permeation.16 ME3, formulated with the appropriate S/Cos, showed small size, low viscosity, and excellent permeability.
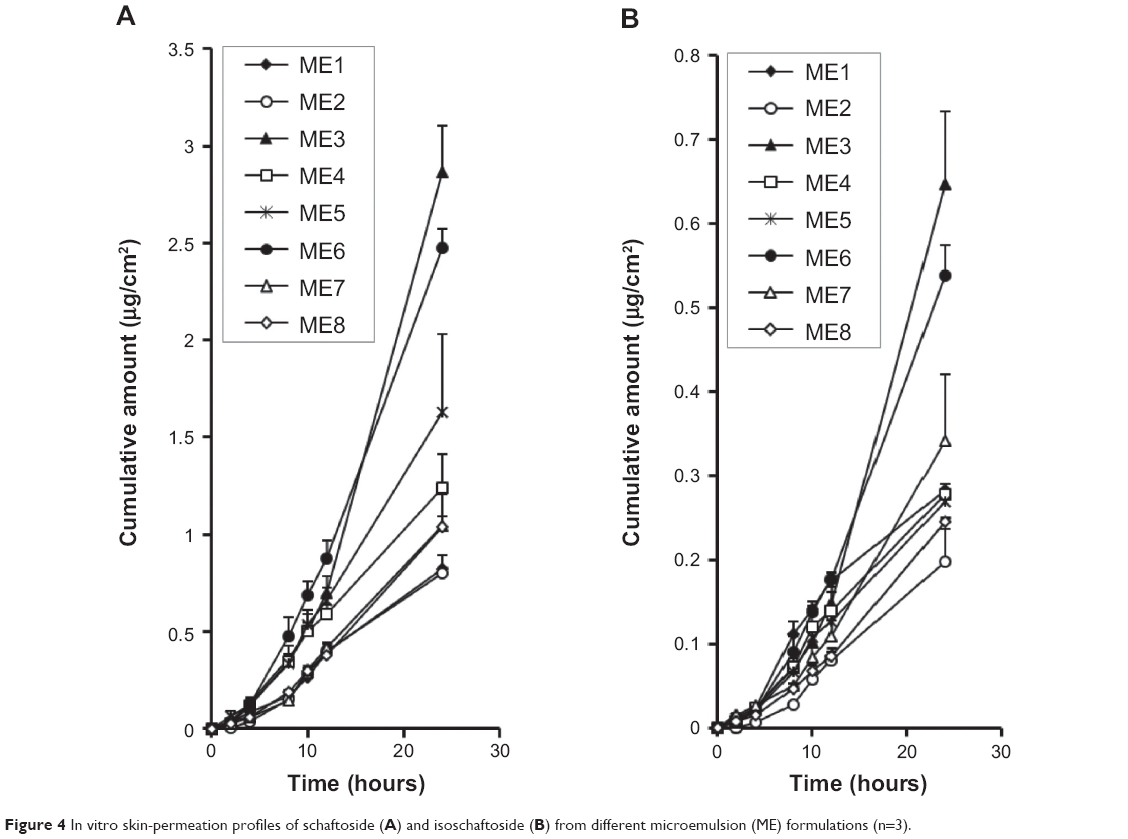 | Figure 4 In vitro skin-permeation profiles of schaftoside (A) and isoschaftoside (B) from different microemulsion (ME) formulations (n=3). |
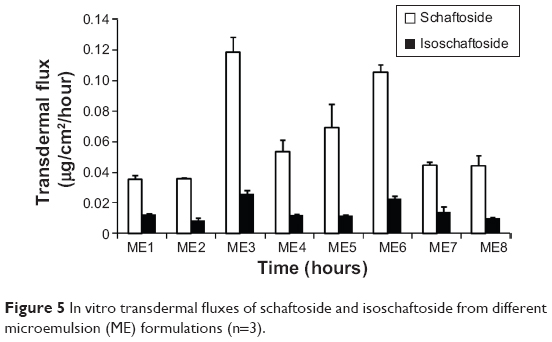 | Figure 5 In vitro transdermal fluxes of schaftoside and isoschaftoside from different microemulsion (ME) formulations (n=3). |
ME3 was selected for further studies, using 1% azone as a permeation enhancer.19,20 The effects of drug loading on the skin permeation of schaftoside and isoschaftoside were also investigated. The cumulative amounts of schaftoside and isoschaftoside crossing the skin increased with increased drug loading (Figure 6). Improving drug solubility can also make a valuable contribution to promoting transdermal drug delivery.8 When drug loading increased from 1% to 2%, schaftoside and isoschaftoside transdermal flux increased by 2.78 and 3.82 times, respectively, while increasing loading from 2% to 3% increased flux by 1.17 and 1.33 times, respectively. This indicated that a high drug-concentration gradient facilitated drug permeability, but that this effect showed signs of saturation at higher levels of ME drug loading.18
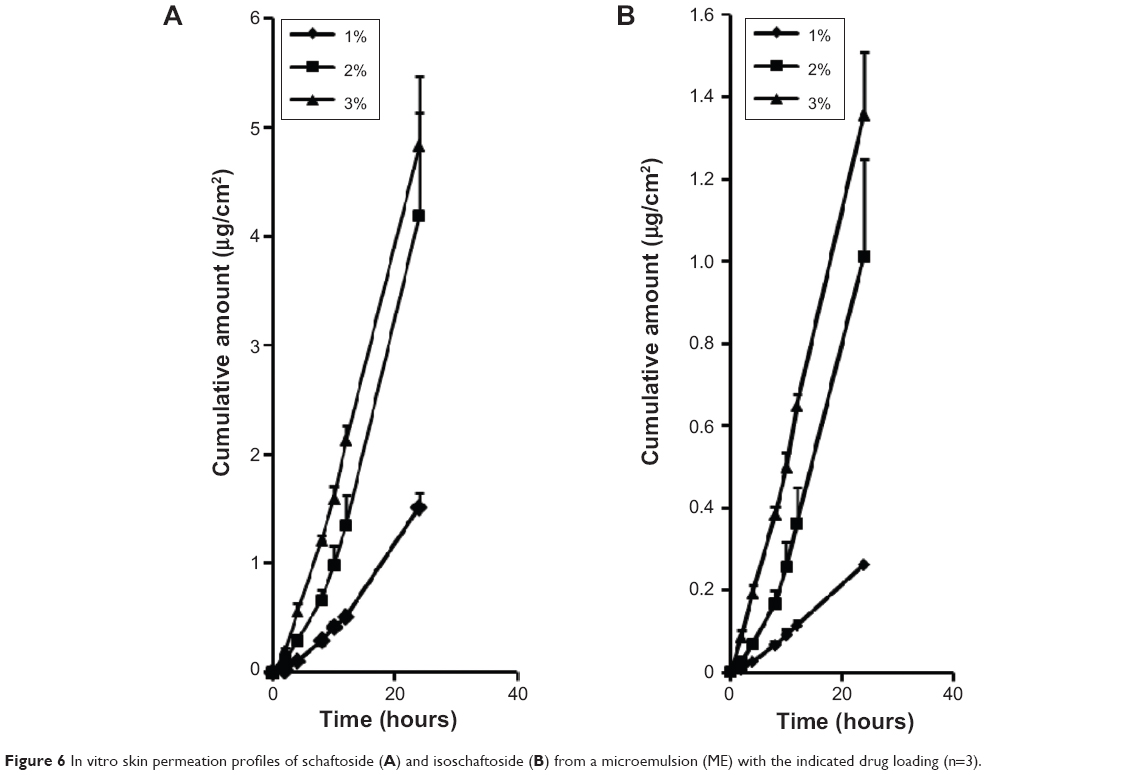 | Figure 6 In vitro skin permeation profiles of schaftoside (A) and isoschaftoside (B) from a microemulsion (ME) with the indicated drug loading (n=3). |
In contrast with the aqueous suspension containing the same amount of drug (Figure 7), ME significantly increased the levels of schaftoside and isoschaftoside crossing the skin (P<0.05), with fluxes 3.72 and 5.92 times those of the aqueous suspension, respectively (Figure 7), demonstrating excellent enhancement of TFRA delivery using ME.
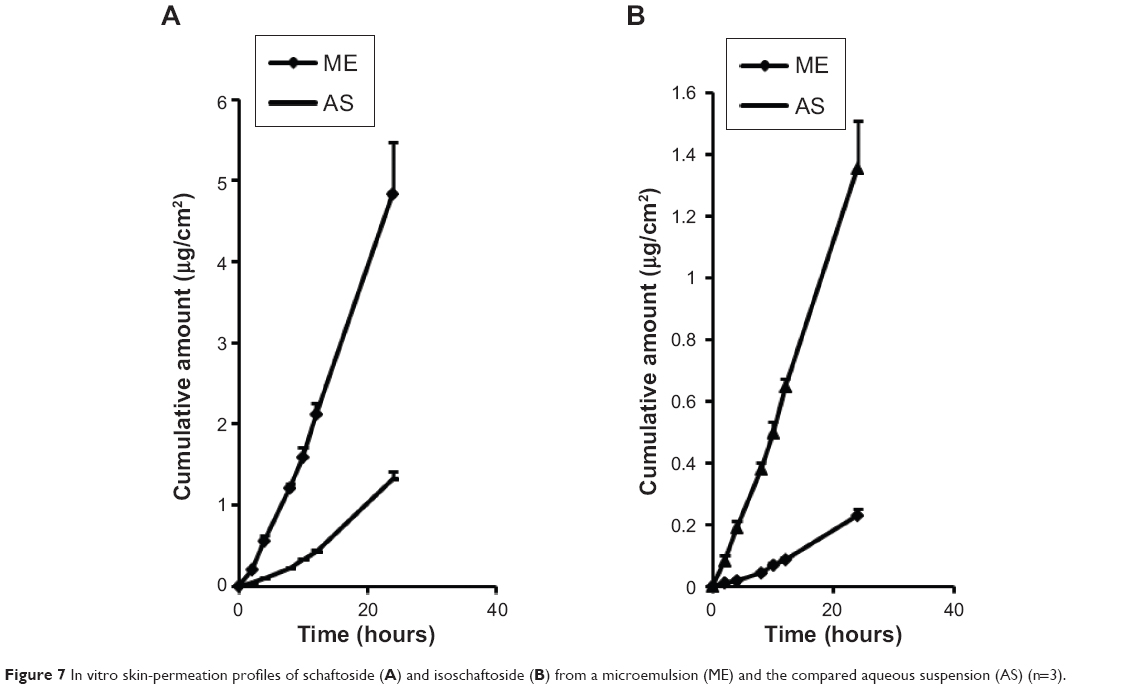 | Figure 7 In vitro skin-permeation profiles of schaftoside (A) and isoschaftoside (B) from a microemulsion (ME) and the compared aqueous suspension (AS) (n=3). |
Cellular uptake in vitro
LSCM identified orange fluorescence in cells, which was mainly distributed in the cytoplasm (Figure 8). As can be seen in Figure 9, the fluorescence intensity was relatively lower in ME-treated cells compared to those treated with the aqueous suspension (P<0.05). This suggested that HaCaT and CCC-ESF-1 cells showed poor uptake of the ME drug cargo, indicating that ME-mediated delivery of TFRA may not involve an efficient transcellular pathway with cellular uptake of nanoscale droplets of microemulsions directly.21
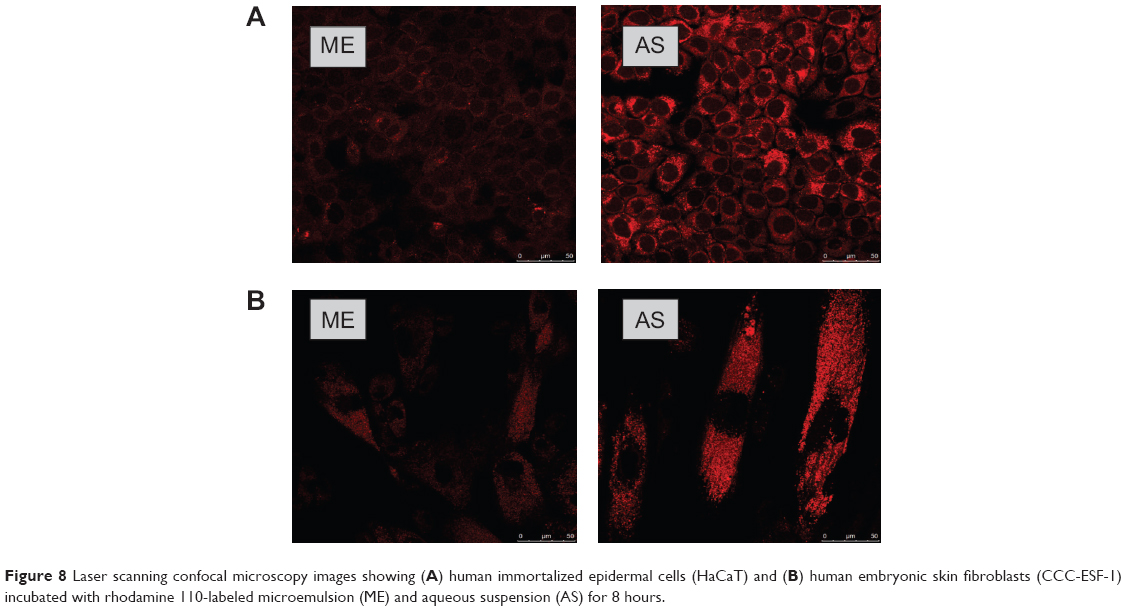 | Figure 8 Laser scanning confocal microscopy images showing (A) human immortalized epidermal cells (HaCaT) and (B) human embryonic skin fibroblasts (CCC-ESF-1) incubated with rhodamine 110-labeled microemulsion (ME) and aqueous suspension (AS) for 8 hours. |
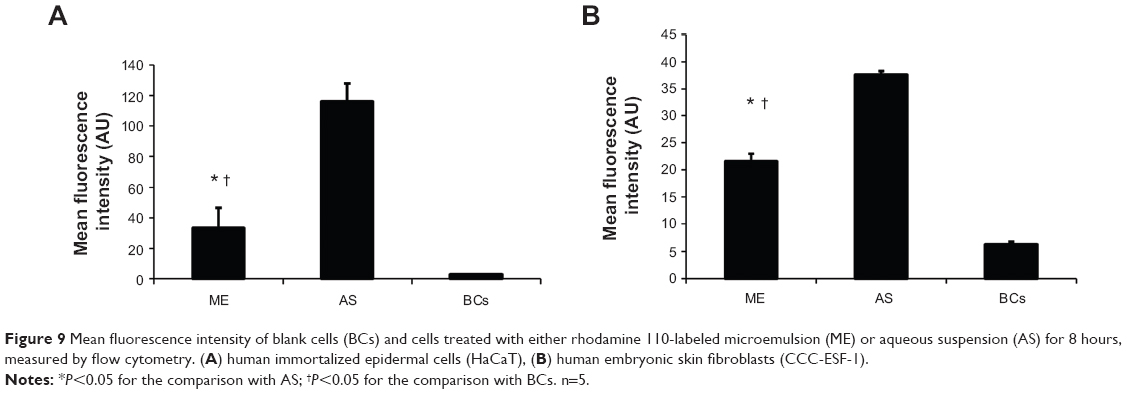 | Figure 9 Mean fluorescence intensity of blank cells (BCs) and cells treated with either rhodamine 110-labeled microemulsion (ME) or aqueous suspension (AS) for 8 hours, measured by flow cytometry. (A) human immortalized epidermal cells (HaCaT), (B) human embryonic skin fibroblasts (CCC-ESF-1). |
Skin structure
The surface of normal nude mouse skin (without any treatment) was intact and smooth, with many wrinkles that were photographed at a high magnification; it had an intact SC, closely combined with the epidermis (Figure 10). However, the SC exposed to ME was loose or had been shed (Figure 10). The ME components, such as the lipophilic S/Cos, disrupted the SC layer. This may have been exacerbated by the ME nanoscale droplets, and its low viscosity.22
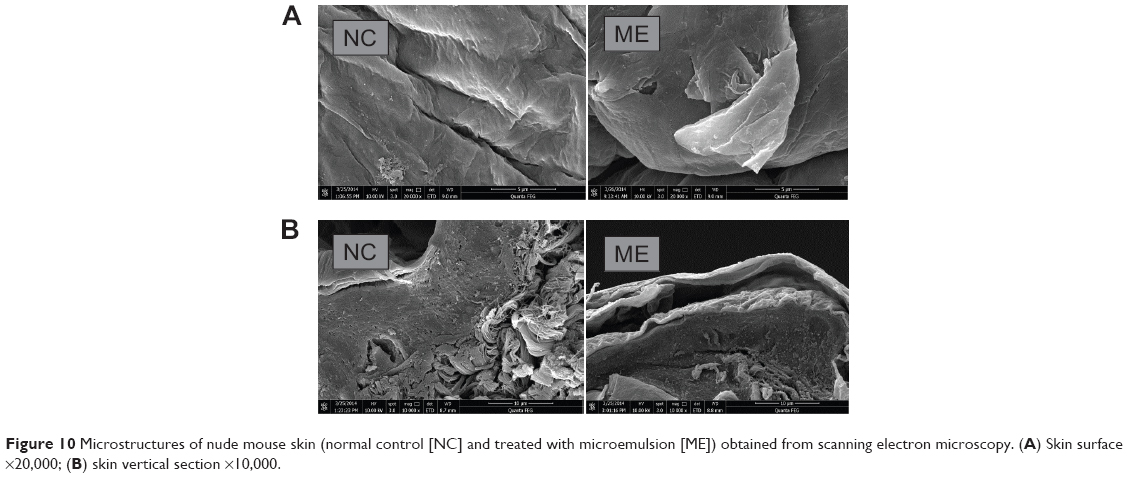 | Figure 10 Microstructures of nude mouse skin (normal control [NC] and treated with microemulsion [ME]) obtained from scanning electron microscopy. (A) Skin surface ×20,000; (B) skin vertical section ×10,000. |
Skin irritation
Following the application of ME (with or without drug), no erythema or edema was found on intact (Figure 11) or injured rabbit skin (Figure 11), and no histopathological changes were identified in the HE-stained paraffin skin sections (Figure 12). This indicated that ME had good biocompatibility with skin.
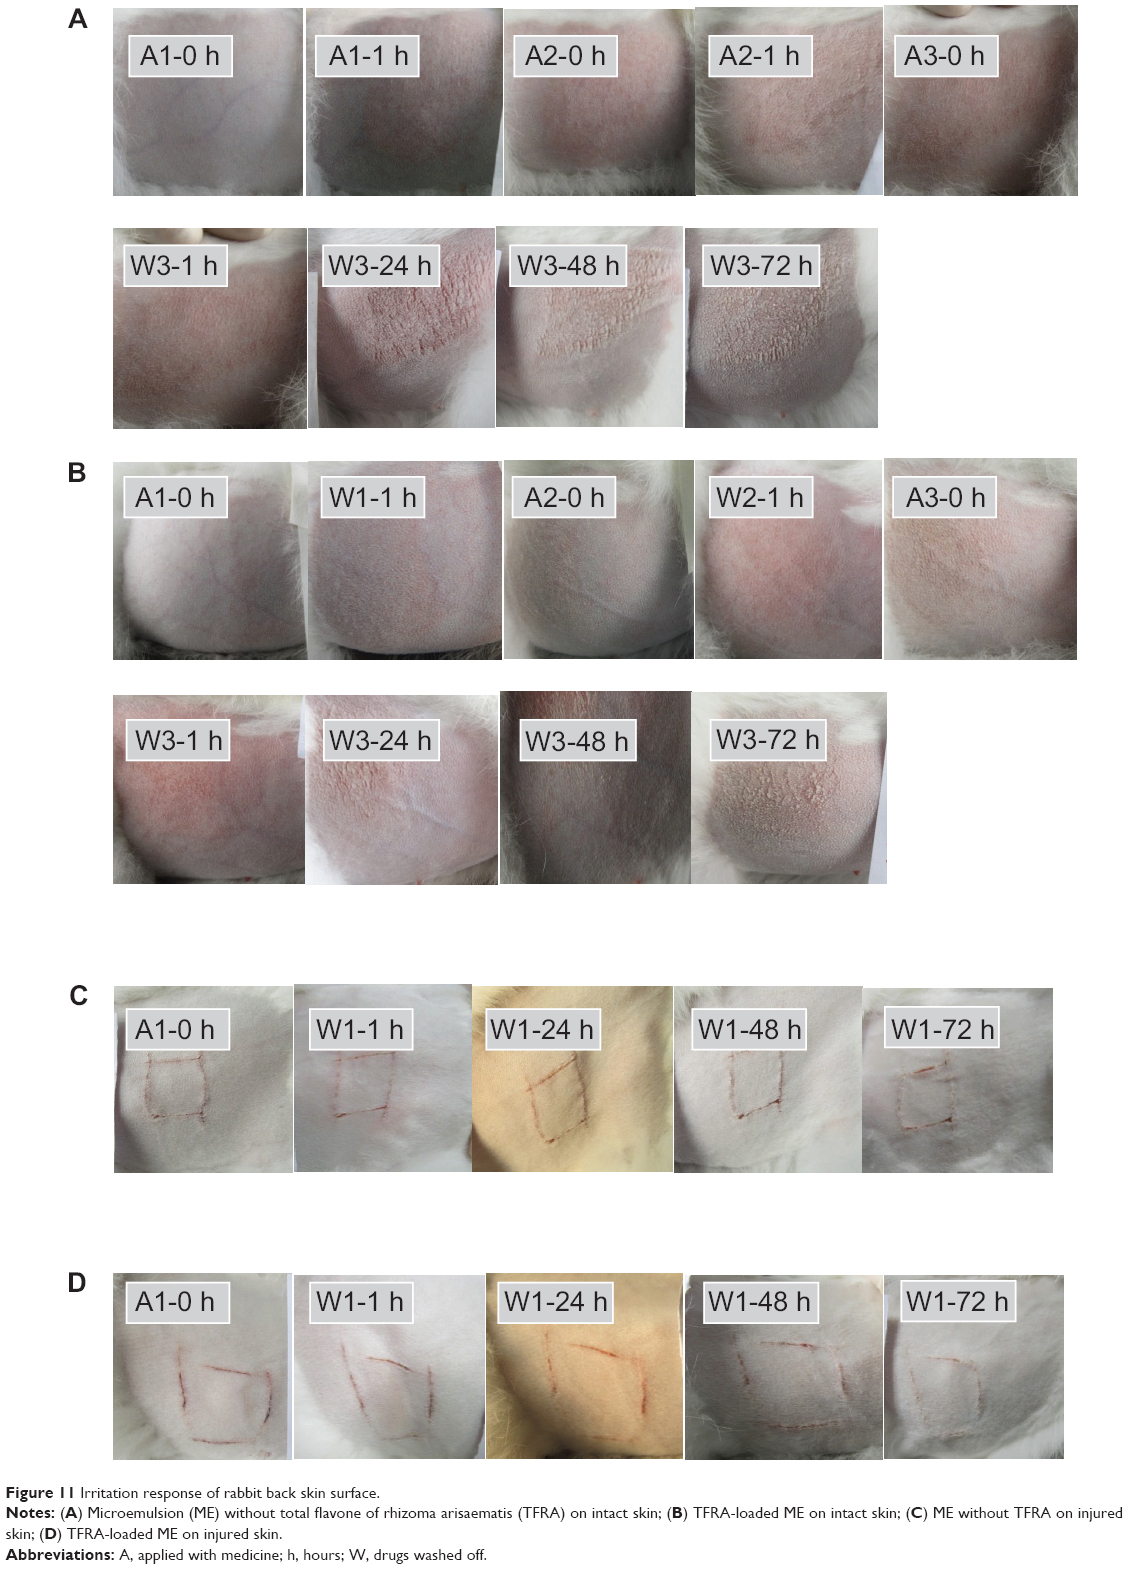 | Figure 11 Irritation response of rabbit back skin surface. |
 | Figure 12 A–D The microstructure of a rabbit back skin section, viewed under a light microscope. |
Conclusion
A novel transdermal delivery system was established using ME with TFRA cargo, which achieved superior drug permeability to that of the compared aqueous suspensions. The poor cellular uptake of the ME cargo by skin cells and the effect of the preparation on SC structure indicated that it may enhance transdermal drug delivery through loosening of the SC, rather than directly, via a transcellular pathway with nanoscale droplets of microemulsions.
Acknowledgements
This work was financially supported by grants from the Shanghai Health Bureau (XBR2011063), and the National Natural Science Foundation of China (81303234).
Disclosure
The authors report no conflicts of interest in this work.
References
Chinese Pharmacopoeia Commission. Pharmacopoeia of the People’s Republic of China. Vol 1. Beijing: Chinese Pharmacopoeia Commission; 2010. | ||
Huang CF, Yang RS, Liu SH, Hsieh PC, Lin-Shiau SY. Evidence for improved neuropharmacological efficacy and decreased neurotoxicity in mice with traditional processing of rhizoma arisaematis. Am J Chin Med. 2011;39(5):981–998. | ||
El Maghraby GM. Microemulsions as transdermal drug delivery systems. Curr Nanosci. 2012;8(4):504–511. | ||
Santos P, Watkinson AC, Hadgraft J, Lane ME. Application of microemulsions in dermal and transdermal drug delivery. Skin Pharmacol Physiol. 2008;21(5):246–259. | ||
Lopes LB. Overcoming the cutaneous barrier with microemulsions. Pharmaceutics. 2014;6(1):52–77. | ||
Mostafa DM, Ammar NM, Abd El-Alim SH, El-Anssary AA. Transdermal microemulsions of Glycyrrhiza glabra L.: characterization, stability and evaluation of antioxidant potential. Drug Deliv. 2014;21(2): 130–139. | ||
Chaiyana W, Rades T, Okonogi S. Characterization and in vitro permeation study of microemulsions and liquid crystalline systems containing the anticholinesterase alkaloidal extract from Tabernaemontana divaricata. Int J Pharm. 2013;452(1–2):201–210. | ||
Azeem A, Khan ZI, Aqil M, Ahmad FJ, Khar RK, Talegaonkar S. Microemulsions as a surrogate carrier for dermal drug delivery. Drug Dev Ind Pharm. 2009;35(5):525–547. | ||
Akhter S, Jain GK, Ahmad FJ, et al. Investigation of nanoemulsion system for transdermal delivery of domperidone: ex-vivo and in vivo studies. Curr Nanosci. 2008;4(4):381–390. | ||
Newby CS, Barr RM, Greaves MW, Mallet AI. Cytokine release and cytotoxicity in human keratinocytes and fibroblasts induced by phenols and sodium dodecyl sulfate. J Invest Dermatol. 2000;115(2):292–298. | ||
Jung KM, Lee SH, Jang WH, et al. KeraSkin™-VM: A novel reconstructed human epidermis model for skin irritation tests. Toxicol In Vitro. 2014;28(5):742–750. | ||
Shakeel F, Baboota S, Ahuja A, Ali J, Aqil M, Shafiq S. Nanoemulsions as vehicles for transdermal delivery of aceclofenac. AAPS Pharm Sci Tech. 2007;8(4):E104. | ||
Yuan Y, Li SM, Mo FK, Zhong DF. Investigation of microemulsion system for transdermal delivery of meloxicam. Int J Pharm. 2006;321(1–2): 117–123. | ||
Thakkar PJ, Madan P, Lin S. Transdermal delivery of diclofenac using water-in-oil microemulsion: formulation and mechanistic approach of drug skin permeation. Pharm Dev Technol. 2014;19(3):373–384. | ||
Fouad SA, Basalious EB, El-Nabarawi MA, Tayel SA. Microemulsion and poloxamer microemulsion-based gel for sustained transdermal delivery of diclofenac epolamine using in-skin drug depot: in vitro/in vivo evaluation. Int J Pharm. 2013;453(2):569–578. | ||
Tashtoush BM, Bennamani AN, AL-Taani BM. Preparation and characterization of microemulsion formulations of nicotinic acid and its prodrugs for transdermal delivery. Pharm Dev Technol. 2013;18(4): 834–843. | ||
Rege BD, Kao JP, Polli JE. Effects of nonionic surfactants on membrane transporters in Caco-2 cell monolayers. Eur J Pharm Sci. 2002;16(4–5): 237–246. | ||
Zhao X, Liu JP, Zhang X, Li Y. Enhancement of transdermal delivery of theophylline using microemulsion vehicle. Int J Pharm. 2006;327(1–2): 58–64. | ||
Batheja P, Sheihet L, Kohn J, Singer AJ, Michniak-Kohn B. Topical drug delivery by a polymeric nanosphere gel: formulation optimization and in vitro and in vivo skin distribution studies. J Control Release. 2011;149(2):159–167. | ||
Zhang YT, Zhao JH, Zhang SJ, et al. Enhanced transdermal delivery of evodiamine and rutaecarpine using microemulsion. Int J Nanomedicine. 2011;6:2469–2482. | ||
Zhang YT, Huang ZB, Zhang SJ, et al. In vitro cellular uptake of evodiamine and rutaecarpine using a microemulsion. Int J Nanomedicine. 2012;7:2465–2472. | ||
Hathout RM, Mansour S, Mortada ND, Geneidi AS, Guy RH. Uptake of microemulsion components into the stratum corneum and their molecular effects on skin barrier function. Mol Pharm. 2010;7(4):1266–1273. |
 © 2014 The Author(s). This work is published and licensed by Dove Medical Press Limited. The full terms of this license are available at https://www.dovepress.com/terms.php and incorporate the Creative Commons Attribution - Non Commercial (unported, v3.0) License.
By accessing the work you hereby accept the Terms. Non-commercial uses of the work are permitted without any further permission from Dove Medical Press Limited, provided the work is properly attributed. For permission for commercial use of this work, please see paragraphs 4.2 and 5 of our Terms.
© 2014 The Author(s). This work is published and licensed by Dove Medical Press Limited. The full terms of this license are available at https://www.dovepress.com/terms.php and incorporate the Creative Commons Attribution - Non Commercial (unported, v3.0) License.
By accessing the work you hereby accept the Terms. Non-commercial uses of the work are permitted without any further permission from Dove Medical Press Limited, provided the work is properly attributed. For permission for commercial use of this work, please see paragraphs 4.2 and 5 of our Terms.