")
Back to Journals » Journal of Hepatocellular Carcinoma » Volume 9
Preoperative Radiomics Analysis of Contrast-Enhanced CT for Microvascular Invasion and Prognosis Stratification in Hepatocellular Carcinoma
Authors Xu T , Ren L , Liao M, Zhao B, Wei R, Zhou Z, He Y, Zhang H, Chen D, Chen H , Liao W
Received 2 January 2022
Accepted for publication 26 February 2022
Published 20 March 2022 Volume 2022:9 Pages 189—201
DOI https://doi.org/10.2147/JHC.S356573
Checked for plagiarism Yes
Review by Single anonymous peer review
Peer reviewer comments 2
Editor who approved publication: Dr Ahmed Kaseb
Tingfeng Xu,1,* Liying Ren,1,* Minjun Liao,1,2,* Bigeng Zhao,1 Rongyu Wei,1 Zhipeng Zhou,3 Yong He,4 Hao Zhang,3 Dongbo Chen,5 Hongsong Chen,5 Weijia Liao1
1Laboratory of Hepatobiliary and Pancreatic Surgery, Affiliated Hospital of Guilin Medical University, Guilin, 541001, Guangxi, People’s Republic of China; 2Guangdong Provincial Key Laboratory of Gastroenterology, Department of Gastroenterology and Hepatology Unit, Nanfang Hospital, Southern Medical University, Guangzhou, 510515, Guangdong, People’s Republic of China; 3Department of Radiology, Affiliated Hospital of Guilin Medical University, Guilin, 541001, Guangxi, People’s Republic of China; 4Department of Radiology, the Second Affiliated Hospital of Guilin Medical University, Guilin, 541001, Guangxi, People’s Republic of China; 5Peking University People’s Hospital, Peking University Hepatology Institute, Beijing Key Laboratory of Hepatitis C and Immunotherapy for Liver Disease, Beijing, 100044, People’s Republic of China
*These authors contributed equally to this work
Correspondence: Weijia Liao, Laboratory of Hepatobiliary and Pancreatic Surgery, Affiliated Hospital of Guilin Medical University, Guilin, 541001, Guangxi, People’s Republic of China, Tel +86 773 2833021, Fax +86 773 2822703, Email [email protected] Hongsong Chen, Peking University People’s Hospital, Peking University Hepatology Institute, Beijing Key Laboratory of Hepatitis C and Immunotherapy for Liver Disease, No. 11 Xizhimen South Street, Beijing, 100044, People’s Republic of China, Tel +86 10 88325724, Email [email protected]
Purpose: Microvascular invasion (MVI) impairs long-term prognosis of patients with hepatocellular carcinoma (HCC). We aimed to develop a novel nomogram to predict MVI and patients’ prognosis based on radiomic features of contrast-enhanced CT (CECT).
Patients and Methods: HCC patients who underwent curative resection were enrolled. The radiomic features were extracted from the region of tumor, and the optimal MVI-related radiomic features were selected and applied to construct radiomic signature (Rad-score). The prediction models were created according to the logistic regression and evaluated. Biomarkers were analyzed via q-PCR from randomly selected HCC patients. Correlations between biomarkers and radiomic signature were analyzed.
Results: A total of 421 HCC patients were enrolled. A total of 1962 radiomic features were extracted from the region of tumor, and the 11 optimal MVI-related radiomic features showed a favor predictive ability with area under the curves (AUCs) of 0.796 and 0.810 in training and validation cohorts, respectively. Aspartate aminotransferase (AST), tumor number, alpha-fetoprotein (AFP) level, and radiomics signature were independent risk factors of MVI. The four factors were integrated into the novel nomogram, named as CRM, with AUCs of 0.767 in training cohort and 0.793 in validation cohort for predicting MVI, best among radiomics signature alone and clinical model. The nomogram was well-calibrated with favorable clinical value demonstrated by decision curve analysis and can divide patients into high- or low-risk subgroups of recurrence and mortality. In addition, gene BCAT1, DTGCU2, DOCK3 were analyzed via q-PCR and serum AFP were identified as having significant association with radiomics signature.
Conclusion: The novel nomogram demonstrated good performance in preoperatively predicting the probability of MVI, which might guide clinical decision.
Keywords: hepatocellular carcinoma, microvascular invasion, preoperative noninvasive diagnosis, contrast-enhanced CT, biologic correlation
Introduction
The global burden of hepatocellular carcinoma (HCC) remains a grand challenge, with thirdly ranked mortality globally and even second-placed cause of cancer-related death in Asia-Pacific countries.1,2 Surgical resection and liver transplantation (LT) are the potential radical treatments for HCC patients. But it is regrettable that five-year recurrence rate was approaching as high as 70% after surgical resection in HCC, and nearly 35% after LT, which exert unfavorable influences on their long-time prognosis.3–5 Microvascular invasion (MVI) is regarded as one of the most crucial predictive risk factors for recurrence among HCC patients,6,7 which is associated with complexity and heterogeneity of tumor. Some studies suggested MVI posed a great threat to poor outcomes of HCC patients.8,9 MVI is defined as microscopic tumor invasion in smaller intrahepatic vessels, including the microvessels and lymphatics of the portal vein or hepatic artery.10 For macrovascular invasion, it can be identified through radiological examination such as ultrasonography (USG) and computed tomography (CT) before surgery, however, MVI is histopathologically diagnosed and confirmed through postoperative pathological examination. Hence, in case MVI status can be evaluated preoperatively, it would offer broad guidance to attain more widely clear surgical margins and may reduce postoperative recurrence rate.11 Nevertheless, clinical diagnosis of MVI remains challenging during preoperative assessment. Although previous studies showed traditional imaging information, including tumor size, tumor multifocality and abnormal vascular perfusion were associated with MVI, these features were not widely adopted for diagnosis of MVI yet.12,13 At present, no reliable methods can effectively diagnose MVI in the preoperative period apart from lesion biopsy.
The emerging and inspiring field of radiomics, which enables acquisition of comprehensive and quantitative features from medical images, may provide accurate diagnosis and prognosis information related to tumor complexity and heterogeneity.14–16 Radiomics has showed the potential to be non-invasive imaging biomarkers for cancer diagnosis, differentiation of pathological subtype and assessment for treatment response or prognosis.17,18 Despite its great potency, more reasonable and objective methods are needed for radiomics features quantification, and relationship between radiomics features and genomics factors needs for further exploration, so as to made precise clinical decision in the era of individualized oncology.14 Few studies have investigated prognosis of HCC patients with MVI based on radiomics signatures, when interpreting associations between biomarkers and radiomics signatures yet.
We aimed to investigate radiomics features based on contrast-enhanced CT (CECT) in HCC patients, and a novel nomogram incorporating radiomics signature and clinical information was constructed to predict MVI status as well as patients’ prognosis and validated in external data. Furthermore, quantitative real-time PCR (q-PCR) was applied to detect our previous research 10 tumor biomarkers from 53 randomly selected HCC patients. We assessed the relevance of gene relative transcript levels with radiomics signature of MVI, attempting to explore more underlying biological information of radiomics signatures.
Patients and Methods
Patients and Clinical Data
Our study was approved by the research ethics committee of Affiliated Hospital of Guilin Medical University and Peking University People’s Hospital, named Guilin dataset and Beijing dataset, respectively, and conformed to the principles of the Declaration of Helsinki. Informed consents were obtained from all subjects.
The diagnosis of HCC was based on clinical features, radiological examination, hepatic arteriography, alpha-fetoprotein (AFP) level, and postoperative pathological examination referring to the Clinical Diagnosis and Staging of Primary Liver Cancer established by the Professional Committee of Liver Cancer of Chinese Anti-Cancer Association. All enrolled patients underwent CECT scan within one month before surgery. Surgical resections were performed by well-trained and experienced hepatobiliary surgeons. Curative resection was defined as the complete removal of tumor, and no tumor cell invasions were seen in the resection margins by naked eye in more than twice follow-ups with no less than 4 weeks interval.19 To ensure complete removal of liver cancer, intraoperative abdominal USG and postoperative CT scan were routinely performed. All specimens were examined and diagnosed by two expert hepatopathologists ignorant about patients’ information, and a third pathologist was needed when results were discordant.
Follow Up
Patients were followed up at 1 month and 3 to 6 months after the operation. Routine postoperative examinations included physical examination, blood routine examination, liver function tests, coagulation function, serum AFP level, and abdominal USG. When any residual lesion or recurrence was suspected, CT or MRI scan would be performed immediately. The DFS time was calculated from date of surgery to date of recurrence, OS time was defined as date of surgery until date of death or last follow-up.
Radiomics Signature Acquisition
The acquisition of MVI-related radiomics signature involves several handcrafting steps: 1) Images acquisition and preprocessing; 2) Regions of interest (ROIs) selection; 3) Extraction of radiomics features from the ROIs; 4) Features dimension reduction and construction of radiomics signature (Rad-scores) (Figure 1A–G).
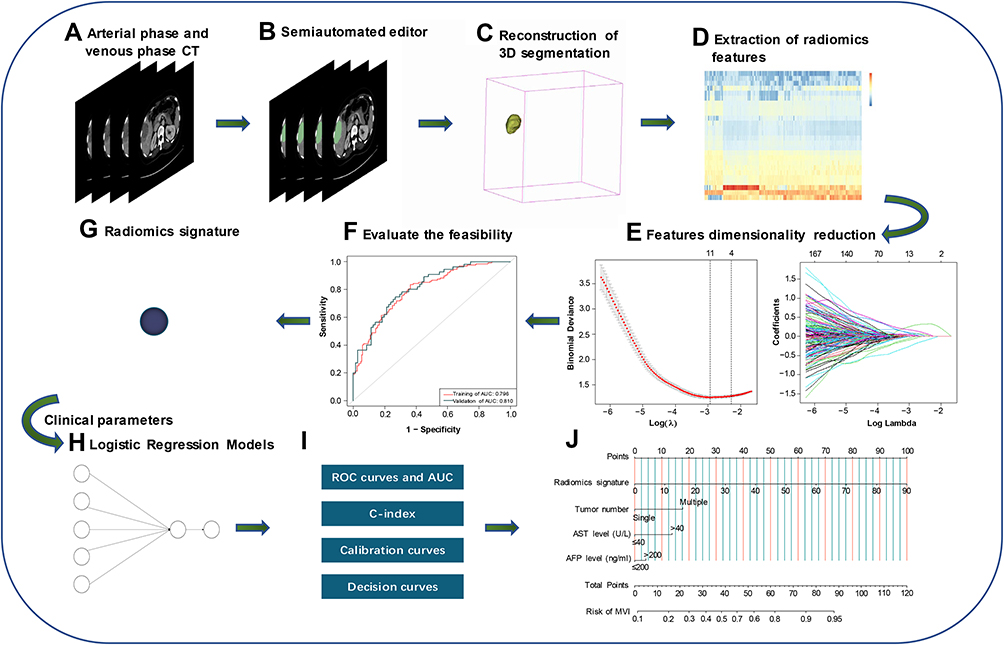 |
Figure 1 Workflow for the preoperative analysis of liver cancer based on CECT and clinical parameters. (A) CECT images acquisition and preprocessing. (B and C) We used the semiautomated editor to segment ROI, then 3D segmentation was reconstructed model. (D–F) Radiomics features about MVI status were extracted separately from ROI and visualized, LASSO was used to select the optimal characteristic features by 10-fold cross-validation, ROC and AUC were used to evaluate the feasibility for the detection of MVI status by above-selected features. (G) Calculate Radiomics signature. (H) Construct predicting models based on Radiomics signature and clinical parameters. (I) Performance evaluation of predicting models. (J) Create the nomogram based on outstanding performance. Abbreviations: CECT, contrast-enhanced computed tomography; 3D, the three dimensional; LASSO, least absolute shrinkage and selection operator; ROC, receiver operating characteristic; AUC, area under the curves; ROI region of interest; MVI, microvascular invasion |
Image Acquisition and Preprocessing
Each patient’s CECT images were acquired according to the AASLD guidelines.20 CECT scans were conducted by multidetector CT scanners: GE Light Speed 64-, 128-, and 256 slice spirals. Arterial phase (AP) imaging was performed by using contrast medium tracking. The trigger is automatically located in lower border of thoracic aorta, threshold: 180 HU. A delay of 5 seconds before image acquisition. The venous phase (VP) started on 30s delay after the end of AP scanning. The CECT scanning parameters were 120 kVp, automatic tube current modulation (mA), Noise Index: 8, and 1.25 mm interval. Images in AP and VP were standardized using z-score normalization to obtain standard normal distribution of image intensities and resampled to voxels of 1 x 1×1 m3 through the Python (v3.7, https://www.python.org) and the open source Simple-ITK package.
ROIs Selection
The CECT images of each patient were conducted using an open-source software, 3D Slicer (v4.11, https://www.slicer.org). ROIs were segmented from tumor in AP and VP phases using the semiautomated editor module. When patients had multiple tumors, the largest one was analyzed. Two radiologists with 8- and 10-years’ experience reviewed the segmented images, respectively (reader1 and reader2). If results were discordant, a third pathologist with 10-years’ working experience joined to confirm the results, and the final ROIs were determined by majority of vote. Readers were blinded to clinical and pathological parameters.
The Extraction of Radiomics Features
The various radiomics features were extracted separately from each ROI on AP and VP via an open-source package named PyRadiomicswith different background filters, radiomics features from CECT were selected.21
Features Dimension Reduction and Radiomics Signature Construction
Value of radiomics features was standardized using Z-score in the training cohort (z = (x − μ)/σ). The optimal radiomics parameters were selected by the least absolute shrinkage and selection operator (LASSO) with 10-fold cross-validation in the training cohort and were applied to validation cohort. Radiomics score (Rad-score) was calculated for each patients via a linear combination of the selected features by their respective coefficients, which we defined as radiomics signature. The receiver-operating characteristic (ROC) curve and area under the curves (AUC) were used to evaluate the discrimination of radiomics signature as a diagnostic variable for detection of MVI status.
Constructing Prediction Models and Performance Evaluation
Three models for preoperative prediction of MVI status were established: radiomics model (RM), clinical model (CM) and clinical-radiomics model (CRM). CM excluded the radiomics signatures, while RM was built on just radiomics signature. CRM was constructed based on logistic regression analysis according to Akaike Information Criteria (AIC) and statistical significance.
Univariate logistic regression analysis was performed to assess risk factors for discriminating MVI status. Variables with p-value <0.05 were incorporated into the multivariate logistic regression analysis. AUCs and the Harrell’s concordance index (c-index) were used to compare discrimination ability of the three models in both training cohort and validation cohort. Calibration curves were plotted, and decision curve analysis was considered to determine potential clinical decision thresholds. A nomogram based on the CRM was built.
Survival Risk Stratification of HCC Patients
The risk score of each patient was calculated by nomogram. Based on median score of each cohort, patients were divided into the high and low risk subgroups. Kaplan–Meier survival curves were used to estimate overall survival (OS) and Disease-free survival (DFS), and Log rank tests were used to compare survival time between the subgroups.
Biomarker Assessment of HCC Tissues by Quantitative Real-Time PCR (q-PCR)
53 individuals were randomly selected among all patients, and their tumor tissues were performed by quantitative real-time PCR (q-PCR) analysis to assess gene relative transcript levels. 10 biomarkers were selected, including BARD1, CKAP5, MAP17, AKR1B10, MDR1, ABCC3, AR, BCAT1, DTGCU2, DOCK3 and serum AFP. Experimental methods, primer sequences of these biomarkers and the reference were showed in Supplementary Table S1. To determine the association between our radiomics signature and these biomarkers with serum AFP level, we unified and normalized all data and then calculated Pearson's correlation coefficient (PCC) and associated p-values, absolute value of PCC greater than 0.3 were considered statistically significant (p < 0.5).
Statistical Analysis
All statistical analyses were performed using software R (version 4.11, https://www.r-project.org/). Kolmogorov-Smirnov test checked whether the continuous variables were normally distributed. Normally distributed and non-normally distributed variables were expressed as mean ± standard deviation or as median with interquartile range (IQR), respectively. Continuous variables were analyzed using the Student’s t-test or Mann-Whitney U-test, categorical variables were tested using Pearson χ2 test or Fisher exact probability test. The threshold for statistical significance was set as p < 0.05.
Results
Baseline Clinical Characteristics of HCC Patients
Guilin dataset was retrospective collected between June 2012 to December 2017, Beijing dataset was retrospective collected between August 2013 to June 2017. HCC patients with or without MVI were selected for subsequent analyses.
A total of 421 patients (male, n = 357; female, n = 63) were included in the study and MVI-present accounted for 43% cases (n = 182). Then 221 patients were excluded from the study according to inclusion and exclusion criteria, and 295 patients from the Guilin dataset were divided into the training cohort, and 126 patients from the Beijing dataset were divided into validation cohort. There were no statistically significant differences of clinical and pathological characteristics between the two cohorts (Table 1). Patient enrollment process and inclusion-exclusion criteria were shown in Figure 2.
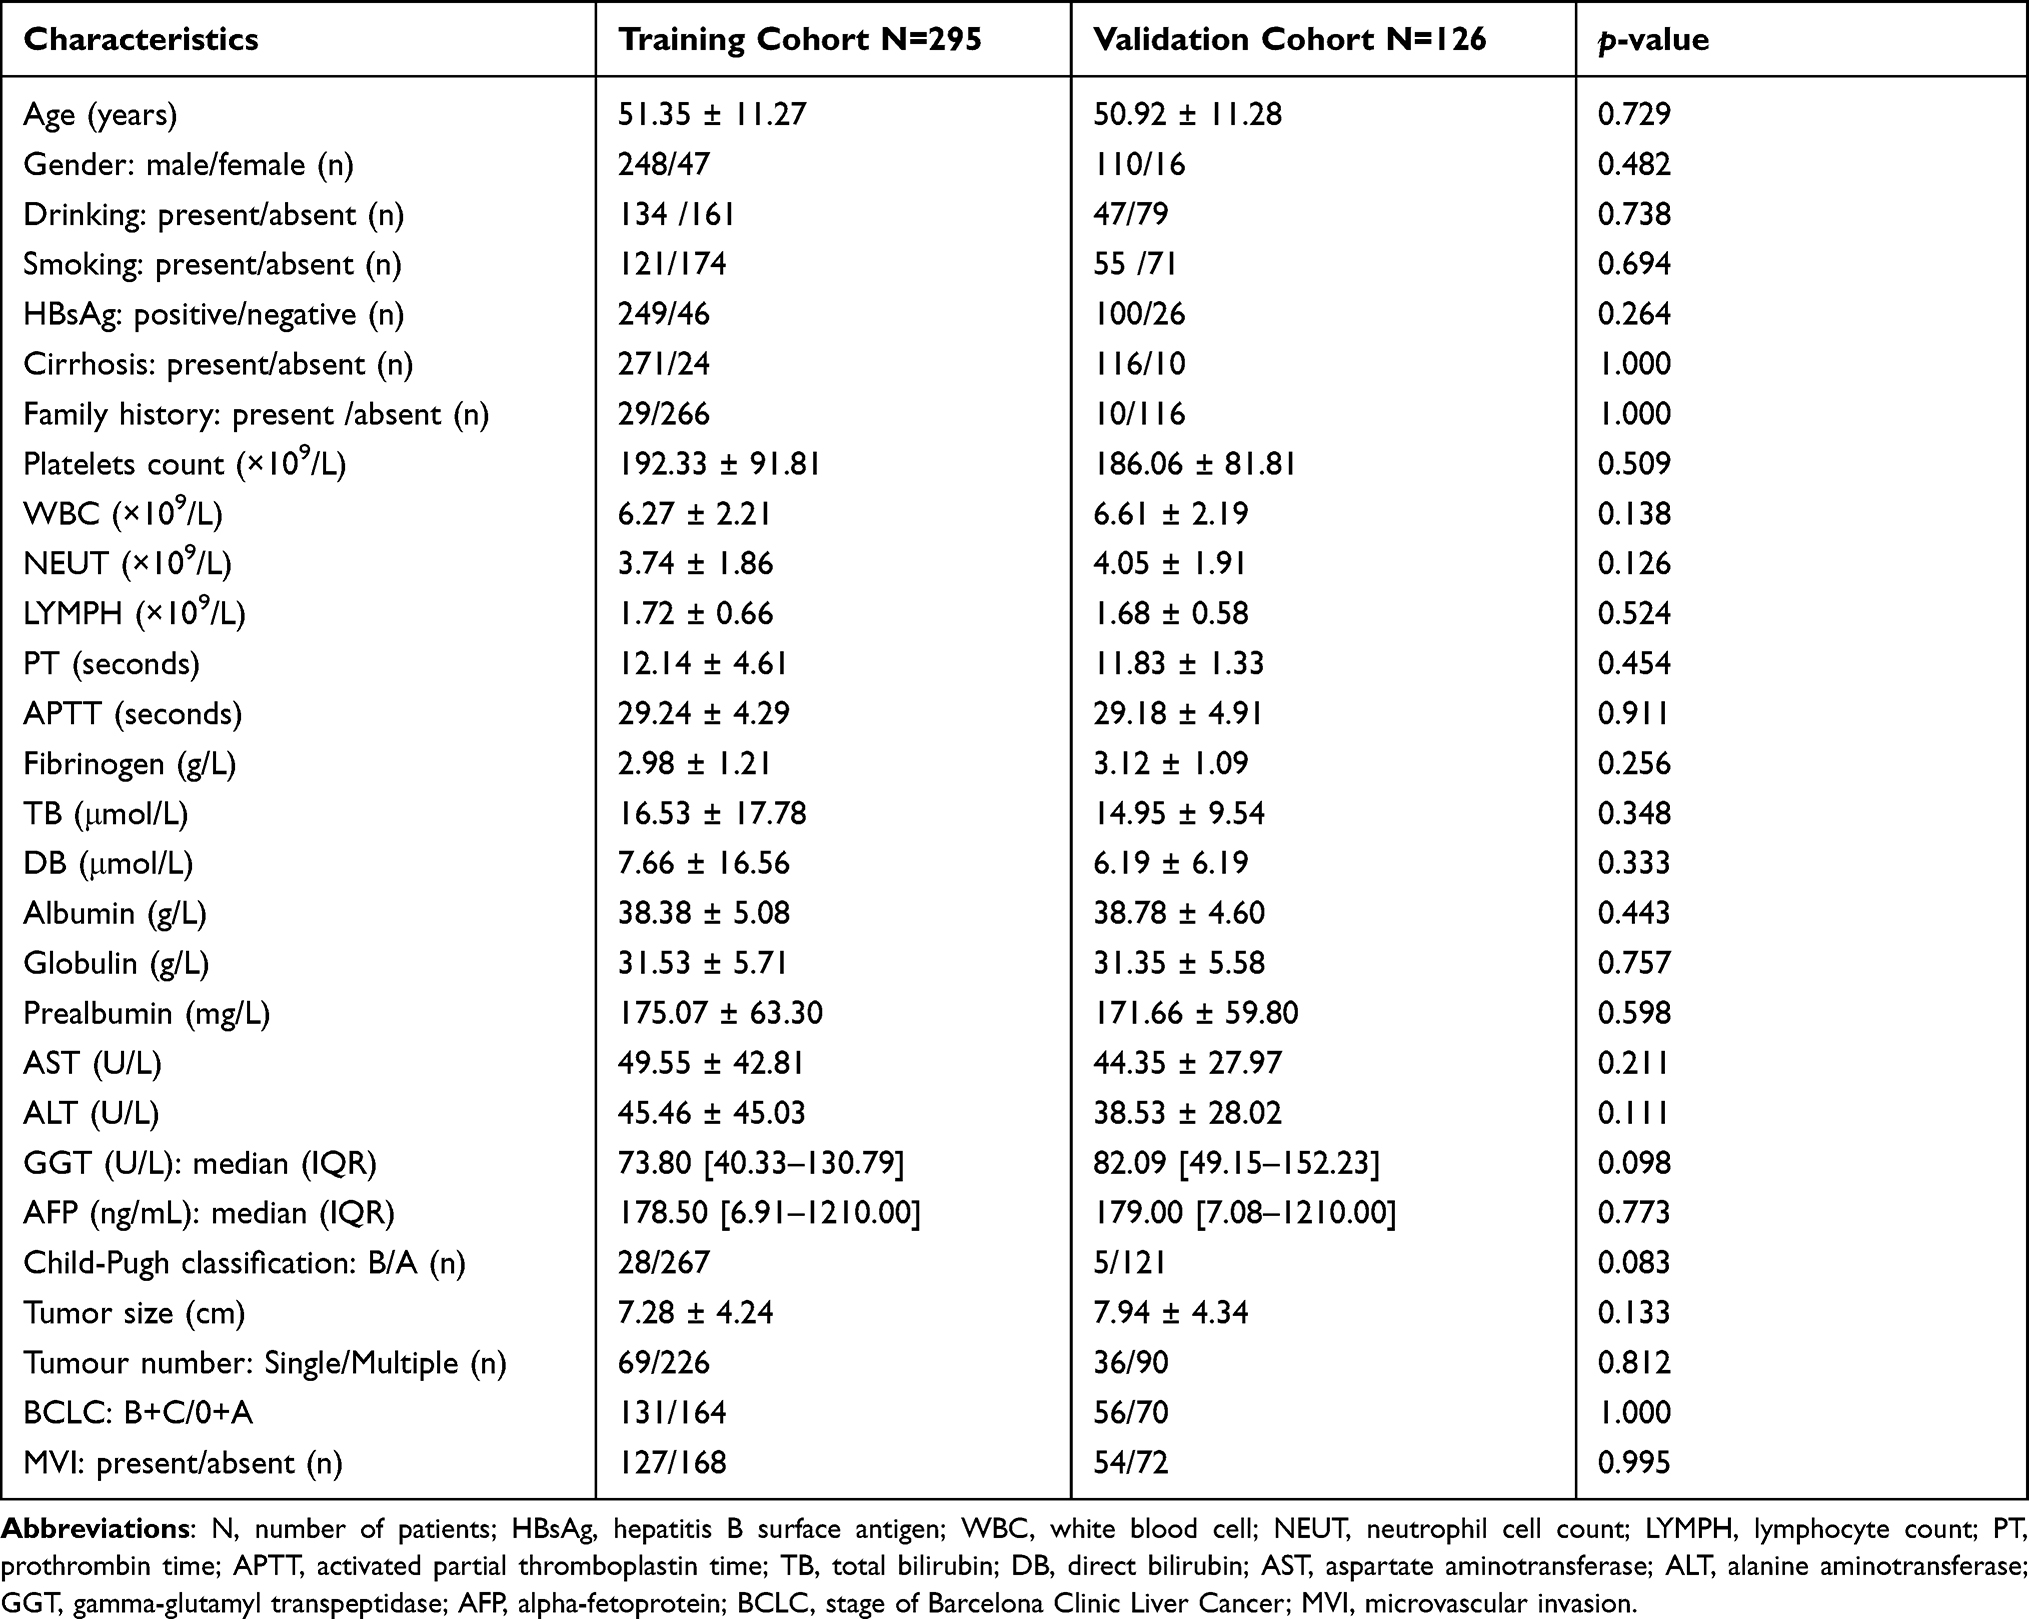 |
Table 1 Comparison of HCC Patients Between Training and Validation Groups |
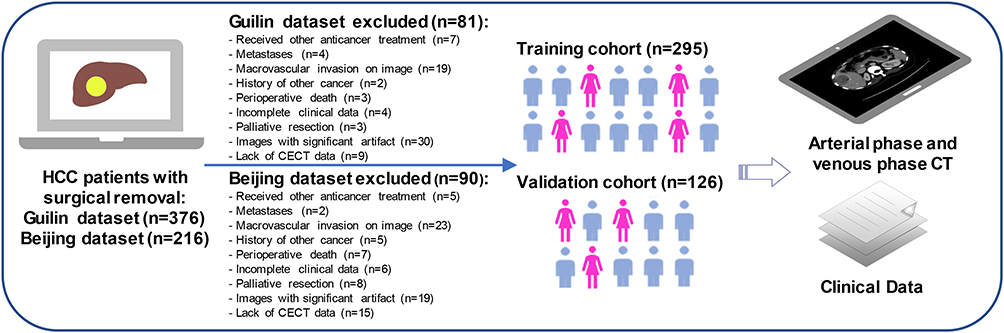 |
Figure 2 Data diagnosed hepatocellular carcinoma with/without MVI collected process. |
Radiomics Features and Foundation of Radiomics Signature
ROIs were delineated from AP and VP and a total of 1962 radiomics features (981 features for AP image and 981 features for VP image) were extracted. In training cohort, LASSO regression selected 11 MVI-related radiomics features, with 6 from AP and 5 from VP (Figure 1E). Radiomics score was calculated for each HCC patients based on identified features and their respective coefficients. The radiomics features demonstrated excellent discriminating ability, with an AUC of 0.796 and 0.810 in the training and validation cohort, respectively (Figure 1F). The formula of radiomics signature and results of selected features were shown in Supplementary Table S2.
Univariate and Multivariate Logistic Regression Analyses
We performed univariate logistic regression analysis using the clinical parameters and radiomics signature in training cohort and results were shown as follows: Fibrinogen (odds ratio [OR], 2.02; 95% CI, 1.26–3.22; p < 0.001), Prealbumin (OR, 0.51; 95% CI, 0.31–0.84; p = 0.015), AST (OR, 3.16; 95% CI, 1.96–5.11; p < 0.001), ALT (OR, 1.98; 95% CI, 1.23–3.17; p < 0.001), GGT (OR, 2.79; 95% CI, 1.60–4.87; p < 0.001), AFP levels (OR, 1.70; 95% CI, 1.07–2.71; p = 0.022), tumor size (OR, 4.38; 95% CI, 2.61–7.36; p < 0.001), tumor number (OR, 2.80; 95% CI, 1.60–4.88; p < 0.001), radiomics signature (OR, 1.08; 95% CI, 1.05–1.10; p < 0.001). The above significant indicators were incorporated into the multivariate logistic regression analysis, and AST (OR, 2.34; 95% CI, 1.376–3.982; p < 0.001), tumor number (OR, 2.86; 95% CI, 1.563–5.325; p < 0.001), radiomics signature (OR, 1.07; 95% CI, 1.044–1.097; p < 0.001) were identified as significant independent predictors for HCC patients with MVI (Table 2).
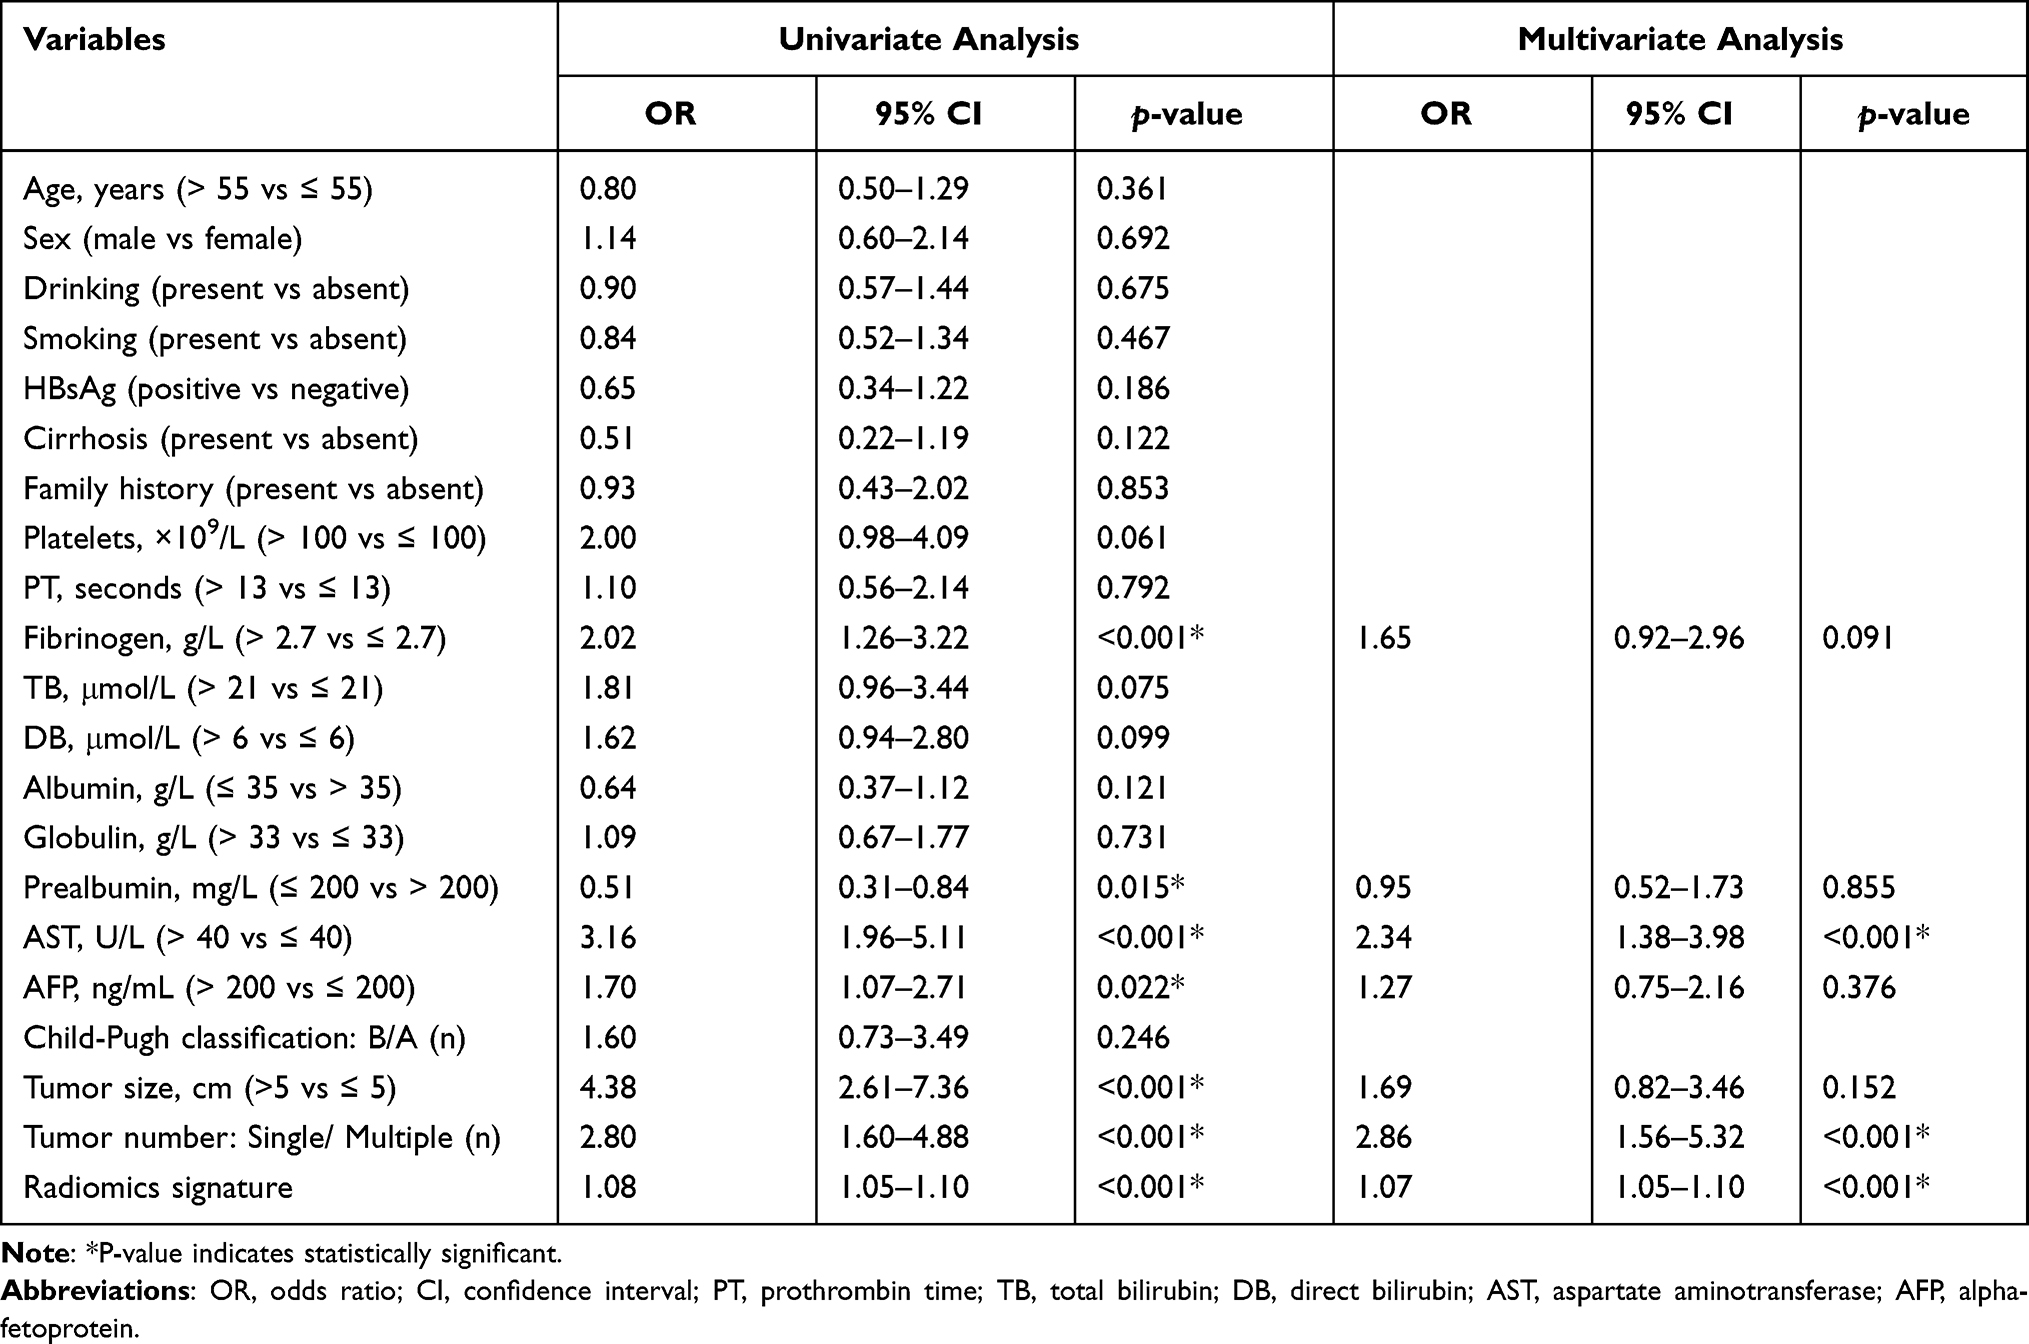 |
Table 2 Univariate and Multivariate Logistic Regression Analysis of HCC Patients with Microvascular Invasion in Training Group |
Development and Validation of the Nomogram
The multivariate logistic regression analysis selected AST, tumor number, radiomics signature as significant factors for MVI prediction. Through AFP level (OR, 1.270; 95% CI, 0.747–2.156; p = 0.376) was not included, we still incorporated it in prediction model as it remained well acknowledged and significant for HCC patients clinically. Accordingly, we defined AST, tumor number and serum AFP level as clinically MVI relevant parameters, while radiomics signature as radiological one. Then radiomics model (RM), clinical model (CM) and clinical-radiomics model (CRM) were established for preoperative prediction of MVI status. The AUCs of CRM, RM and CM were 0.767 (95% CI: 0.713–0.822), 0.724 (95% CI: 0.666–0.782) and 0.697 (95% CI: 0.637–0.757) in the training cohort and were 0.793 (95% CI: 0.714–0.874), 0.750 (95% CI: 0.666–0.834) and 0.648 (95% CI: 0.552–0.744) in the validation cohort, respectively (Figure 3A and B).
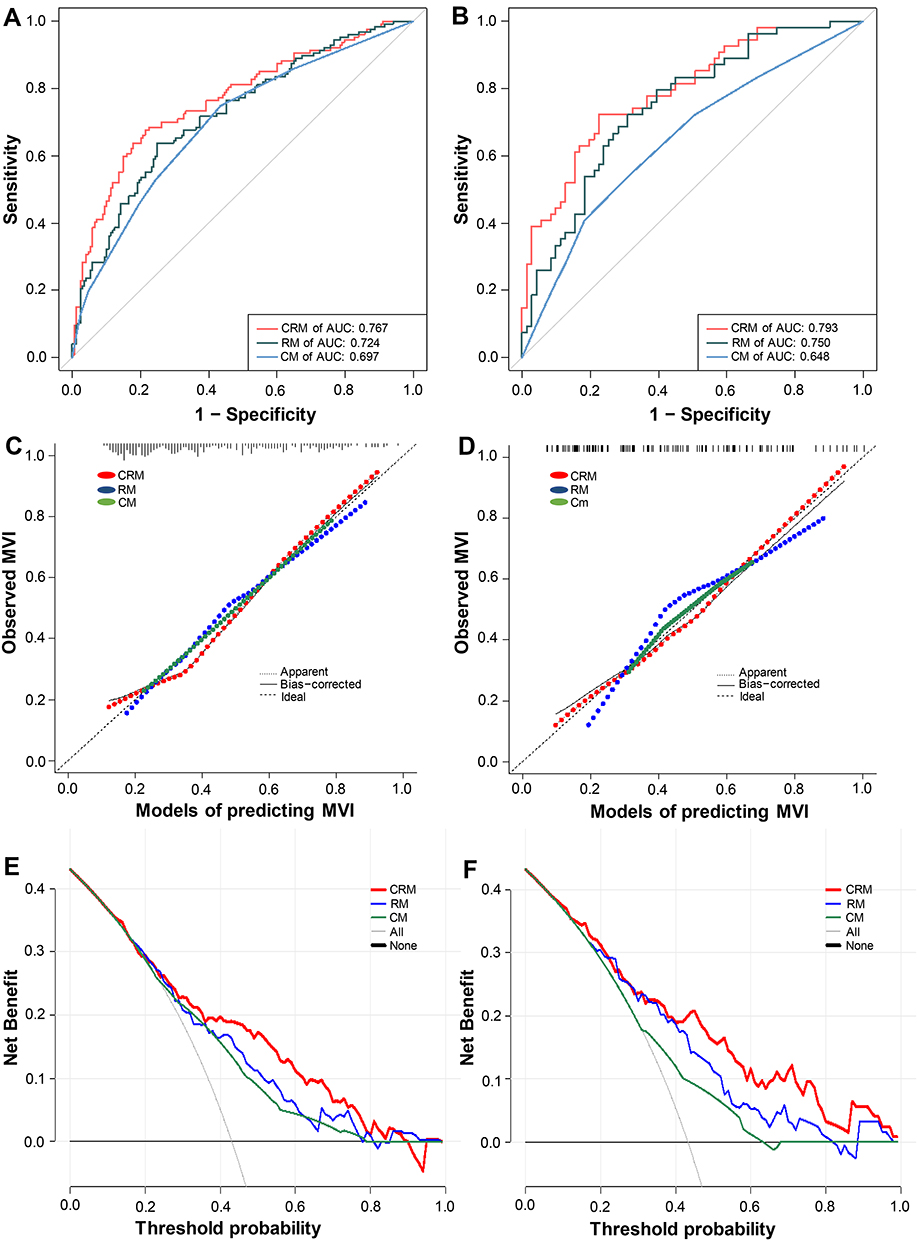 |
Figure 3 ROC analyses to assess the abilities of the three models to predict MVI in the (A) training and (B) validation cohorts. Calibration curves of the three models in the (C) training and (D) validation cohorts. Decision curve analysis of the nomogram in the (E) training and (F) validation cohorts. Solid line: predictive nomogram. The predicted probabilities of MVI are plotted on the X-axis, and actual MVI probabilities are plotted on the Y-axis. Abbreviations: MVI, microvascular invasion; ROC, receiver operating characteristics. |
Calibration curves were used to further assess the accuracy of the three models, and the calibration curve of CRM indicated a good predictive performance in both training and validation cohort (Figures 3C and 4D). Decision curve analysis indicated CRM added more net benefit than the other two models, especially in probability threshold of 40–68% and 46–76% in both two cohorts, which suggested that CRM had significant clinical utility (Figure 3E and F). Ultimately, we constructed a novel nomogram based on CRM (Figure 1J). The nomogram is ideal for predicting MVI status among HCC patients, which has favorable performance and high precision with C-index of 0.767 (95% CI: 0.713–0.822) and 0.793 (95% CI: 0.714–0.874) in training and validation cohorts, respectively.
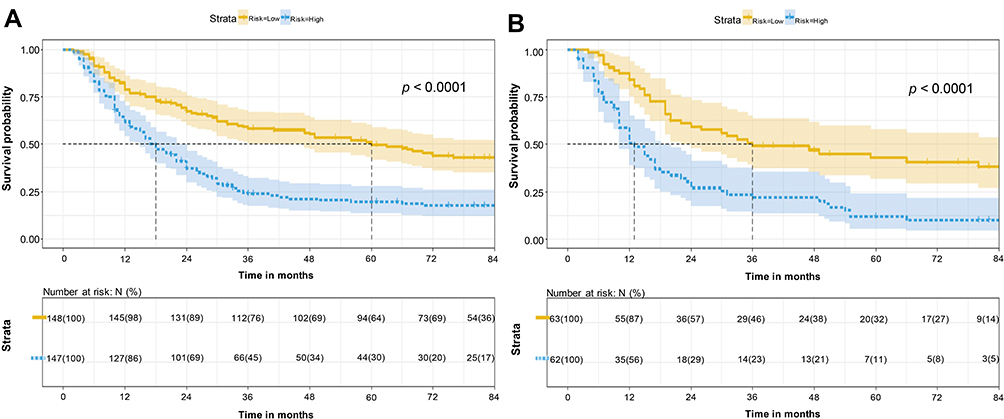 |
Figure 4 Survival curves according to nomogram. The Kaplan–Meier curves depict disease-free survival in HCC patients according to the classification of nomogram in the (A) training and (B) validation cohorts. |
Prognostic Stratification for Survival
We calculated the total score for each patient based on nomogram in the training and validation cohorts, respectively. Using the median risk score as cut-off threshold, patients were divided into the low- and high-risk subgroups: for the training cohort, the median OS time was 71 months, 33 months and the median DFS time was 60 months, 18 months in the low- (score ≤35.758) and high-risk (score >35.758) subgroups, respectively; and in the validation cohort, the median OS time was 70 months, 25 months and the median DFS time was 36 months, 13 months in the low- (score ≤38.303) and high-risk (score >38.303) subgroups, respectively.
Kaplan–Meier analysis showed significantly different DFS and OS curves of the low- and high-risk subgroups in both training cohort (log rank test, p < 0.0001) and validation cohort (log rank test, p < 0.0001), respectively (Figure 4A and B, Supplementary Figure S1A and S1B).
Correlation Analysis Between Biomarkers and Radiomics Signature
53 patients were randomly selected in our study, and 10 biomarkers were detected by q-PCR analysis from the tumor tissues. Biomarkers’ relative transcript levels, serum AFP level and radiomics signature were combined for the correlation analysis (Figure 5), and results showed that BCAT1 (PCC = 0.335, p =1.542e-2), DTGCU2 (PCC = 0.362, p = 8.415e-3), DOCK3 (PCC = 0.352, p =1.0511e-2) and AFP (PCC = 0.382, p = 5.225e-4) had significant association with radiomics signature.
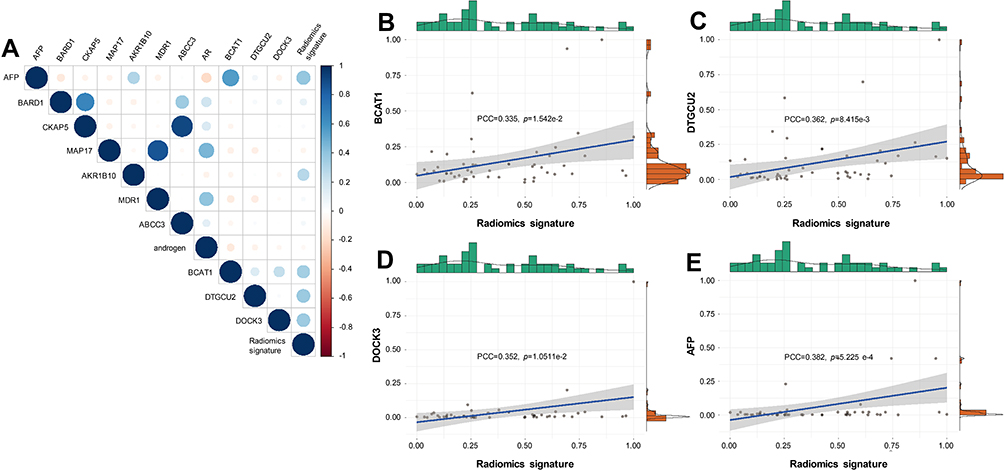 |
Figure 5 Association of radiomics signature with biomarker expression levels. Circle plot visualizations of correlation between radiomics signature and biomarkers expression levels are shown in (A). Scatter plot visualizations of correlation between radiomics signature and biomarker expression levels and serum AFP levels are shown in (B–E). |
Discussion
Consistently, the presence of MVI is considered as a significant risk indicator for worse outcomes in HCC.6–9 The purpose of our study is to develop and validate a individualized nomogram for estimating MVI status preoperatively based on combination of radiomics signature with routine clinical variables, including AST, tumor number and AFP level. In addition, the new nomogram enables favorable stratification of HCC patient into different risk groups. Final, we explored correlations between radiomics signature of MVI based on CECT and 10 tumor biomarkers from HCC issue measured by q-PCR with serum AFP level.
As the first-line treatment for HCC, operation procedure of surgical resection is determined by surgeons at present. Different strategies would be applied based on patients’ conditions in clinic, non-anatomic resection would be conducted if tumor were poorly differentiated or with MVI, while anatomic resection was preferred to non-anatomic resection and may associate with lower rate of recurrence.22 Therefore, preoperative assessment of probability of MVI is of tremendous significance and may help improve prognosis of HCC patients dramatically. Nevertheless, preoperative MVI assessment remained a conundrum. In our study, the CRM in predicting MVI exhibited outstanding performance, better than the other two models, with AUCs of 0.796 and 0.810 in two cohorts. The calibration curve of CRM also demonstrated good consistency among three models, suggesting CRM may be a reliable tool for estimation of MVI. Moreover, the decision curve analysis showed that our nomogram had the highest clinical net benefit across most ranges of threshold probabilities, which further demonstrated good clinical application value and discriminative performance of CRM.
It is still noteworthy that preoperative AFP level showed deficient ability to predict MVI status in the multivariate regression analysis. In order to matching general strategies, AFP levels will be excluded from the final regression model. However, the effect of a predictor may depend on the other predictors or contain nuances unique to the full dataset.23 The association was not statistically significant may not necessarily mean it was not significant in the chain of causation. AFP, performing as a well-acknowledged biological predictor of HCC, reveals burden of tumor and aggressive phenotype.24,25 Hence, AFP was still considered as independent predictor of MVI status in the modeling procedures. Tumor number is often regarded as a surrogate marker for MVI. It has been shown previously that tumor number positively related to the incidence of MVI, and frequency of MVI dramatically increased as tumor number increased.26–28 Elevated AST level has been investigated as a detrimental factor on prognosis for HCC patients, which reflects liver burden and may indicate anti-aggressiveness of liver to some extent.29,30 To our knowledge, few studies found AST as an independent predictor of MVI, AST was identified as independent predictor of MVI for HCC patients in our current study.
Furthermore, among all independent risk predictors in CRM, the weight of radiomics signature constituted the largest proportion, suggesting that radiomics features may contain crucial information about MVI and great potential to effectively predict survival and prognosis of HCC patients, which emphasized radiomics features’ great potential in clinical application. Kim et al found that radiomics features extracted from Gadoxetic Acid-Enhanced Magnetic Resonance Imaging could be used to predict early recurrence of patients with HCC after surgical resection.31 Xu et al based on interested tumor regions, derived three different ROIs through the erosion and dilation algorithm and used these ROIs in their study. The AUCs of the models in predicting MVI status were as high as 0.909 and 0.889 in the training and validation cohort, respectively.32 However, their models included much more vital factors than Rad-scores: tumor capsule, tumor margin, peritumoral tissue. And above-mentioned analyses did not reveal biological significance behind quantitative radiological characteristics.
Different from semantic features, such as tumor number, directly observed in the preoperative images by radiological specialists, our radiomics signature is obtained from CECT images via specific computer-aided methods other than naked eyes. Radiological features could reflect subtle texture changes in neoplastic lesions that were hardly discernible to human eyes, some of which may also contain significant implication about microenvironment of tumor and its periphery.
We also notice that before radiomics signature production in our study, the predictive performance of the result of features dimensionality reduction better than the nomogram, this suggesting the existence of issues that a poor reproducibility and comparability among the high-throughput features. Rad-scores can be drawn from a diversity of algorithms, there may be potential limitations of LASSO regression for burgeoning high-throughput features. Currently, authoritative and universal algorithms are needed to settle the mentioned problems. To improve feature reproducibility, one important method is to calculate the objective Rad-scores, which can help explain significance of radiomics signature and predict biological characterization.
However, the physiological mechanism behind the radiomics signature is not fully understood at present. We hypothesize that radiomics signature of MVI in our study is associated with expression of important biomarkers in the pathogenesis of HCC. Further researches are necessary to confirm the hypothesis. Then, we carried out q-PCR analysis for 10 important tumor biomarkers of HCC, whose roles may be involved in metabolism relevant events of cells and inhibition of tumor cell proliferation. We found negative and positive associations between the expressions of those biomarkers and radiomics signature. Correlations showed their association were real existence. BCAT1 may be a significant biomarker of tumor metastasis in HCC and its overexpression may induce circulating tumor cells release via triggering epithelial–mesenchymal transition.33,34 In HCC, DTGCU2 is elevated, and its high expression is significantly correlated with worse prognosis and metastases.35 DOCK3 acts as a cancer‐promoting gene, contributing to adhesion, migration and invasion of tumor cells.36,37
Previous findings revealed that MRI radiomic features may play important roles to distinguish Glioblastoma subtypes, become potential biomarkers of cancer, and even involve in some important molecular pathways.17 Some scholars demonstrated radiomics features extracted from CT exhibited substantial heterogeneity and could predict survival for lung cancer, head and neck cancer patients, and were associated with gene-expression profiles or expression patterns.18 It may be significant differences in image features among differences populations, which contained valuable information for prognosis prediction, and even some image features were linked with gene expressions at the protein level.38 Whereas only unimodal analytic approaches were used in the above-mentioned studies. Due to the difficulty of gathering multi-modal data, it is very hard to investigate image features comprehensively. These preliminary experiments illustrated associations between tumor biochemistry and medical image features, and that quantitative image features were of sufficient potential in predicting tumorigenesis, development and prognosis of many cancers and even possible to improve medical decision support. Nevertheless, relationships between radiomics features and clinical factors, gene expression levels and other biological behaviors are still needed to be further explored.
Several limitations of our present study should be acknowledged. To begin with, this was a retrospective analysis along with well-known and inevitable limitation of retrospective data, though the data were screened carefully. Secondly, the CECT images were collected from different time and institution, albeit complying with a standard research protocol, we cannot deny the fact that the results may ascribe to diverse institutions and scanners. What’s more, with the progression of multimodality imaging techniques, 18F-FDG PET/CT and gadoxetic acid disodium-enhanced MRI play an important role in clinical HCC’s examination.39,40 Here we merely explore one type of imaging data. Fourthly, the number of genes and tissue samples tested by qPCR is limited. Finally, we have targeted only one kind of ROIs from tumor region, which may omit potential in the peritumoral area. Based on the entire tumor profile, utilizing complex algorithms, automated rebuilding of a new ROI, which is decreased to 50% of the initial volume, the classification models may perform well to predict MVI status.32 Nonetheless, these studies indicated that significant information may be contained in different tumor regions of HCC.
Conclusion
We demonstrated a novel nomogram based on AST, tumor number, AFP level and radiomics signature to predict MVI and prognostic risk of HCC. Our nomogram is easy to calculate and contains variables routinely assessed in clinical examinations. This study provides some biologic corroboration to radiomics signatures of MVI at the same time. Meanwhile we expect to optimize and standardize an imaging model to broaden the application of radiomics for cancers.
Abbreviations
AASLD, American Association for the Study of Liver Diseases; AFP, alpha-fetoprotein; AIC, Akaike information criteria; ALT, alanine aminotransferase; AP, arterial phase; AST, aspartate aminotransferase; AUC, area under the curves; BCLC, Barcelona Clinic Liver Cancer; CECT, contrast-enhanced CT; CI, confidence interval; C-index, Harrell’s concordance index; CM, clinical model; CRM, clinical-radiomics model; CT, computed tomography; DFS, disease-free survival; HCC, hepatocellular carcinoma; IQR, interquartile range; LASSO, least absolute shrinkage and selection operator; LT, liver transplantation; MVI, microvascular invasion; OR, odds ratio; OS, overall survival; q-PCR, quantitative real-time PCR; RM, radiomics model; ROC, receiver operating characteristic; ROI, region of interest; USG, ultrasonography; VP, venous phase.
Data Sharing Statement
The raw data supporting the conclusions of this article will be made available by the authors, without undue reservation.
Ethics Approval and Informed Consent
The studies involving human participants were reviewed and approved by the research ethics committee of Affiliated Hospital of Guilin Medical University and Peking University People’s Hospital. The patients/participants provided their written informed consent to participate in this study.
Author Contributions
All authors made a significant contribution to the work reported, whether that is in the conception, study design, execution, acquisition of data, analysis and interpretation, or in all these areas; took part in drafting, revising or critically reviewing the article; gave final approval of the version to be published; have agreed on the journal to which the article has been submitted; and agree to be accountable for all aspects of the work. Tingfeng Xu, Liying Ren and Minjun Liao contributed equally to this work and share first authorship.
Funding
This work was supported in part by the National Key Sci-Tech Special Project of China (No. 2018ZX10302207), the Natural Science Foundation of Guangxi (No. 2018GXNSFDA138001), the Peking University Medicine Seed Fund for Interdisciplinary Research (No. BMU2021MX007) and the Fundamental Research Funds for the Central Universities, the Peking University People’s Hospital Scientific Research Development Funds (No. RDX2020–06), the Science and Technology Planning Project of Guilin (No. 20190218-1) and the Opening Project of Key laboratory of High-Incidence-Tumor Prevention & Treatment (Guangxi Medical University), Ministry of Education (No. GKE-KF202101).
Disclosure
The authors have no conflicts of interest for this work.
References
1. Sung H, Ferlay J, Siegel RL, et al. Global cancer statistics 2020: GLOBOCAN estimates of incidence and mortality worldwide for 36 cancers in 185 countries. CA Cancer J Clin. 2021;71(3):209–249. doi:10.3322/caac.21660
2. Omata M, Cheng AL, Kokudo N, et al. Asia-Pacific clinical practice guidelines on the management of hepatocellular carcinoma: a 2017 update. Hepatol Int. 2017;11(4):317–370. doi:10.1007/s12072-017-9799-9
3. Marshall AE, Rushbrook SM, Vowler SL, et al. Tumor recurrence following liver transplantation for hepatocellular carcinoma: role of tumor proliferation status. Liver Transpl. 2010;16(3):279–288. doi:10.1002/lt.21993
4. Unitt E, Marshall A, Gelson W, et al. Tumour lymphocytic infiltrate and recurrence of hepatocellular carcinoma following liver transplantation. J Hepatol. 2006;45(2):246–253. doi:10.1016/j.jhep.2005.12.027
5. Fisher RA, Kulik LM, Freise CE, et al. Hepatocellular carcinoma recurrence and death following living and deceased donor liver transplantation. Am J Transplant. 2007;7(6):1601–1608. doi:10.1111/j.1600-6143.2007.01802.x
6. Lim KC, Chow PK, Allen JC, et al. Microvascular invasion is a better predictor of tumor recurrence and overall survival following surgical resection for hepatocellular carcinoma compared to the Milan criteria. Ann Surg. 2011;254(1):108–113. doi:10.1097/SLA.0b013e31821ad884
7. Shah SA, Cleary SP, Wei AC, et al. Recurrence after liver resection for hepatocellular carcinoma: risk factors, treatment, and outcomes. Surgery. 2007;141(3):330–339. doi:10.1016/j.surg.2006.06.028
8. Hwang S, Lee YJ, Kim KH, et al. The impact of tumor size on long-term survival outcomes after resection of solitary hepatocellular carcinoma: single-institution experience with 2558 patients. J Gastrointest Surg. 2015;19(7):1281–1290. doi:10.1007/s11605-015-2849-5
9. Rodriguez-Peralvarez M, Luong TV, Andreana L, Meyer T, Dhillon AP, Burroughs AK. A systematic review of microvascular invasion in hepatocellular carcinoma: diagnostic and prognostic variability. Ann Surg Oncol. 2013;20(1):325–339. doi:10.1245/s10434-012-2513-1
10. Okamura Y, Sugiura T, Ito T, et al. The predictors of microscopic vessel invasion differ between primary hepatocellular carcinoma and hepatocellular carcinoma with a treatment history. World J Surg. 2018;42(11):3694–3704. doi:10.1007/s00268-018-4658-y
11. Hirokawa F, Hayashi M, Miyamoto Y, et al. Outcomes and predictors of microvascular invasion of solitary hepatocellular carcinoma. Hepatol Res. 2014;44(8):846–853. doi:10.1111/hepr.12196
12. Renzulli M, Brocchi S, Cucchetti A, et al. Can current preoperative imaging be used to detect microvascular invasion of hepatocellular carcinoma? Radiology. 2016;279(2):432–442. doi:10.1148/radiol.2015150998
13. Lei Z, Li J, Wu D, et al. Nomogram for preoperative estimation of microvascular invasion risk in Hepatitis B virus-related hepatocellular carcinoma within the Milan criteria. JAMA Surg. 2016;151(4):356–363. doi:10.1001/jamasurg.2015.4257
14. Gillies RJ, Kinahan PE, Hricak H. Radiomics: images are more than pictures, they are data. Radiology. 2016;278(2):563–577. doi:10.1148/radiol.2015151169
15. Nishida N, Kudo M. Artificial intelligence in medical imaging and its application in sonography for the management of liver tumor. Front Oncol. 2020;10:594580. doi:10.3389/fonc.2020.594580
16. Kumar V, Gu Y, Basu S, et al. Radiomics: the process and the challenges. Magn Reson Imaging. 2012;30(9):1234–1248. doi:10.1016/j.mri.2012.06.010
17. Itakura H, Achrol AS, Mitchell LA, et al. Magnetic resonance image features identify glioblastoma phenotypic subtypes with distinct molecular pathway activities. Sci Transl Med. 2015;7(303):303ra138. doi:10.1126/scitranslmed.aaa7582
18. Aerts HJ, Velazquez ER, Leijenaar RT, et al. Decoding tumour phenotype by noninvasive imaging using a quantitative radiomics approach. Nat Commun. 2014;5:4006. doi:10.1038/ncomms5006
19. Bruix J, Sherman M, Llovet JM, et al. Clinical management of hepatocellular carcinoma. Conclusions of the Barcelona-2000 EASL conference. European Association for the Study of the Liver. J Hepatol. 2001;35(3):421–430. doi:10.1016/s0168-8278(01)00130-1
20. Marrero JA, Kulik LM, Sirlin CB, et al. Diagnosis, staging, and management of hepatocellular carcinoma: 2018 practice guidance by the American association for the study of liver diseases. Hepatology. 2018;68(2):723–750. doi:10.1002/hep.29913
21. van Griethuysen JJM, Fedorov A, Parmar C, et al. Computational radiomics system to decode the radiographic phenotype. Cancer Res. 2017;77(21):e104–e07. doi:10.1158/0008-5472.CAN-17-0339
22. Cucchetti A, Qiao GL, Cescon M, et al. Anatomic versus nonanatomic resection in cirrhotic patients with early hepatocellular carcinoma. Surgery. 2014;155(3):512–521. doi:10.1016/j.surg.2013.10.009
23. Moons KG, Altman DG, Reitsma JB, et al. Transparent reporting of a multivariable prediction model for individual prognosis or diagnosis (TRIPOD): explanation and elaboration. Ann Intern Med. 2015;162(1):W1–73. doi:10.7326/M14-0698
24. Lee JC, Hung HC, Wang YC, et al. Risk score model for microvascular invasion in hepatocellular carcinoma: the role of tumor burden and alpha-fetoprotein. Cancers. 2021;13(17). doi:10.3390/cancers13174403
25. Cucchetti A, Piscaglia F, Grigioni AD, et al. Preoperative prediction of hepatocellular carcinoma tumour grade and micro-vascular invasion by means of artificial neural network: a pilot study. J Hepatol. 2010;52(6):880–888. doi:10.1016/j.jhep.2009.12.037
26. Cancer of the Liver Italian Program (CLIP) Investigators. A new prognostic system for hepatocellular carcinoma: a retrospective study of 435 patients: the Cancer of the Liver Italian Program (CLIP) investigators. Hepatology. 1998;28(3):751–755. doi:10.1002/hep.510280322
27. Ding E, Lu D, Wei L, Feng X, Shen J, Xu W. Predicting tumor recurrence using metabolic indices of (18) F-FDGPET/CT prior to orthotopic liver transplantation for hepatocellular carcinoma. Oncol Lett. 2020;20(2):1245–1255. doi:10.3892/ol.2020.11681
28. Zheng SS, Xu X, Wu J, et al. Liver transplantation for hepatocellular carcinoma: Hangzhou experiences. Transplantation. 2008;85(12):1726–1732. doi:10.1097/TP.0b013e31816b67e4
29. Shen J, Wen J, Li C, et al. The prognostic value of microvascular invasion in early-intermediate stage hepatocellular carcinoma: a propensity score matching analysis. BMC Cancer. 2018;18(1):278. doi:10.1186/s12885-018-4196-x
30. Sohn W, Paik YH, Cho JY, et al. Sorafenib therapy for hepatocellular carcinoma with extrahepatic spread: treatment outcome and prognostic factors. J Hepatol. 2015;62(5):1112–1121. doi:10.1016/j.jhep.2014.12.009
31. Kim S, Shin J, Kim DY, Choi GH, Kim MJ, Choi JY. Radiomics on gadoxetic acid-enhanced magnetic resonance imaging for prediction of postoperative early and late recurrence of single hepatocellular carcinoma. Clin Cancer Res. 2019;25(13):3847–3855. doi:10.1158/1078-0432.CCR-18-2861
32. Xu X, Zhang HL, Liu QP, et al. Radiomic analysis of contrast-enhanced CT predicts microvascular invasion and outcome in hepatocellular carcinoma. J Hepatol. 2019;70(6):1133–1144. doi:10.1016/j.jhep.2019.02.023
33. Luo L, Sun W, Zhu W, et al. BCAT1 decreases the sensitivity of cancer cells to cisplatin by regulating mTOR-mediated autophagy via branched-chain amino acid metabolism. Cell Death Dis. 2021;12(2):169. doi:10.1038/s41419-021-03456-7
34. Qi LN, Xiang BD, Wu FX, et al. Circulating tumor cells undergoing EMT provide a metric for diagnosis and prognosis of patients with hepatocellular carcinoma. Cancer Res. 2018;78(16):4731–4744. doi:10.1158/0008-5472.CAN-17-2459
35. Ma HX, Shu QH, Pan JJ, et al. Expression of Kindlin-1 in human hepatocellular carcinoma and its prognostic significance. Tumour Biol. 2015;36(6):4235–4241. doi:10.1007/s13277-015-3060-8
36. Sanz-Moreno V. Tumour invasion: a new twist on Rac-driven mesenchymal migration. Curr Biol. 2012;22(11):R449–51. doi:10.1016/j.cub.2012.04.024
37. Zhu X, Gao G, Chu K, et al. Inhibition of RAC1-GEF DOCK3 by miR-512-3p contributes to suppression of metastasis in non-small cell lung cancer. Int J Biochem Cell Biol. 2015;61:103–114. doi:10.1016/j.biocel.2015.02.005
38. Bhargava HK, Leo P, Elliott R, et al. Computationally derived image signature of stromal morphology is prognostic of prostate cancer recurrence following prostatectomy in African American Patients. Clin Cancer Res. 2020;26(8):1915–1923. doi:10.1158/1078-0432.CCR-19-2659
39. Vreugdenburg TD, Ma N, Duncan JK, et al. Comparative diagnostic accuracy of hepatocyte-specific gadoxetic acid (Gd-EOB-DTPA) enhanced MR imaging and contrast enhanced CT for the detection of liver metastases: a systematic review and meta-analysis. Int J Colorectal Dis. 2016;31(11):1739–1749. doi:10.1007/s00384-016-2664-9
40. Tanimoto A, Lee JM, Murakami T, et al. Consensus report of the 2nd International Forum for Liver MRI. Eur Radiol. 2009;19(Suppl 5):S975–S989. doi:10.1007/s00330-009-1624-y
 © 2022 The Author(s). This work is published and licensed by Dove Medical Press Limited. The full terms of this license are available at https://www.dovepress.com/terms.php and incorporate the Creative Commons Attribution - Non Commercial (unported, v3.0) License.
By accessing the work you hereby accept the Terms. Non-commercial uses of the work are permitted without any further permission from Dove Medical Press Limited, provided the work is properly attributed. For permission for commercial use of this work, please see paragraphs 4.2 and 5 of our Terms.
© 2022 The Author(s). This work is published and licensed by Dove Medical Press Limited. The full terms of this license are available at https://www.dovepress.com/terms.php and incorporate the Creative Commons Attribution - Non Commercial (unported, v3.0) License.
By accessing the work you hereby accept the Terms. Non-commercial uses of the work are permitted without any further permission from Dove Medical Press Limited, provided the work is properly attributed. For permission for commercial use of this work, please see paragraphs 4.2 and 5 of our Terms.