")
Back to Journals » Clinical Ophthalmology » Volume 10
Preoperative optical coherence tomography visualization of epiretinal membranes enhances surgical strategies
Authors Suzuki N, Hirano Y , Ichida M, Tomiyasu T, Esaki Y, Yasukawa T , Ogura Y
Received 16 September 2016
Accepted for publication 27 October 2016
Published 17 November 2016 Volume 2016:10 Pages 2297—2302
DOI https://doi.org/10.2147/OPTH.S122520
Checked for plagiarism Yes
Review by Single anonymous peer review
Peer reviewer comments 4
Editor who approved publication: Dr Scott Fraser
Norihiro Suzuki, Yoshio Hirano, Miyu Ichida, Taneto Tomiyasu, Yuya Esaki, Tsutomu Yasukawa, Yuichiro Ogura
Department of Ophthalmology and Visual Science, Nagoya City University Graduate School of Medical Sciences, Nagoya, Japan
Purpose: The aim of this study was to evaluate the usefulness of preoperative optical coherence tomography (OCT) findings in patients with macular epiretinal membrane (ERM) for the planning of surgical strategy.
Patients and methods: One hundred twenty-three eyes of 121 patients (49 men, 72 women; mean age, 66 years) with an idiopathic ERM were enrolled. All patients underwent an ophthalmic examination including indirect ophthalmoscopy and OCT (Cirrus HD-OCT 4000 and/or 5000). OCT images obtained using model 4000 were transferred to the model 5000 system for vitreoretinal interface (VRI) analysis. The retinal thickness in each area, occurrence rate, and locations of the edges and partial detachments of the ERMs were evaluated using OCT.
Results: OCT detected identifiable edges in 61 (50%) eyes and partial detachments in 116 (94%) of the 123 eyes. The edges and partial detachments were seen more frequently in the inferior macula. VRI analysis also detected the edges and partial detachments. Excluding the central area, the superior quadrant was the thickest in patients with an ERM.
Conclusion: Preoperatively acquired OCT images are useful for planning surgical strategies and performing the surgeries smoothly.
Keywords: optical coherence tomography, epiretinal membrane, surgical strategy, membrane edges
Introduction
A macular epiretinal membrane (ERM) usually develops after a partial or complete posterior vitreous detachment, and appears as a translucent membrane over the inner retinal surface in the macular area.1 Contraction of this membrane can result in various retinal pathologies, such as retinal distortion, increased macular thickness (with or without increased permeability of retinal vessels), and cystoid macular edema.1 Therefore, surgical removal of ERMs is usually performed on patients who complain of metamorphopsia and visual disturbances.
The surgery should avoid damaging the underlying retina, because the areas in which ERMs are located are highly sensitive for vision. Frequently, the membrane can be directly visualized preoperatively. However, with only slit-lamp observation, it can be difficult for clinicians to determine the thickness and extent of the membranes. During surgery to peel ERMs, if identification of the membrane is difficult, use of indocyanine green,2 trypan blue,3 and intravitreal triamcinolone crystals4 has been described to aid intraoperative identification of internal limiting membranes (ILMs) (the surface of the retina). Surgical planning would be facilitated if the detailed structures of the ERM could be determined preoperatively, as information regarding the thickest area and the edges of the membrane is useful because surgeons usually begin the peeling procedure at these points.
Many studies have described the clinical applications of optical coherence tomography (OCT) and how the technology has revolutionized vitreoretinal practice.5 We previously reported that OCT-guided ERM peeling is useful for performing surgeries smoothly.1
In the current study, we evaluated the usefulness of the preoperative OCT findings in patients with an ERM for planning the surgical strategy and performing the surgeries smoothly.
Patients and methods
This was a retrospective, observational, consecutive case series conducted in an institutional setting. The Institutional Review Board of Nagoya City University Graduate School of Medical Sciences approved the study protocol. All patients provided written informed consent for participation in the study. The described research methods and analysis adhered to the tenets of the Declaration of Helsinki.
This study was conducted at Nagoya City University Hospital from January 2008 through March 2014. One hundred twenty-three eyes of 121 patients (49 men, 72 women; mean age, 66 years; range, 49–92 years) with an idiopathic ERM were enrolled. All patients underwent an ophthalmic examination that included indirect ophthalmoscopy and OCT (Cirrus HD-OCT 4000 and/or 5000; Carl Zeiss Meditec, Jena, Germany). The OCT images obtained using model 4000 were transferred to the model 5000 system for vitreoretinal interface (VRI) analysis. We also evaluated the retinal thickness, occurrence rate, and location of the edges (Figure 1) and partial detachments (Figure 2) using OCT preoperatively in patients with an ERM. Two independent retina specialists, who were masked to our findings identified the edges and partial detachments of the ERMs on the OCT images. The patients who had secondary ERMs or whose OCT images were poor quality because of ocular movements or cataracts were excluded from the study.
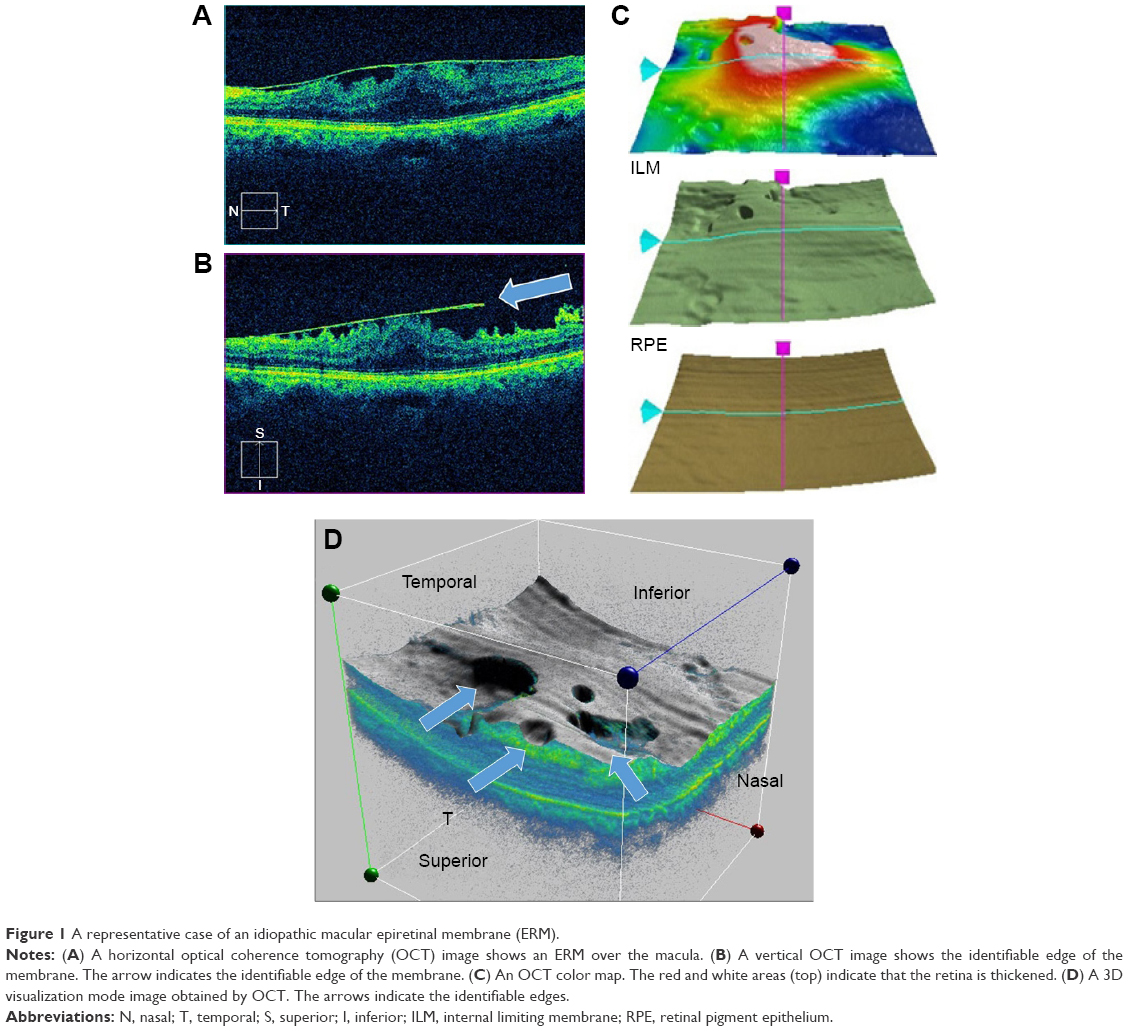 | Figure 1 A representative case of an idiopathic macular epiretinal membrane (ERM). |
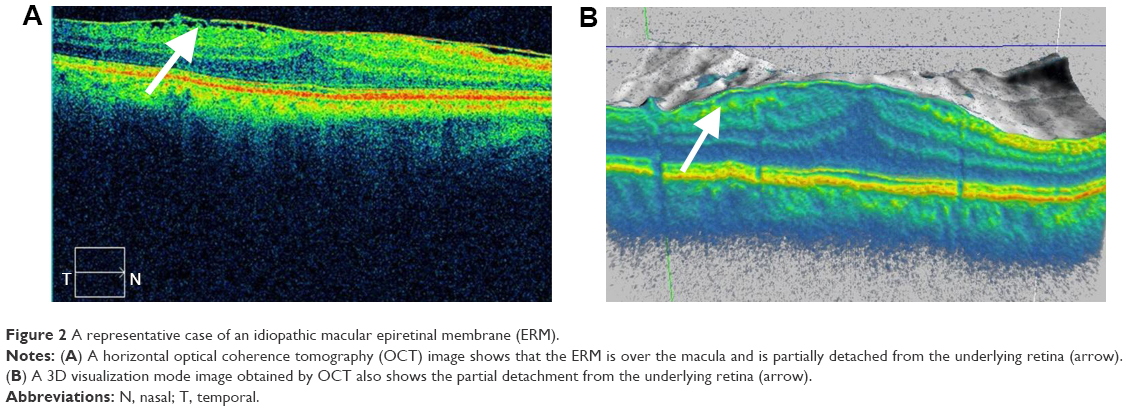 | Figure 2 A representative case of an idiopathic macular epiretinal membrane (ERM). |
Results
Thickest retinal area and average retinal thickness
The thickest retinal area in each patient is shown in Figure 3A. In 42 of the eyes with an ERM, the central area was the thickest, in the other eyes with an ERM, the superior area was the thickest (Figure 3A and B).
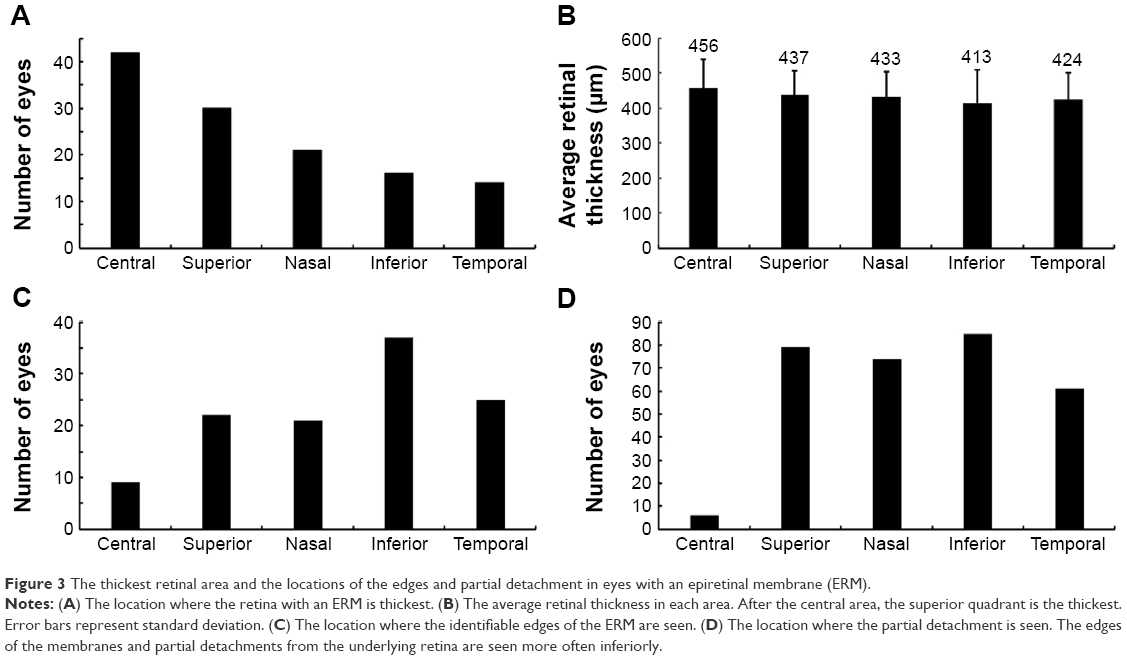 | Figure 3 The thickest retinal area and the locations of the edges and partial detachment in eyes with an epiretinal membrane (ERM). |
Location of the edges and partial detachments
The edges and partial detachments of the ERMs were observed in 61 (50%) eyes and 116 (94%) eyes, respectively. The locations of the edges and partial detachments from the underlying retina are shown in Figure 3C and D. The membrane edges and partial detachments from the underlying retina were most often seen inferiorly.
VRI analysis using Cirrus HD-OCT model 5000 images
VRI analysis performed using the Cirrus HD-OCT model 5000 also detected the edges and partial detachments of the ERMs (Figure 4). The edges and partial detachments were detected using VRI analysis in 40 (66%) eyes of 61 eyes and 71 (61%) eyes of 116 eyes, respectively (Table 1). VRI analysis also detected the edges and partial detachments on one panel (Figure 4).
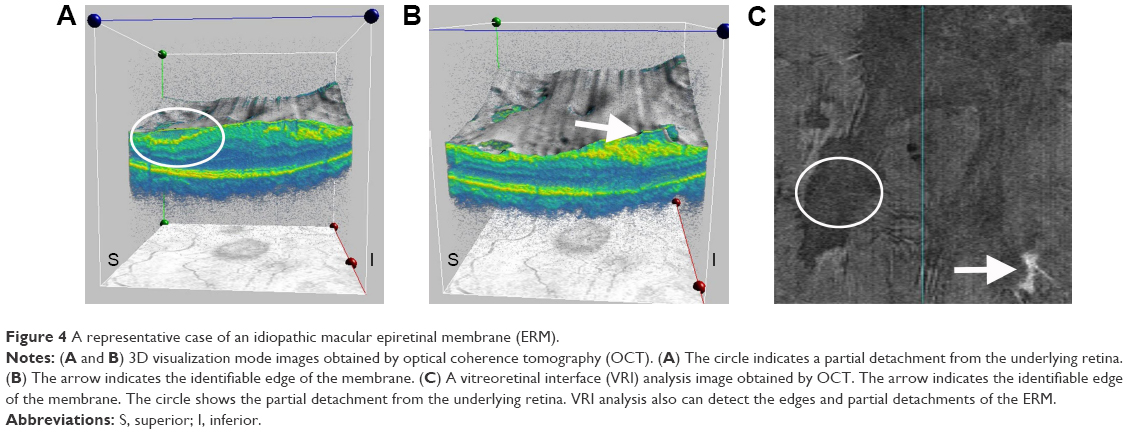 | Figure 4 A representative case of an idiopathic macular epiretinal membrane (ERM). |
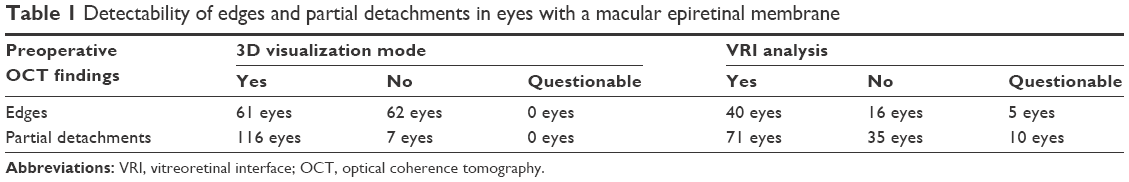 | Table 1 Detectability of edges and partial detachments in eyes with a macular epiretinal membrane |
Discussion
The preoperative OCT findings are useful for planning surgical strategies and performing surgeries smoothly. In the current study, we found that the edges and partial detachments were seen, respectively, in 50% and 94% of all eyes, and were more frequently located inferiorly in eyes with an ERM. Therefore, the inferior area can be used as a target for peeling because there is some space between the underlying retina and the edges and partial detachments of the ERMs. Excluding the central area, the superior quadrant was the thickest in patients with an ERM. Of course, the central area is not an appropriate target for peeling because the central vision might be at risk. When identification of the edges and partial detachments preoperatively and intraoperatively is not possible, the thickened area should be used for peeling. An OCT color map (Figure 1) can easily visualize the thickened area.
VRI analysis performed using the Cirrus HD-OCT model 5000 also visualized the edges and partial detachments, although the detectability was inferior to that of the 3D visualization mode. VRI analysis was superior because no slicing of the 3D images of the ERMs is needed to detect the edges and partial detachments. Although VRI analysis was inferior to the 3D visualization mode in depicting the space between the membrane and underlying retina (Figure 4), VRI analysis was superior for visualizing the locations of the edges and partial detachments on one panel (Figure 4). With preoperative OCT findings using a color map, 3D visualization mode, and VRI analysis (Figure 5), we determined the detailed structures of the ERM.
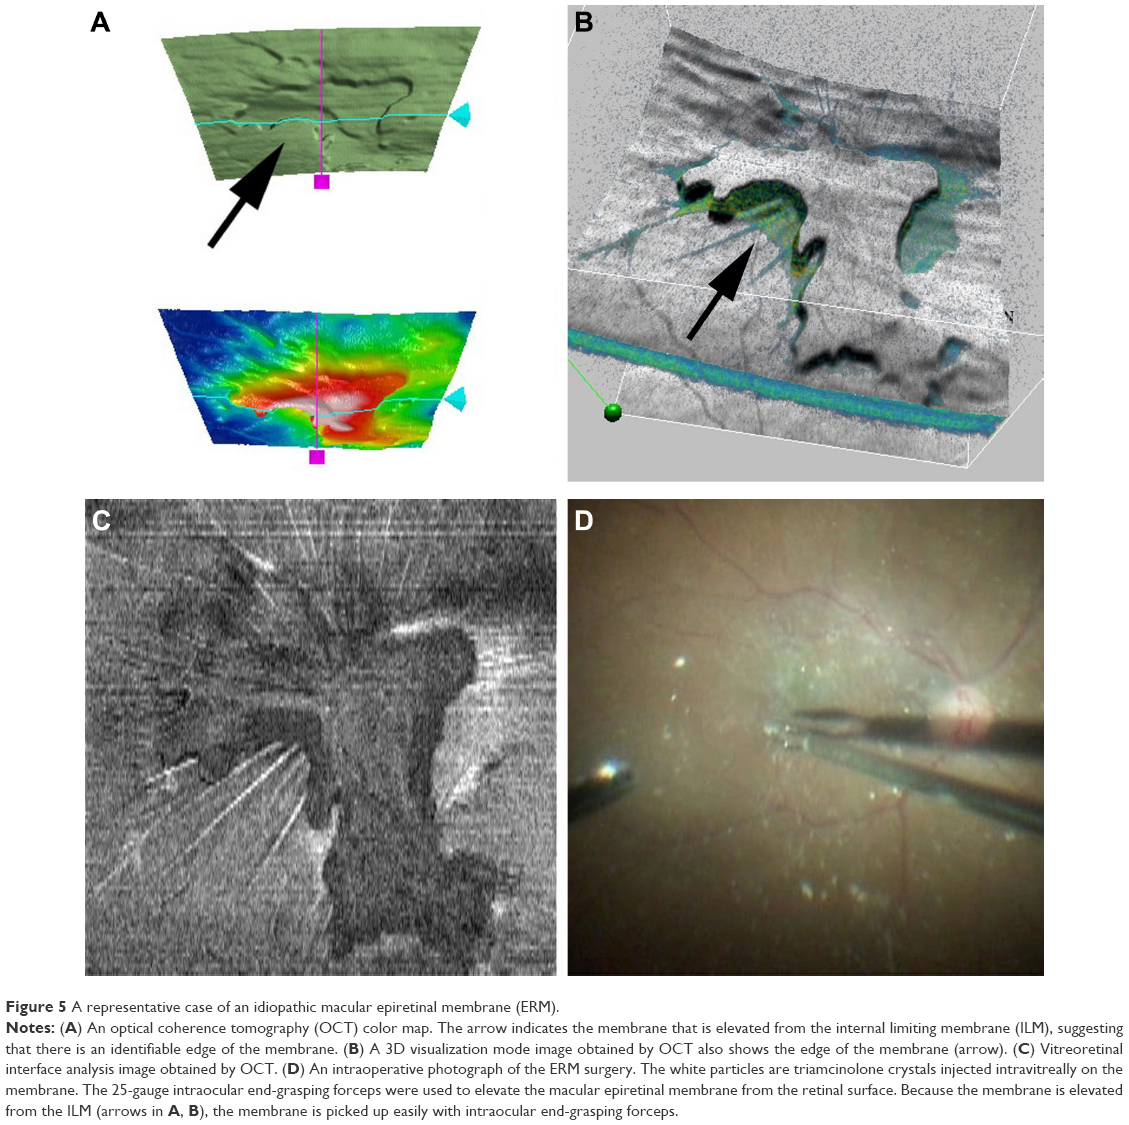 | Figure 5 A representative case of an idiopathic macular epiretinal membrane (ERM). |
The recently developed intraoperative OCT technology is useful for surgical decision making, ie, surgeons can identify residual membrane tissue after ERM peeling procedures.6 However, to plan surgical strategies preoperatively, preoperative OCT findings are necessary. If both preoperative and intraoperative OCT images are available, the surgery can be executed more smoothly and completely.
Many studies have described the clinical application of OCT and how it has revolutionized vitreoretinal practice.5 Preoperative use of this technology enables the planning of surgical strategies and smooth execution of the surgeries. Careful slit-lamp examinations can detect the membrane edges but not always the partial detachments. OCT provides more detailed information about the ERM structure, such as the thickness, extent, edge, and partial detachments, than slit-lamp observation.
In previous reports, use of indocyanine green,2 trypan blue,3 and intravitreal triamcinolone crystals4 has been described to aid intraoperative identification of ILMs, whereas preoperative OCT findings in the current study might enable ERM peeling surgery without these dyes, reducing the risk that is posed by the potential toxicity of these dyes.
Previously, Hirano et al1 reported the usefulness of OCT-guided ERM peeling. In the current study, we studied a large number of patients and included VRI analysis.
Limitations
The current study had several limitations. First, the study design was retrospective. Second, not all eyes underwent ERM peeling surgery. It is preferable to evaluate how the preoperative OCT findings actually match the real membrane.
Conclusion
In conclusion, our current results provided important information for surgeries in which ERMs will be peeled. A future prospective, randomized, controlled study is needed to confirm the current results.
Acknowledgments
This study was supported by a Grant-in-Aid for Scientific Research (C) 15K10875 (YH), 25462758 (TY), and Scientific Research (B) 15H04997 (YO) from the Japan Society for the Promotion of Science, Tokyo, Japan. Carl Zeiss Meditec (Jena, Germany) sent an OCT system (Cirrus HD-OCT 5000, Carl Zeiss Meditec, Jena, Germany) to Nagaya City University to support data collection. The authors thank Fumie Shibuya, Yasuyo Matsuda, Sayaka Oshio, Ayano Maruyama, and Soushi Shimizu (Nagoya City University Graduate School of Medical Sciences) for contributing to data collection.
Disclosure
YH was supported by the Mochida Memorial Foundation, Tokyo, Japan; Takeda Science Foundation Osaka, Japan; and Suzuken Memorial Foundation, Nagoya, Japan. The authors report no other conflicts of interest in this work.
References
Hirano Y, Yasukawa T, Ogura Y. Optical coherence tomography guided peeling of macular epiretinal membrane. Clin Ophthalmol. 2011;5:27–29. | ||
Kwok AK, Yeung YS, Lee VY, Wong TH. ICG-assisted peeling of the retinal ILM. Ophthalmology. 2002;109(6):1040. | ||
Feron EJ, Veckeneer M, Parys-Van Ginderdeuren R, Van Lommel A, Melles GR, Stalmans P. Trypan blue staining of epiretinal membranes in proliferative vitreoretinopathy. Arch Ophthalmol. 2002;120(2):141–144. | ||
Fraser EA, Cheema RA, Roberts MA. Triamcinolone acetonide-assisted peeling of retinal internal limiting membrane for macular surgery. Retina. 2003;23(6):883–884. | ||
Huang D, Swanson EA, Lin CP, et al. Optical coherence tomography. Science. 1991;254(5035):1178–1181. | ||
Ehlers JP, Goshe J, Dupps WJ, et al. Determination of feasibility and utility of microscope-integrated optical coherence tomography during ophthalmic surgery: the DISCOVER Study RESCAN Results. JAMA Ophthalmol. 2015;133(10):1124–1132. |
 © 2016 The Author(s). This work is published and licensed by Dove Medical Press Limited. The full terms of this license are available at https://www.dovepress.com/terms.php and incorporate the Creative Commons Attribution - Non Commercial (unported, v3.0) License.
By accessing the work you hereby accept the Terms. Non-commercial uses of the work are permitted without any further permission from Dove Medical Press Limited, provided the work is properly attributed. For permission for commercial use of this work, please see paragraphs 4.2 and 5 of our Terms.
© 2016 The Author(s). This work is published and licensed by Dove Medical Press Limited. The full terms of this license are available at https://www.dovepress.com/terms.php and incorporate the Creative Commons Attribution - Non Commercial (unported, v3.0) License.
By accessing the work you hereby accept the Terms. Non-commercial uses of the work are permitted without any further permission from Dove Medical Press Limited, provided the work is properly attributed. For permission for commercial use of this work, please see paragraphs 4.2 and 5 of our Terms.