")
Back to Journals » OncoTargets and Therapy » Volume 11
Preoperative apolipoprotein B/apolipoprotein A1 ratio: a novel prognostic factor for gastric cancer
Authors Ma MZ , Yuan SQ , Chen Y, Zhou ZW
Received 10 November 2017
Accepted for publication 10 January 2018
Published 13 April 2018 Volume 2018:11 Pages 2169—2176
DOI https://doi.org/10.2147/OTT.S156690
Checked for plagiarism Yes
Review by Single anonymous peer review
Peer reviewer comments 2
Editor who approved publication: Dr Tohru Yamada
Ming-zhe Ma,1–3,* Shu-qiang Yuan,1–3,* Yong-ming Chen,1–3 Zhi-wei Zhou1–3
1State Key Laboratory of Oncology in South China, Sun Yat-sen University Cancer Center, Guangzhou, China; 2Collaborative Innovation Center for Cancer Medicine, Sun Yat-sen University Cancer Center, Guangzhou, China; 3Department of Gastric Surgery, Sun Yat-sen University Cancer Center, Guangzhou, China
*These authors contributed equally to this work
Background: The correlations between lipid profile (lipid molecules and their derivative indexes) and clinical outcome have been widely testified in many carcinomas, but its prognostic value remains unknown in gastric cancer (GC). Our purpose in the study was to comprehensively evaluate the clinical significance of lipid profile in GC.
Methods: We retrospectively collected clinical information of 1,201 GC patients who received surgery at Sun Yat-sen University Cancer Center from 2005 to 2010. Kaplan–Meier analysis and Cox proportional hazards regression model were performed to determine its prognostic significance.
Results: Lipid profile including cholesterol, triglyceride, high-density lipoprotein-cholesterol (HDL-C), low-density lipoprotein-cholesterol (LDL-C), apolipoprotein A1 (ApoA1), apolipoprotein B (ApoB), LDL-C/HDL-C ratio, and ApoB/ApoA1 ratio were analyzed. For the first time, we found ApoB/ApoA1 ratio showed the biggest prognostic potency among all lipid-related variables and could act as an independent prognostic factor in GC. Patients with a high ApoB/ApoA1 ratio (≥1) had a shorter overall survival (hazard ratio: 1.373, 95% confidence interval: 1.123–1.68; P=0.002).
Conclusion: Preoperative serum ApoB/ApoA1 ratio might be used as a novel prognostic indicator of GC.
Keywords: ApoB/ApoA1 ratio, gastric cancer, prognosis, marker, overall survival
Introduction
Gastric cancer (GC) is one of the most commonly diagnosed malignancies and ranks as the third and second leading cause of cancer-related mortality both in the world and in China, respectively.1,2 Recently, although we have made great progress in clinical treatments, like laparoscopic radical gastrectomy and neoadjuvant chemotherapy/radiotherapy, the clinical outcome of GC still remains unsatisfactory with an estimated 5-year survival rate of 53%.3,4 To date, numerous prognostic factors based on serum/tissue biochemical markers were validated to guide clinical treatment and to predict prognosis in GC, for instance, HER2 status for instructing Herceptin therapy and microRNA signature for forecasting patient survival.5,6
A lipid profile including lipid molecules (cholesterol [CHO], triglycerides [TG], high-density lipoprotein-cholesterol [HDL-C], low-density lipoprotein-cholesterol [LDL-C], apolipoprotein A1 [ApoA1], apolipoprotein B [ApoB]) and their derivative indexes (LDL-C/HDL-C ratio and ApoB/ApoA1 ratio) has been considered to be related with several carcinomas. Hong et al7 reported that preoperative serum lipid profile was related to outcome of nonmetastatic colorectal cancer. A study conducted by Zhao et al8 Found that HDL-C level was lower in prostate cancer patients compared with the normal population. However, the relationship between lipid profile and clinical outcome in GC still remains unknown and needs to be elucidated.
In this study, we aimed to comprehensively investigate the prognostic value of lipid molecules and their derivative indexes in GC.
Methods
Patient selection
In this study, we reviewed a total of 1,201 stage I–IV GC patients who received surgery at Sun Yat-sen University Cancer Center from May 13, 2005 to September 15, 2010. This research was authorized by the Ethics Committee of the Sun Yat-sen University Cancer Center, and every patient signed the informed consent. The inclusion criteria of patients included the following: 1) pathologically diagnosed GC based on the 8th Tumor–Node–Metastasis (TNM) staging system; 2) no neoadjuvant chemotherapy or radiotherapy before operation; 3) detailed and complete follow-up data. The clinicopathological factors in our study were age, sex, tumor size, tumor location, blood type, TNM stage, differentiation, preoperative lipid molecules (CHO, TG, HDL-C, LDL-C, ApoA1, and ApoB), and survival status.
Patient follow-up
Postoperative follow-up was implemented every 3 months for the 1st and 2nd years, every half a year for the 3th–5th years, and annually until death or final follow-up. Overall survival (OS) was defined as the interval from surgery to the date of death or end of follow-up. Altogether, 1,201 GC patients received regular follow-up, and the last scheduled follow-up date was March 28, 2017.
Lipid profile
Lipid profile included lipid molecules (mentioned earlier) and their derivative indexes, including LDL-C/HDL-C ratio and ApoB/ApoA1 ratio. Briefly, LDL-C/HDL-C ratio was defined as dividing preoperative serum LDL-C concentration by serum HDL-C concentration, and ApoB/ApoA1 ratio was acquired by dividing ApoB level with ApoA1 level. We next used x-tile,9 a statistical software based on Kaplan–Meier analysis, to determine the cut-off value of each lipid profile factor. The cut-off values were 1.9 mM, 4.1 mM, 1.2 mM, 3.1 mM, 1.4 mM, 1 mM, 2.9, and 1 for TG, CHO, HDL-C, LDL-C, ApoA1, ApoB, LDL-C/HDL-C ratio, and ApoB/ApoA1 ratio, respectively.
Statistical analysis
Survival curves was plotted by Kaplan–Meier method, and the differences were calculated by log-rank test. Univariate and multivariate Cox regression model was used to evaluate clinical significance of clinicopathological parameters and lipid profile. One-sample K–S test was conducted to determine normality of ApoB, ApoA1, LDL-C, HDL-C, ApoB/ApoA1 ratio, and LDL-C/HDL-C ratio. Spearman’s rank correlation analysis was to evaluate the following correlations: ApoB versus LDL-C, ApoA1 versus HDL-C, and LDL-C/HDL-C ratio versus ApoB/ApoA1 ratio. P-value (two-sided) <0.05 was considered as statistically significant. Statistical analyses were conducted using SPSS software (version 22; SPSS Inc. Chicago, IL, USA). The Akaike information criterion (AIC) provides an objective method of determining the performance of indicated prognostic model. The AIC is calculated as follows: AIC=–2l + n (l refers to log-likelihood and n is the number of parameters in the model). The model with the lowest AIC indicates the best prognostic potency.
Results
Patient characteristics
Characteristics of the 1,201 GC patients are presented in Table 1. The median age of the patients was 58 years (range: 19 to 86). In total, 831 (69.2%) of the patients were male and 370 (30.8%) were female. Five hundred and seventy (47.4%) of the tumors were found in lower third of the stomach, 583 patients (48.5%) were diagnosed with upper third tumors, and the rest, 49 (3.9%), of the tumors were located in full third of stomach. Tumor size was distributed as <5 cm (659, 54.9%) and ≥5 cm (542, 45.1%). According the 4th edition of World Health Organization classification for digestive tumors,10 204 (17%) of the tumors were classified as well/moderate and 997 (83%) were poor/others. Clinical staging was done using the 8th Union for International Cancer Control/American Joint Committee on Cancer (UICC/AJCC) TNM staging system,11 and the number of patients in stage I, II, III, and IV were 184 (15.3%), 252 (21%), 659 (54.9%), and 106 (8.8%), respectively. Furthermore, the ABO blood type distribution was as follows: A (335, 27.9%), B (284, 23.6%), O (497, 41.4%), and AB (85, 7.1%). As regards lipid profile, the distributions were as follows: TG <1.9 mM (1056, 87.9%) versus TG ≥1.9 mM (145, 12.1%); CHO <4.1 mM (229, 19.1%) versus CHO ≥4.1 mM (972, 80.9%); HDL-C <1.2 mM (735, 61.2%) versus HDL-C ≥1.2 mM (466, 38.8%); LDL-C <3.1 mM (579, 48.2%) versus LDL-C ≥3.1 mM (622, 51.8%); ApoA1 <1.4 mM (955, 79.5%) versus ApoA1 ≥1.4 mM (246, 20.5%); ApoB <1 mM (721, 60%) versus ApoB ≥1 mM (480, 40%); LDL-C/HDL-C ratio <2.9 (670, 55.8%) versus LDL-C/HDL-C ratio ≥2.9 (531, 44.2%); and ApoB/ApoA1 ratio <1 (947, 78.9%) versus ApoB/ApoA1 ratio ≥1 (254, 21.1%).
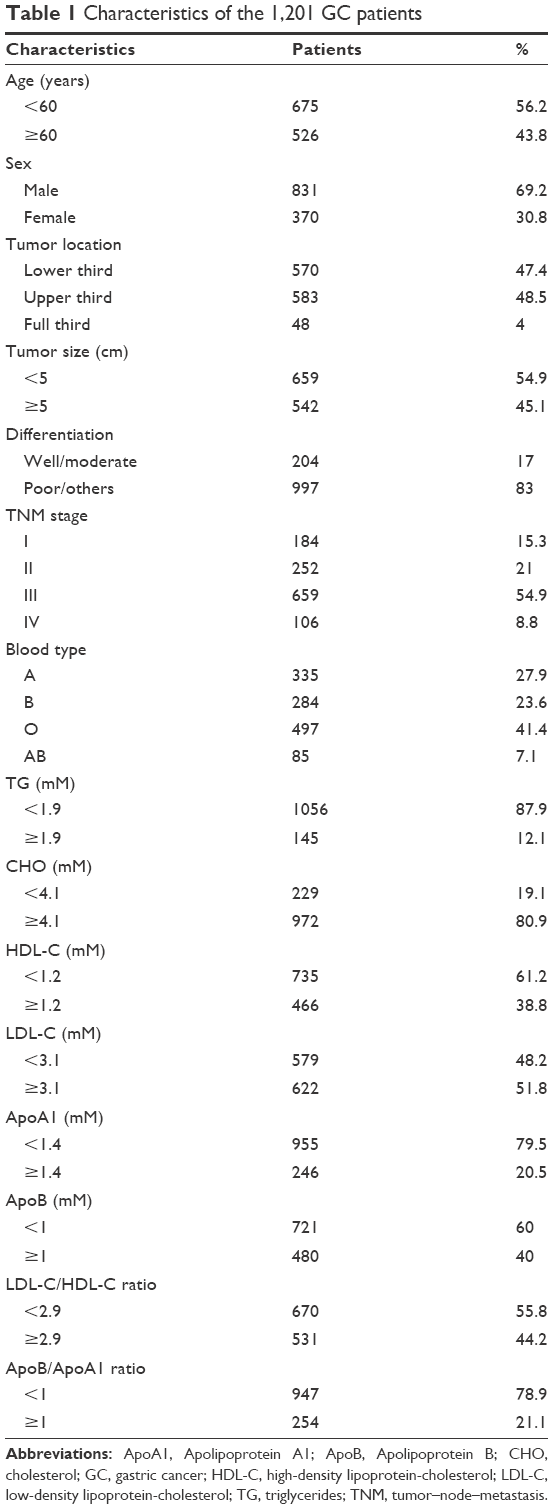 | Table 1 Characteristics of the 1,201 GC patients |
Correlations between ApoB, ApoA1, and ApoB/ApoA1 ratio and LDL-C, HDL-C, and LDL-C/HDL-C ratio
Among all lipid profile molecules, ApoB and ApoA1 account for the major components of LDL-C and HDL-C, respectively.12,13 Likewise, a Swedish research published in Lancet showed that ApoB/ApoA1 ratio was superior to LDL-C/HDL-C ratio in predicting the risk of coronary disease.14 Thus, we first analyzed the correlations between the above factors. One-sample K–S test showed that the above factors (ApoA1, ApoB, LDL-C, HDL-C, LDL-C/HDL-C ratio, and ApoB/ApoA1) lacked normality (Figure 1A–C). Therefore, Spearman’s rank correlation instead of Pearson’s linear correlation was used for further analysis. As shown in Figure 1A–C, a significant correlation was found in ApoB concentration versus LDL-C concentration (r=0.829; 95% confidence interval [CI]: 0.805–0.852; P<0.001), ApoA1 concentration versus HDL-C concentration (r=0.710; 95% CI: 0.677–0.741; P<0.001), and ApoB/ApoA1 ratio versus LDL-C/HDL-C ratio (r=0.788; 95% CI: 0.762–0.813; P<0.001), indicating the good representative capacity of ApoA1, ApoB, and ApoB/ApoA1 ratio.
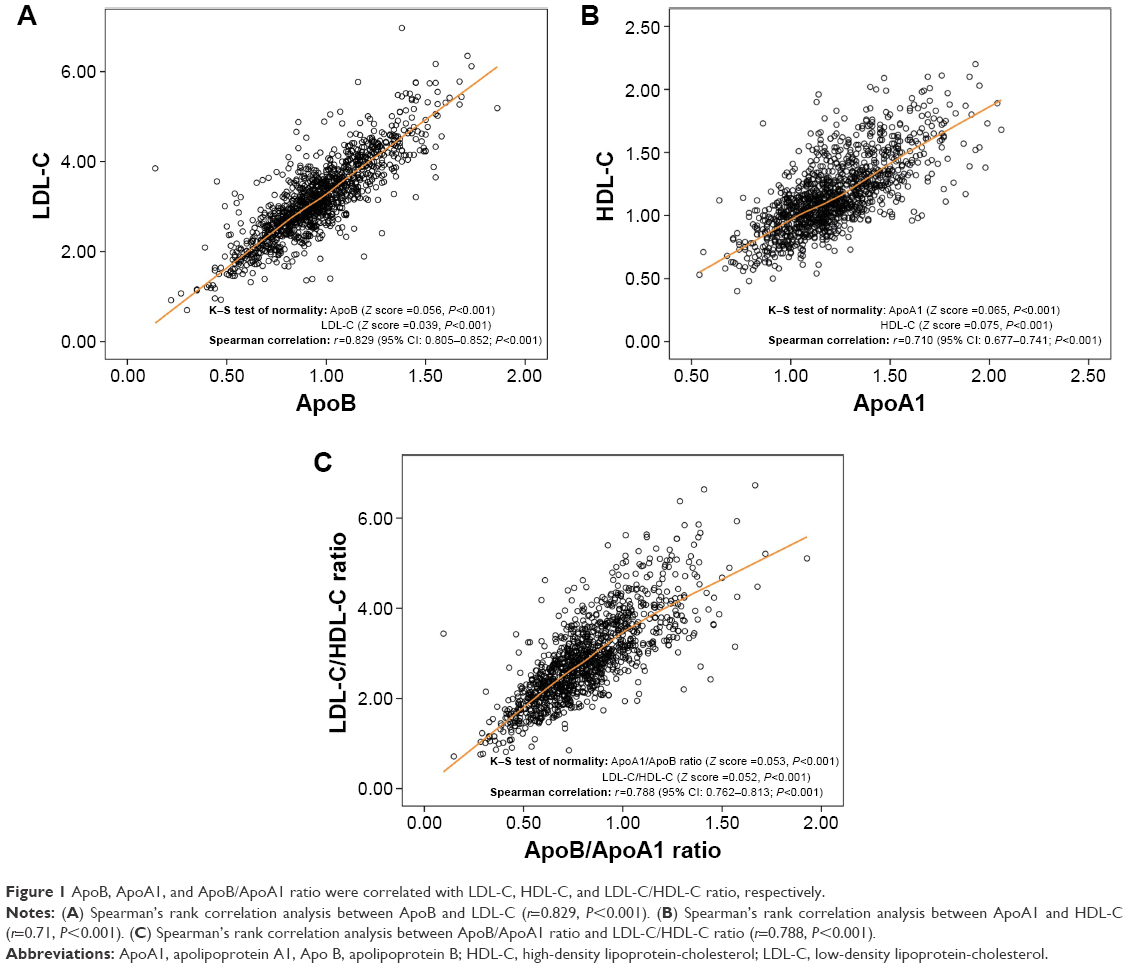 | Figure 1 ApoB, ApoA1, and ApoB/ApoA1 ratio were correlated with LDL-C, HDL-C, and LDL-C/HDL-C ratio, respectively. |
Univariate and multivariate Cox regression analysis of prognostic factors
Univariate Cox proportional hazard model was used to find out the prognostic factors in all candidate variables including clincopathological parameters (including age, sex, tumor size, tumor location, blood type, TNM stage, and differentiation) and the aforementioned lipid profile. As can be seen in Table 2 (left panel), age, tumor location, differentiation, TNM stage, TG, ApoA1, ApoB, LDL-C/HDL-C ratio, and ApoB/ApoA1 ratio were significantly related with clinical outcome of GC patients.
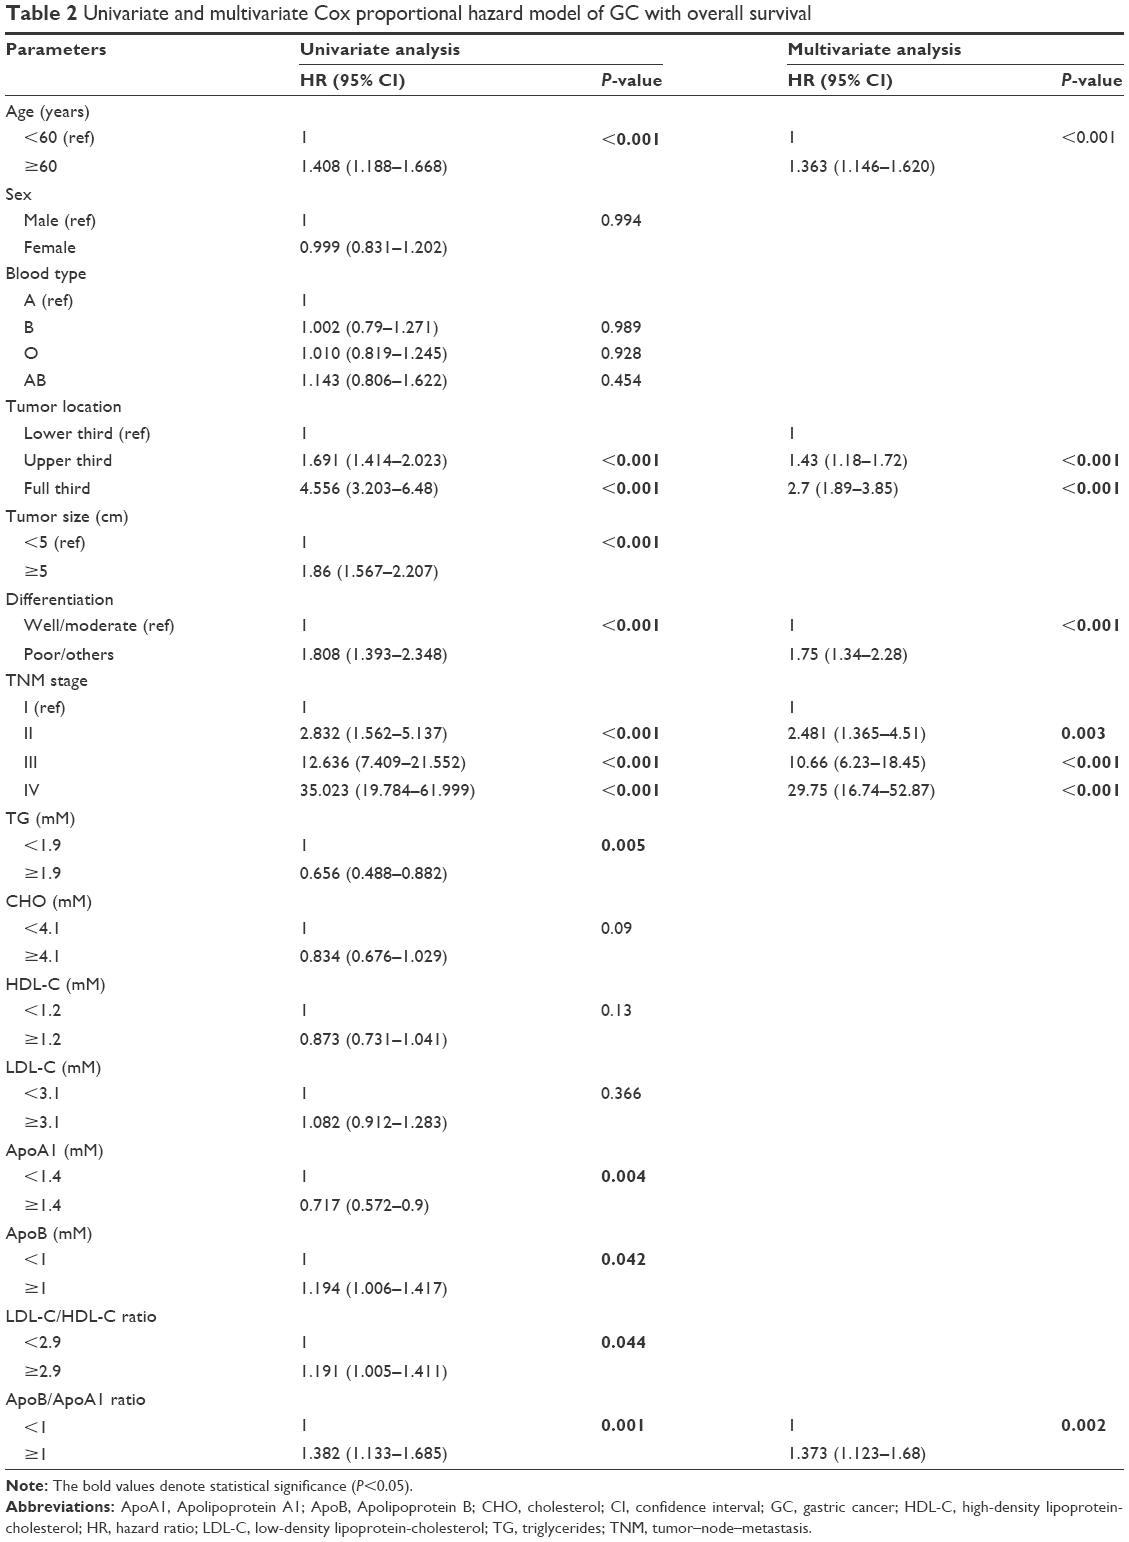 | Table 2 Univariate and multivariate Cox proportional hazard model of GC with overall survival |
In order to determine the independent prognostic factors, the significant variables from univariate analysis were further subjected to multivariate regression analyses. As shown in Table 2 (right panel), age ≥60 years (hazard ratio [HR]: 1.363, 95% CI: 1.146–1.620, P<0.001), upper and full third location of tumor (HR: 1.43, 95% CI: 1.18–1.72, P<0.001; HR: 2.7, 95% CI: 1.89–3.85, P<0.001, respectively), poor/other differentiations of tumor (HR: 1.75, 95% CI: 1.34–2.28, P<0.001), TNM stage II, III, or IV (HR: 2.481, 95% CI: 1.365–4.51, P=0.003; HR: 10.66, 95% CI: 6.23–18.45, P<0.001; HR: 29.75, 95% CI: 16.74–52.87, P<0.001, respectively), and high ApoB/ApoA1 ratio (HR: 1.373, 95% CI: 1.123–1.68, P=0.002) were correlated with poorer OS of GC patients.
Furthermore, prognostic performance test also confirmed the conclusion that ApoB/ApoA1 ratio was an independent prognostic factor for GC among the lipid profile tests. As displayed in Table 3, the AIC value of the basal model, which incorporated significant clinicopathological parameters according to univariate analysis (age, tumor location, differentiation, and TNM stage), was 6,671.6. Among all lipid profile factors, when adding ApoB/ApoA1 ratio into the model, the AIC value presented the maximum reduction (from 6,671.6 to 6,664.8), indicating a better prediction accuracy of the model.
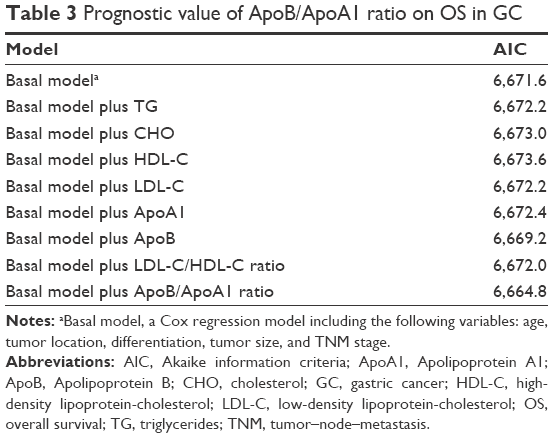 | Table 3 Prognostic value of ApoB/ApoA1 ratio on OS in GC |
Association between ApoB/ApoA1 ratio and prognosis of GC patients
In order to further investigate the prognostic role of ApoB/ApoA1 ratio in GC, we used Kaplan–Meier analysis to draw survival curves and used the log-rank test to compare different groups. As shown in Figure 2A, GC patients with high ApoB/ApoA1 ratio (mean OS: 291 weeks) had a significantly poorer survival than those with low ApoB/ApoA1 ratio (mean OS: 361 weeks), and 5-year survival rate was 43.1% versus 55.8% (high ApoB/ApoA1 ratio versus low). However, when stratified by TNM stage and differentiation, this prognostic significance varied greatly among subgroups. The results showed that the prognostic value of ApoB/ApoA1 ratio was also apparent in stage III–IV patients (P<0.001, Figure 2C) and those with poor/other differentiations of tumor (P<0.001; Figure 2E). However, OS was not significant in those with stage I–II (P=0.782; Figure 2B) and well/moderate differentiation (P=0.812; Figure 2D).
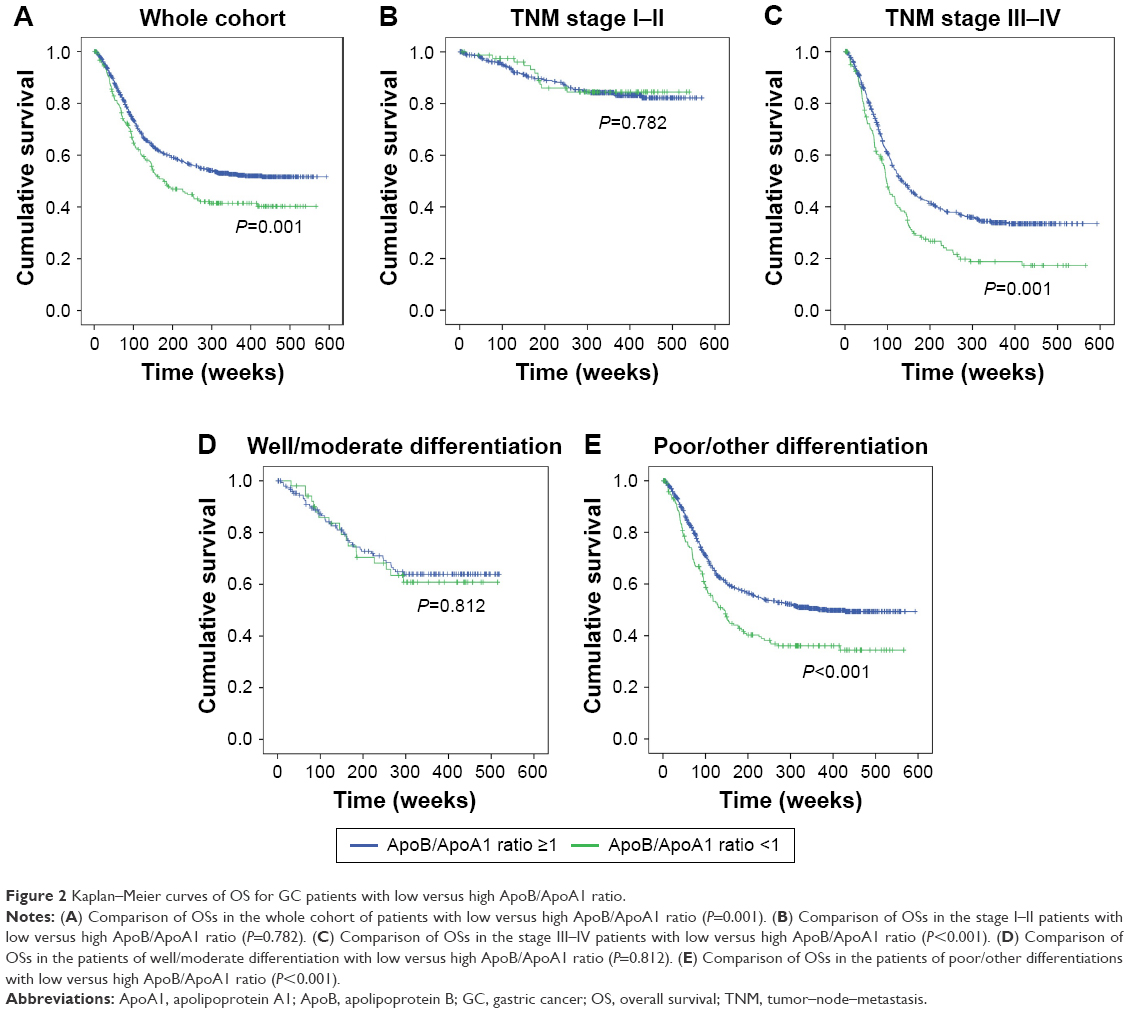 | Figure 2 Kaplan–Meier curves of OS for GC patients with low versus high ApoB/ApoA1 ratio. |
Correlation between ApoB/ApoA1 ratio and clinicopathological characteristics
The association between ApoB/ApoA1 ratio and clinicopathological characteristics is summarized in Table 4. As is shown, ApoB/ApoA1 ratio was significantly correlated with sex (P=0.005), differentiation (P=0.044), and blood type (P=0.041). However, there was no statistically significant correlation between ApoB/ApoA1 ratio and age, tumor location, and TNM stage.
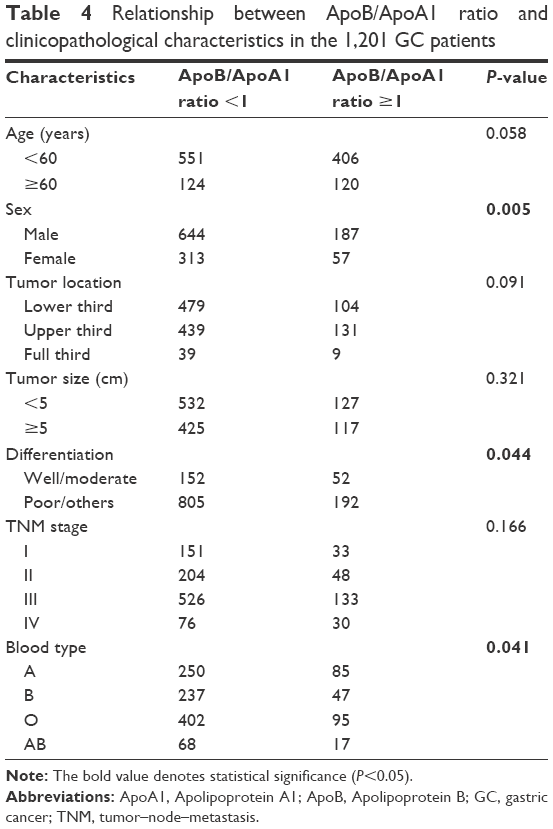 | Table 4 Relationship between ApoB/ApoA1 ratio and clinicopathological characteristics in the 1,201 GC patients |
Discussion
In this study, we created a new prognostic index for GC, ApoB/ApoA1 ratio, by dividing preoperative ApoB concentration with ApoA1 concentration.
Recently, abnormal lipid metabolism has been validated to be a vital metabolic reprogramming process in cancer cell.15 An American research group found that increased unsaturated lipid is a metabolic biomarker in ovarian cancer stem cells and could serve as a cancer stem cell-specific target.16 Pascual et al17 reported that blocking fatty acid receptor CD36 could inhibit metastasis of human oral cancer in a mouse model. These findings suggest that lipid metabolism is related to cancer formation and development and might be developed as an anticancer target. As a result, their end products, the lipid molecules, also present abnormal expression in cancer patients. Besides, numerous studies have validated the prognostic role of lipid molecules and their derivative indexes in many carcinomas.7,8
As for GC, an article written by Liu et al18 showed that canonical lipid markers (HDL-C, LDL-C, CHO, and TG) do not present prognostic significance in GC, and this result is consistent with our findings (Table 2). Generally, ApoA1 and ApoB were also included as part of the routine lipid test panel before treatment in our hospital. Also, LDL-C/HDL-C ratio and ApoB/ApoA1 ratio show significant diagnostic ability in many diseases.19–21 Thus, in our research, we incorporated ApoA1, ApoB, ApoB/ApoA1 ratio, and LDL-C/HDL-C ratio for analysis, as well as the aforesaid traditional markers. Eventually, we found that ApoB/ApoA1 could act as an independent prognostic marker in GC among all lipid molecules and their derivate indexes.
Our research has some inadequacies. First, our data were retrospectively collected from a single cancer center. Second, due to information bias, we could not acquire the exact time of tumor recurrence/progression, and hence chose OS as the primary outcome. Third, the underlying mechanism of lipid metabolism in the carcinogenesis and cancer development of GC needs further investigation.
Conclusion
We found for the first time that ApoB/ApoA1 ratio could serve as a prognostic factor in GC. To generalize the utilization of ApoB/ApoA1 ratio, validation by a prospective multicenter study is required.
Acknowledgment
This study was supported by a grant from the National Natural Science Foundation of China (grant number 81302144).
Disclosure
The authors report no conflicts of interest in this work.
References
Chen W, Zheng R, Baade PD, et al. Cancer statistics in China, 2015. CA Cancer J Clin. 2016;66(2):115–132. | ||
Torre LA, Bray F, Siegel RL, Ferlay J, Lortet-Tieulent J, Jemal A. Global cancer statistics, 2012. CA Cancer J Clin. 2015;65(2):87–108. | ||
Oba K, Paoletti X, Alberts S, et al. Disease-free survival as a surrogate for overall survival in adjuvant trials of gastric cancer: a meta-analysis. J Natl Cancer Inst. 2013;105(21):1600–1607. | ||
Wang W, Zheng C, Fang C, et al. Time trends of clinicopathologic features and surgical treatment for gastric cancer: results from 2 high-volume institutions in southern China. Surgery. 2015;158(6):1590–1597. | ||
Bang YJ, Van Cutsem E, Feyereislova A, et al. Trastuzumab in combination with chemotherapy versus chemotherapy alone for treatment of HER2-positive advanced gastric or gastro-oesophageal junction cancer (ToGA): a phase 3, open-label, randomised controlled trial. Lancet. 2010;376(9742):687–697. | ||
Li X, Zhang Y, Zhang Y, Ding J, Wu K, Fan D. Survival prediction of gastric cancer by a seven-microRNA signature. Gut. 2010;59(5):579–585. | ||
Hong TT, Shen D, Chen XP, Wu XH, Hua D. Preoperative serum lipid profile and outcome in nonmetastatic colorectal cancer. Chronic Dis Transl Med. 2016;2(4):241–249. | ||
Zhao R, Cheng G, Wang B, et al. BMI and serum lipid parameters predict increasing risk and aggressive prostate cancer in Chinese people. Oncotarget. 2017;8(39):66051–66060. | ||
Camp RL, Dolled-Filhart M, Rimm DL. X-tile: a new bio-informatics tool for biomarker assessment and outcome-based cut-point optimization. Clin Cancer Res. 2004;10(21):7252–7259. | ||
Flejou JF. WHO classification of digestive tumors: the fourth edition. Ann Pathol. 2011;31(5 Suppl):S27–S31. | ||
Amin MB, Greene FL, Edge SB, et al. The Eighth Edition AJCC Cancer Staging Manual: continuing to build a bridge from a population-based to a more “personalized” approach to cancer staging. CA Cancer J Clin. 2017;67(2):93–99. | ||
Rye KA, Bursill CA, Lambert G, Tabet F, Barter PJ. The metabolism and anti-atherogenic properties of HDL. J Lipid Res. 2009;50:S195–S200. | ||
Elovson J, Chatterton JE, Bell GT, et al. Plasma very low density lipoproteins contain a single molecule of apolipoprotein B. J Lipid Res. 1988;29(11):1461–1473. | ||
Walldius G, Jungner I, Holme I, Aastveit AH, Kolar W, Steiner E. High apolipoprotein B, low apolipoprotein A-I, and improvement in the prediction of fatal myocardial infarction (AMORIS study): a prospective study. Lancet. 2001;358(9298):2026–2033. | ||
Liu QP, Luo Q, Halim A, Song GB. Targeting lipid metabolism of cancer cells: a promising therapeutic strategy for cancer. Cancer Lett. 2017;401:39–45. | ||
Li JJ, Condello S, Thomes-Pepin J, et al. Lipid desaturation is a metabolic marker and therapeutic target of ovarian cancer stem cells. Cell Stem Cell. 2017;20(3):303.e5–314.e5. | ||
Pascual G, Avgustinova A, Mejetta S, et al. Targeting metastasis-initiating cells through the fatty acid receptor CD36. Nature. 2017;541(7635):41–45. | ||
Zhao RZ, Cheng G, Wang B, et al. BMI and serum lipid parameters predict increasing risk and aggressive prostate cancer in Chinese people. Oncotarget. 2017;8(39):66051–66060. | ||
Liu BZ, Tao L, Chen YZ, et al. Preoperative body mass index, blood albumin and triglycerides predict survival for patients with gastric cancer. PLoS One. 2016;11(6):e0157401. | ||
You S, Zhong C, Xu J, et al. LDL-C/HDL-C ratio and risk of all-cause mortality in patients with intracerebral hemorrhage. Neurol Res. 2016;38(10):903–908. | ||
Mao Y, Xu Y, Lu LH. The nonlinear association between apolipoprotein B to apolipoprotein A1 ratio and type 2 diabetes. Medicine. 2017;96(1):e5834. |
 © 2018 The Author(s). This work is published and licensed by Dove Medical Press Limited. The full terms of this license are available at https://www.dovepress.com/terms.php and incorporate the Creative Commons Attribution - Non Commercial (unported, v3.0) License.
By accessing the work you hereby accept the Terms. Non-commercial uses of the work are permitted without any further permission from Dove Medical Press Limited, provided the work is properly attributed. For permission for commercial use of this work, please see paragraphs 4.2 and 5 of our Terms.
© 2018 The Author(s). This work is published and licensed by Dove Medical Press Limited. The full terms of this license are available at https://www.dovepress.com/terms.php and incorporate the Creative Commons Attribution - Non Commercial (unported, v3.0) License.
By accessing the work you hereby accept the Terms. Non-commercial uses of the work are permitted without any further permission from Dove Medical Press Limited, provided the work is properly attributed. For permission for commercial use of this work, please see paragraphs 4.2 and 5 of our Terms.