")
Back to Journals » OncoTargets and Therapy » Volume 13
Preliminary Study on the Identification of BRAFV600E Mutation in Colorectal Cancer by Near-Infrared Spectroscopy
Authors Duan J, Yang Y, Yin L, Zhang X, Tang Y, Zhang S , Gong H, Xiao M, Li M, Li Q, Li X, Yang L, Fan Q, Wang Y
Received 20 October 2020
Accepted for publication 11 December 2020
Published 22 December 2020 Volume 2020:13 Pages 13077—13085
DOI https://doi.org/10.2147/OTT.S287814
Checked for plagiarism Yes
Review by Single anonymous peer review
Peer reviewer comments 2
Editor who approved publication: Prof. Dr. Nicola Silvestris
Jiale Duan,1,* Yanping Yang,1,* Lei Yin,1 Xue Zhang,2 Yi Tang,1 Shuxian Zhang,1 Hanjuan Gong,1 Ming Xiao,1 Ming Li,1 Qingshu Li,1 Xian Li,1 Lian Yang,1 Qi Fan,2 Yalan Wang1
1Department of Pathology, Molecular Medicine and Cancer Research Center, Chongqing Medical University, Chongqing 400016, People’s Republic of China; 2School of Pharmacy, Chongqing Medical University, Chongqing 400016, People’s Republic of China
*These authors contributed equally to this work
Correspondence: Yalan Wang
Department of Pathology, Molecular Medicine and Cancer Research Center, Chongqing Medical University, Chongqing 400016, People’s Republic of China
Email [email protected]
Introduction: In metastatic colorectal cancer (mCRC), the B-type Raf kinase (BRAF)V600E mutation is a molecular biomarker of poor prognosis and is of great importance to drug target. Currently, the commonly used methods for detecting BRAFV600E mutation include immunohistochemistry (IHC) and gene sequencing, but both present certain limitations. Near-infrared (NIR) spectroscopy is a spectroscopy technology that takes advantage of the electromagnetic wavelength between visible light and mid-infrared light.
Methods: IHC was used to detect the expression of BRAFV600E protein with the BRAFV600E (VE1) antibody in 42 cases of paraffin-embedded (FFPE) mCRC tissue sections. The NIR-discriminant analysis model (NIRS-DA) was established using 6 cases of wild-type and 6 cases of mutant-type BRAF specimens.
Results: IHC detection results revealed 13 cases of weakly positive (+), 1 case of moderately positive (++), and 28 cases of negative (−) CRC. Compared with the next-generation sequencing (NGS) results, the positive rate was 66.7%. The classification accuracy of calibration (CAC) was 100% compared with the results of NGS, demonstrating that the BRAFV600E mutant NIRS-DA model, verified by 2 cases of wild-type and 2 cases of mutant-type CRC samples was established. The NIRS-DA model was used to predict gene mutation in the CRC samples, 7 cases were positive (+), and 35 cases were negative (−), and the classification accuracy of prediction (CAP) was 83.3% (35/42).
Discussion: The NIRS-DA model-predicted results were in high agreement with the detection results of NGS, and the difference in IHC is not statistically significant (P> 0.05). However, this study is a preliminary discussion on a methodology due to its small sample size.
Keywords: colorectal cancer, BRAFV600E mutant, near-infrared spectroscopy, next-generation sequencing, immunohistochemistry
Introduction
The RAF family of kinases is composed of the serine/threonine protein kinase BRAF, ARAF and CRAF [RAF1]. BRAF is usually activated by members of the RAS family (HRAS, NRAS, and KRAS), especially valid on signals from receptor tyrosine kinases (RTKs).1 The epidermal growth factor receptor (EGFR) is upstream of BRAF.2 The missense mutation of T to A in codon 600 is the most common point mutation of the BRAF gene, which replaces valine (V) with glutamic acid (E)3,4 and is defined as BRAFV600E. The mutation leads to RAS-independent activity of the kinase domain5 and the mitogen activated protein kinase (MAPK) activation signaling pathway, which activates downstream ERK (ERK1 and ERK2) and MEK (MEK1 and MEK2) kinases.3 BRAF mutations that activate the MAPK pathway often occur in tumors and accelerate tumor cell proliferation, survival, and migration.2
About 8–15% of patients with metastatic colorectal cancer (mCRC) harbor a mutant BRAFV600E, and this subset is related to significantly poorer survival.6,7 The mortality of patients with mCRC is twice as high as that of patients with a wild-type BRAF sequence.8 Mutant BRAFV600E CRC is also characterized by low differentiation, mucinous changes, and late TNM staging.9 In CRC, the BRAFV600E mutation is related to a gap island methylation phenotype (such as hypermethylation phenotype), which may lead that MLH1 is of significance inactivation and mismatch repair (MMR) defects, resulting in microsatellite instability (MSI).10–12 In BRAFV600E patients with metastatic CRC, about 20% showed MMR deficiency.13 Furthermore, hereditary non-polyposis CRC syndrome, also known as Lynch syndrome, was excluded in CRC patients with missing MLH1 and PMS2 protein expression but BRAFV600E mutation.14 BRAFV600E mutation has significant predictive value for treatment of CRC patients.15 BRAF inhibitors have made significant progress in drug resistance. Furthermore, Phase 1 and Phase 2 clinical trials have shown that the combined application of EGFR inhibitors, BRAF inhibitors, and mitogen-activated protein kinase (MAPK) kinase (MEK) inhibitors can enhance anti-tumor activity.2,16,17
Given the critical genetic, prognostic, and therapeutic significance of BRAFV600E, it is vital to ensure accurate identification of CRC patients with BRAFV600E mutations.10,18 Currently, in diagnostics and laboratory research, there are many methods used for genotypic assessment of BRAF mutation, ranging from traditional Sanger sequencing19 and next-generation sequencing (NGS)20 to mutation-specific real-time polymerase chain reaction (RT-PCR) assays,21,22 and also mass spectrometry-based methods.23 However, for all these methods it is necessary to extract DNA from tissues. DNA fragmentation during tissue processing will lead to low DNA quality and to failed genetic analysis. Likewise, poor analytical results will also be due to limited amounts of tumor tissue or artificially induced tumor tissues.24 Furthermore, these molecular methods require expertise in molecular technology and strict quality control. In recent years, the BRAFV600E mutation-specific monoclonal antibody (clone VE1) has been discovered to detect the mutational status of BRAF in a variety of tumors by IHC.25–27 Some studies have shown that comparing the performance of the IHC using anti-BRAFV600E (VE1) antibody with DNA sequencing in CRC patient samples was completely concordant,28 still other studies indicate results are not consistent.27 Moreover, reports showing that false positive and false negative results of IHC occur in CRC, and diagnosis is also limited by the expertise of the pathologist.29,30 Different results from different studies indicate that methodological differences, such as antigen exposure schemes, antibody culture conditions, automatic or manual staining, may affect the results, thus limiting the application of immunohistochemistry to assess the BRAF mutational status in the clinical.31 Thus, it is imperative to establish accurate, simple tissue preparation, as well as rapid and precise auxiliary diagnostic methods to correctly identify BRAFV600E mutations in CRC.
Near-infrared spectroscopy (NIRS) is an electromagnetic radiation wavelength between visible light and mid-infrared light, which can characterize the frequency multiplication and combination of the X-H group (X = C, N, O, S) using vibration frequency absorption.32,33 Spectral information is analyzed by chemometrics.34 NIRS is often used for the determination of organic compounds containing these molecular.35–37 NIRS is also widely used in bioassays or the determination of prostate-specific antigen33 or in immunoassays.38,39 Due to the advantages of NIRS, such as fast analysis speed, safety, non-destructive assessment of samples, and high accuracy, it can be used to identify benign tumors and cancers by examination of tissues, such as breast cancer,40 endometrial cancer,41 gastric cancer,42 and CRC,43 by combining NIRS with chemometrics.44 In a previous study, our research group also found that the characteristic spectra obtained from CRC samples (formalin-fixed, paraffin-embedded) using NIRS could quickly distinguish CRC tissue from normal intestinal mucosa tissue. The technology has received a patent for this application. After the establishment of the NIRS model for CRC tissue recognition, the samples can be quickly collected and identified in a few minutes, which has the significant advantages of easy to operate and non-destructive sample testing. Therefore, in this study, our aim was to explore the possibility of high accurate and rapid identification of BRAFV600E mutation in CRC by NIRS.
The specific objectives were: (1) to establish a discriminant model for identifying BRAFV600E mutation in CRC; (2) to compare the feasibility of identifying BRAFV600E mutation in CRC with NIRS and chemometric techniques. This study may extend the application of NIRS technology in the assisted diagnosis of human cancer gene mutations.
Materials and Methods
Colorectal Tissue Samples
In this study, 58 cases of CRC that had been previously analyzed by NGS to determine BRAF mutational status were selected. The site of removal of tumor tissues included the proximal colon, distal colon, and rectum. Of these, there were 8 cases of BRAFV600E mutation, and 50 cases of BRAF wild-type. There were 37 males and 21 females, with an average age of 57 years. Tumor tissues were fixed in formalin and embedded in paraffin for NIRS collection and IHC staining.
This study was approved by the ethical review of the Ethics Committee of Chongqing Medical University, and the specimens were from the Department of Pathology, the First Affiliated Hospital of Chongqing Medical University.
Immunohistochemistry Staining
The mouse anti-BRAFV600E monoclonal antibody (Clone VE1) was used in IHC analysis to detect BRAFV600E protein. In total, 52 cases were cut into 5 μm sections from the paraffin-embedded (FFPE) blocks. Tissues were placed on coated glass slides and dried for 30 minutes at 70°C. The CRC tissue sections were routinely deparaffinized, hydrated, and placed in EDTA buffer (Maixin Company, China) for antigen retrieval using a pressure cooker. The immunohistochemical method was used for staining according to the detailed steps provided by the manufacturer’s instructions for the UltrasensitiveTM Immunohistochemistry Kit (Maixin Company, China). Slides were cultured with endogenous peroxidase inhibitor, normal animal non-immune serum at room temperature for 10 min, and then exposed to the ready-to-use mouse anti-BRAFV600E monoclonal antibody (clone VE1, Roche) at 4°C overnight. Next the slides were exposed with biotin/Streptomyces avidin peroxidase-labeled secondary antibodies and incubated for 10 minutes at room temperature. The procedure included the nuclear staining with the DAB Detection Kit (Maixin Company, China) and hematoxylin staining. The sections were immersed in order in 75% ethanol, 85% ethanol, 95% ethanol, and 100% ethanol for 3 minutes each and then in xylene I, and xylene II for 5 minutes, and were finally dehydrated and rendered transparent. Individual sections were mounted with neutral gum.
The results of immunohistochemistry were reported according to the following scoring standard.45 In tumor cells, the staining intensity was recorded on a scale of 0 to 3, where strong cytoplasmic staining was 3, medium cytoplasmic staining was 2, weak cytoplasmic staining was 1, and no staining was scored 0. According to the percentage of positive cells: less than 5% positive cells were recorded as 0 points; 5–25% positive cells as 1 point, 26–50% positive cells as 2 points, 51–75% positive cells as 3 points, and the proportion of positive cells >75% was scored 4 points. These two scores (intensity and %positivity) were multiplied to obtain a final result of 0 to 12 points. Scores of 9 to 12 represented strongly positive (+++), scores of 5 to 8 represented moderately positive (++), scores of 1 to 4 represented weakly positive (+), and scores <1 were considered negative (-).
Instrument and Spectral Acquisition
A Nicolet iS50 FT-IR analyzer (Thermo Fisher) was used to measure the NIRS, which was fitted with an indium gallium arsenide detector and an integrating sphere. The configured software was OMNIC 9.2 software (Thermo Fisher Scientific, Waltham, MA, USA).
Place the sample on the detection window of the integrating sphere (slide upward) and cover the illuminated spot. The spectrum of the sample was measured within the NIRS range of 12,000–4000 cm−1 for the selected resolution and for the total number of scans. Select the resolution at 2, 4, 8 and 16 cm-1 in order to obtain sufficient infrared spectrum information from the sample in the shortest time. At each resolution condition, 16, 32, 64, and 128 scans were obtained to reduce noise with each scan. Each CRC tissue sample was randomly selected from 3 locations for measurement. Under the same conditions, the background spectrum was measured first, and then the sample spectrum was measured to eliminate the interference of the background signals with the sample spectrum.
Data Processing
The NIR transmittance and reflectance spectra of mutant-type and wild-type samples were measured under the following conditions: 12,000–4000 cm−1 interval, 8 cm−1 resolution, and 64 scans. The obtained spectral data were imported into TQ Analyst 8.0 software (USA Thermo Fisher Scientific), and the spectra were preprocessed with mean centralization (MC). To establish the model, the spectrum range selected was 9000 to 4000 cm−1. Principal component analysis (PCA) was based on the variance contribution rate from high to for reducing size of image data. The order and the cumulative variance contribution rate were greater than 85%. The first 5 principal components were selected as the model of feature variables. The discriminant analysis (DA) method was adopted to establish and verify the predictive model for wild-type and BRAFV600E mutant CRC tissues, and to calculate the positive judgment rate of the DA model of the calibration and validation sets.
The formalin-fixed, FFPE sections of CRC tissue with BRAFV600E mutant had been detected by NGS. The NIRS was obtained by scanning in the same spectral range as the calibration samples, and the NIRS-DA model was used to analyze the BRAFV600E mutant, identify the test sections, and record the results and finally conduct a comparative analysis.
Statistical Analysis
SPSS version 20.0 software was used for statistical analysis, and qualitative data were used to describe the adoption rate or composition ratio. The positive detection rates of the BRAF gene in CRC detected by IHC and NIRS were compared with the paired chi-square test, P<0.05 has statistics difference.
Results
Detection of BRAFV600E Mutation in Colorectal Cancer by IHC and Comparison with NGS Results
The BRAFV600E (VE1) antibody was used to detect the BRAFV600E mutant protein in 42 cases of FFPE CRC tissue sections by IHC, of which 1 case was positive (++), 13 cases were weakly positive (+), and 28 cases were negative (-) (Figure 1). The results showed that the staining site of BRAFV600E mutant protein expression was mainly located in the cytoplasm of tumor cells.
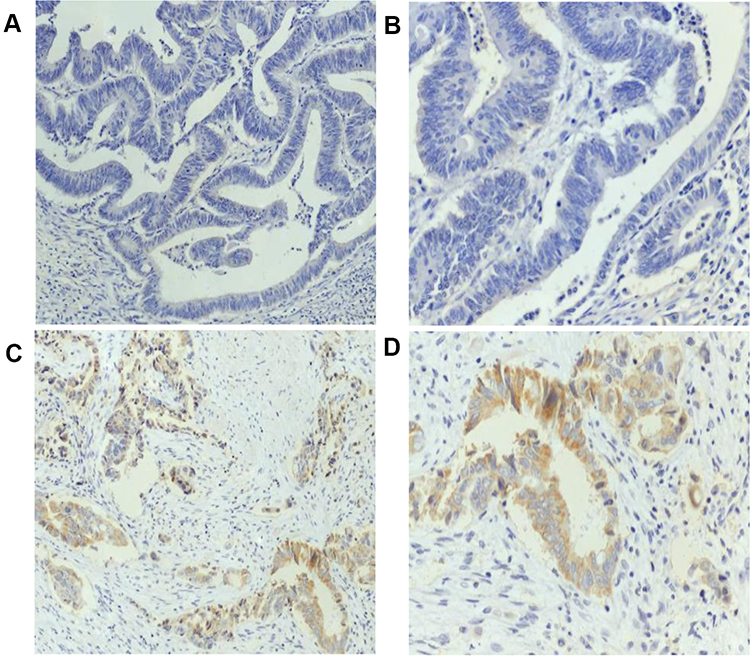 |
Figure 1 Expression of BRAFV600E (VE1) in CRC tissues. (A) Expression of BRAFV600E (VE1) in CRC tissues (-) (magnification, ×200). (B) Expression of BRAFV600E (VE1) in CRC tissues (-) (magnification, ×400). (C) Expression of BRAFV600E (VE1) in CRC tissues (+) (magnification, ×200). (D) Expression of BRAFV600E (VE1) in CRC tissues (+) (magnification, ×400). |
Comparing the results of the BRAFV600E mutant detected by IHC with the results of NGS, 14 positive samples were detected by IHC, but the NGS showed that they were wild-type, and the positivity rate for immunohistochemistry was 66.7% (28/42).
Establishment of the NIRS-DA Model for the BRAFV600E Mutant
The calibration of the NIRS-DA model for the identification of the BRAFV600E mutant was performed using 12 CRC tissue samples (6 wild-type and 6 mutants). For each CRC tissue sample, 3 locations were randomly selected for measurement, in Figure 2, the horizontal and vertical axes represented the distance to the wild-type and mutant signals, and signals closer to the respective axis indicated the genotype of the sample. The CAC was 100%, which indicated that the NIRS-DA model of the BRAFV600E mutant was established. Figure 2 illustrates the distance from the sample to the horizontal and vertical axes, A and B represent the wild-type and mutant calibration samples, respectively.
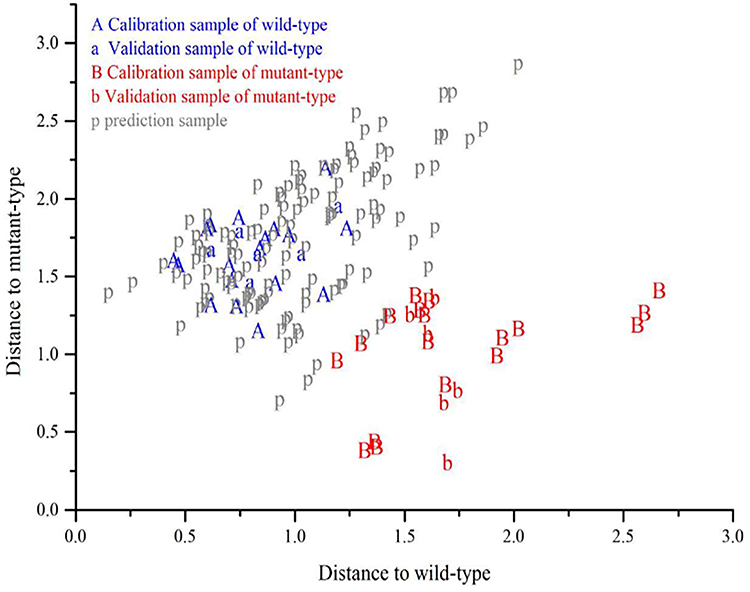 |
Figure 2 Establishment of the NIRS-DA model of BRAFV600E mutation, and verification and prediction of the BRAF mutation results in CRC. Each CRC tissue sample were randomly selected three locations for measurement and got the appropriate data. The horizontal and vertical axes represent the distance from wild-type and mutant signals, and signals closer to the respective axis indicated the genotype of the sample. A and B represent calibration sample of wild-type and mutant-type, respectively, while a and b represent the validation sample of wild-type and mutant-type; P represents the prediction sample. |
Validation of NIRS-DA Model of BRAFV600E Mutant
Conventional FFPE sections from 4 CRC tissue samples (2 wild-type and 2 mutant) were selected for test verification. Three locations of each CRC tissue sample were randomly selected for measurement, in Figure 2, the horizontal and vertical axes represented the distance to the wild-type and mutant signals, and signals closer to the respective axis indicated the genotype of the sample. The spectral range used in the validation sample was the same as that of the calibration sample, and the detection results of the BRAFV600E mutant NIRS-DA model were consistent with the results of NGS analysis. Figure 2 illustrates the distance from the samples to the horizontal and vertical axes, a and b represent the validation sample of the wild-type and mutant, respectively.
Prediction of BRAFV600E Mutation by NIRS-DA Model
The NIRS-DA model for the BRAFV600E mutation was used to detect BRAFV600E mutations in FFPE sections from 42 CRC tissues. In, Figure 2, three locations for measurement from each CRC tissue sample were randomly selected and the horizontal and vertical axes represent the distance from wild-type and mutant signals, and signals closer to the respective axis indicated the genotype of the sample. The results were compared with the previously obtained NGS results, which showed that 7 cases were BRAF mutants and 35 cases were BRAF wild-type; the CAP was 83.3% using the NIRS method. The predicted results strongly agreed with the NGS detection results. Figure 2 shows the distance of the samples from the horizontal and vertical axes; p represents prediction sample.
Comparison of IHC and NIRS in the Identification of BRAFV600E Mutants in CRC
Among the 42 cases of CRC predicted using the NIRS approach, 7 cases were identified as BRAFV600E mutant by NIRS; 14 were detected as BRAFV600E mutants using the IHC BRAFV600E (VE1) antibody. The results of both detection methods were compared with those of the NGS, the CAP of near-infrared spectroscopy was 83.3% (35/42), and the positive detection rate of IHC was 66.7% (28/42). There was no statistically significant difference between the positive detection rates of the two detection methods (P>0.05) (Table 1). The results showed that the NIRS-DA model could identify BRAF mutation in CRC tissues.
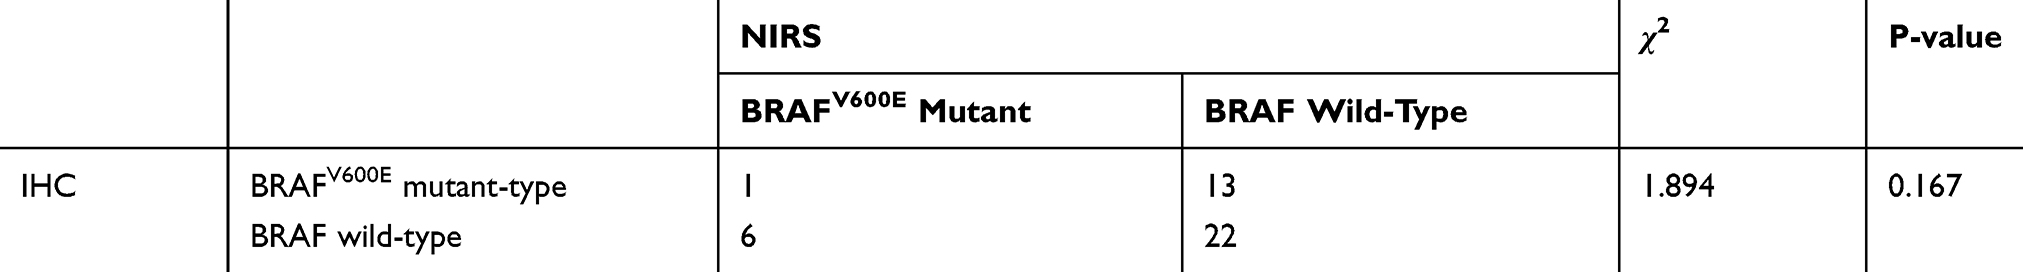 |
Table 1 Comparison of Positive Judgment Rates Between IHC and NIRS Methods |
Discussion
BRAFV600E mutation is a recognized poor prognostic marker in metastatic CRC.8,9,46 It can also distinguish hereditary non-polyposis CRC (HNPCC)-related tumors (BRAF wild-type) from mismatch repair defective sporadic CRC (BRAFV600E mutant-type).11,14
Perhaps the most significant prospect of precise BRAFV600E mutation detection is the utilization of targeted therapy in the emerging era of personalized medicine. Although the BRAF mutant CRC has not shown the same response to single-agent BRAF inhibitors as in metastatic melanoma, recent studies have found encouraging progress in overcoming CRC drug resistance mechanisms.47 Based on the latest data, clinical studies combining BRAF inhibitors with anti-EGFR monoclonal antibodies and MEK inhibitors are currently underway, which require accurate and efficient identification of BRAF mutant CRC patients.48,49
Currently, Sanger sequencing, RT-PCR, NGS, and immunohistochemical methods are mainly used to detect BRAF mutation.19,21,22,26 Among these methods, the first three methods require high standard requirement of samples and complicated procedures for sampling, which limit their application as routine detection methods.24 IHC is also affected by various factors such as specimen fixation time and fixative types. The requirements of quality control are also rigorous.29,30 In routine IHC detection of BRAF mutation in clinical pathology, judgment is mainly based on the staining intensity produced by the BRAFV600E (VE1) antibody in tumor cells. There is currently no exact cut-off value to define the number of positive cells.29,31,50 With the overall development of this test, it has been reported that the tumor cells often show heterogeneous staining and other changes, which impede the final judgment and results in judgement bias.27 In this study, we also used IHC to detect the BRAFV600E mutant in 42 cases of CRC, whose BRAF mutation status had been confirmed by NGS. The results showed that the positivity rate for IHC detection was 66.7%, with 14 cases of CRC being false positives: 13 cases were weakly stained in the cytoplasm and 1 case was moderately positive. Meanwhile, similar reports indicated that the determination of BRAF mutation by IHC staining was inconsistent with the NGS results in some cases.27 Therefore, it is of particular practical significance to find a more rapid, highly accurate and simple method to screen for BRAF mutations, which can effectively meet the increasingly fast pace of clinical work.
IR is an electromagnetic wavelength between visible light (VIS) and middle infrared (MIR and IR), which has been used to characterize hydrogen-containing molecular groups, as the non-resonance of the molecular vibrations indicate the transition of molecular vibrations from the ground state to higher energy levels.37 For each molecular change, the absorbance of different wavelengths and the combination with stoichiometry technology will produce spectral data that can be mathematically processed to analyze and identify molecular changes.35,36 Numerous studies have shown that NIRS can be used clinically for the non-invasive detection of blood components, such as glucose,51,52 oxygen levels in the blood53,54 and serum.55 In addition to blood, NIRS also can be used to detect other body fluids such as saliva56 and urine57 The composition of samples can be monitored by NIRS combined with chemometrics. NIRS has the advantages of being highly accurate, allowing the simultaneous analysis of multiple components, being non-destructive to the sample, not using toxic or harmful reagents, and being simple in execution. Thus, NIRS has been applied to many fields of medicine.58,59 In our previous study, the NIRS analysis technique was used to identify CRC and to identify CRC tissue to be subjected to the rapid NIRS-DA method. The technology has requested an application patent. This study explored whether NIRS could be used to detect BRAFV600E mutations.
In this study, 12 cases of CRC tissues which had previously been used for BRAF genotyping by NGS were used to establish the NIRS-DA model, and 4 cases of CRC tissues with known BRAF gene-phenotype were used to verify the model. The results showed that the CAC for the BRAF gene-phenotype recognized by NIRS was 100%. Subsequently, we used the established NIRS-DA model to identify BRAF mutation status in 42 cases of CRC tissues. The results were comparable to the NGS results, although 7 cases were judged as false positives, showing that the CAP of NIRS identification was 83.3%. The predicted results were in strong agreement with the NGS detection results. The BRAFV600E mutation involves the replacement of a valine (V) by glutamic acid (E), the spectral differences between valine (V) and glutamic acid (E) in different bands in the spectra can be captured, and NIRS could identify BRAFV600E mutant in CRC. The positive judgment rate was compared with the current widely used IHC approach, and the results showed no statistically significant difference, suggesting that the NIRS-DA model could identify BRAF mutation in CRC tissues. The NIRS-DA model predicted BRAFV600E mutant, with the advantage of not requiring any complex treatment before tissue samples could be examined. The entire detection process was easy to achieve. After the DA model was established, the FFPE sections of the tissue sample could be scanned, and the results obtained within a few minutes. Compared with the multi-step IHC staining procedure, the detection process is not easily obstructed by the external environment or by human factors, and thus is superior to IHC in the actual procedure.
In summary, the principles of NIRS can be used to identify molecular changes in FFPE tissue sections, and specifically, can be applied to identify BRAFV600E mutations in CRC. Real-time polymerase chain reaction and gene sequencing impose stringent requirements on sampling and require complicated technical procedures. The NIRS is a radically different approach from IHC, which is a multi-step process. The results of IHC also can be influenced by the interpretative skills of the pathologist, while the quality control requirements are rigorous. NIRS detection has the advantages of non-destructive sampling, high accuracy, and simple technical procedures. This study may extend the application of NIRS technology to the diagnosis of human cancer gene mutations on validation of the method using an expanded sample size.
Ethics Declarations
All of the patients provided informed consent, and the study was conducted in accordance with the Declaration of Helsinki. The present study was approved by the ethics committee of Chongqing Medical University (Chongqing, China).
Patient Consent for Publication
The publication of the study results was approved by the patients.
Author Contributions
All authors made important contribution to the conception, execution, analysis and interpretation of the study, or in all these areas. All authors participated in drafting, revising, or critically reviewing the manuscript; finally approved the version to be published; and agreed to submit the article to the journal. In addition, all authors agree to be responsible for all aspects of the work.
Correspondence to Professor Ya-Lan Wang.
Funding
The research was supported by the Scientific Research Foundation of Chongqing Medical University (grant no. 201413); and Intelligent Medicine Project of Chongqing Medical University (grant no. ZHYX2019014); the National Nature Science Foundation of China (grant no. 30870946).
Disclosure
Xue Zhang and Qi Fan report a patent, 201,910,332,553.X, issued. The authors report no other potential conflicts of interest for this work.
References
1. Kidger AM, Sipthorp J, Cook SJ. ERK1/2 inhibitors: new weapons to inhibit the RAS-regulated RAF-MEK1/2-ERK1/2 pathway. Pharmacol Ther. 2018;187:45–60. doi:10.1016/j.pharmthera.2018.02.007
2. Corcoran RB, Andre T, Atreya CE, et al. Combined BRAF, EGFR, and MEK inhibition in patients with BRAF(V600E)-mutant colorectal cancer. Cancer Discov. 2018;8(4):428–443. doi:10.1158/2159-8290.CD-17-1226
3. Davies H, Bignell GR, Cox C, et al. Mutations of the BRAF gene in human cancer. Nature. 2002;417(6892):949–954. doi:10.1038/nature00766
4. Barras D, Missiaglia E, Wirapati P, et al. BRAF V600E mutant colorectal cancer subtypes based on gene expression. Clin Cancer Res. 2017;23(1):104–115. doi:10.1158/1078-0432.CCR-16-0140
5. Simi L, Pratesi N, Vignoli M, et al. High-resolution melting analysis for rapid detection of KRAS, BRAF, and PIK3CA gene mutations in colorectal cancer. Am J Clin Pathol. 2008;130(2):247–253. doi:10.1309/LWDY1AXHXUULNVHQ
6. Bond CE, Whitehall VLJ. How the BRAF V600E mutation defines a distinct subgroup of colorectal cancer: molecular and clinical implications. Gastroenterol Res Pract. 2018;2018:9250757. doi:10.1155/2018/9250757
7. Day F, Muranyi A, Singh S, et al. A mutant BRAF V600E-specific immunohistochemical assay: correlation with molecular mutation status and clinical outcome in colorectal cancer. Target Oncol. 2015;10(1):99–109. doi:10.1007/s11523-014-0319-8
8. Chen D, Huang JF, Liu K, et al. BRAFV600E mutation and its association with clinicopathological features of colorectal cancer: a systematic review and meta-analysis. PLoS One. 2014;9(3):e90607. doi:10.1371/journal.pone.0090607
9. Tie J, Gibbs P, Lipton L, et al. Optimizing targeted therapeutic development: analysis of a colorectal cancer patient population with the BRAF(V600E) mutation. Int J Cancer. 2011;128(9):2075–2084. doi:10.1002/ijc.25555
10. Loughrey MB, Waring PM, Tan A, et al. Incorporation of somatic BRAF mutation testing into an algorithm for the investigation of hereditary non-polyposis colorectal cancer. Fam Cancer. 2007;6(3):301–310. doi:10.1007/s10689-007-9124-1
11. Weisenberger DJ, Siegmund KD, Campan M, et al. CpG island methylator phenotype underlies sporadic microsatellite instability and is tightly associated with BRAF mutation in colorectal cancer. Nat Genet. 2006;38(7):787–793. doi:10.1038/ng1834
12. Wu M, Kim YS, Ryu HS, et al. MSI status is associated with distinct clinicopathological features in BRAF mutation colorectal cancer: a systematic review and meta-analysis. Pathol Res Pract. 2020;216(1):152791. doi:10.1016/j.prp.2019.152791
13. Cohen R, Cervera P, Svrcek M, et al. BRAF-mutated colorectal cancer: what is the optimal strategy for treatment? Curr Treat Options Oncol. 2017;18(2):9. doi:10.1007/s11864-017-0453-5
14. Yamamoto H, Imai K. Microsatellite instability: an update. Arch Toxicol. 2015;89(6):899–921.
15. Loupakis F, Cremolini C, Masi G, et al. Initial therapy with FOLFOXIRI and bevacizumab for metastatic colorectal cancer. N Engl J Med. 2014;371(17):1609–1618. doi:10.1056/NEJMoa1403108
16. Corcoran RB, Dias-Santagata D, Bergethon K, Iafrate AJ, Settleman J, Engelman JA. BRAF gene amplification can promote acquired resistance to MEK inhibitors in cancer cells harboring the BRAF V600E mutation. Sci Signal. 2010;3(149):ra84. doi:10.1126/scisignal.2001148
17. Corcoran RB, Ebi H, Turke AB, et al. EGFR-mediated re-activation of MAPK signaling contributes to insensitivity of BRAF mutant colorectal cancers to RAF inhibition with vemurafenib. Cancer Discov. 2012;2(3):227–235. doi:10.1158/2159-8290.CD-11-0341
18. Ducreux M, Chamseddine A, Laurent-Puig P, et al. Molecular targeted therapy of BRAF-mutant colorectal cancer. Ther Adv Med Oncol. 2019;11:1758835919856494. doi:10.1177/1758835919856494
19. Dizdar L, Werner TA, Drusenheimer JC, et al. BRAF(V600E) mutation: a promising target in colorectal neuroendocrine carcinoma. Int J Cancer. 2019;144(6):1379–1390. doi:10.1002/ijc.31828
20. Vidal J, Bellosillo B, Santos Vivas C, et al. Ultra-selection of metastatic colorectal cancer patients using next-generation sequencing to improve clinical efficacy of anti-EGFR therapy. Ann Oncol. 2019;30(3):439–446. doi:10.1093/annonc/mdz005
21. Halait H, Demartin K, Shah S, et al. Analytical performance of a real-time PCR-based assay for V600 mutations in the BRAF gene, used as the companion diagnostic test for the novel BRAF inhibitor vemurafenib in metastatic melanoma. Diagn Mol Pathol. 2012;21(1):1–8. doi:10.1097/PDM.0b013e31823b216f
22. Gao J, Wu H, Shi X, Huo Z, Zhang J, Liang Z. Comparison of next-generation sequencing, quantitative PCR, and Sanger sequencing for mutation profiling of EGFR, KRAS, PIK3CA and BRAF in clinical lung tumors. Clin Lab. 2016;62(4):689–696. doi:10.7754/Clin.Lab.2015.150837
23. Thomas RK, Baker AC, Debiasi RM, et al. High-throughput oncogene mutation profiling in human cancer. Nat Genet. 2007;39(3):347–351. doi:10.1038/ng1975
24. Andersen JB, Spee B, Blechacz BR, et al. Genomic and genetic characterization of cholangiocarcinoma identifies therapeutic targets for tyrosine kinase inhibitors. Gastroenterology. 2012;142(4):1021–1031. doi:10.1053/j.gastro.2011.12.005
25. Abd Elmageed ZY, Sholl AB, Tsumagari K, et al. Immunohistochemistry as an accurate tool for evaluating BRAF-V600E mutation in 130 samples of papillary thyroid cancer. Surgery. 2017;161(4):1122–1128. doi:10.1016/j.surg.2016.06.081
26. Capper D, Preusser M, Habel A, et al. Assessment of BRAF V600E mutation status by immunohistochemistry with a mutation-specific monoclonal antibody. Acta Neuropathol. 2011;122(1):11–19. doi:10.1007/s00401-011-0841-z
27. Adackapara CA, Sholl LM, Barletta JA, Hornick JL. Immunohistochemistry using the BRAF V600E mutation-specific monoclonal antibody VE1 is not a useful surrogate for genotyping in colorectal adenocarcinoma. Histopathology. 2013;63(2):187–193. doi:10.1111/his.12154
28. Kim JK, Seong CY, Bae IE, et al. Comparison of immunohistochemistry and direct sequencing methods for identification of the BRAF(V600E) mutation in papillary thyroid carcinoma. Ann Surg Oncol. 2018;25(6):1775–1781. doi:10.1245/s10434-018-6460-3
29. Bledsoe JR, Kamionek M, Mino-Kenudson M. BRAF V600E immunohistochemistry is reliable in primary and metastatic colorectal carcinoma regardless of treatment status and shows high intratumoral homogeneity. Am J Surg Pathol. 2014;38(10):1418–1428. doi:10.1097/PAS.0000000000000263
30. Rossle M, Sigg M, Ruschoff JH, et al. Ultra-deep sequencing confirms immunohistochemistry as a highly sensitive and specific method for detecting BRAF V600E mutations in colorectal carcinoma. Virchows Arch. 2013;463(5):623–631. doi:10.1007/s00428-013-1492-3
31. Kuan SF, Navina S, Cressman KL, Pai RK. Immunohistochemical detection of BRAF V600E mutant protein using the VE1 antibody in colorectal carcinoma is highly concordant with molecular testing but requires rigorous antibody optimization. Hum Pathol. 2014;45(3):464–472. doi:10.1016/j.humpath.2013.10.026
32. Lv S, Zhang K, Zhu L, Tang D. ZIF-8-assisted NaYF4: yb, Tm@ZnOConverter with exonuclease III-powered DNA walker for near-infrared light responsive biosensor. Anal Chem. 2020;92(1):1470–1476. doi:10.1021/acs.analchem.9b04710
33. Cai G, Yu Z, Tong P, Ti TD. 3C2 MXene quantum dot-encapsulated liposomes for photothermal immunoassays using a portable near-infrared imaging camera on a smartphone. Nanoscale. 2019;11(33):15659–15667. doi:10.1039/C9NR05797H
34. Rodionova OY, Titova AV, Demkin NA, Balyklova KS, Pomerantsev AL. Qualitative and quantitative analysis of counterfeit fluconazole capsules: a non-invasive approach using NIR spectroscopy and chemometrics. Talanta. 2019;195:662–667. doi:10.1016/j.talanta.2018.11.088
35. Toledo-Martin EM, Garcia-Garcia MDC, Font R, et al. Quantification of total phenolic and carotenoid content in blackberries (Rubus Fructicosus L.) using near infrared spectroscopy (NIRS) and multivariate analysis. Molecules. 2018;23(12):12. doi:10.3390/molecules23123191
36. Xia F, Li C, Zhao N, et al. Rapid determination of active compounds and antioxidant activity of okra seeds using fourier transform near infrared (FT-NIR) spectroscopy. Molecules. 2018;23(3):3. doi:10.3390/molecules23030550
37. Chen H, Lin Z, Mo L, Wu T, Tan C. Near-infrared spectroscopy as a diagnostic tool for distinguishing between normal and malignant colorectal tissues. Biomed Res Int. 2015;2015:472197.
38. Luo Z, Zhang L, Zeng R, Su L, Tang D. Near-infrared light-excited core-core-shell UCNP@Au@CdS upconversion nanospheres for ultrasensitive photoelectrochemical enzyme immunoassay. Anal Chem. 2018;90(15):9568–9575. doi:10.1021/acs.analchem.8b02421
39. Luo Z, Qi Q, Zhang L, Zeng R, Su L. Branched polyethylenimine-modified upconversion nanohybrid-mediated photoelectrochemical immunoassay with synergistic effect of dual-purpose copper ions. Anal Chem. 2019;91(6):4149–4156. doi:10.1021/acs.analchem.8b05959
40. Lee S, Jeong H, Seong M, Kim JG. Change of tumor vascular reactivity during tumor growth and postchemotherapy observed by near-infrared spectroscopy. J Biomed Opt. 2017;22(12):121603. doi:10.1117/1.JBO.22.12.121603
41. Taskin S, Sukur YE, Altin D, et al. Laparoscopic near-infrared fluorescent imaging as an alternative option for sentinel lymph node mapping in endometrial cancer: a prospective study. Int J Surg. 2017;47:13–17. doi:10.1016/j.ijsu.2017.09.015
42. Yi WS, Cui DS, Li Z, Wu LL, Shen AG, Hu JM. Gastric cancer differentiation using fourier transform near-infrared spectroscopy with unsupervised pattern recognition. Spectrochim Acta A Mol Biomol Spectrosc. 2013;101:127–131. doi:10.1016/j.saa.2012.09.037
43. Chen H, Lin Z, Wu H, Wang L, Wu T, Tan C. Diagnosis of colorectal cancer by near-infrared optical fiber spectroscopy and random forest. Spectrochim Acta A Mol Biomol Spectrosc. 2015;135:185–191. doi:10.1016/j.saa.2014.07.005
44. Ferreiro-Gonzalez M, Espada-Bellido E, Guillen-Cueto L, Palma M, Barroso CG, Barbero GF. Rapid quantification of honey adulteration by visible-near infrared spectroscopy combined with chemometrics. Talanta. 2018;188:288–292. doi:10.1016/j.talanta.2018.05.095
45. Yang M, Wang A, Li C, et al. Methylation-induced silencing of ALDH2 facilitates lung adenocarcinoma bone metastasis by activating the MAPK pathway. Front Oncol. 2020;10:1141. doi:10.3389/fonc.2020.01141
46. Loupakis F, Ruzzo A, Cremolini C, et al. KRAS codon 61, 146 and BRAF mutations predict resistance to cetuximab plus irinotecan in KRAS codon 12 and 13 wild-type metastatic colorectal cancer. Br J Cancer. 2009;101(4):715–721. doi:10.1038/sj.bjc.6605177
47. Flaherty KT, Puzanov I, Kim KB, et al. Inhibition of mutated, activated BRAF in metastatic melanoma. N Engl J Med. 2010;363(9):809–819. doi:10.1056/NEJMoa1002011
48. Hong DS, Morris VK, El Osta B, et al. Phase IB study of vemurafenib in combination with irinotecan and cetuximab in patients with metastatic colorectal cancer with BRAFV600E mutation. Cancer Discov. 2016;6(12):1352–1365. doi:10.1158/2159-8290.CD-16-0050
49. Yaeger R, Cercek A, O’Reilly EM, et al. Pilot trial of combined BRAF and EGFR inhibition in BRAF-mutant metastatic colorectal cancer patients. Clin Cancer Res. 2015;21(6):1313–1320. doi:10.1158/1078-0432.CCR-14-2779
50. Lasota J, Kowalik A, Wasag B, et al. Detection of the BRAF V600E mutation in colon carcinoma: critical evaluation of the imunohistochemical approach. Am J Surg Pathol. 2014;38(9):1235–1241. doi:10.1097/PAS.0000000000000229
51. Uwadaira Y, Ikehata A, Momose A, Miura M. Identification of informative bands in the short-wavelength NIR region for non-invasive blood glucose measurement. Biomed Opt Express. 2016;7(7):2729–2737. doi:10.1364/BOE.7.002729
52. Dai J, Ji Z, Du Y, Chen S. In vivo noninvasive blood glucose detection using near-infrared spectrum based on the PSO-2ANN model. Technol Health Care. 2018;26(S1):229–239. doi:10.3233/THC-174592
53. Mehnati P, Khorram S, Zakerhamidi MS, Fahima F. Near-infrared visual differentiation in normal and abnormal breast using hemoglobin concentrations. J Lasers Med Sci. 2018;9(1):50–57. doi:10.15171/jlms.2018.11
54. Lazareva EN, Tuchin VV. Measurement of refractive index of hemoglobin in the visible/NIR spectral range. J Biomed Opt. 2018;23(3):1–9. doi:10.1117/1.JBO.23.3.035004
55. Rhiel M, Cohen MB, Murhammer DW, Arnold MA. Nondestructive near-infrared spectroscopic measurement of multiple analytes in undiluted samples of serum-based cell culture media. Biotechnol Bioeng. 2002;77(1):73–82. doi:10.1002/bit.10093
56. Kober SE, Wood G. Hemodynamic signal changes during saliva and water swallowing: a near-infrared spectroscopy study. J Biomed Opt. 2018;23(1):1–7. doi:10.1117/1.JBO.23.1.015009
57. Harer MW, Chock VY. Renal tissue oxygenation monitoring-an opportunity to improve kidney outcomes in the vulnerable neonatal population. Front Pediatr. 2020;8:241. doi:10.3389/fped.2020.00241
58. Luypaert J, Massart DL, Vander Heyden Y. Near-infrared spectroscopy applications in pharmaceutical analysis. Talanta. 2007;72(3):865–883. doi:10.1016/j.talanta.2006.12.023
59. Yin L, Zhou J, Chen D, et al. A review of the application of near-infrared spectroscopy to rare traditional Chinese medicine. Spectrochim Acta A Mol Biomol Spectrosc. 2019;221:117208. doi:10.1016/j.saa.2019.117208
 © 2020 The Author(s). This work is published and licensed by Dove Medical Press Limited. The full terms of this license are available at https://www.dovepress.com/terms.php and incorporate the Creative Commons Attribution - Non Commercial (unported, v3.0) License.
By accessing the work you hereby accept the Terms. Non-commercial uses of the work are permitted without any further permission from Dove Medical Press Limited, provided the work is properly attributed. For permission for commercial use of this work, please see paragraphs 4.2 and 5 of our Terms.
© 2020 The Author(s). This work is published and licensed by Dove Medical Press Limited. The full terms of this license are available at https://www.dovepress.com/terms.php and incorporate the Creative Commons Attribution - Non Commercial (unported, v3.0) License.
By accessing the work you hereby accept the Terms. Non-commercial uses of the work are permitted without any further permission from Dove Medical Press Limited, provided the work is properly attributed. For permission for commercial use of this work, please see paragraphs 4.2 and 5 of our Terms.