")
Back to Journals » Clinical Interventions in Aging » Volume 10
Preferred health behaviors and quality of life of the elderly people in Poland
Authors Cybulski M , Krajewska-Kulak E , Jamiolkowski J
Received 18 July 2015
Accepted for publication 19 August 2015
Published 29 September 2015 Volume 2015:10 Pages 1555—1564
DOI https://doi.org/10.2147/CIA.S92650
Checked for plagiarism Yes
Review by Single anonymous peer review
Peer reviewer comments 3
Editor who approved publication: Dr Richard Walker
Mateusz Cybulski,1 Elzbieta Krajewska-Kulak,1 Jacek Jamiolkowski2
1Department of Integrated Medical Care, 2Department of Public Health, Faculty of Health Sciences, Medical University of Bialystok, Bialystok, Poland
Purpose: The aim of this study was to assess possible differences between a group of residents of public nursing homes (PNH) and a group of members of Universities of the Third Age (UTA) measured using standard psychometric scales.
Materials and methods: The research was conducted between January 3, 2013 and February 15, 2014 on a group of 200 residents of PNH and 200 members of the UTA using five psychometric scales: Standardized Satisfaction with Life Scale (SWLS), Standardized Health Behavior Inventory (HBI), Standardized Social Support Scale (SSS), Standardized General Self-efficacy Scale (GSES), and Standardized Multiple Health Locus of Control Scale (MHLC).
Results: The average point total in the Standardized Satisfaction with Life Scale (SWLS) in the group of residents of PNH was 18.03 (Me =19) and was significantly higher (P=0.047) in comparison with the group of UTA members (17.08). Similar to residents of PNH, a vast majority of UTA members assessed the support received from the UTA as good, which significantly influenced their satisfaction from life (P=0.028) and their feeling of self-efficacy (P=0.048). An observed dependence states that the greater the level of satisfaction from life, the greater the level of various types of support from family.
Conclusion: This study indicates that biopsychosocial problems decrease quality of life in elderly people. The elderly people require a comprehensive, holistic approach to a variety of problems that occur with aging. In future, extended interdisciplinary research should be carried out on aspects of quality of life in order to optimize comprehensive geriatric assessment.
Keywords: social support, quality of life, self-efficacy, aging, health behaviors, elderly people
Introduction
The elderly value family ties very highly,1 regarding them as the most important and significant of all social relationships.
Good communication within the family, especially between the younger and the older generation, remains the most important ability acquired during life.2
Numerous scientific reports within the field of gerontology suggest that strong emotional ties with friends and family have a positive effect on the health and mental well-being of elderly adults.3–8
A factor that influences many aspects of human behavior is the feeling of self-efficacy.9,10 People with a high level of self-efficacy demonstrate greater motivation to initiate and continue activities despite difficulties encountered and efforts undertaken to complete them. They are also characterized by optimism and the ability to choose correct strategies of action. In cases of low self-efficacy, attributes such as helplessness, anxiety, sadness, and depression are common.11
There are numerous scientific publications that deal with the relationship between the social aspect and the health.11–13 According to Spranger,11 choosing social values is beneficial for forming lasting relationships between people, as well as maintaining the interest in public life and acting for the common good. Additionally, completing broad social tasks contributes to the physical fitness of the elderly.12 In studies conducted by Kasser and Ryan,13 it has been proven that people who value more the contacts with other people than financial successes have an easier time adapting, are stronger, and have a greater feeling of self-fulfillment. It has also been shown that these people are in less danger of feeling anxiety or depression and demonstrate fewer behavioral dysfunctions.13 Therefore, it is assumed that people who have a high regard for social values are able to form better relationships with others, taking advantage of social support in difficult situations, as well as offering support to other individuals which, in turn, may be a source of satisfaction for them.12
The aging population causes an increase in demand for valid and reliable tools that can quickly and reliably examine the functioning of the elderly in the society in an interdisciplinary biopsychosocial perspective. Interdisciplinary study of aging using psychometric scales may be important in the planning and implementation of comprehensive geriatric assessment.
Currently, there should be observed significant differences between the perception of old-age pensioners in the group of the residents of public nursing homes (PNH) and the members of University of the Third Age (UTA) caused, for example, by a greater physical and social activity of UTA members. The studied factors depend on many features, most frequently on lifestyle, current mental status, severity of dementia or other mental disorders, social contacts, relationships with family, etc.
The studies conducted by Erceg et al14 indicate that the presence of depressive symptoms and lower income are independent predictors of poor health-related quality of life in elderly patients hospitalized in Serbia. Vest et al15 showed that survivors of critical illness have reduced quality of life, especially in the physical domains, and functional status as measured by ADL disability and depression are the best predictors of quality of life in multivariable analysis. Gunaydin et al16 conducted a study in a group of 122 patients who were assessed within the first week after stroke and reevaluated at the third month. They concluded that the main determinant of quality of life was functional status. It has been suggested that improving physical function may be helpful to provide a better quality of life for patients with stroke.16 The results in the study of Calero and Navarro17 indicate that the main differences in the variables analyzed are due to the cognitive status of the sample and not to the fact that the participants are under or over 80 years of age. The findings show that major interindividual differences in this stage of life depend not only on age but also on cognitive status, which is an important factor to take into account when working with this sector of the population.17 Another study18 showed that physical and mental quality of life improved clinically after pulmonary rehabilitation, while optimal program outcomes were related to greater patient’s participation in supervised pulmonary rehabilitation.18
In the study conducted in Poland, the highest level of the deficiency was observed in patients in the eldest age group, as well as suffering from multi-illness, while material status, education, place of residence, or sex showed no significant influence on the level of need fulfillment.19 Other Polish study showed that the veteran home elderly, as a group “in transition” between community and institution, should be the first target of psychological preventive and health-promoting measures aimed at improving quality of life in older population.20
In the literature, there is no typical comparative study of two analyzed groups. Therefore, the authors decided to compare the two groups that differ in terms of sociodemographic characters and attempted to assess whether there were indeed some differences between the perceptions of old age and functioning during this period of life.
The main aim of this study was to assess possible differences between a group of residents of PNH and members of UTA regarding,
- being satisfied with life;
- preferred health behaviors connected with health (dietary habits, preventive behaviors, positive mental attitude, and health-related practices);
- perception of the three aspects of health: physical, mental, and social;
- values attributed to health in the context of other important personal assets and values;
- an individual’s beliefs in the three types of health locus of control, internal (belief that the control over one’s health depends on the individual), the influence of others (belief that the state of one’s health is a result of the activity of others, mainly medical personnel), and the influence of chance (the state of one’s health depends on chance or other external factors);
- social support received from family and their surroundings (other residents of the PNH/other members of the UTA);
- general belief in being able to successfully handle difficult situations and obstacles.
The following research hypothesis has been formulated: “There are differences in the functioning in elderly between the two study groups”.
Materials and methods
Participants
The research was conducted among 200 residents of PNH in Bialystok, Gizycko, and Olsztyn and 200 members of UTA in Bialystok, Bielsk Podlaski, and Gizycko, University of the Golden Age in Lomza and University of Healthy Seniors in Bialystok, aged ≥60 years without serious cognitive impairment.
Measurements and procedure
The study included a short interview to gather social and demographic data. Five standardized psychometric tools: Standardized Satisfaction with Life Scale (SWLS), Standardized Health Behavior Inventory (HBI), Standardized Social Support Scale (SSS), Standardized General Self-efficacy Scale (GSES), and Standardized Multiple Health Locus of Control Scale (MHLC) were used in the study.
The SWLS is a short five-item instrument designed to measure global cognitive judgments of satisfaction with one’s life. The scale is in the public domain. Below are five statements that respondent may agree or disagree with. The 1–7 scale below indicate respondent’s agreement with each item by placing the appropriate number on the line preceding that item: 7 – Strongly agree, 6 – Agree, 5 – Slightly agree, 4 – Neither agree nor disagree, 3 – Slightly disagree, 2 – Disagree, 1 – Strongly disagree.21 The following scores indicate the levels of SWLS: 31–35 – Extremely satisfied; 26–30 – Satisfied; 21–25 – Slightly satisfied; 20 – Neutral; 15–19 – Slightly dissatisfied; 10–14 – Dissatisfied; 5–9 – Extremely dissatisfied.
The HBI is a self-report instrument. It consists of 24 statements describing various health behaviors; the statements are then assigned values ranged from 1 to 5, depending on their incidence.21 Upon summing up of all the values, the indicator of the general increase of health behaviors is received. The test results obtained are in the range of 24–120 points, where a high indicator value is interpreted as a higher representation of pro-health behaviors. The following indicators were calculated in four categories of behavior, according to the test procedure: proper nutrition habits, prophylactic behaviors, positive psychological attitudes, and health practices.21 The overall rate of health behaviors were converted to sten scores. The results were interpreted as follows: 1–4 sten score as low, 5–6 sten score as average, and 7–10 sten score as high. Internal compatibility of the tool (HBI) is established based on Cronbach’s alpha score 0.80.21
The standardized Scale of Social Support is issued to examine the kind of strength of reinforcements an individual receives from both the family and the nursing staff.22–24 The scale is based on theoretical assumptions introduced by Tardy24 who distinguishes four types of supports: information (delivering to the individual messages important for him/her functioning, advice, and the like), instrumental (granting the individual the specific aid, eg, borrowing money and doing the shopping), evaluative (suggesting to the individual that he/she possesses such possibilities, abilities, skills, and the like, which are important for groups or persons to function correctly), and emotional (assuring the individual that there is a group or the person he can always count on and at any time a help will be given to him). Every scale (type of the support) still contains subscales due to 16 comprising positions included in the conclusive version of scale and calculated in spot categories. The public support is also being judged by taking them back to norms (1–3 low results; 4–7 average results, and 8–10 high results).21
General Self-Efficacy Scale (GSES) developed for the current study is based on the ten items.21 Their unidimensional scale has been validated in 30 countries with Cronbach’s alphas ranging from 0.76 to 0.90. The GSES designed for ages ≥12 was created to assess perceived self-efficacy with regard to coping and adaptation abilities in both daily activities and isolated stressful events.21 Items are designed to assess the individual’s belief in his/her ability to respond to novel or difficult situations. All items are scored on a four-point scale (1 – not at all true, 2 – barely true, 3 – moderately true, 4 – exactly true). Score range is 10–40. Higher scores indicate greater perceived competence to cope with difficult situations or generalized self-efficacy. No cut points are provided.21
The MHLC comprises 18 self-reported statements concerning opinions in the scope of generalized expectations in three dimensions of health locus of control: Internality (IHLC), Powerful Others Externality (PHLC), and Chance Externality (CHLC).21 Each category consists of six statements with a 6-degree scale of agreement (from 1 – I completely disagree to 6 – I fully agree). The results are summarized separately within each scale (with range from 6 to 36 points). The alpha reliabilities for the IHLC, PHLC, and CHLC scales are 0.75, 0.61, and 0.59, respectively.21 The score on each subscale is the sum of the values circled for each item on the subscale (ie, where 1= “strongly disagree” and 6= “strongly agree”). No items need to be reversed before summing. All of the subscales are independent of one another. There is no such thing as a “total” MHLC score.21
Procedure and ethical considerations
The research was conducted between January 3, 2013 and February 15, 2014 after having obtained permission from the Bioethics Committee of the Medical University in Bialystok (statute no R-I-002/651/2012), as well as the written consent of authorities managing the PNH in Bialystok, Gizycko, and Olsztyn; presidents of the Universities of the Third or Golden Age in Bialystok, Lomza, and Bielsk Podlaski; and director of the Center for the Prevention of Drug Abuse and Social Integration in Gizycko supervising the Gizycko University of the Third Age as well as the coordinator of the University of Healthy Seniors, operating at the Faculty of Health Sciences of the Medical University of Bialystok. All the research tools used for the study were purchased from Psychological Test Laboratory of the Polish Psychological Association.
Statistical analysis
The obtained data were compiled using Microsoft Excel 2010. Regarding the psychometric scales applied, the Shapiro–Wilk test was used to ensure that their distribution was consistent with normal distribution, whereas the Kruskal–Wallis test was applied to compare the values of the scales in subgroups dependent on answers to individual questions. The nonparametric Mann–Whitney test was used because significant deviations from the norm were detected in most cases. Nonparametric Spearman correlations were applied to analyze relationships between individual scales. Statistical hypotheses were verified at the P=0.05 significance level. Calculations were completed using IBM® SPSS® Statistics program, version 20.0.
Results
In both study groups, women predominated. In the group of residents of PNH, women constituted 69%, while among members of UTA, they were 81%. More than half of the residents of PNH were >70 years old, whereas people aged from 61 to 70 predominated among members of UTA (51.5%). In PNH, widows/widowers prevailed (37.5%), while half the members of UTA were married. Statistically significant differences were found between all groups (P<0.001). In the test for proportions, marked differences were proved in the groups of married couples, widowed, and divorced (P<0.05). In the group of PNH residents, the highest number of people had vocational education (47.0%), whereas in the group of UTA, people with higher education constituted 47.5% of the surveyed. In both groups, a similar percentage of the respondents had secondary education (42% in the PNH residents vs 45% in the UTA members). Among the residents of PNH, there were the fewest people with higher education (11%), while in the group of UTA members, there were people with vocational education (7.5%). These differences between the study groups of UTA and PNH were statistically significant (P<0.001).
In the group of PNH residents, the highest percentage, 44.5%, stayed there from 2 to 5 years. More than 20% of the surveyed (21.0%) lived in PNH for a year. Twelve people (6.0%) stayed in PNH for 16 years and longer. Similarly, there was the highest percentage of the members of UTA with 2–5-year membership (57.5%). The participants with ≥16 years membership of UTA constituted 3.0% of the members. These differences between groups were statistically significant (P=0.002).
The average point total in the standardized Satisfaction with Life Scale (SWLS) in the group of residents of PNH was 18.03 (Median [Me] =19) and was significantly higher (P=0.047) in comparison with the group of UTA members (17.08). Relating the obtained results to the standard ten scale, a sten score in the vicinity of 5 was recorded for the group of residents of PNH, a total that can be treated as an average result, while in the group of UTA members, a sten score of ~4 was obtained, a score that should be treated as a low result.
The average point total in Juczynski’s HBI for the group of residents of PNH reached 87.65 (Me =88) and was not significantly lower (P=0.704) in comparison with the group of UTA members (88.48). Relating the results for the standard ten scale, a sten score of ~7 was gained in both the group of residents of PNH and the group of members of UTA, a score that can be treated as a high result.
In analyzing the four categories of health behaviors of the HBI scale, the average point total in the correct dietary habits category for the group of residents of PNH reached a level of 3.50 (Me =3.5) and was significantly lower (P=0.022) when compared with the total in the group of members of UTA (3.69). The average point total in the preventive behavior category for the group of PNH residents was 3.49 (Me =3.5) and was significantly lower (P=0.003) in comparison with that of the group of UTA members (3.72). The average point total in the positive mental attitude category in the group of residents of PNH attained a value of 3.86 (Me =3.83) and was significantly higher (P=0.018) when compared with the point total gained by the group of UTA members (3.71). The average point total in the health practices category for the group of PNH residents was 3.76 (Me =3.83) and was significantly higher (P=0.019) in comparison with the group of UTA members (3.63).
The average point total in the SSS, developed by Kmiecik-Baran, assessing family support in the group of PNH residents was 41.00 (Me =38) and was not significantly higher (P=0.951) when compared with the group of UTA members (40.03), which resulted in an average level of social support.
The average point total in the SSS assessing the family in the scope of informational support for the group of PNH residents was 10.10 (Me =9) and was not significantly higher (P=0.761) in comparison with the group of UTA members (9.90), which led to an average level of informational support. The average point total in the SSS assessing the family in the scope of instrumental support for the group of PNH residents reached a level of 11.22 (Me =11) and was not significantly higher (P=0.081) in comparison with the group of members of the UTA (10.63), which resulted in an average level of instrumental support. The average point total in the SSS assessing the family in the scope of appraisal support in the group of residents of PNH was 10.57 (Me =10) and was not significantly higher (P=0.573) when compared with the group of UTA members (10.33), which resulted in an average level of appraisal support. The average point total in the SSS assessing the family in the scope of emotional support for the group of PNH residents attained a value of 9.12 (Me =7) and was significantly lower (P=0.012) in comparison with the group of the members of UTA (9.18), which led to an average level of emotional support.
The average point total of SSS assessing other residents of PNH/members of UTA in the PNH resident group was 45.51 (Me =43) and was significantly lower (P=0.002) in comparison with the group of UTA members (49.30), which led to an average level of social support for the group of PNH residents and a high level of social support for the group of UTA members.
The average point total of the SSS in assessing other residents of PNH/members of UTA in the scope of informational support for the group of PNH residents was 11.19 (Me =10.5) and was significantly lower (P=0.017) when compared with the total attained by the group of members of UTA (12.03), which led to an average level of informational support for the group of PNH residents and a high level of informational support in the group of UTA members. The average point total of the SSS in assessing other residents of PNH/members of UTA in the scope of instrumental support for the group of PNH residents reached 12.46 (Me =12) and was significantly lower (P=0.021) in comparison with the group of UTA members (13.24), which resulted in a high level of instrumental support for both groups. The average point total for the SSS in assessing other residents of PNH/members of UTA in the scope of appraisal support for the group of PNH residents was 11.71 (Me =11) and was significantly lower (P=0.030) when compared with the group of members of UTA (12.41), which led to an average level of appraisal support in the group of PNH residents and a high level of appraisal support for the group of UTA members. The average point total for the SSS in assessing other residents of PNH/members of UTA in the scope of emotional support reached 10.15 (Me =9) and was significantly lower (P<0.001) in comparison with the group of UTA members (11.64), which resulted in an average level of emotional support in both groups.
The average point total in the GSES in the group of PNH residents reached 30.98 (Me =30.5) and was not significantly lower (P=0.062) in comparison with the group of members of UTA (29.94). The results obtained in both groups were higher than the general result of 27.32. Relating the attained results to the standard ten scale, for the group of PNH members, a sten score of ~7 was obtained, which can be treated as a high result, while in the group of UTA members, a sten score of ~6 was attained, which is treated as an average result.
The average point total in the standardized Multidimensional Health Locus of Control scale (MHLC), in the internal aspect, in the group of PNH residents reached a level of 26.04 (Me =27) and was not significantly higher (P=0.078) in comparison with the group of UTA members (25.16). The average point total in the MHLC scale in the aspect of the influence of others for the group of PNH residents was 26.64 (Me =29) and was significantly higher (P<0.001) in comparison with the group of members of UTA (25.12). The average point total in the MHLC scale in the aspect of the influence of chance for the group of residents of PNH reached 26.10 (Me =27) and was significantly higher (P<0.001) when compared with the total attained by the group of members of UTA (23.93).
In comparing the answers to the question “Have you thought about old age?” with the results from the applied psychometric scales, in the group of PNH residents, no statistically significant differences in considering old age and the feeling of satisfaction from life (P=0.418), positive mental attitude (P=0.956), social support from family (P=0.868) and other residents of a PNH (P=0.267), and the feeling of self-efficacy (P=0.259) have been recorded for the members of this subgroup.
In the group of UTA members, statistically significant differences between considering old age and social support from family (P=0.018) and the feeling of self-efficacy (P=0.002) have been recorded. In the remaining cases, no significant differences have been noted. Detailed information on the discussed matters is presented in Table 1.
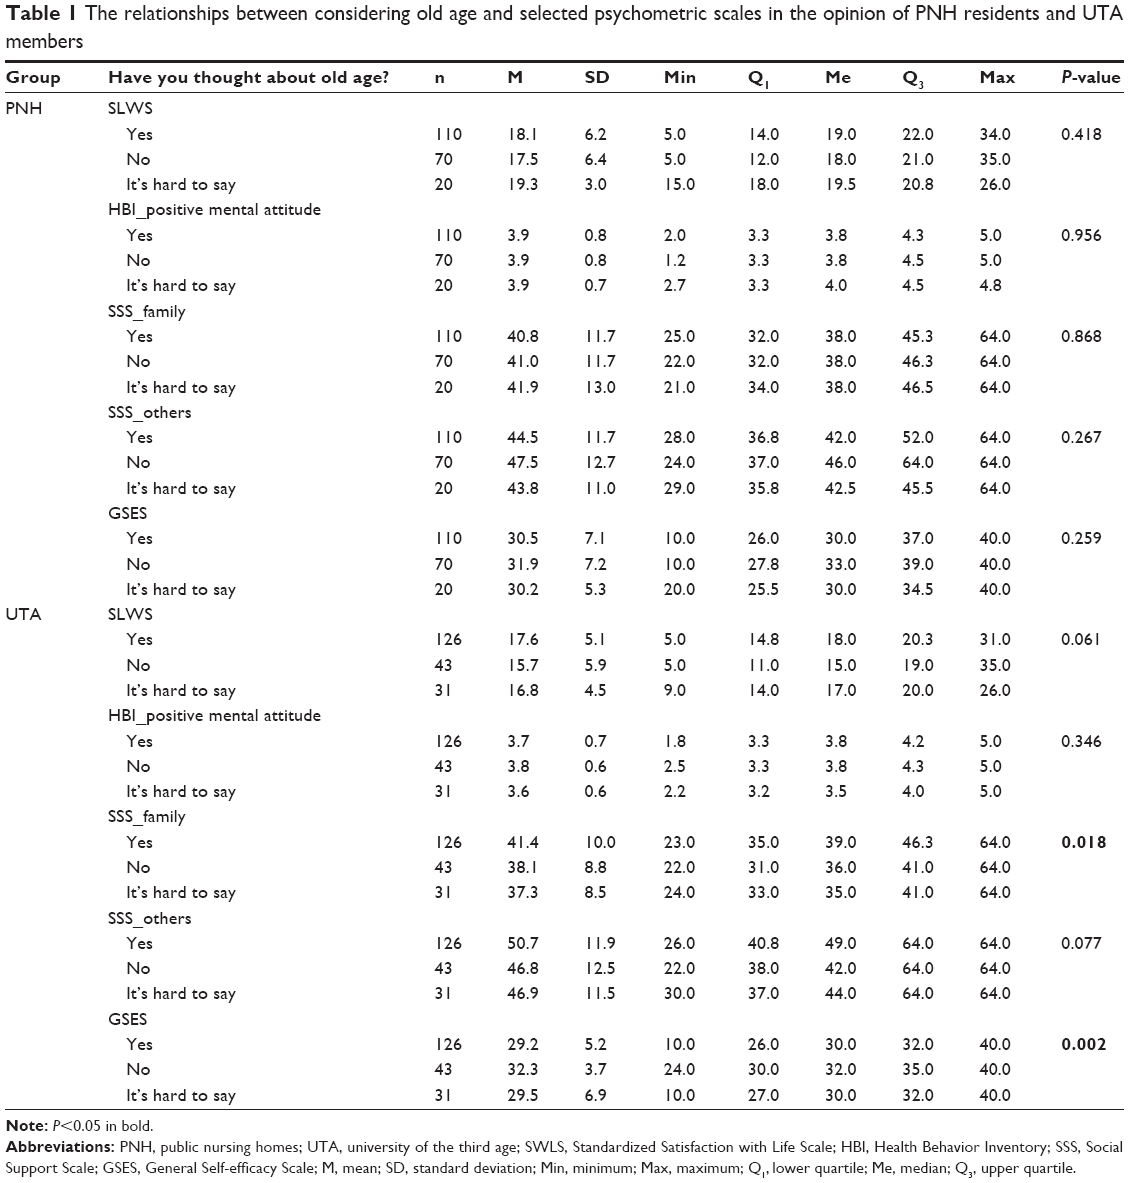 | Table 1 The relationships between considering old age and selected psychometric scales in the opinion of PNH residents and UTA members |
A vast majority of the respondents from the PNH resident group to some degree assess the care provided in these institutions as good, which significantly influenced the satisfaction with life in this group (P=0.010) as well as their level of self-efficacy (P=0.014; Table 2).
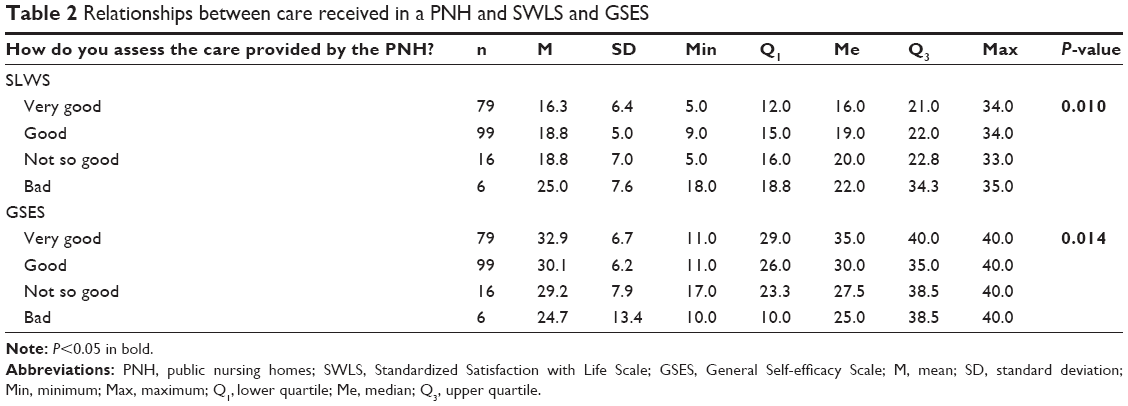 | Table 2 Relationships between care received in a PNH and SWLS and GSES |
Similar to residents of PNH, a vast majority of UTA members assessed the support received from the UTA as good, which significantly influenced their satisfaction from life (P=0.028) and their feeling of self-efficacy (P=0.048; Table 3).
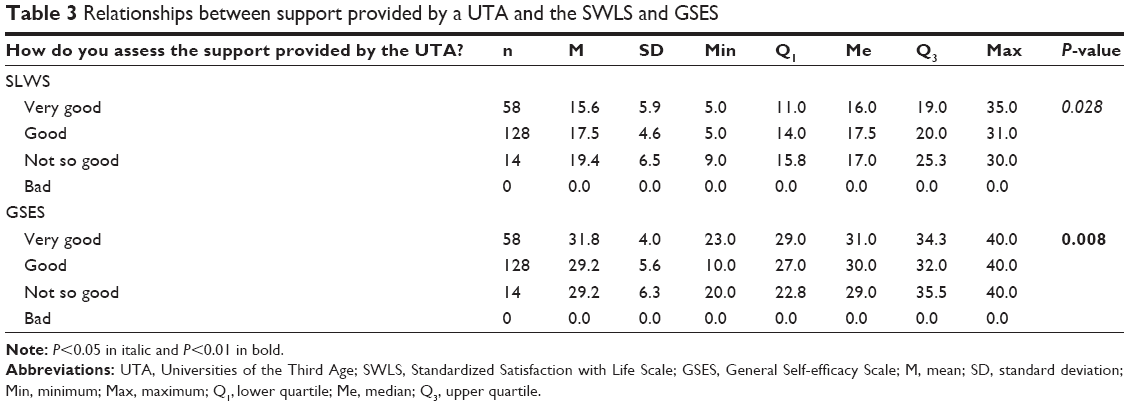 | Table 3 Relationships between support provided by a UTA and the SWLS and GSES |
Through analysis of the relationships between particular scales, it has been shown that in the group of residents of PNH, the feeling of satisfaction from life was connected to the feeling of support from immediate family (Spearman’s R=0.28) in a statistically significant way. Residents of PNH received the greatest emotional support from their families (Spearman’s R=0.30), and the degree of received instrumental support was the lowest (Spearman’s R=0.16). A dependence has been observed: the greater the level of satisfaction from life, the greater the level of various types of support from family. A reverse dependence has been recorded in the case of comparing the level of satisfaction with life and the level of health locus of control. It has been shown that the greater the level of satisfaction with life, the lower the level of the health locus of control in respect to the internal aspect (Spearman’s R=−0.23), aspect of the influence of others (Spearman’s R=−0.24), and the aspect of the influence of chance (Spearman’s R=−0.20). Additionally, it has been proven that the higher the level of satisfaction with life, the lower the level of general self-efficacy (Spearman’s R=−0.36).
Through analysis of the relationships between particular scales, it has been shown that in the group of UTA members, the feeling of satisfaction with life was connected to the support received from immediate family (Spearman’s R=0.26) in a statistically significant manner. Members of UTA received the greatest informational support from their families, and the lowest level of support as instrumental support (Spearman’s R=0.15).
An observed dependence states that the greater the level of satisfaction from life, the greater the level of various types of support from family. A reverse dependence has been recorded in the case of comparing the level of satisfaction with life and the level of health locus of control. It has been shown that the greater the level of satisfaction with life, the lower the level of the health locus of control in respect to the influence of others aspect (Spearman’s R=−0.15). In cases of the internal aspect and the influence of chance aspect of the health locus of control, no statistically significant differences have been shown. Additionally, it has been proven that the higher the level of satisfaction with life, the lower the level of general self-efficacy (Spearman’s R=−0.35).
Discussion
In case of the elderly, support provided by their environment is vital.
Zielinska-Wieczkowska et al25 conducted the study among 80 elderly patients waiting for a surgical procedure at a surgical ward of a county hospital located in Northern Poland. The patients aged from 60 to 74 years were city dwellers, with vocational education, married, and in majority having children, with an average financial status. A diagnostic survey was used as a study method, while the research tool was the SSS designed by Krystyna Kmiecik-Baran. The saturation of emotional support occurred in the vast majority of respondents (80%) at a very high level and in the remaining patients (20%) on a high level. Similarly, instrumental support reached a very high level of saturation for 76.3% of patients, a high level of saturation for 22.5% of patients, and low for 1.3% of respondents. Saturation of appraisal support occurred at a high level for 73.8% of participants, at a very high level for 13.8% of patients, at a low level for 7.5%, and very low for 5% of respondents taking part in the survey. An average result of 8.3 out of 12 possible points constituted 69.1% and proved a very high saturation of appraisal support for the older people patients awaiting surgery at the surgical ward. Through analysis of informational support, it was revealed that the average obtained result attained the value of 20.8 out of 30 available points (69.4%) and supported the high saturation level of informational support.25
In the current study, the average point total in the SSS in the group of PNH residents was 41.00 (Me =38) and was not significantly higher (P=0.951) when compared with the group of UTA members (40.03), which led to an average level of social support. The saturation of residents of PNH (9.12) and members of UTA (9.18) in emotional support from family was at the lowest level. A similar situation took place regarding other residents of PNH/other members of UTA (10.15 in the PNH group vs 11.64 in the UTA group).
Satisfaction with life is a general measure of being content with our own achievements and living conditions.26 Swierzewska27 draws attention to the fact that one of the factors that is important in the context of satisfaction with life of the older adults is remaining active, which is connected to the level of emotional intelligence, optimistic attitude, and hope associated with life satisfaction. According to the author,27 the assumption that older adults who have a higher level of these features are more active and, what follows, are characterized by a higher level of satisfaction with life seems to be justified. The author, therefore, conducted research whose aim was to assess whether activity for the older adults is associated with a higher level of satisfaction with life and to ascertain whether there is a connection between satisfaction with life and emotional intelligence, optimistic attitude, and basic hope. With this aim in mind, she studied 101 people >60 years old, including 64 active people and 37 who were not active. The results obtained by the author27 showed a relationship between activity and satisfaction with life for men – greater activity was connected to a higher level of life satisfaction. Active men were also more satisfied than active women.27
Jachimowicz and Kostka28 aimed at the assessment of life satisfaction of elderly women and the determination of the correlation between the physical, psychological, and functional state of older people women/elderly women and the satisfaction with life. Their study included 100 women aged ≥65 who were members of the UTA and residents of the Home for Veterans and Pensioners. A Satisfaction with Life Scale (SWLS) questionnaire was used to assess satisfaction with life. The functional, physical, and psychological state of participants was also evaluated using questionnaires that were a part of a general geriatric assessment. It was revealed28 that the women taking part in the study in majority presented average and high satisfaction with life. Their contentment with life alleviated their bladder control problems and the circulatory system problems, as well as the reduced abilities in everyday functioning, depression symptoms, and bad state of nutrition.28
Research conducted by Halicka29 dealing with satisfaction with life of the older adults concluded that a vast majority of participants declared, to some degree, contentment with their life, but assessed their life accomplishments higher than their current situation. Both women and men similarly assessed their life accomplishments; however, men evaluated their current life situation in a statistically significant way. The author29 explains this fact via the aging process itself, whose consequences include health, material and cognitive limitations, as well as the lack of fulfillment of current needs of the older adults.
In our study, the average point total for the standardized Satisfaction with Life Scale (SWLS) in the group of PNH residents reached 18.03 (Me =19) and was significantly higher (P=0.047) in comparison with the group of UTA members (17.08). Relating the obtained results to the standard ten scale, the sten score attained in the group of PNH residents was ~5, which can be treated as an average result, while in the group of UTA members, a sten score in the vicinity of 4 was achieved, which can be treated as a low result.
Gromulska et al30 remind us that health is dependent on multiple factors, such as individual and ones connected to health behaviors, lifestyle, and social, socioeconomic, and cultural characteristics. Health behaviors encompass all activity, which is initiated because of health and having a proven effect on health.
Muszalik et al31 assessed health behaviors of the older adults in connection to sociodemographic factors. Their study involved 110 patients being treated at the Department and Clinic of Geriatrics in Bydgoszcz, including 63 women (57.3%) and 47 men (42.7%). The average age of the participants was 76.8 years. The study was based on a diagnostic survey using the Health Behavior Inventory designed by Juczynski. Analysis of the results demonstrated that the health behavior indicator for all respondents attained a value of 83.2, 83.41 for women and 82.96 for men. The results gained in the study were slightly higher than standard ones in categories of preventive behaviors, positive mental attitude, and health practices, while correct dietary practices fell below average norms.31
Smolen et al32 analyzed health behavior of a study population of people attending the lectures provided by the UTA and presented a high result in the health behavior category (88.39).
A slightly lower average HBI result (86.8) in a group of UTA members was attained in research conclusions of Debska et al.33 The higher HBI result for members of UTA may be due to the higher level of education of participants. The authors’ own studies have proven that the higher level of health practices was shown by UTA members (88.48). This result was, however, only slightly higher than the level of health practices attained in the group of PNH residents (87.65).
Koziel et al34 initiated research with an aim to assess the health behaviors of the older people who were remaining active through membership in the UTA and their peers who were not active in a similar manner. The study was conducted on a group of 394 people, including 197 members of UTA in Kielce, who became the study group, and 197 older adults who were not active in the UTA, who became the control group. The study used, with the authors’ permission, the HBI scale designed by Juczynski. The authors of the study34 proved statistically significant differences between the two groups: the older adults who were intellectually active generally attained a higher indicator value of pro-health behaviors, had better dietary habits, more often used preventive measures and practices favoring good health, and displayed better mental attitude in comparison with their peers from the control group.
Conclusion
- This study indicates that biopsychosocial problems decrease quality of life in elderly people.
- The elderly people require a comprehensive, holistic approach to a variety of problems that occur with aging.
- In future, extended interdisciplinary research should be carried out on aspects of quality of life in order to optimize comprehensive geriatric assessment.
Acknowledgments
The study was carried out under the project “Studies, research, commercialization – a support programme of UMB doctoral students” Sub-measure 8.2.1 Human Capital Operational Programme, co-financed from the European Union under the European Social Fund.
Disclosure
The authors report no conflicts of interest in this work.
References
Wisniewska-Roszkowska K. Aging as a Task. Warsaw: Pax Publishing; 1989. | ||
Wasylewicz M. Intergenerational communication and acquisition of key competences. In: Balogová B, editor. Elan Vital v Priestore Medzigeneracnych Vztahov. Presov: Filozofická Fakulta Prešovskej University; 2010:86–92. | ||
Lampinen P, Heikkinen RL, Kauppinen M, Heikkinen E. Activity as a predictor of mental well-being among older adults. Aging Ment Health. 2006;10(5):454–466. | ||
Sumic A, Michael UL, Carlson NE, Howieson DB, Kaye JA. Physical activity and the risk of dementia in oldest old. J Aging Health. 2007;19(2):242–258. | ||
Reichstadt J, Depp CA, Palinkas LA, Folsom DP, Jeste DV. Building blocks of successful aging: a focus group study of older adults perceived contributors to successful aging. Am J Geriatr Psychiatry. 2007;15(3):194–201. | ||
Gabriel Z, Bowling A. Quality of life from the perspectives of older people. Aging Soc. 2004;24:675–691. | ||
Mancini JA, Simon J. Older adults’ expectations of support from family and friends. J Appl Gerontol. 1984;3:150–160. | ||
Nocon A, Pearson M. The roles of friends and neighbours in providing support for older people. Aging Soc. 2000;20:341–367. | ||
Juczynski Z. Tools for Promotion and Health psychology. Warsaw: Laboratory of Psychological Tests Polish Psychological Association; 2001. | ||
Bandura A. Self-efficacy. Toward a unifying theory of behavioral change. Psychol Rev. 1977;84(2):191–215. | ||
Spranger E. Lebensformen: Geisteswissenschaftliche Psychologie und Ethik der PersÖlichkeit. Haale: Max Niemeyer Verlag; 1966. | ||
Mudyn K, Pietras K. Could personal values be ‘healthy’ or ‘unhealthy’? Sztuka Leczenia. 2006;12(1–2):67–76. | ||
Kasser T, Ryan MR. A dark side of the American dream: correlates of financial success as a central life aspiration. J Pers Soc Psychol. 1993;65(2):410–422. | ||
Erceg P, Despotovic N, Milosevic DP, et al. Health-related quality of life in elderly patients hospitalized with chronic heart failure. Clin Interv Aging. 2013;8:1539–1546. | ||
Vest MT, Murphy TE, Araujo KL, Pisani MA. Disability in activities of daily living, depression, and quality of life among older medical ICU survivors: a prospective cohort study. Health Qual Life Outcomes. 2011;9:9. | ||
Gunaydin R, Karatepe AG, Kaya T, Ulutas O. Determinants of quality of life (QoL) in elderly stroke patients: a short-term follow-up study. Arch Gerontol Geriatr. 2011;53(1):19–23. | ||
Calero D, Navarro E. Differences in cognitive performance, level of dependency and quality of life (QoL), related to age and cognitive status in a sample of Spanish old adults under and over 80 years of age. Arch Gerontol Geriatr. 2011;53(3):292–297. | ||
Oztürk A, Simşek TT, Yümin ET, Sertel M, Yümin M. The relationship between physical, functional performance and quality of life (QoL) among elderly people with a chronic disease. Arch Gerontol Geriatr. 2011;53(3):278–283. | ||
Muszalik M, Dijkstra A, Kędziora-Kornatowska K, Zielińska-Więczkowska H. Health and nursing problems of elderly patients related to bio-psycho-social need deficiencies and functional assessment. Arch Gerontol Geriatr. 2012;55(1):190–194. | ||
Kostka T, Jachimowicz V. Relationship of quality of life to dispositional optimism, health locus of control and self-efficacy in older subjects living in different environments. Qual Life Res. 2010;19(3):351–361. | ||
Juczynski Z. Measurement Tools in the Promotion and Health Psychology. Warsaw: Laboratory of Psychological Tests Polish Psychological Association; 2009. | ||
Kmiecik-Baran K. The scale of social support. Theory and psychometric properties. Przegl Psychol. 1995;38:201–214. | ||
Kmiecik-Baran K, Adamczyk S. Presentation of the Links Between Anti-Work-Related Stress and the Economic and Social Benefits for Companies and Employees – Exchange of Good Practices. Gdansk: The National Commission NSZZ, Solidarnosc; 2007. | ||
Tardy CHH. Social support measurement. Am J Community Psychol. 1985;13:187–202. | ||
Zielinska-Wieczkowska H, Pryka K, Muszalik M, Kedziora-Kornatowska K. The role of nursing team in supporting older people patients awaiting operation – in relation to socio-demographic factors. Psychogeriatria Polska. 2012;9(2):61–68. | ||
Diener E, Emmons RA, Larsen RJ, Griffin S. The satisfaction with life scale. J Pers Assess. 1985;49(1):71–75. | ||
Swierzewska D. Satisfaction with life active and inactive people over the age of 60. Psychologia Rozwojowa. 2010;15(2):89–99. | ||
Jachimowicz V, Kostka T. Satisfaction with life of older people women. Ginekologia Praktyczna. 2009;3:27–32. | ||
Halicka M. Satisfaction Life of Old People. Bialystok: Medical University of Bialystok; 2004. | ||
Gromulska L, Piotrowicz M, Cianciara D. Self-efficacy in health behavior models for health education. Przegl Epidemiol. 2009;63:427–432. | ||
Muszalik M, Zielinska-Wieczkowska H, Kedziora-Kornatowska K, Kornatowski T. Assessment of selected health behavior among older people people in Juczyński’s Inventory of Health Behavior regarding socio-demographic factors. Probl Hig Epidemiol. 2013;94(3):509–513. | ||
Smolen E, Gazdowicz L, Zylka-Reut A. Health behaviors in older people population. Pielegniarstwo XXI wieku. 2011;36(3):5–9. | ||
Debska G, Korbel-Pawlas M, Zieba M, Lawska W, Luberda A. Quality of life vs. health behaviours among respondents attending the University of the Third Age (U3A) – preliminary study. Zdr Publ. 2012;122(1):48–54. | ||
Koziel D, Kaczmarczyk M, Naszydlowska E, Galuszka R. The influence of studying at the third age university on older people people’s health behaviour. Studia Medyczne. 2008;2:23–28. |
 © 2015 The Author(s). This work is published and licensed by Dove Medical Press Limited. The full terms of this license are available at https://www.dovepress.com/terms.php and incorporate the Creative Commons Attribution - Non Commercial (unported, v3.0) License.
By accessing the work you hereby accept the Terms. Non-commercial uses of the work are permitted without any further permission from Dove Medical Press Limited, provided the work is properly attributed. For permission for commercial use of this work, please see paragraphs 4.2 and 5 of our Terms.
© 2015 The Author(s). This work is published and licensed by Dove Medical Press Limited. The full terms of this license are available at https://www.dovepress.com/terms.php and incorporate the Creative Commons Attribution - Non Commercial (unported, v3.0) License.
By accessing the work you hereby accept the Terms. Non-commercial uses of the work are permitted without any further permission from Dove Medical Press Limited, provided the work is properly attributed. For permission for commercial use of this work, please see paragraphs 4.2 and 5 of our Terms.