")
Back to Journals » ClinicoEconomics and Outcomes Research » Volume 9
Predictors of reaching a serum uric acid goal in patients with gout and treated with febuxostat
Authors Sheer R, Null KD, Szymanski KA, Sudharshan L, Banovic J, Pasquale MK
Received 19 April 2017
Accepted for publication 27 June 2017
Published 10 October 2017 Volume 2017:9 Pages 629—639
DOI https://doi.org/10.2147/CEOR.S139939
Checked for plagiarism Yes
Review by Single anonymous peer review
Peer reviewer comments 2
Editor who approved publication: Prof. Dr. Dean Smith
Richard Sheer,1 Kyle D Null,2 Keith A Szymanski,2 Lavanya Sudharshan,1 Jennifer Banovic,2 Margaret K Pasquale1
1Comprehensive Health Insights, Inc., Louisville, KY, 2Takeda Pharmaceuticals U.S.A., Inc., Deerfield, IL, USA
Purpose: Clinical guidelines recommend febuxostat as first-line pharmacologic urate-lowering therapy for patients with gout to achieve a goal serum uric acid (sUA) <6 mg/dL; however, little is known about other contributing factors. This study identified clinical characteristics of patients treated with febuxostat to develop and validate a predictive model for achieving a goal sUA.
Patients and methods: Patients with Humana Medicare or commercial insurance, diagnosed with gout and newly initiated on febuxostat (index date February 1, 2009 – December 31, 2013), were identified for a retrospective cohort study. Patients were followed for 365 days and the first valid sUA test result ≥120 days after index was retained. A stepwise logistic regression with backward elimination was estimated to model sUA goal attainment, and a linear model was estimated to model the impact of predictor variables on sUA level.
Results: The study sample (n=678) was divided into a development (training) dataset (n=453) and a validation (holdout) dataset (n=225). In the training sample, patients in the sUA <6 mg/dL group were on febuxostat for a longer time, were more adherent, and had a lower average baseline sUA level (all p<0.0001) vs patients in the sUA ≥6 mg/dL group. In the logistic model, febuxostat adherence (odds ratio [OR]=1.03, p<0.0001) and baseline sUA level (OR=0.84, p<0.0001) increased the odds of attaining sUA <6 mg/dL. In the linear regression model, increase in febuxostat adherence (p<0.0001), baseline sUA level (p<0.0001), advanced age (p=0.0021), and not having congestive heart failure (p<0.05) were associated with a reduction of sUA level. Pre-index allopurinol use was a marginally significant predictor of sUA level reduction (p=0.06).
Conclusions: Among febuxostat users diagnosed with gout in a real-world setting, adherence to febuxostat and lower baseline sUA level were the strongest predictors of attaining sUA goal. These findings may help clinicians to identify appropriate patients most likely to benefit from febuxostat treatment, and underscore the importance of medication adherence in this challenging patient population.
Keywords: hyperuricemia, xanthine oxidase inhibitors, logistic regression, linear regression, urate, sUA
Introduction
Gout, a common rheumatic disease in the USA, has a self-reported prevalence of ~8.3 million individuals (National Health and Nutrition Examination Surveys, 2007–2008).1 Gout is caused by monosodium urate crystal deposition in synovial fluid and other tissues that occurs as a result of elevated serum urate concentrations. Half of US adults with gout have an indication for urate-lowering therapy (ULT), and two-thirds have a serum uric acid (sUA) level above target (≥6 mg/dL).2 Failure to achieve sUA target can lead to increased flare risk, tophaceous gout, and joint damage.3,4
Current clinical guidelines specified by the 2012 American College of Rheumatology suggest the use of xanthine oxidase inhibitor therapy with either allopurinol or febuxostat as first-line pharmacologic ULT for patients to achieve a minimum sUA goal <6 mg/dL. In individuals with greater disease severity and urate burden such as presence of tophi, a further reduction in sUA to <5 mg/dL may be needed to improve gout signs and symptoms.5 In some patient populations with gout, like those with chronic kidney disease, there is evidence to suggest that febuxostat may positively impact renal function.6,7 Additionally, febuxostat as first-line therapy was found to be less expensive compared to allopurinol for total cost of care.8 In another published study, older patients (age) and women (sex) were associated with a greater likelihood of reaching sUA goal, while patients with higher Charlson Comorbidity Index scores, blacks, and those with a low estimated glomerular filtration rate (GFR) had a reduced likelihood of attaining sUA goal.9 Hatoum et al in comparing real-world effectiveness between febuxostat and allopurinol found that patients initiating febuxostat had more comorbidities compared to those on allopurinol, including lower GFRs, more diabetes mellitus, and greater likelihood of having gouty tophi.9 Similar findings were reported by Kim et al, wherein patients receiving febuxostat had more comorbidities, greater health care utilization, and were prescribed a higher number of gout-related medications compared with patients receiving allopurinol or colchicine.10
Although published studies provide evidence of effectiveness of febuxostat in achieving sUA goal, further evidence is needed to determine the predictors of attaining sUA goal among users of febuxostat. A predictive model using real-world data may aid clinicians in identifying the appropriate patients likely to respond to febuxostat, and thereby improve the number of patients who achieve sUA <6 mg/dL. Therefore, the objective of this study was to identify clinical characteristics of patients treated with febuxostat to develop and validate a predictive model for achieving a goal sUA <6 mg/dL.
Materials and methods
Data source
The study sample was selected from a health and well-being company serving millions of people across the country through Medicare Advantage, stand-alone Prescription Drug Plan, and commercial plan offerings. This database contains integrated medical claims, pharmacy claims, laboratory claims, and enrollment data, representing over 20 million current and former people with Humana insurance. The database has national coverage with a high proportion of persons from Texas, Florida, and Ohio and is one of the largest Medicare Advantage claims databases in existence. For this study, Humana commercial and Medicare Advantage populations in a limited dataset were examined. The full study period was from February 1, 2008, through December 31, 2014. The final research protocol was approved by Schulman Institutional Review Board. The data were anonymized to protect subject privacy in compliance with Health Insurance Portability and Accountability Act regulations.
Study population
The study population consisted of persons in commercial and Medicare Advantage plans, aged 18–89 years, who initiated therapy on febuxostat between February 1, 2009, and December 31, 2013. The first febuxostat prescription was considered the index date. Eligible patients were required to have at least 12 months of continuous enrollment before (pre-index period) and after (post-index period) the index date, a gout diagnosis during the pre-index period or within 30 days after index, a valid baseline sUA test result on or before index, and a valid sUA test result at least 120 days after index. Patients with an allopurinol claim during the post-index period or at least one of the following during pre-index were excluded from study eligibility: Stage 5 chronic kidney disease, evidence of an organ transplant, a diagnosis or therapy for human immunodeficiency virus/acquired immune deficiency syndrome, use of pegloticase within 2 months prior to index, or a cancer diagnosis without any other gout medications at any time during the 24-month study period.
Among the eligible patients, the first valid sUA test result at least 120 days after the index date, but within 365 days post-index, was collected and used to determine whether patients attained a goal sUA <6 mg/dL. The study sample was then divided into two cohorts: those who achieved sUA goal and those who did not.
Study variables
Descriptive measures were reported for each cohort. These included demographic characteristics such as age at index date, gender, race (only available in the Medicare population), and geographic region. Baseline comorbidities, including chronic kidney disease, hypertension, type 2 diabetes, coronary artery disease, congestive heart failure, stroke, hyperlipidemia, and peripheral vascular disease, were captured over the 12-month pre-index period, as was the presence of gouty tophi, the number of gout flares, the Deyo–Charlson comorbidity index,11 and RxRisk-V composite risk score.12,13 Prescription-based measures were also collected during the pre-index period, including the use of thiazide diuretics, urate-lowering medications, symptomatic gout medications, and allopurinol. The baseline sUA level (defined as the most recent valid sUA test result on or prior to the index date) was also collected and included as a continuous variable. Additional measures associated with febuxostat use in the follow-up period were reported, including number of days on therapy, adherence (proportion of days covered [PDC] method), dose of the index febuxostat prescription, and patient out-of-pocket expenditures.
Statistical analysis
T-tests and nonparametric tests were used to compare continuous measures across the two cohorts, and chi-square tests were used for categorical measures. All measures with a p-value <0.2 or deemed to be clinically relevant were included in the initial models.
PDC was calculated using the following formula:
PDC = Total number of days for which febuxostat medication was available to the patient from index through date of first sUA test result/Days from index date through first sUA test result.
The minimum value for the denominator was 120, because only sUA test results at least 120 days after index were considered. The maximum value was 365. For patients with overlapping prescriptions (i.e., having a prescription filled before the days’ supply of the previous script ran out), the PDC method adjusts the start date of the new prescription to begin the day after the prior prescription’s days’ supply ended.
Predictive modeling
The study sample was divided using a 2:1 ratio into a training (development) dataset and a validation (holdout) dataset. Separate logistic and linear regression models were developed using the training dataset. The logistic model was developed to predict the probability of attaining sUA goal; the linear model was designed to examine the impact the predictor variables would have on the sUA level itself. The dependent variable in both instances was the sUA value associated with the first valid sUA test result at least 120 days after the index date. Seventeen input variables were considered for the initial models: age, gender, and race; presence of coronary artery disease, stroke, hyperlipidemia, peripheral vascular disease, congestive heart failure, chronic kidney disease, hypertension, and type 2 diabetes; baseline sUA, days on febuxostat therapy, febuxostat PDC, index dose of febuxostat, use of allopurinol in the pre-index period, and the RxRisk-V comorbidity score.
The logistic model employed multivariable stepwise logistic regression with backward elimination. A p-value of <0.2 was required for each variable for retention in the model. For each variable in the final logistic model, parameter estimates (PE), odds ratios (ORs), 95% CIs, and p-values were reported. Additionally, the area under the curve, concordance statistics (c-statistics), and Hosmer–Lemeshow goodness-of-fit statistics were reported. The linear model used a similar multivariable stepwise approach, also with a p-value of <0.2 for retention in the model. PE, 95% CIs, and p-values were presented for each variable in the final linear model. The R-square and F-values were reported as well. The logistic and linear final models were both run on the validation dataset, with similar performance and fit statistics being reported. Receiver operator characteristic (ROC) curves were generated for the logistic model. Additional tests for model robustness were employed by limiting the pre-index data capture period from 365 to 180 days, and then rerunning the final models to check for stability among PE.
Results
Attrition and baseline characteristics
A total of 678 eligible patients met all inclusion criteria and were identified for the study sample (Table 1). Among these patients, 356 met the sUA goal <6 mg/dL, while 322 had an sUA ≥6 mg/dL. Demographics, baseline clinical measures, and febuxostat therapy statistics were reported for each of these two cohorts in Table 2. The mean age was comparable between the groups who achieved vs. did not achieve sUA goal (68.8 vs. 67.9 years, p=0.30), as was the percentage of female patients (36.5% vs. 38.5%, p=0.59) and patients residing in the South (81% for both, p=0.97). The distribution of race was marginally different between the two groups (64% vs. 57% white; p=0.055). The Deyo–Charlson comorbidity index (2.3 vs. 2.4, p=0.72) and RxRisk-V score (7.8 vs. 8.0, p=0.36) were comparable between the two groups.
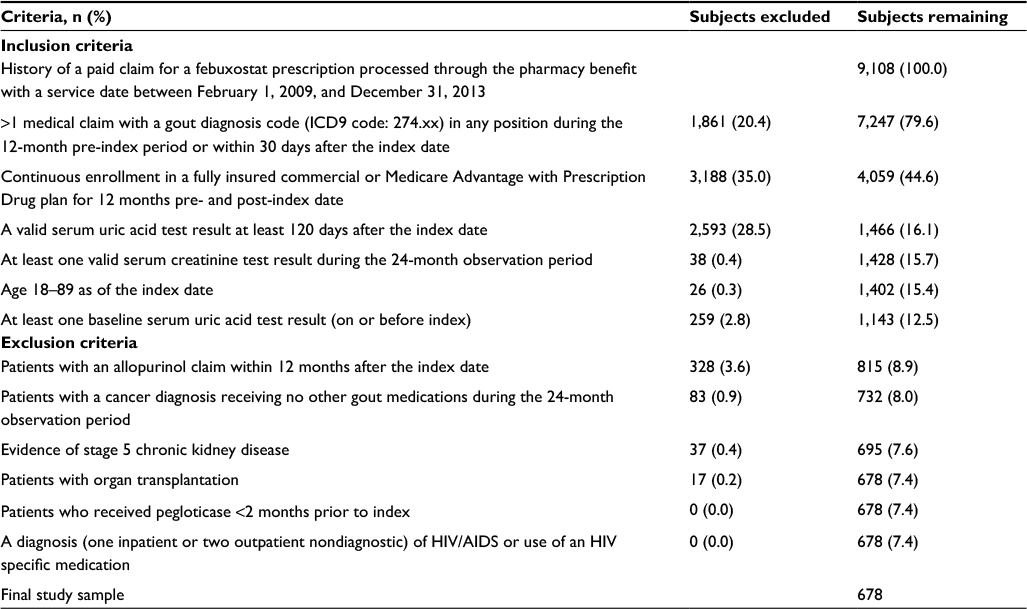 | Table 1 Attrition table for study cohort Abbreviations: AIDS, acquired immune deficiency syndrome; HIV, human immunodeficiency virus. |
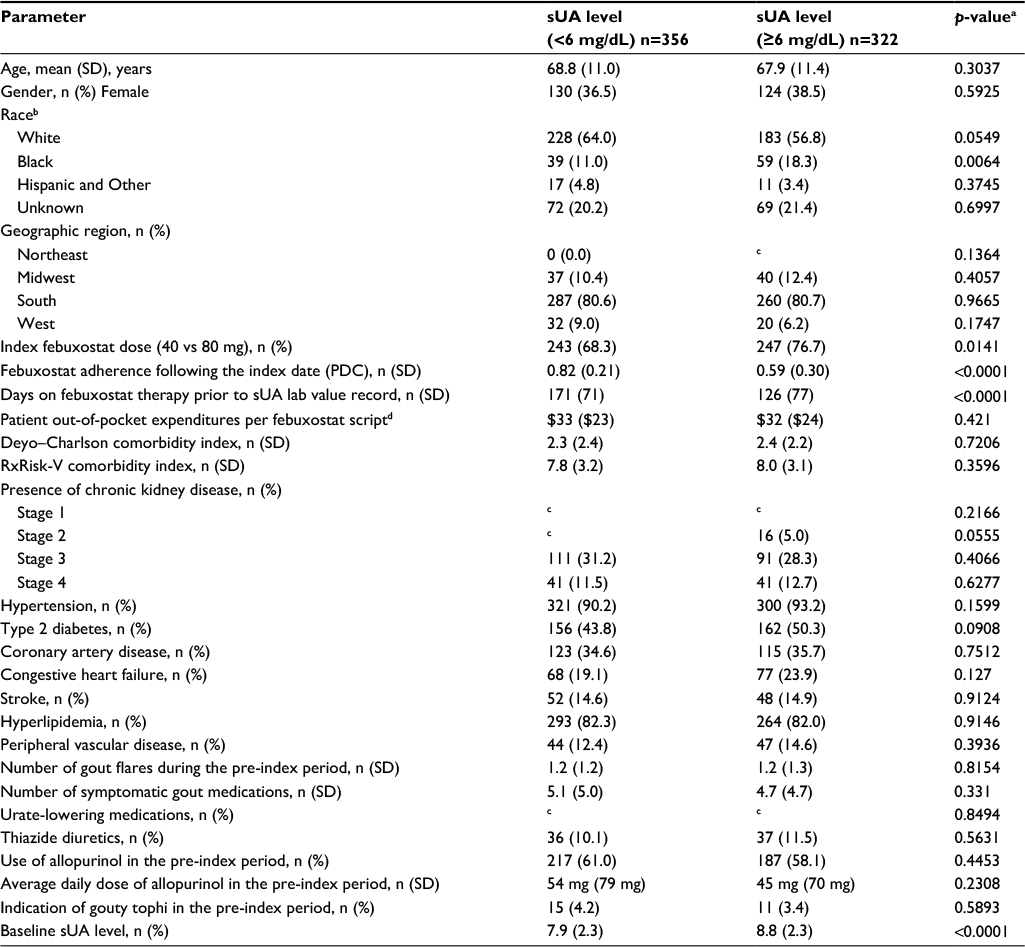 | Table 2 Group means and counts for model variables by sUA goal attainment Notes: aBased on either a t-test or nonparametric test for continuous measures and a chi-square test for categorical measures. bRace is available only for the Medicare population. cSuppressed because cell count <10 in accordance with Health Insurance Portability and Accountability Act privacy rules. dScripts converted to 30-day equivalents, for example, a 90-day febuxostat script was counted as three scripts. $= US dollars (USD). Abbreviations: PDC, proportion of days covered; sUA, serum uric acid. |
Measures that were different between those who met and those who did not meet sUA goal included adherence to febuxostat therapy (PDC of 0.82 vs. 0.59; p<0.01), total days on febuxostat therapy (171 vs. 126, p<0.01), baseline sUA level (7.9 vs. 8.8 mg/dL, p<0.01), and index febuxostat dose of 40 mg (68% vs. 77%, p=0.01). Also notable was the number of patients with type 2 diabetes (44% vs. 50%, p=0.09). Two additional variables (hypertension, p=0.16 and congestive heart failure, p=0.13) had a p-value <0.2 (Table 2). Ten additional measures were considered for the models based on general relevance to attaining sUA goal: age, gender, race, RxRisk-V score; presence of coronary artery disease, chronic kidney disease, stroke, hyperlipidemia, and peripheral vascular disease; and the use of allopurinol in the pre-index period.
Baseline demographics and clinical characteristics for the training and validation samples are included in Tables S1 and S2. Using the training sample (n=453), a logistic regression model was developed (Table 3). Among the 17 variables included in the initial model, three were retained in the final model: febuxostat PDC (OR=1.03, 95% CI 1.02–1.04, p<0.01), baseline sUA level (OR=0.84, 95% CI 0.77–0.91, p<0.01), and allopurinol use pre-index (OR=0.72, 95% CI 0.48–1.10, p=0.13). A robustness test was implemented by rerunning the final model on the training dataset, but using only 180 days of data capture instead of the full 365 days prior to the index date. The 180-day model estimates were comparable to the 365-day base model. Febuxostat PDC (OR=1.03, 95% CI 1.02–1.04, p<0.01) and baseline sUA level (OR=0.83, 95% CI 0.75–0.91, p<0.01) were nearly identical; allopurinol use had a stronger negative association with achieving sUA goal (OR=0.58, 95% CI 0.38–0.90, p=0.02).
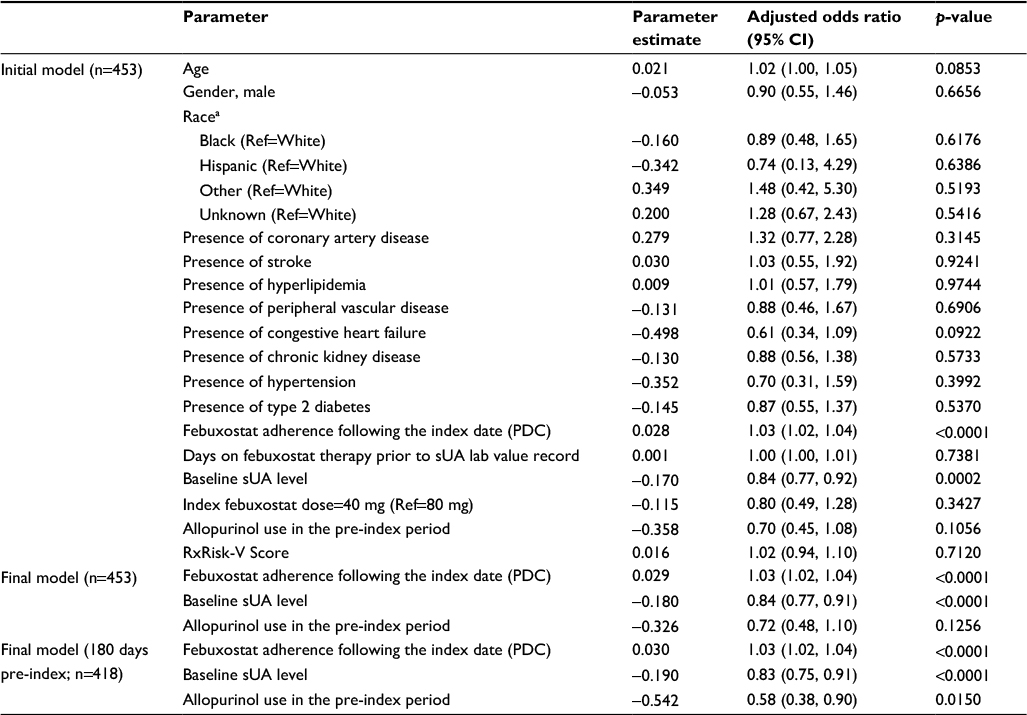 | Table 3 Parameter estimates for multivariate model of sUA goal attainment (logistic model) in the training sample Note: aRace is available only for the Medicare population. Abbreviations: PDC, proportion of days covered; sUA, serum uric acid. |
The linear regression model was run on the training sample using the same 17 input variables as the logistic model; five were retained in the final model. These included febuxostat PDC (PE=−0.040, 95% CI −0.046 to −0.033, p<0.01), baseline sUA level (PE=0.184, 95% CI 0.111–0.257, p<0.01), age (PE=−0.025, 95% CI −0.041 to −0.009, p<0.01), presence of congestive heart failure (PE=0.512, 95% CI 0.090 to 0.935, p=0.02), and allopurinol use in the pre-index period (PE=0.253, 95% CI −0.102 to 0.609, p=0.16). A similar robustness test using data collected over a 180-day pre-index period was employed for the linear model, and the PE were similar to the 365-day base model. Febuxostat PDC and baseline sUA level remained the strongest predictors (p<0.01 for both). An increase of one percentage point in febuxostat PDC was associated with a decrease in sUA level by 0.04 units. Age (p<0.01) and congestive heart failure (p=0.04) were also statistically significant, and pre-index allopurinol use (p=0.06) was marginally significant (Table 4).
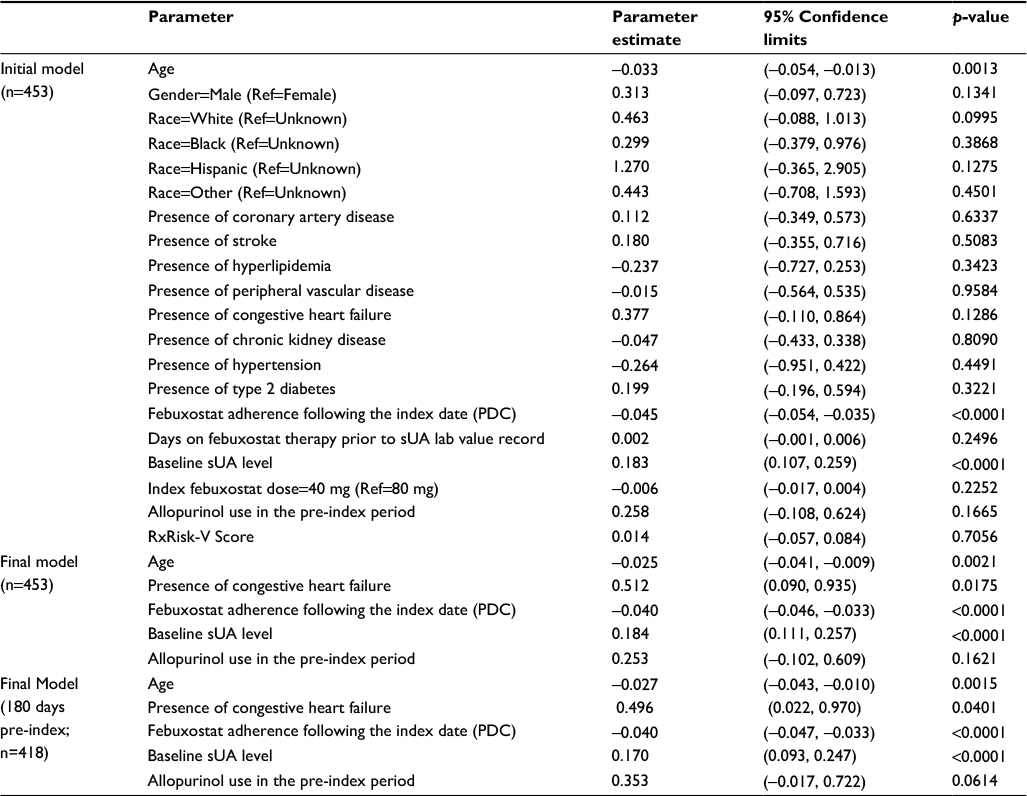 | Table 4 Parameter estimates for multivariate linear model of sUA in the training sample Note: Race is available only for the Medicare population. Abbreviations: PDC, proportion of days covered; sUA, serum uric acid. |
Performance and fit were assessed for both the logistic and linear models. The logistic model developed on the training dataset had a c-statistic of 0.73 and a goodness-of-fit statistic of 2.92 (p=0.94). This model was then validated in the holdout sample (n=225) and achieved similar performance metrics (c-statistic=0.78; goodness of fit=3.82, p=0.87). The final linear model had an R-square of 0.31 (adjusted R-square of 0.30) and an F-statistic of 40.3 (p<0.01); when run on the validation sample, the model had similar performance, with an R-square of 0.33 (adjusted R-square of 0.32) and an F-statistic of 103.4 (p<0.01) (Table 5). For the logistic model, ROC curves were generated for both the training and validation datasets, with both indicating strong model performance (Figure 1).
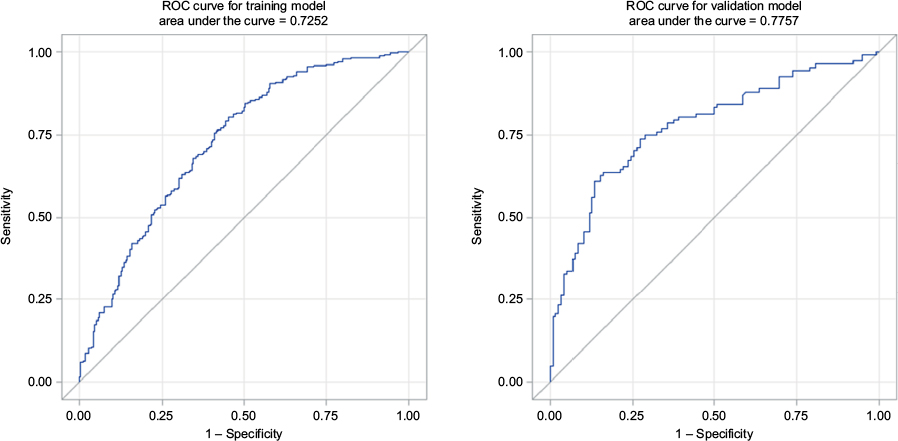 | Figure 1 ROC curves for the logistic model: training and validation samples. Abbreviation: ROC, receiver operator characteristic. |
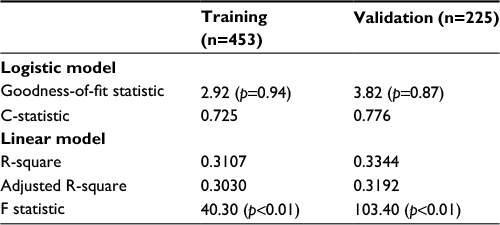 | Table 5 Performance measures for predicting sUA goal attainment Abbreviation: sUA, serum uric acid. |
Discussion
This study highlights the predictors associated with attaining sUA goal (<6 mg/dL) among febuxostat users diagnosed with gout in a real-world setting. The main predictors of attaining sUA goal <6 mg/dL were febuxostat adherence (positive association), baseline sUA level (negative association), and prior allopurinol use (negative association), estimated by both logistic and linear regression models. Age (positive association) and presence of congestive heart failure (negative association) were found to be significant predictors in the linear model.
The overall results of this study are consistent with findings from prior claims-based analyses. These prior studies helped to inform the variables to be included as model inputs for this study. Kim et al in a population-based cohort study described clinical characteristics and health care utilization of patients with gout before and after initiating allopurinol, febuxostat, or colchicine. Among patients who had a baseline sUA >6.8 mg/dL, the mean (±SD) change in uric acid levels was −2.6 (±2.3) mg/dL in febuxostat initiators. Moreover, 56% of febuxostat users achieved the target sUA level.10 A similar trend was seen in a study by Hatoum et al; at the 2-year follow-up post-initiation of ULT, 58.2% of febuxostat users reached the target sUA goal (<6 mg/dL).9 The most recent study confirming these findings, Singh et al, reported that 56.9% of febuxostat users attained the <6 mg/dL goal and 35.5% attained the <5 mg/dL goal.14
Among allopurinol users, male gender has been associated with decreased compliance and increasing age has been associated with increased compliance.15 Older patients and women9,16 were more likely to reach target sUA goal, and patients with higher baseline sUA were less likely to reach goal in other studies.9 Similarly, the linear regression model in this study showed evidence that in patients using febuxostat, increased age was associated with a decrease in sUA level, even when controlling for PDC. Patients using febuxostat in this study population had multiple comorbidities (see DCI and RxRisk-V scores in Table 2) with hypertension, hyperlipidemia, and type 2 diabetes being the most prevalent. A similar patient profile was seen in the Kim et al study, where users of febuxostat had more comorbidities (cardiovascular disease, heart failure, and chronic kidney disease) than allopurinol or colchicine initiators.10 Hatoum et al observed that febuxostat was prescribed for the more severe patients compared to allopurinol users, with a higher proportion of patients treated with febuxostat reporting baseline sUA >9 mg/dL compared to patients treated with allopurinol. Moreover, patients treated with allopurinol who switched to febuxostat after failing to reach goal were more likely to reach goal on febuxostat than those who were maintained on allopurinol.9,16 In our study, patients treated with allopurinol in the pre-index period fared worse than those without prior allopurinol use, which may be indicative of treatment resistance or disease severity for patients previously treated with allopurinol. Further research will be needed, comparing these patients to other patients treated with allopurinol, to determine whether failing allopurinol is an indicator of being difficult to treat long-term.
Febuxostat adherence was found to be a significant predictor in attaining sUA goal in both the logistic and linear regression models. Adherence to febuxostat showed a positive relationship with uric acid levels in patients who attained sUA goal <6 mg/dL as well as the more stringent goal sUA <5 mg/dL. Although low compliance with allopurinol has been reported (average noncompliance of 44% of their treatment period),15,17,18 the effect of compliance on attaining sUA goal has not been studied among these patients,19 restricting comparisons with febuxostat users.
These study findings may help clinicians identify appropriate patients who are most likely to benefit from treatment with febuxostat, taking into account the predictors to help patients achieve target sUA level. This is not to say that individuals with higher baseline sUA, allopurinol-refractory hyperuricemia, and congestive heart failure would not benefit from febuxostat use. To the contrary, these cases would likely benefit even though they may not compare as favorably to the general population because they are more difficult to treat. Similarly, confounding may have the consequence that older patients would benefit more than younger patients. Although not evaluated in the current study, these findings warrant further research.
In this study, several clinical variables were examined and febuxostat adherence was a significant predictor of reaching sUA goal. Recognizing that less than half of patients with gout are adherent to therapy in a real-world setting,20 this study underscores the importance of medication adherence in this patient population. Also, within this patient population there are high percentages of chronic comorbidities. Further studies are, therefore, needed in specific patient populations such as chronic kidney disease or diabetes to better understand the impact of comorbidities in achieving sUA goals.6,21
Limitations common to studies using administrative claims data apply to this study. These include lack of certain information in the database (e.g., socioeconomic factors and health behavior information) and errors and omissions in claims coding. Generalizing the study findings to the US population should be approached with caution. Even though study subjects were selected from the membership of a national health plan, the geographic distribution is unbalanced, with the largest number of persons in the Southern region, fewer in the Midwest region, and a much smaller number in the West and Northeast. Presence of multiple comorbidities in the study population indicates other factors that might have influenced treatment decisions. Exposure to febuxostat was determined by the presence of a prescription claim; this does not necessarily mean that the drug was taken. This is an inherent limitation in measuring adherence using claims data. While sUA was measured as a continuous variable, a logistic model was developed using sUA goal attainment as a binary outcome. Logistic regression was chosen to allow for simpler interpretation of the results for clinicians. The linear model was also developed with sUA as a continuous variable to confirm results from the logistic model.
Conclusion
This study found that among febuxostat users diagnosed with gout in a real-world setting, adherence to febuxostat and lower baseline sUA level were the strongest predictors of attaining sUA goal. These findings may help clinicians identify appropriate patients most likely to benefit from febuxostat treatment and underscore the importance of medication adherence in this challenging patient population.
Acknowledgments
Debra F Lawrence contributed to the final review of the manuscript and provided general oversight for the project. The project was funded by Takeda Pharmaceuticals U.S.A., Inc. This project was presented at the Society of General and Internal Medicine’s Annual Meeting, May 11–14, 2016, in Hollywood, FL.
Author contributions
KDN, RS, LS, and KAS contributed to the study design and methodology. RS conducted the data analysis. All co-authors contributed to the interpretation of findings as well as manuscript review. KDN, RS, LS, and MKP contributed to the drafting of the manuscript, and JB, RS, LS, and MKP to the revisions. All authors contributed toward data analysis, drafting and revising the paper and agree to be accountable for all aspects of the work.
Disclosure
R Sheer, L Sudharshan, and MK Pasquale are employees of Comprehensive Health Insights, Inc. (CHI). CHI was paid by Takeda Pharmaceuticals U.S.A., Inc. to conduct the study. KD Null is an employee of Takeda and was an employee of CHI at the time of the study. KA Szymanski was an employee of Takeda at the time of the study. J Banovic is an employee of Takeda.
References
Zhu Y, Pandya BJ, Choi HK. Prevalence of gout and hyperuricemia in the US general population: the National Health and Nutrition Examination Survey 2007–2008. Arthritis Rheum. 2011;63(10):3136–3141. | ||
Juraschek SP, Kovell LC, Miller ER 3rd, Gelber AC. Gout, urate-lowering therapy, and uric acid levels among adults in the United States. Arthritis Care Res (Hoboken). 2015;67(4):588–592. | ||
Sarawate CA, Patel PA, Schumacher HR, Yang W, Brewer KK, Bakst AW. Serum urate levels and gout flares: analysis from managed care data. J Clin Rheumatol. 2006;12(2):61–65. | ||
Perez-Ruiz F. Treating to target: a strategy to cure gout. Rheumatology (Oxford). 2009;48(Suppl 2):ii9–ii14. | ||
Khanna D, Fitzgerald JD, Khanna PP, et al. American College of Rheumatology guidelines for management of gout. Part 1: systematic nonpharmacologic and pharmacologic therapeutic approaches to hyperuricemia. Arthritis Care Res (Hoboken). 2012;64(10):1431–1446. | ||
Tsuruta Y, Mochizuki T, Moriyama T, et al. Switching from allopurinol to febuxostat for the treatment of hyperuricemia and renal function in patients with chronic kidney disease. Clin Rheumatol. 2014;33(11):1643–1648. | ||
Whelton A, MacDonald PA, Chefo S, Gunawardhana L. Preservation of renal function during gout treatment with febuxostat: a quantitative study. Postgrad Med. 2013;125(1):106–114. | ||
Mitri G, Wittbrodt ET, Turpin RS, Tidwell BA, Schulman KL. Cost comparison of urate-lowering therapies in patients with gout and moderate-to-severe chronic kidney disease. J Manag Care Spec Pharm. 2016;22(4):326–336. | ||
Hatoum H, Khanna D, Lin SJ, Akhras KS, Shiozawa A, Khanna P. Achieving serum urate goal: a comparative effectiveness study between allopurinol and febuxostat. Postgrad Med. 2014;126(2):65–75. | ||
Kim SC, Schmidt BM, Franklin JM, Liu J, Solomon DH, Schneeweiss S. Clinical and health care use characteristics of patients newly starting allopurinol, febuxostat, and colchicine for the treatment of gout. Arthritis Care Res (Hoboken). 2013;65(12):2008–2014. | ||
Deyo RA, Cherkin DC, Ciol MA. Adapting a clinical comorbidity index for use with ICD-9 CM administrative databases. J Clin Epidemiol. 1992;45(6):613–619. | ||
Farley JF, Harley C, Devine JW. A comparison of comorbidity measurements to predict healthcare expenditures. Am J Manag Care. 2006(12):110–117. | ||
Sloan KL, Sales AE, Liu CF, et al. Construction and characteristics of the RxRisk-V: a VA-adapted pharmacy-based case-mix instrument. Med Care. 2003;41(6):761–774. | ||
Singh JA, Akhras KS, Shiozawa A. Comparative effectiveness of urate lowering with febuxostat vs. allopurinol in gout: analyses from large U.S. managed care cohort. Arthritis Res Ther. 2015;17(1):120. | ||
Riedel AA, Nelson M, Joseph-Ridge N, Wallace K, MacDonald P, Becker M. Compliance with allopurinol therapy among managed care enrollees with gout: a retrospective analysis of administrative claims. J Rheumatol. 2004;31(8):1575–1581. | ||
Altan A, Shiozawa A, Bancroft T, Singh JA. A real-world study of switching from allopurinol to febuxostat in a health plan database. J Clin Rheumatol. 2015;21(8):411–418. | ||
Sarawate CA, Brewer KK, Yang W, et al. Gout medication treatment patterns and adherence to standards of care from a managed care perspective. Mayo Clin Proc. 2006;81(7):925–934. | ||
Harrold LR, Andrade SE, Briesacher BA, et al. Adherence with urate-lowering therapies for the treatment of gout. Arthritis Res Ther. 2009;11(2):R46. | ||
McGowan B, Bennett K, Silke C, Whelan B. Adherence and persistence to urate-lowering therapies in the Irish setting. Clin Rheumatol. 2016;35(3):715–721. | ||
De Vera MA, Marcotte G, Rai S, Galo JS, Bhole V. Medication adherence in gout: a systematic review. Arthritis Care Res (Hoboken). 2014;66(10):1551–1559. | ||
Becker MA, MacDonald PA, Hunt BJ, Jackson RL. Diabetes and gout: efficacy and safety of febuxostat and allopurinol. Diabetes Obes Metab. 2013;15(11):1049–1055. |
Supplementary materials
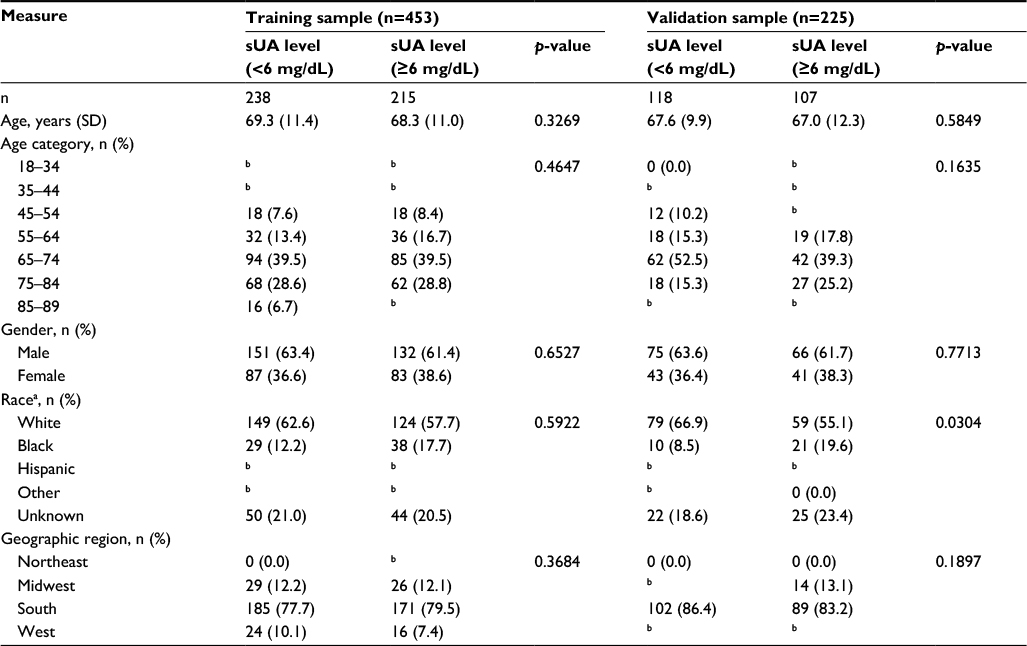 | Table S1 Baseline demographics for training and validation samples Notes: aRace is available only for the Medicare population. bSuppressed because cell count <10 in accordance with Health Insurance Portability and Accountability Act privacy rules. Abbreviation: sUA, serum uric acid. |
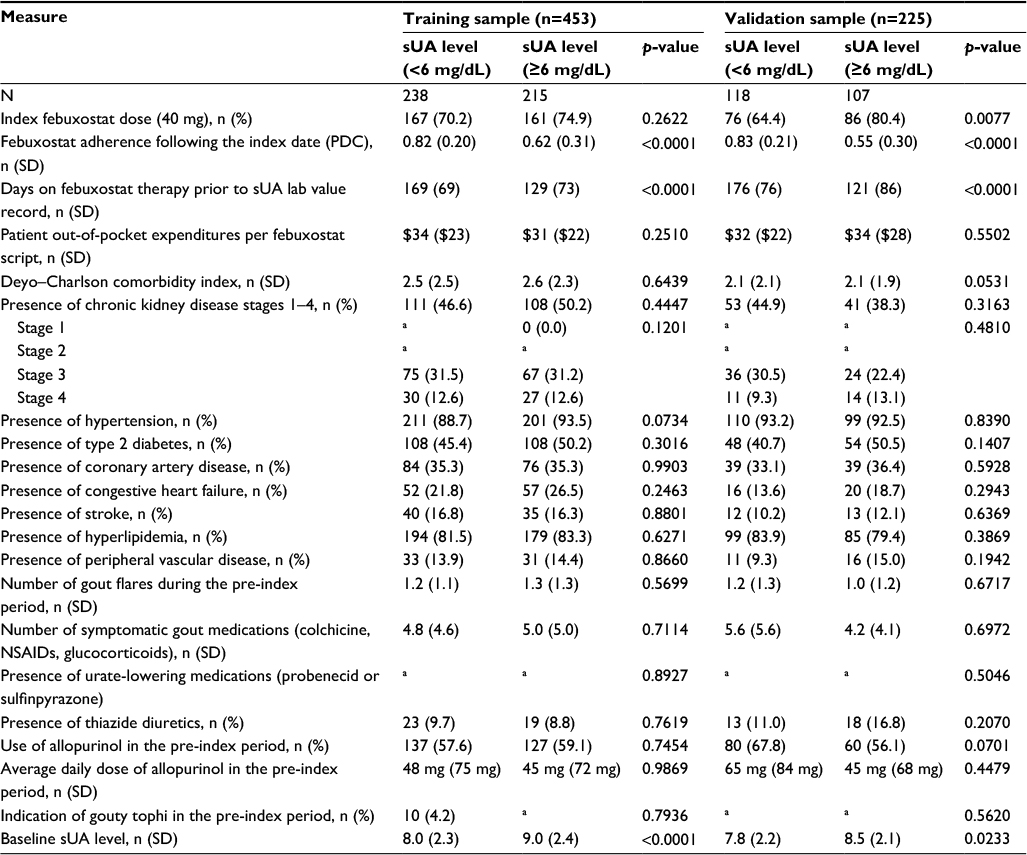 | Table S2 Baseline clinical characteristics for training and validation samples Notes: aSuppressed because cell count <10 in accordance with Health Insurance Portability and Accountability Act privacy rules. $= US dollars (USD). Abbreviations: NSAIDs, nonsteroidal anti-inflammatory drugs; PDC, proportion of days covered; sUA, serum uric acid. |
 © 2017 The Author(s). This work is published and licensed by Dove Medical Press Limited. The full terms of this license are available at https://www.dovepress.com/terms.php and incorporate the Creative Commons Attribution - Non Commercial (unported, v3.0) License.
By accessing the work you hereby accept the Terms. Non-commercial uses of the work are permitted without any further permission from Dove Medical Press Limited, provided the work is properly attributed. For permission for commercial use of this work, please see paragraphs 4.2 and 5 of our Terms.
© 2017 The Author(s). This work is published and licensed by Dove Medical Press Limited. The full terms of this license are available at https://www.dovepress.com/terms.php and incorporate the Creative Commons Attribution - Non Commercial (unported, v3.0) License.
By accessing the work you hereby accept the Terms. Non-commercial uses of the work are permitted without any further permission from Dove Medical Press Limited, provided the work is properly attributed. For permission for commercial use of this work, please see paragraphs 4.2 and 5 of our Terms.