")
Back to Journals » Cancer Management and Research » Volume 11
Predictors of health care use in Australian cancer patients
Authors Rana RH , Alam K , Gow J, Ralph N
Received 13 March 2019
Accepted for publication 7 June 2019
Published 24 July 2019 Volume 2019:11 Pages 6941—6957
DOI https://doi.org/10.2147/CMAR.S193615
Checked for plagiarism Yes
Review by Single anonymous peer review
Peer reviewer comments 2
Editor who approved publication: Professor Harikrishna Nakshatri
Rezwanul Hasan Rana,1,2 Khorshed Alam,1,2 Jeff Gow,1,3 Nicholas Ralph4–6
1School of Commerce, University of Southern Queensland, Toowoomba, Australia; 2Centre for Health, Informatics and Economic Research, University of Southern Queensland, Queensland, Australia; 3School of Accounting, Economics and Finance, University of Kwazulu-Natal, Durban, South Africa; 4Health Systems & Psycho-Oncology, Cancer Council Queensland, Queensland, Australia; 5School of Nursing, University of Southern Queensland, Queensland, Australia; 6St Vincent’s Private Hospital, Queensland, Australia
Objective: The purpose of this study is to measure health care utilization in Australian cancer patients based on their demographic, geographic and socioeconomic backgrounds.
Method: A total of 13,609 participants (aged 15 and over) from 7,230 households were interviewed as part of Wave 13 of the national Household, Income and Labour Dynamics in Australia (HILDA) survey. Five hundred and seventeen participants indicated a current cancer diagnosis with 90% of those receiving active treatment at the time of interview. Independent sample t-tests, Pearson Chi-sq tests, Kruskal‒Wallis H test, binary logistic regression and a zero-inflated Poisson regression were used to examine inequality in health care use.
Results: Demographic and sociocultural factors such as advancing age, gender, low income, low education status, rurality, no private health insurance, increased psychological distress and less access to specialist care are associated with lower health care utilization among cancer patients. However, models of care such as general practitioner-led cancer care is preferable in younger individuals with cancer, while accessing specialist care is associated with lower rates of hospitalization and higher levels of psychological distress increases hospital length of stay.
Conclusions: The findings of lower health care utilization by those cancer patients with characteristics of disadvantage have implications for policy development and intervention design. Broadly, policies targeting structural social inequities are likely to increase health care utilization among the most affected/disadvantaged populations. Further investigation is needed to identify potential links between health care utilization and cancer outcomes as a step toward targeted interventions for improving outcomes in the adversely affected groups.
Keywords: cancer, health care utilization, primary preventive care, inequality, psychological distress, HILDA
Introduction
In 2018, there were approximately 18.1 million new diagnoses of cancer and the disease was responsible for an estimated 9.6 million deaths globally.1 For Australia, the incidence of new cancer cases has more than doubled since 1982 with an estimated 50,000 cancer-related deaths in 2017.2 Although overall cancer survival rates have improved by 20% from 1984 to 2013 in Australia, 13% of premature cancer deaths were related to socioeconomic disparities between 2004 and 2008.3,4 Cancer is now a leading cause of illness and death in Australia, with 1 in 3 Australians dying from the disease.3
With the incidence of cancer increasing, so too is cancer-related health care utilization which is defined as “an individual’s use of health care to prevent and/or cure health conditions, promote and sustain good health, and get professional information about one’s health status and/or prognosis”.5 Health care utilization among cancer patients in Australia is extensive with approximately 10% of all hospitalizations being cancer-related with an average length of stay of 7.8 days in 2014–2015.3 Cancer-related hospital bed days have also increased between 70% and 80% over the period from 1998 to 2011.6 For palliative cancer care, health care utilization and costs also factor with increased presentations to emergency, admission to hospital and intensive care admission in the last 30 days of life.7 Moreover, the cost of health care utilization often extends beyond direct costs to the system and onto individuals, even despite Australia’s universal health care coverage. Financial distress is increasingly a factor for individuals living with cancer in Australia with moderate to extreme financial burden caused by out-of-pocket expenditure reported in over one-third (34%) of patients in a 2016 study.8 This issue has gained considerable political attention in the 2019 Australian Federal election campaign with the opposition promising a $A2.4 billion package to address excessive out-of-pocket expenses for those with cancer.
In this context, the economic impact of cancer is considerable9 with the cost of cancer care estimated to increase significantly to $7.8 billion by 2022–2023 in Australia.10 Despite funding allocations growing alongside the demand for health care, resourcing cancer care is complex as cancer incidence and outcomes can vary based on socioeconomic factors such as age, place of residence and income status.3,11,12 Worldwide, health care utilization in cancer patients has been predicted by demographic factors such as rurality,4,6,13 cancer type14–16 and socioeconomic status.17,18 However, the burden of cancer often falls most heavily on disadvantaged populations with a 2016 study concluding that 13% of premature cancer deaths were related to socioeconomic disparities in the period from 2004 to 2008.4
Resourcing health care utilization in the context of substantial variations in health care utilization and cancer outcomes are therefore dependent on identifying and responding to a range of cancer-related demographic and socioeconomic factors as well as health service availability.19 As more people are diagnosed with cancer in Australia and as treatment costs increase,10 understanding the care-seeking behavior of cancer patients is necessary to develop in-context solutions for efficient policy-level change and service-level interventions.16,20 Henceforth, local data is necessary to identify the predictors of health care utilization. The aim of this study is to address this gap and answer the question: “what are the demographic, health-related and socioeconomic factors associated with health care utilization of Australian cancer patients?”
Materials and methods
Data source and study sample
A total of 13,609 (aged 15 and over) participants from 7,230 households were interviewed as part of Wave 13 (year, 2013) of the Household, Income and Labour Dynamics in Australia (HILDA) annual survey.21 This nationally representative longitudinal survey is conducted each year since 2001 by the “Melbourne Institute of Applied Economic and Social Research” and accessible via the “Australian Data Archive”.22 Data are available for approved users from the Department of Social Services, Government of Australia. The survey was carried out in accordance with the ethical guidelines approved by the University of Melbourne.23 Henceforth, additional ethical approvals were not required for the current study.
Affected households were identified by a specific survey question that asked whether anyone within a family was diagnosed with any type of cancer. A total of 7,859 respondents replied to the question and with the remainder being missing values due to nonresponse to the question. Five hundred and seventeen persons answered in the affirmative and 7,342 persons responded negatively. Approximately 6.6% (517 out of 7,859) of HILDA participants in Wave 13 were diagnosed with cancer with the majority (90%) of those currently undergoing cancer treatment.
Outcome variables
Health care utilization was measured using the following variables:
- the number of doctor visits (family doctor or general practitioner [GP from hereon]),
- the number of hospital admissions (overnight stay),
- the number of nights at the hospital (total nights’ stay or hospital length of stay),
- hospital doctor visits (outpatient or casualty; yes or no),
- specialist doctor visits (excluding hospital outpatients or casualty; yes or no),
- visits to a mental health professional (during the last 12 months; yes or no).
These individual-level data were collected from each participant. In the regression model, the outcome variable, namely, doctor visits, is denoted by a value of 1 if the patients visited doctors 10 times or more and 0 otherwise (0‒9 visits) and for hospital admission, a value of 0 means no hospital admissions and 1 otherwise (visited at least once).
Independent variables
Annual household disposable income (four quartiles) was used as the primary predictor variable in the regression analysis. Households in quartile 1 have incomes of $54,028 or less, quartile 2 between $54,029 to $85,929, quartile 3 between $85,930 to $124,425 and quartile 4 income was more than $124,425. Several other variables were used as explanatory variables. A dummy variable was generated for education level (1= Education level ≤ high school, and 0 otherwise). The survey contained questions on body mass index (BMI) level (<18.5=1, 18.5–24.9=2, 25–29.9=3, ≥30=4), level of psychological distress (depressed) level (1= most times, 2= sometimes, 3= a little, 4= never), Kessler psychological distress scale (K10) risk categories (1= low, 2= moderate, 3= high, 4= very high), private health insurance status and government health care card (yes=1 and 0 otherwise) and area of residence (urban,1 and 0 otherwise). Urban and rural areas were defined based on the Australian geographical classification,24 whereby urban means people living in areas classified as major urban and other urban and rural included localities outside the major urban centers. Another dummy variable was used to assess whether the respondents were born in Australia (=1) or otherwise (=0). Other individual characteristics entered into the regression analysis as control variables were gender (male, 1, female,0), marital status (married, 1, 0 otherwise), age (1= age 19–44, 2= age 45–65, 3= age ≥65), smoking frequency (1= non-smoker, 2= occasional, 3= regular), physical activity (1= less than once, 2=1–3 times, 3= more than 3 times) per week and self-assessed health (1= excellent, 2= very good, 3= good, 4= fair, 5= poor). Financial distress was measured with the respondent’s answer to the question “major worsening of finances” (eg, went bankrupt) in the past twelve months (1=yes and 0= no). Lastly, a dummy variable for the presence of any long-term health condition (impairment or disability to perform everyday activities) was created. A cross-tabulation analysis indicated that this variable (dummy variable of 1= yes, and 0 otherwise) is highly correlated with health care utilization of households. Explanatory variables selected for inclusion were adapted from the literature.25–27
Statistical analysis
To determine the factors influencing health care use, this paper applied an explanatory model building approach to implement a multivariate binary logistic and a zero-inflated Poisson regression. Initially, independent sample T-tests and Pearson Chi-square tests were conducted to examine the mean difference in health care utilization of cancer patients based on their demographic and socioeconomic characteristics. The types of tests employed varied based on the characteristics of the response variable. In addition, the Kruskal–Wallis H test (one-way ANOVA on ranks) was used for independent variables with more than two independent groups (income, age and psychological distress level). For the principal outcome variables (number of doctor visits and nights at the hospital), two-part regression models were applied,26,28,29 which can account for a large number of zero values.28 The first part of the analysis included a binary logit regression model (multivariate) to estimate the probability of health care use of participants with cancer. Logistic regression is a well-recognized analysis tool and is regularly used for binary response data in a variety of applications including health care.30,31 In the second part, the zero-inflated Poisson model (multivariate) was used to account for count data that has a large number of zero counts in key dependent variables. The possible values of the variables, number of doctor visits and hospital admissions include non-negative integers such as 0, 1, 2, 3 and so on. For this test, regression coefficients are estimated with the maximum likelihood method. The detailed methodology of the zero-inflated Poisson model is available in several studies.32–34 Both of these regression equations included several covariates. SPSS statistical software (Version 23.0; IBM Corp, Armonk, NY) and Stata software (Version 14.0) were used to perform all statistical analysis.
Results
Participant demographics
The descriptive analysis illustrates the demographic and socioeconomic characteristics of the two groups. The sample of respondents with cancer (N=517) were further divided based on gender, country of birth, age, education level, area of residence, level of psychological distress, self-assessed health, doctor visits and health check-ups (Table 1).
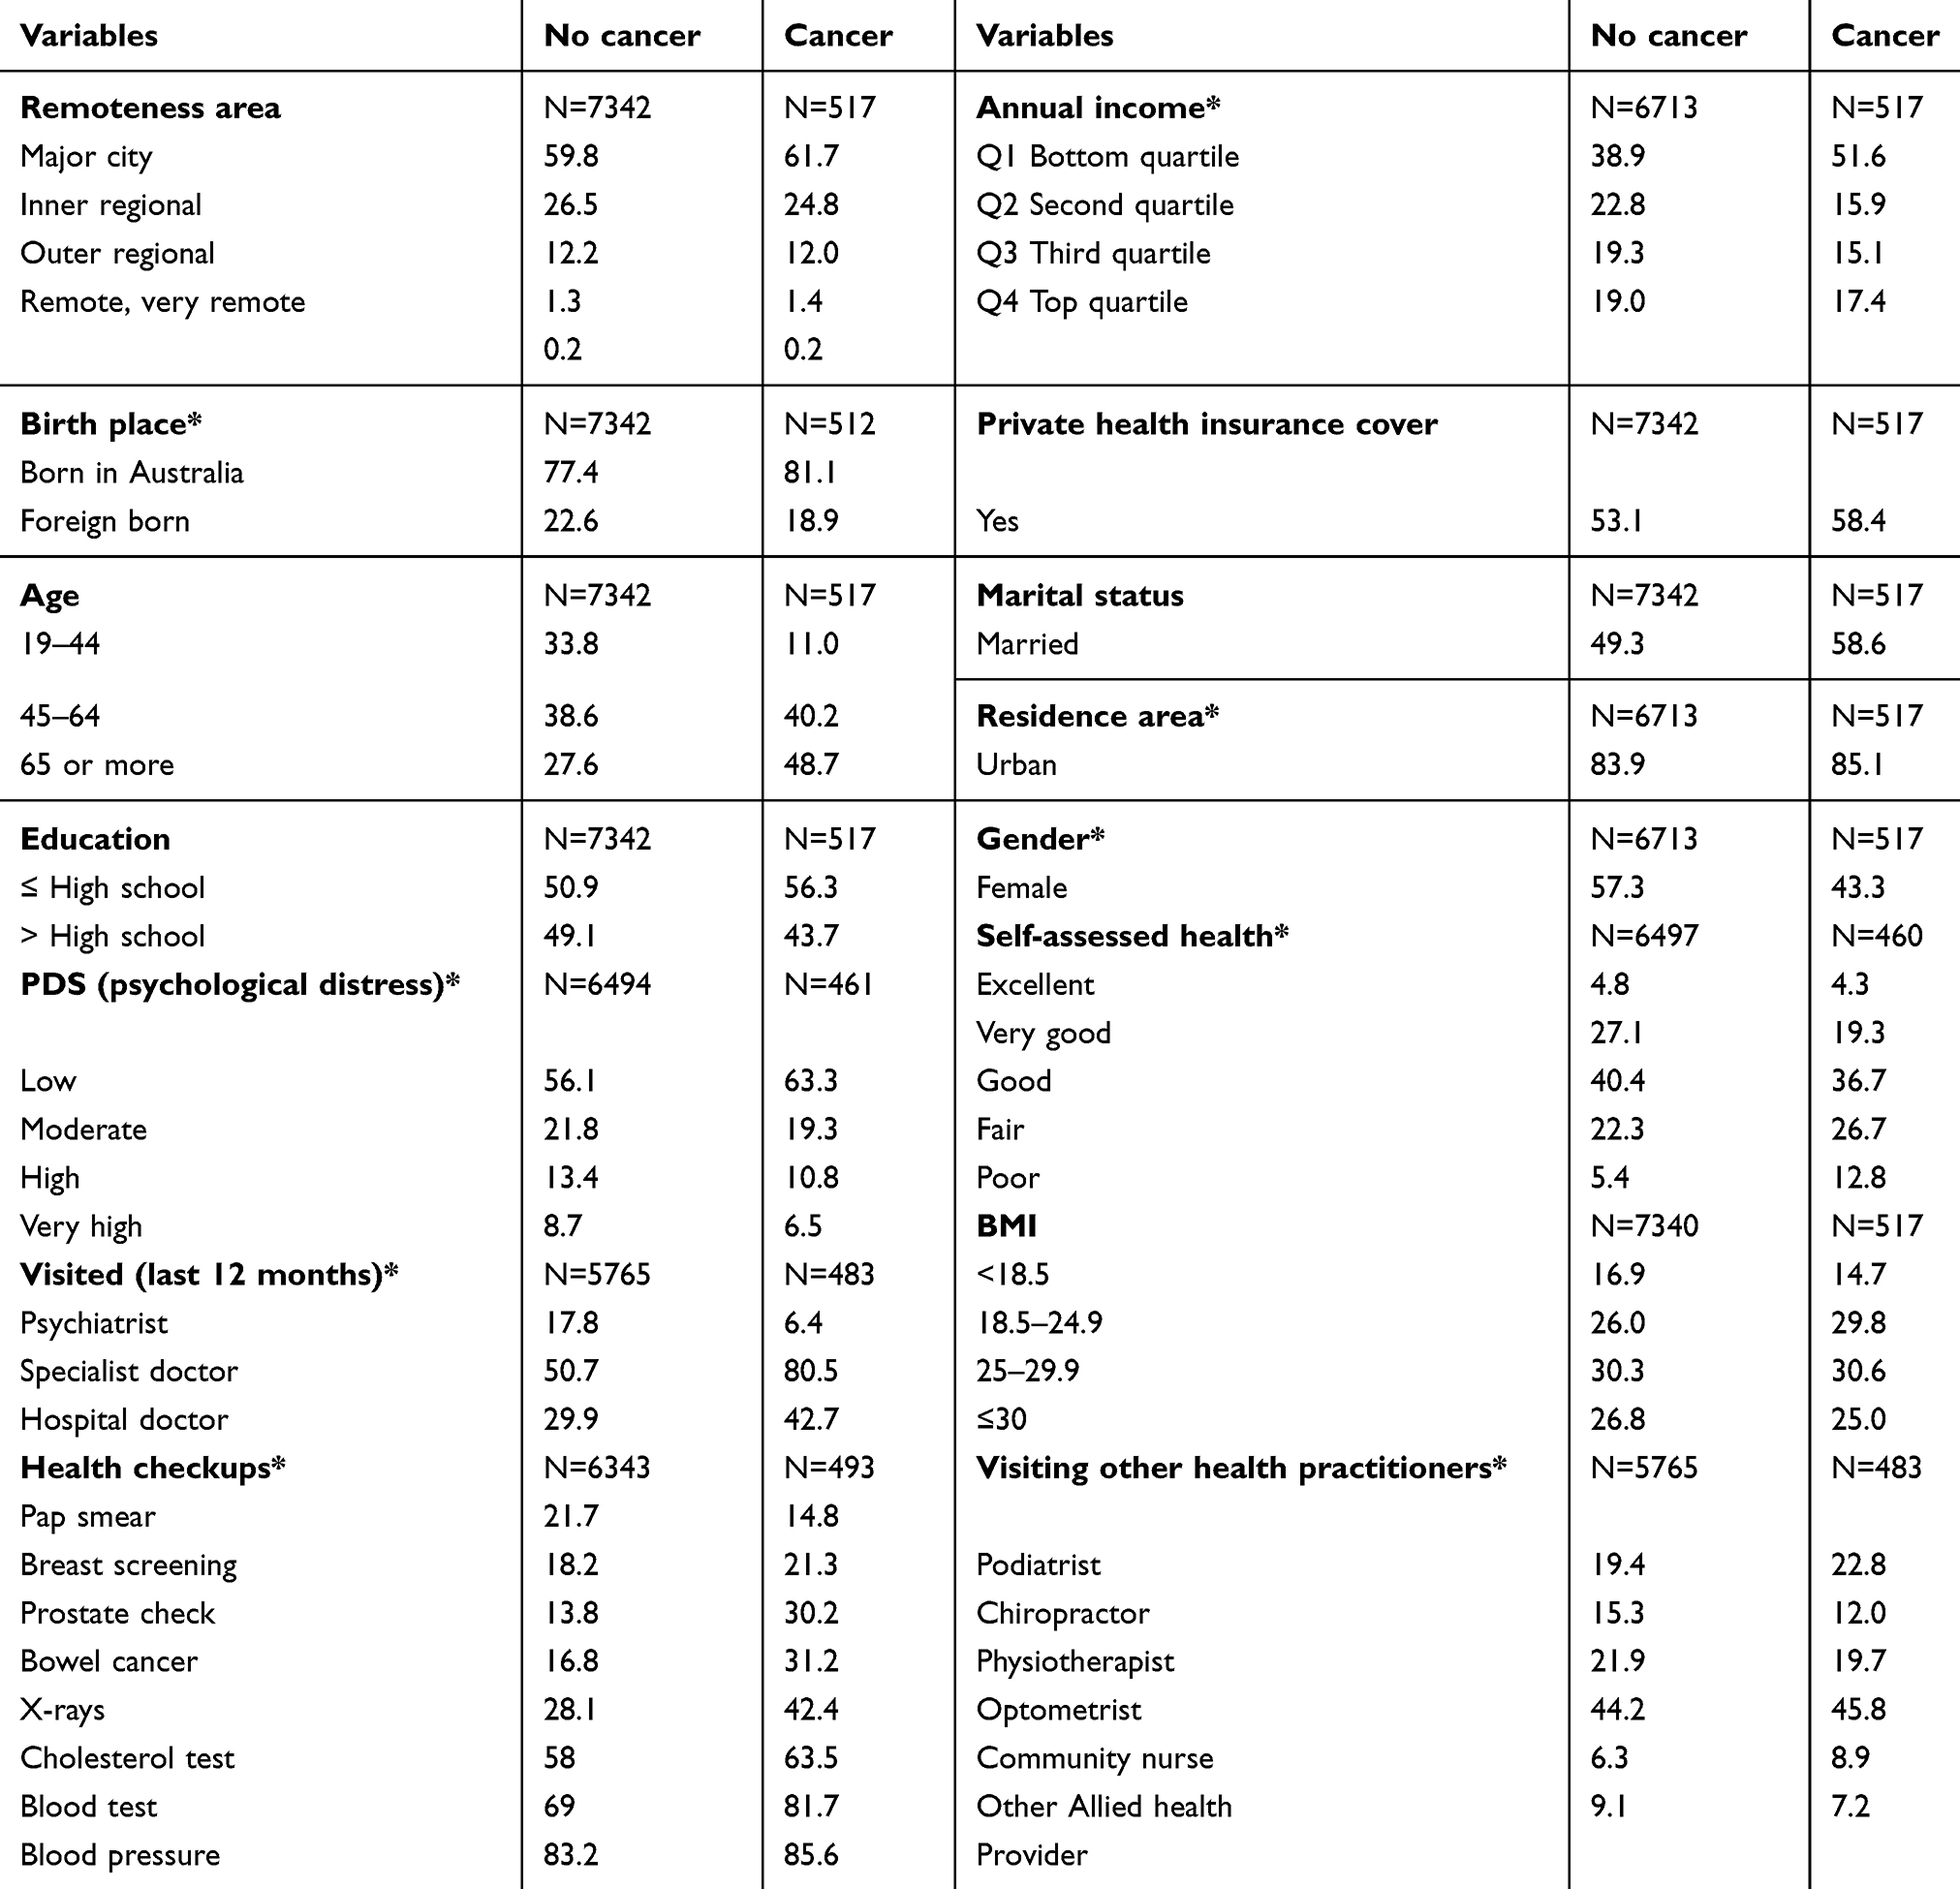 |
Table 1 Demographic characteristics of Household, Income and Labour Dynamics in Australia survey participants (%) |
Evidently as seen in Table 1, more than half (61.7%) of people living with cancer in the HILDA data (Wave 13) reside in major cities and greater than half (51.6%) of cancer households were from the lowest income quartile. Of the 517 respondents with cancer, 81.1% were born in Australia, 43.7% had an education level beyond high school graduation, 43.3% were female, 48.7% were aged over 65 and 58.4% of them were covered by private health insurance. Moreover, 17.3% (high=10.8% and very high,6.5%) of cancer patients reported a high level of psychological distress and 39.5% (fair=26.7% and poor=12.8%) of them viewed their current health status as fair or poor. On average, 80.5% of people with a cancer diagnosis visited specialists and 42.7% visited hospital doctors, in the previous 12 months. Approximately, one in seven (14.8%) of these cancer patients had pap smear test and one in five (21.3%) had breast screening. Comparatively, one in three male cancer patients had a prostate (30.2%) and a bowel cancer (31.2%) screening and 42.4% had an X-ray in the last 12 months.
The mean differences in health care utilization of cancer patients by demographic and socioeconomic characteristics had some interesting and surprising results (Table 2). For several variables, the Kruskal–Wallis H test was conducted which is more appropriate than the independent sample T-test for the predictor variables with more than two groups.31 Income was highly associated with the pattern of health care utilization among individuals with cancer. For instance, cancer patients in the lowest income quartile made a higher number of GP visits (11.85 vs 6.62; P<0.05) but stayed fewer nights in hospital (2.61 vs 2.99; P<0.05) and had marginally smaller number hospital admissions (0.68 vs 0.75; P<0.05) per year than the highest income group. Conversely, specialist doctors and mental health doctor visits did not vary significantly among cancer patients based on income quartile. On average, female cancer patients have marginally more doctor visits, 0.36 times more hospital admissions (1.08 vs 0.72; P<0.05) and 3.27 more nights’ stay in hospital (6.01 vs 2.74; P<0.05), all of which are considerably higher than male cancer patients.
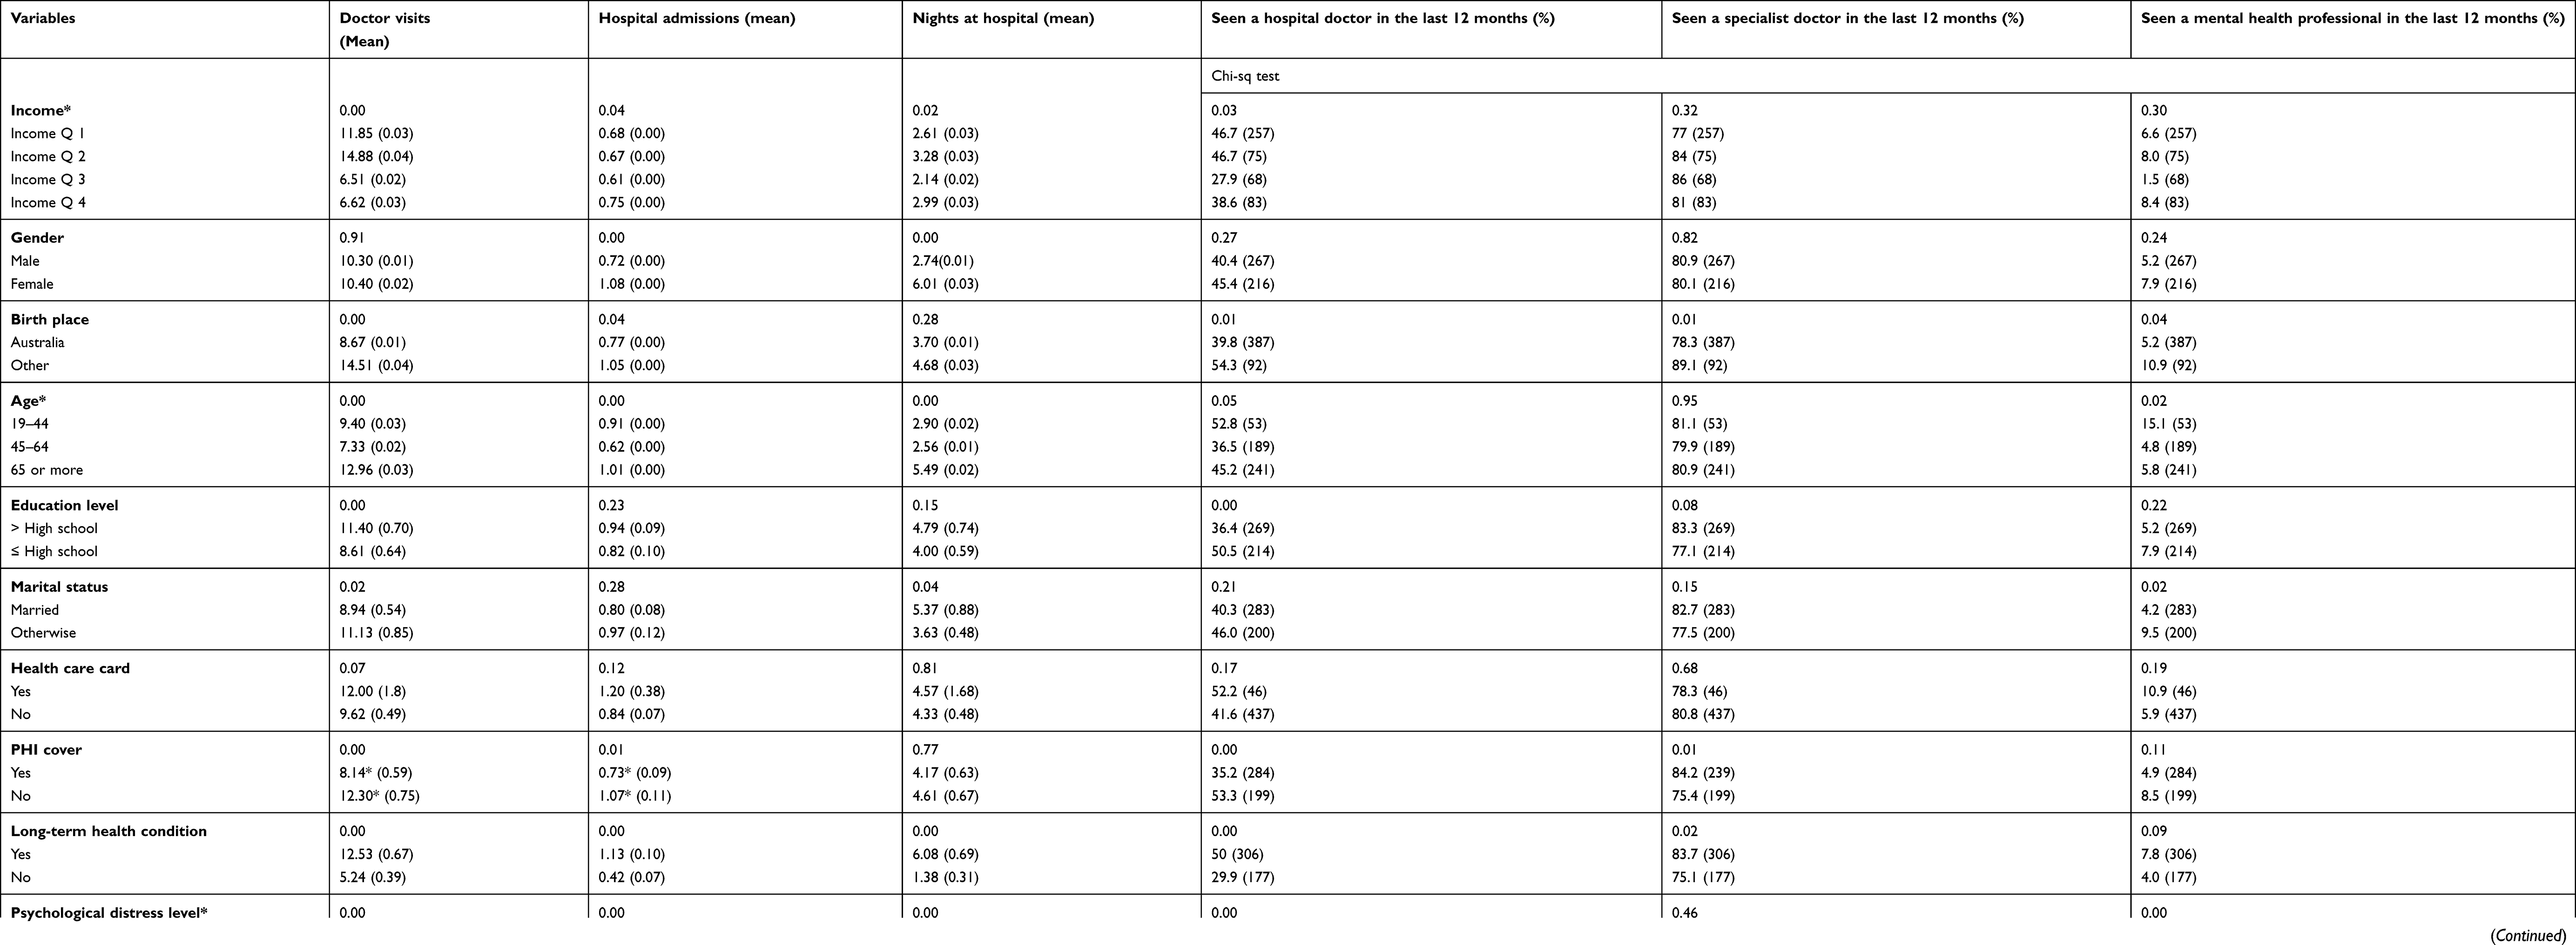 |
Table 2 Mean differences in health care utilization of cancer patients by demographic and socioeconomic characteristics |
Being born outside of Australia (BOA) also appeared to predict health care utilization among individuals with cancer who reported a higher average of doctor visits (14.51 vs 8.67; P<0.05), more hospital nights (4.68 vs 3.70; P<0.05) and marginally more specialist (89.1% vs 78.3%; P<0.05) and mental health doctor visits (10.9% vs 5.2%; P<0.05), than patients born in Australia. One probable explanation of these findings is that 95% of the BOA group reside in urban areas with the same population reporting mixed education levels with just under half possessing qualifications more than high school study (data not shown). The variations in the health care utilization between the two groups were not statistically significant, once other key explanatory variables were adjusted for in the model.
The health care utilization of cancer patients aged 65 or over was comparably higher than the two relatively younger age groups: 19–44 years and 45–64 years. Cancer patients aged 65 or more visited their GP throughout the year more often (12.96 visits), compared to those between the age of 45–64 years (7.33 visits) and 19–44 years (9.40 visits). For cancer patients (≥65 years), hospital length of stay was also higher with an average length of stay (5.49 nights) compared to the 19–44 age bracket (2.90 nights) and those in the 45–64 years age bracket (2.56 nights). The mean differences are significant at a 95% confidence interval (CI).
A higher level of education was found to significantly predict access to and use of health care. For instance, individuals with cancer who held a greater than high school qualification had a higher number of doctor visits (11.40 vs 8.61; P<0.05), hospital admissions (0.94 vs 0.82; not significant at 95% CI), longer stays in hospital (4.79 vs 4.00; not significant at 95% CI) and higher number of specialist doctor visits (83.3% vs 77.1%; P<0.05) than cancer patients with education level of high school or less.
In Australia, individuals with private health insurance (PHI) can opt to access universal health care (primary health care and public hospitals) or use private providers (private hospitals). Among cancer patients with PHI, specialist care visits are marginally higher (84.2% vs 75.4%; P<0.05) than those without coverage. But GP visits (8.14 vs 12.30; P<0.05) and hospital admissions (0.73 vs 1.07; P<0.05) are significantly higher among patients without PHI cover than those with PHI, except for the average number of hospital nights stay (4.17 vs 4.61; not significant at 95% CI). As expected, cancer patients with other long-term health conditions reported significantly higher health care utilization of all kinds compared to those without such conditions.
Individuals who reported high levels of psychological distress were more likely to visit the GP more than 10 times (18.97 vs 6.93; P<0.05), higher length of stays in hospital (8.90 vs 3.02; P<0.05) and significantly more visits to mental health professionals (21.4% vs 2.6%; P<0.05) than those with lower distress levels. Urban cancer patients reported a greater number of visits to GPs (10.51 vs 9.14; P<0.05), longer hospital stays (4.08 vs 3.59; P<0.05), higher percentage of mental health doctor visits (7.4% vs 1.3%; P<0.05) but slightly lower hospital admissions (0.83 vs 0.96; P<0.05) compared to those in rural areas.
State-based differences were also observed (although statistically not significant) in patterns of health care utilization of cancer patients. For instance, Victorian patients had the highest number of hospital admissions and hospital nights’ stay compared to those living in other states, with South Australia and Western Australia the lowest, respectively. Average specialist doctor visits are highest in South Australia with Western Australia the lowest. However, there was no association between a lower number of specialist doctor visits in Western Australia and fewer overall hospital admissions in the state. Further analysis revealed that 20% of cancer patients from Western Australia had hospital stays of 10 nights or more which reflects its lower population density and longer distances involved in accessing treatment (data not shown).
Of the 517 cancer patients, 5% (n=25) had a major worsening of finances with 11 of them from the lowest income quartile, although this finding was not significant at a 5% confidence interval (data not shown). Financial distress was not related to the place of residence (ie urban vs rural), household income or gender. However, having major financial distress is associated with fewer nights’ stay in hospital (4.36 vs 2.48; P=0.04) compared to no financial distress and a significantly higher number of visits to a mental health professional (21.7% vs 5.4%; P<0.05).
The key determinants of health care utilization of cancer patients by socioeconomic and demographic characteristics are shown in Table 3. The adjusted logistic regression results indicate that younger individuals with cancer (age <44) were 2.74 times more likely to have 10 or more doctor visits than older patients (≥65) per year (odds ratio 2.74; P<0.05). Further analyses of income status and the type and frequency of cancer care accessed showed that cancer patients from the lowest income quartile have a lower probability of hospital admission (odds ratio 0.702; P<0.05) compared to patients from the highest income quartile. In addition, women patients have 1.65 times higher probability of hospital admissions (odds ratio 1.65; P<0.05). The results also show that cancer patients with PHI are twice more likely to access a GP (ten times or more) compared to patients without private cover (odds ratio 2.04; P<0.05). However, the heterogeneity in hospital admissions was not statistically significant (odds ratio 0.86; P>0.05).
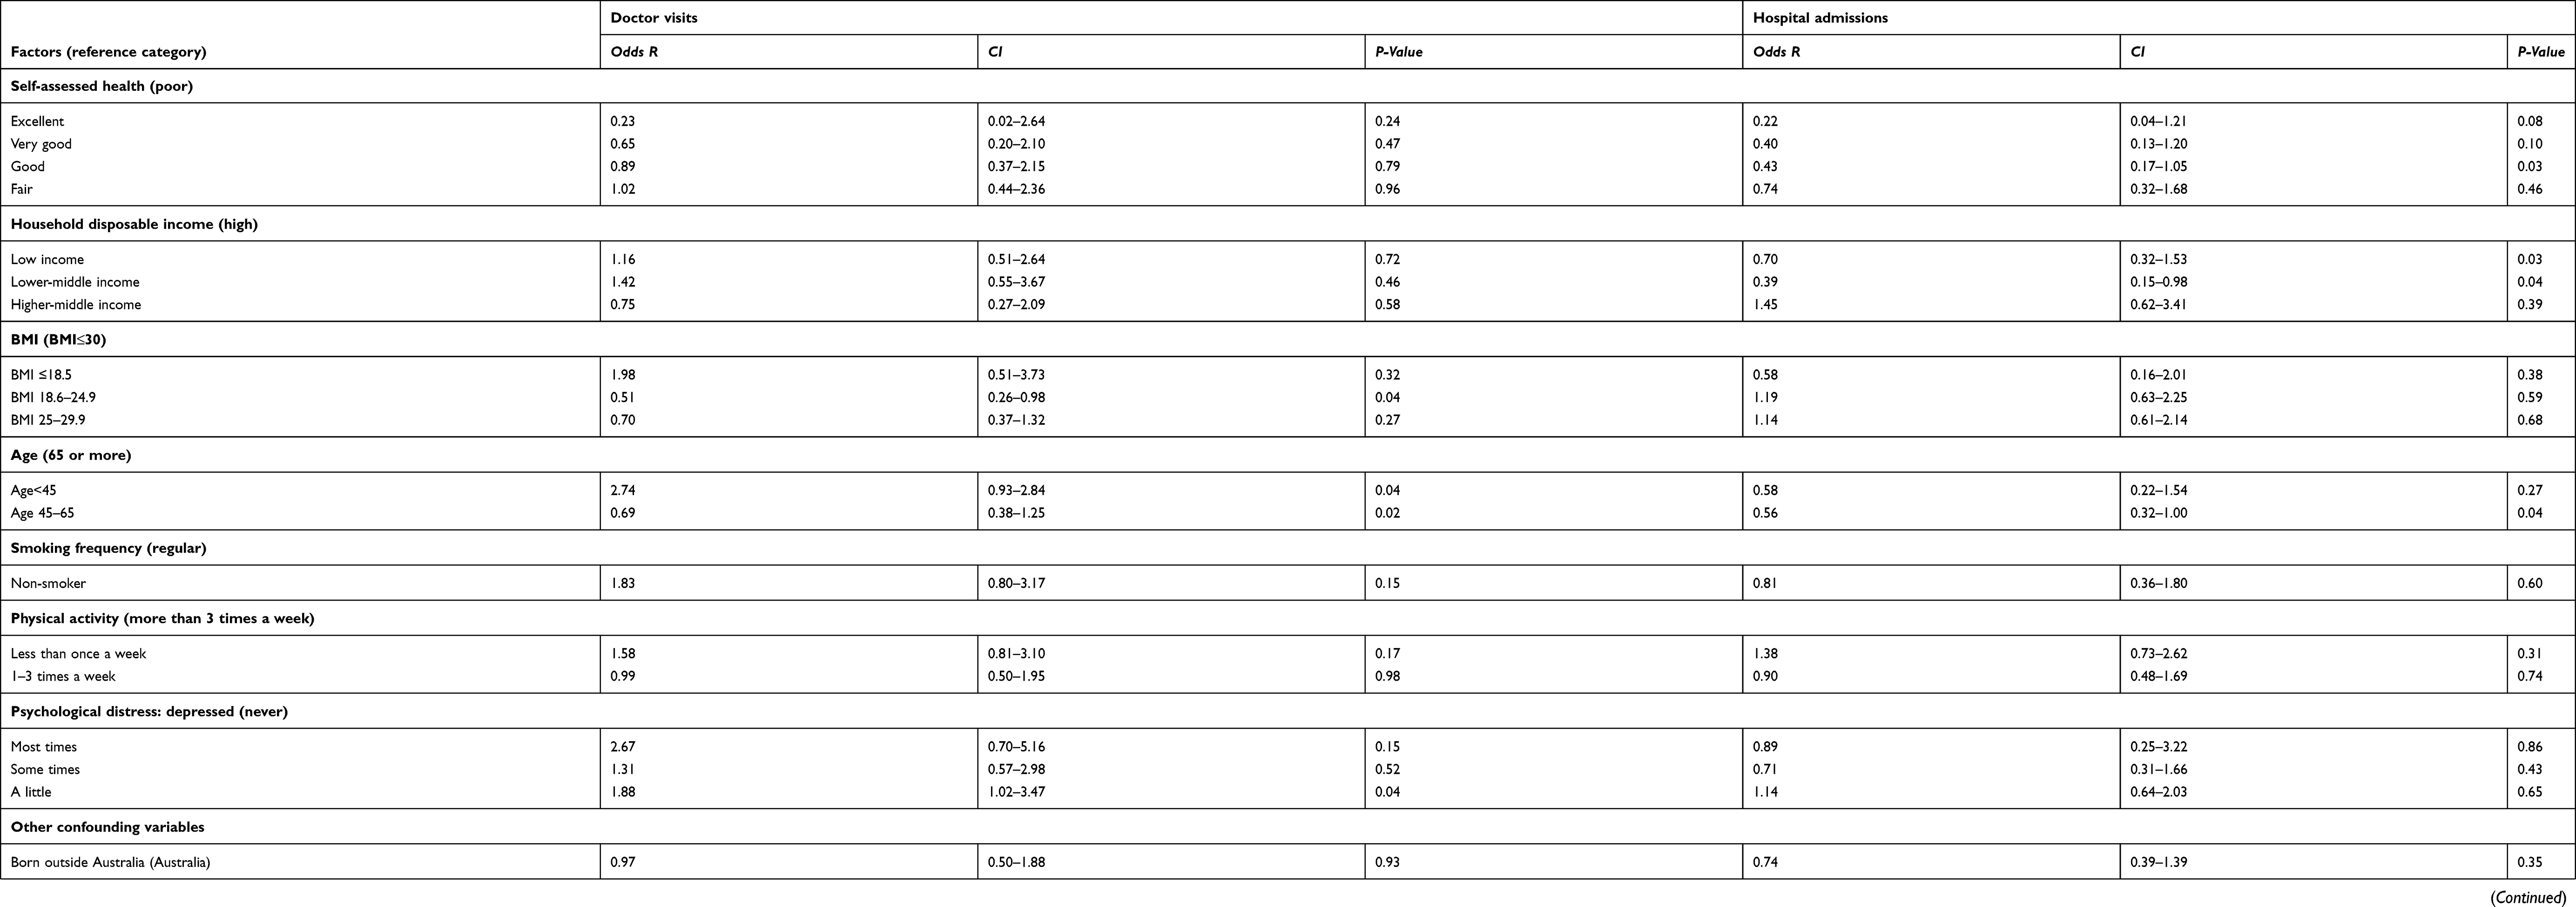 |
Table 3 Table 3 Key determinates of health care utilization of cancer patients by socioeconomic and demographic characteristics (binary logistic regression) |
Access and uptake of specialist care predicted subsequent health care utilization among individuals living with cancer. Cancer patients who visited hospital doctors (2.3 times) or accessed specialist doctors (2.7 times) were less likely to access GP care (10 or more times) and, importantly, less likely to be subsequently admitted to hospital (odds ratio 0.432 and 0.360, respectively; P<0.05). Cancer patients who received care from a hospital doctor were seven times less likely to be admitted to hospital while those receiving specialist care had a 1.87 times lower chance of hospital admission (odds ratio 0.141 and 0.535, respectively; P<0.05).
Further analysis on factors impacting health care utilization of cancer patients using the zero-inflated Poisson regression model shows several key and interesting findings (Table 4). For instance, self-assessed health, gender, long-term health condition and visits to hospital and specialist doctors significantly influence the number of doctor visits and hospital admissions of cancer patients. A unit increase in self-assessed health increases the expected number of doctor visits by a factor of 1.264 (exponent of 0.234) and hospital admissions by 1.328 (exponent of 0.284). In addition, for a male cancer patient, the expected number of zero doctor visit is 0.908 (exponent of −0.096) times and expected number of zero hospital admissions is 0.69 (exponent of −0.371) times the expected number of females, while holding all other variables constant. This indicates that female cancer patients have a higher likelihood than males of non-zero counts for number of doctor visits and hospital admissions. Furthermore, cancer patients with other long-term health conditions have 1.495 (exponent of 0.402) times, and those without a specialist doctor visit have 2.567 (exponent of 0.943) times the expected number of hospital admissions than patients with no long-term health conditions and specialist doctor visits, respectively.
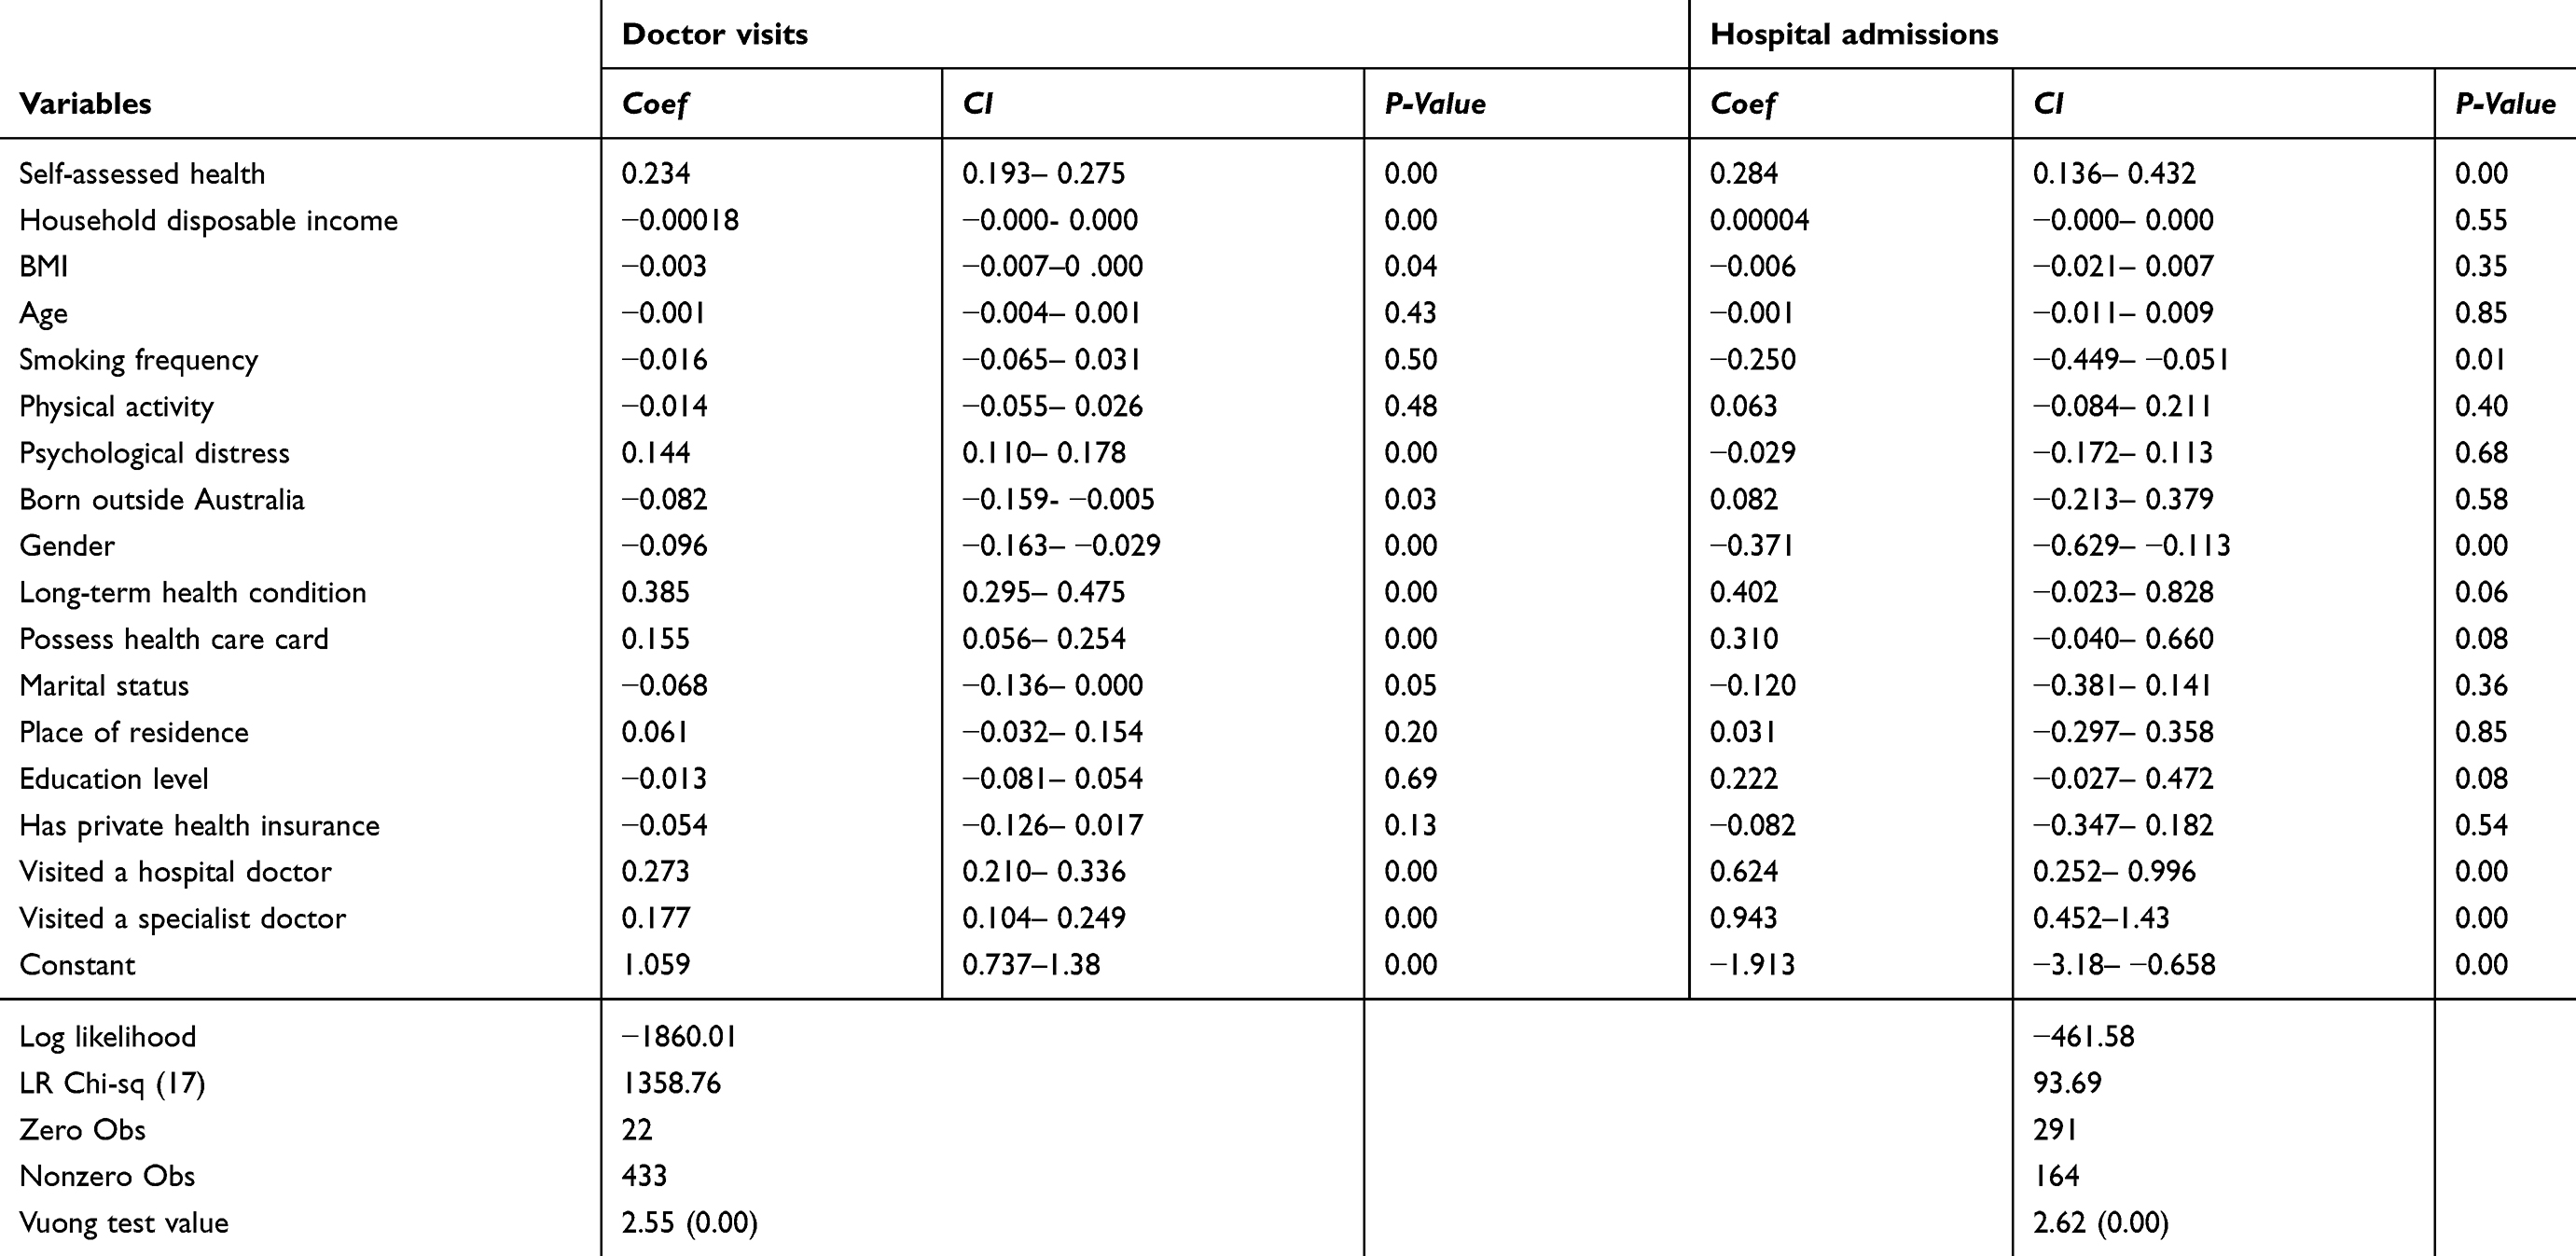 |
Table 4 Factors impacting health care utilization of cancer patients (zero-inflated Poisson regression model) |
Finally, while predicting the “Certain Zero” group, the findings of the zero-inflated regression show that if a cancer patient has no long-term health conditions, the odds that s/he would be in the “Certain Zero” group (zero or no doctor visits) is higher (results not shown). On the other hand, patients who visited hospital doctors have a higher likelihood of being in the “Certain Zero” group of no hospital admissions (results not shown).
The level of psychological distress among cancer patients varied significantly based on their demographic characteristics and health care utilization (Table 5). Cancer patients with lower education levels, aged less than 45 years, female or were not currently married reported a higher level of psychological distress compared to those who were highly educated, aged 45 and over, male and married.
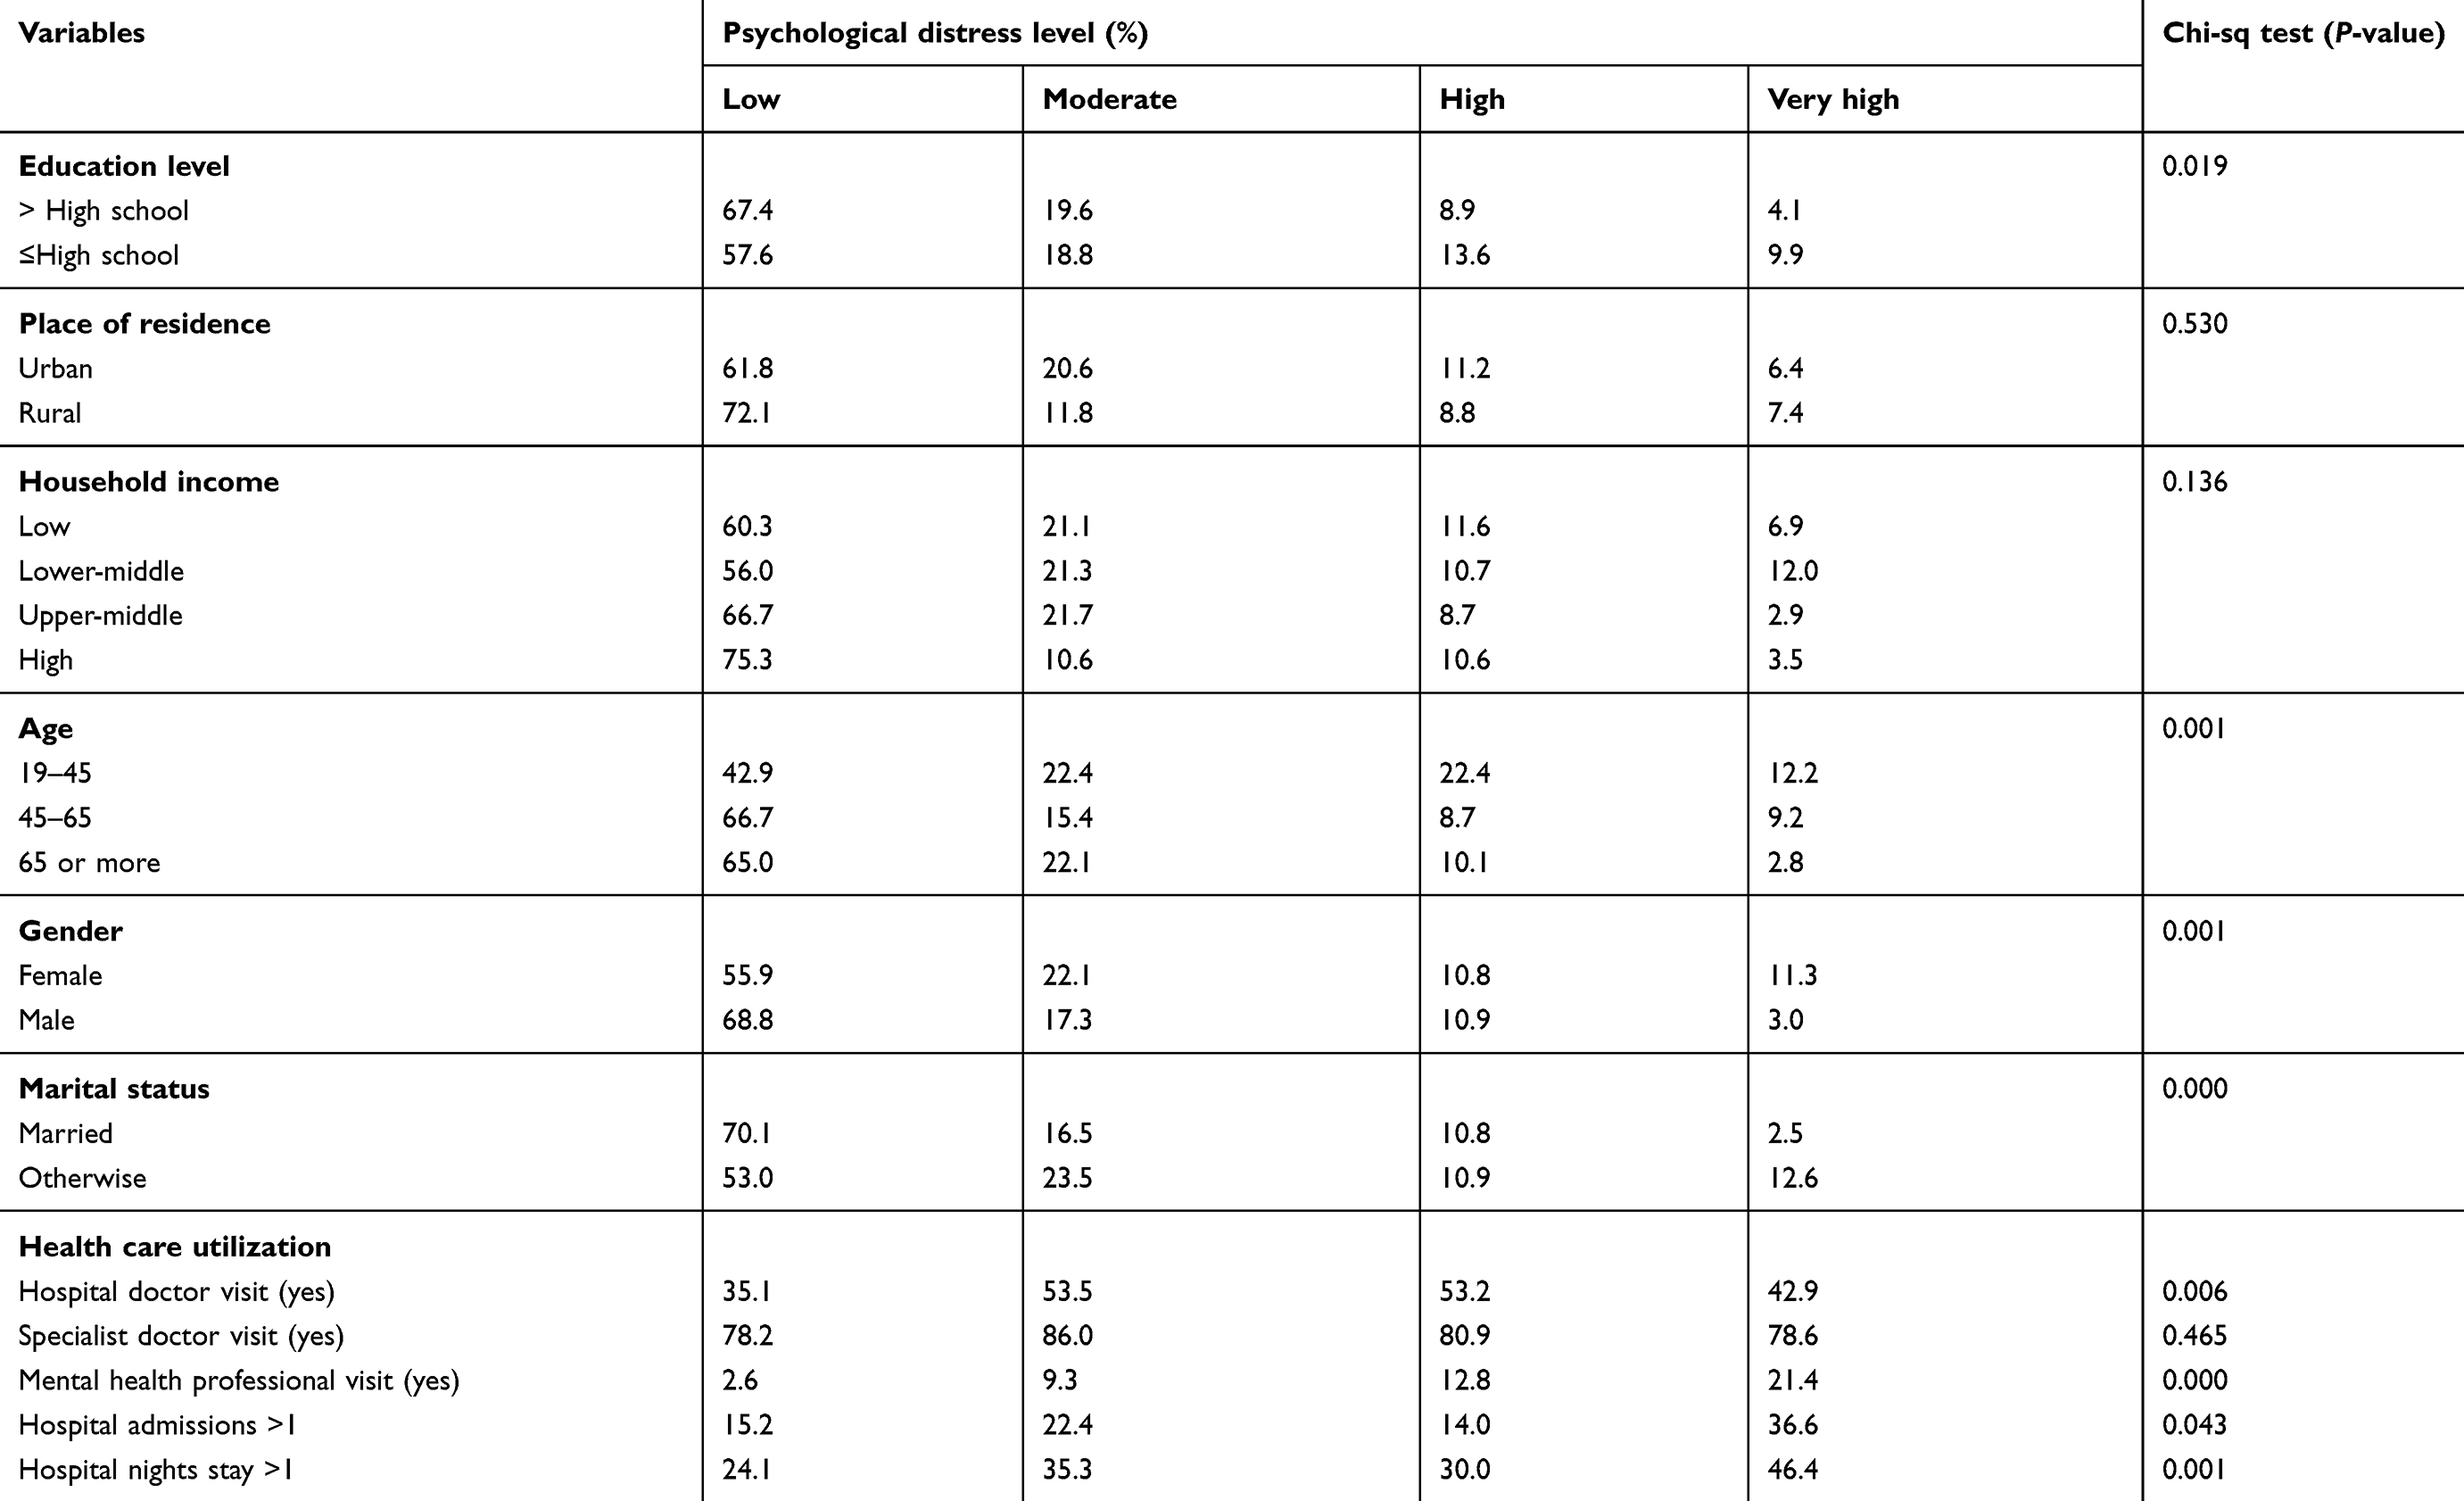 |
Table 5 Characteristics and health care utilization of cancer patients with high or very high level of psychological distress (Pearson Chi-sq test) |
Education level also appears to predict psychological distress as cancer patients with a qualification level of secondary school or lower reported very high levels of psychological distress compared to those with higher education status (9.9% vs 4.1%; P=0.019). About 6.4% of urban cancer patients reported very high psychological distress compared to 7.4% of rural cancer patients (P=0.53). Cancer patients with very high psychological distress level had a significantly higher number of hospital doctor visits (42.9% vs 35.1%; P<0.05), admissions (36.6% vs 15.2%; P=0.043) and more than one night stay (46.4% vs 24.1%; P<0.05) than those reporting a lower level of distress. Noticeably, only one in five (21.4%) cancer patients with very high psychological distress has visited a mental health professional.
Discussion
The findings demonstrate trends and inequalities in health care utilization across the cancer continuum associated with advancing age, gender, income, education status, rurality, urbanity, migrant status, private health insurance coverage and access to specialist care. Given that even moderate health care utilization has been associated with longer survival times,35,36 inequalities that act as barriers to receiving care may have devastating implications for those individuals with cancer.
In society, increased health care utilization is associated with advancing age in Australia, with hospitalization rates for those 65 years and over four times higher than the rest of the population. This older age group also accesses GP care (10 visits or more times per year) at double the rate of those under 65.37,38 The study results show that younger adults (19–45 years) with cancer appear to contradict previously reported Australian trends by accessing their GP at a higher rate than older age groups with cancer. Reasons for such health care‒-seeking behavior are unclear39; however, younger adults’ apparent preferences for GP-led care may present a more effective and lower cost means of disseminating cancer survivorship interventions among this age-group.
The findings of gender-based utilization of health care largely reflect current trends in Australian health care. It was reported in 2017 that women seek hospital care more frequently, stay in the hospital longer and access all types of health care more than men.40 This was confirmed for men with poorer health who are still less likely to access all types of health care as reported in the “Ten to Men Australian Longitudinal Study on Male Health”.41 However, the study results show that men with cancer are more likely to seek out specialist care than females with cancer, possibly reflecting a masculine tendency to seek out a viewpoint on their illness which they perceive to be dominant or authoritative.42 Masculine inclinations to access specialist care may also explain an increased uptake of screening compared to those without a cancer diagnosis as increased usage of diagnostic tests are associated with specialist care.43
Despite Australia becoming the wealthiest country in the world in 2018 based on median wealth per adult,44 there is clear evidence that income inequality is associated with differing patterns of health care utilization. For those of low income, less engagement with hospital-based care and increased use of GP services may reflect the financial pressures of remaining in paid work to support the high cost of living in Australia.44 However, these patterns were reversed in high-income individuals who not only accessed hospital care more but accessed specialist care and sought treatment from mental health professionals more often than lower income cancer patients. Noticeably, cancer patients reporting financial distress had the lowest length of stay of all, with single people most affected. Given financial distress has been linked with decision-making on treatment,45 reduced length of stay in this sample may reflect a need to leave the hospital early to avoid the loss of income and the cost of treatment.
The usual factors such as advanced education status and urban residence linked with increased health care utilization were also found in this study; however, both variables were also correlated with an increased probability of psychological distress. However, increased length of hospital stay for rural individuals is typical in the geographically dispersed Australian context and reflects the lack of appropriate local treatment services for rural people and increases their need to travel for medical treatment.40,43
The findings of higher psychological distress in more educated, urban-dwelling individuals with cancer contrast with other studies where rural individuals of lower education status report higher psychological distress.46,47 Accessing mental health services48 and positive attitudes49 toward seeking psychological support have previously been associated with higher incomes, although it is unclear how higher income increases care-seeking behaviors in this study population. Lastly, cancer patients with very high levels of psychological distress showed a higher level of health care utilization; however, around four in five of these patients surprisingly did not seek mental health care services.
Significantly increased health care utilization by migrants with cancer is a new finding in the Australian context; however, this finding may in part further explain more favorable cancer mortality outcomes among Australian migrants as previously reported in a 2012 study.17 More broadly, it was found that state-based patterns of cancer care differ widely and are not explainable by typical patterns of health-seeking behavior. Nevertheless, significant variation in cancer care may reflect ongoing state-based differentials in the (in)efficiency of care delivery50 as well as a lack of care coordination reported in aspects of cancer services.51 How to achieve consistency in care delivery is a federal health priority in Australia, with further research needed on improving the coordination and efficiency of care at multiple levels. Importantly for care coordination, specialist care appears to be strongly linked with the prevention of hospitalization which highlights both the value of specialists in the health care system and their contribution to improved care coordination.
While cross-sectional analysis is susceptible to the risk of bias, the representative population data used in this study provides a solid basis for the results obtained and enables further exploration of the demographic and sociocultural drivers of health care utilization in cancer patients in Australia. The results also serve to inform which populations are experiencing inequality and identifies potential areas where tailored solutions might inform models for improving service access and care optimization.
Limitations
This study has some limitations. Data inadequacy, for instance, means a lack of follow-up questions like what type of cancer and time diagnosed with cancer could not be factored into or controlled for in the regression analysis. Due to the cross-sectional nature of the data, the causality effect between variables could not be estimated. Future studies using longitudinal data may be able to use more in-depth confounding estimates of the causal relationship. The fewer number of respondents with cancer (in the database) also limited the ability to create more age groups. Lastly, the expenditure on and utilization of health care are subject to several unobserved variables which may lead to omitted variable bias.52 Although this study has attempted to limit the bias through the inclusion of relevant covariates and by using a two-part model, some potential bias may still exist.27,51 Lastly, the term “no cancer” means survey respondents reported negative to the question “have you been diagnosed with any type of cancer?” However, this does not mean these respondents do not have other long-term health conditions. Therefore, the heterogeneity of health expenditure and health care utilization between the two groups (cancer vs no cancer) should be interpreted with caution. Future studies may use “quasi-experimental design” or “social experiments” to address these methodological issues.
Conclusions
The findings from this study have implications for policymakers and health professionals as they reflect structural inequalities in Australian society which impact upon cancer patients, their treatment pathways and ultimately their survival or otherwise. Factors such as age, gender, income, psychological health, education and place of residence indicate the need for appropriate policy and program responses. Encouragingly, the findings also point to the value of some models of care in specific cohorts as well as the value of specialists in preventing hospitalizations through improved care coordination. Further research into effective models of care is needed to understand why, where and when they work and how their effectiveness can be implemented across the health system.
Acknowledgments
The paper was part of the first author’s PhD study. The PhD program was financed by the University of Southern Queensland, Australia [USQ International Stipend Research Scholarship and USQ International Fees Research Scholarship].
This study used unit record data from the Household, Income and Labour Dynamics in Australia (HILDA) Survey. The HILDA project was initiated and is funded by the Australian Government’s Department of Social Services (DSS). It is managed by the Melbourne Institute of Applied Economic and Social Research at the University of Melbourne. This research project has been approved by the Human Research Ethics Committee of the University of Melbourne. The DSS approved the use of HILDA data from the “Australian Data Archive” for this research. The conclusions and opinions reported in this paper, however, are those of the authors and should not be attributed to either DSS or the Melbourne Institute.
Disclosure
The authors report no conflicts of interest in this work.
References
1. Bray F, Ferlay J, Soerjomataram I, Siegel RL, Torre LA, Jemal A. Global cancer statistics 2018: GLOBOCAN estimates of incidence and mortality worldwide for 36 cancers in 185 countries. CA Cancer J Clin. 2018;68(6):394–424. doi:10.3322/caac.21492
2. Australian Institute of Health and Welfare. Australian Cancer Incedence and Mortality (ACIM) Books: All Cancers. Canberra: Australian Institue of Health and Welfare; 2017.
3. Australian Institute of Health and Welfare. Cancer in Australia 2017. Cancer Series No. 101. Cat. No. CAN 100. Canberra: Australian Institute of Health and Welfare; 2017.
4. Stanbury JF, Baade PD, Yu Y, Yu XQ. Cancer survival in New South Wales, Australia: socioeconomic disparities remain despite overall improvements. BMC Cancer. 2016;16(1):48. doi:10.1186/s12885-016-2065-z
5. Carrasquillo O. Health care utilization. In: Gellman MD, Turner JR, editors. Encyclopedia of Behavioral Medicine. New York: Springer; 2013:909–910.
6. Maxwell S, O’Leary P, Slevin T, Moorin R. The increase in cancer prevalence and hospital burden in Western Australia, 1992–2011. Popul Health Metr. 2014;12(1):33. doi:10.1186/s12963-014-0033-x
7. Langton JM, Blanch B, Drew AK, Haas M, Ingham JM, Pearson S-A. Retrospective studies of end-of-life resource utilization and costs in cancer care using health administrative data: a systematic review. Palliat Med. 2014;28(10):1167–1196. doi:10.1177/0269216314533813
8. McGrath P. Financial distress during relocation for treatment of a hematological malignancy: findings for social work. Soc Work Health Care. 2016;55(4):265–279. doi:10.1080/00981389.2015.1130008
9. Callander E, Topp SM, Larkins S, Sabesan S, Bates N. Quantifying Queensland patients with cancer health service usage and costs: study protocol. BMJ Open. 2017;7(1):e014030. doi:10.1136/bmjopen-2016-014030
10. Cancer Australia. Cancer Australia Strategic Plan 2014-2019. Surrey Hilss, New South Walse: Cancer Australia; 2014.
11. Baade P, Aitken J, Fritschi L. Geographical differentials in cancer incidence and survival in Queensland, 1996 to 2002. Viertel Centre for Research in Cancer Control, Queensland Cancer Fund; Queensland; 2005.
12. Cramb S, Mengersen K, Baade PD. Atlas of cancer in Queensland: geographical variations in incidence and survival 1998–2007. Viertel Centre for Research in Cancer Control, Cancer Council Queensland; Queensland; 2011.
13. Cramb SM, Moraga P, Mengersen KL, Baade PD. Spatial variation in cancer incidence and survival over time across Queensland, Australia. Spat Spatiotemporal Epidemiol. 2017;23:59–67. doi:10.1016/j.sste.2017.09.002
14. Ananda S, Kosmider S, Tran B, et al. The rapidly escalating cost of treating colorectal cancer in Australia. Asia Pac J Clin Oncol. 2016;12(1):33–40. doi:10.1111/ajco.12350
15. Doran CM, Ling R, Byrnes J, et al. Estimating the economic costs of skin cancer in New South Wales, Australia. BMC Public Health. 2015;15(1):952. doi:10.1186/s12889-015-2267-3
16. Gordon LG, Tuffaha HW, James R, et al. Estimating the healthcare costs of treating prostate cancer in Australia: a Markov modelling analysis.
17. Anikeeva O, Bi P, Hiller JE, Ryan P, Roder D, Han GS. Trends in cancer mortality rates among migrants in Australia: 1981–2007. Cancer Epidemiol. 2012;36(2):e74–e82. doi:10.1016/j.canep.2011.10.011
18. Koh E, Do V, Barton M. Frontiers of cancer care in Asia-Pacific region: cancer care in Australia. Biomed Imaging Interv J. 2008;4:3. doi:10.2349/biij.4.3.e30
19. Langton JM, Reeve R, Srasuebkul P, et al. Health service use and costs in the last 6 months of life in elderly decedents with a history of cancer: a comprehensive analysis from a health payer perspective. Br J Cancer. 2016;114(11):1293. doi:10.1038/bjc.2016.75
20. Iadeluca L, Mardekian J, Chander P, Hopps M, Makinson GT. The burden of selected cancers in the US: health behaviors and health care resource utilization. Cancer Manag Res. 2017;9:721. doi:10.2147/CMAR.S143148
21. Milner A, Krnjacki L, LaMontagne A. Age and gender differences in the influence of social support on mental health: a longitudinal fixed-effects analysis using 13 annual waves of the HILDA cohort. Public Health. 2016;140:172–178. doi:10.1016/j.puhe.2016.06.029
22. Department of Social Services. The household, income and labour dynamics in Australia (HILDA) survey, GENERAL RELEASE 16 (Waves 1-16). Australia: ADA Dataverse, V4; 2017.
23. Butterworth P, Leach LS, Rodgers B, Broom DH, Olesen SC, Strazdins L. Psychosocial job adversity and health in Australia: analysis of data from the HILDA Survey. Aust N Z J Public Health. 2011;35(6):564–571. doi:10.1111/j.1753-6405.2011.00771.x
24. Watson N, Wooden MP. The HILDA survey: a case study in the design and development of a successful household panel survey. Longit Life Course Stud. 2012;3(3):369–381.
25. Becchetti L, Conzo P, Salustri F. The impact of health expenditure on the number of chronic diseases. Health Policy. 2017;121(9):955–962. doi:10.1016/j.healthpol.2017.07.008
26. Han X, Lin CC, Li C, et al. Association between serious psychological distress and health care use and expenditures by cancer history. Cancer. 2015;121(4):614–622. doi:10.1002/cncr.29102
27. Short PF, Moran JR, Punekar R. Medical expenditures of adult cancer survivors aged<65 years in the United States. Cancer. 2011;117(12):2791–2800. doi:10.1002/cncr.25835
28. Buchmueller TC, Johar M. Obesity and health expenditures: evidence from Australia. Econ Hum Biol. 2015;17:42–58. doi:10.1016/j.ehb.2015.01.001
29. Zhang D, Wang G, Zhang P, Fang J, Ayala C. Medical expenditures associated with hypertension in the US, 2000–2013. Am J Prev Med. 2017;53(6):S164–S171. doi:10.1016/j.amepre.2017.05.014
30. Agresti A. Categorical Data Analysis.
31. Field A. Discovering Statistics Using IBM SPSS Statistics.
32. Cameron AC, Trivedi PK. Regression Analysis of Count Data. Vol. 53. New York: Cambridge University Press; 2013.
33. Lambert D. Zero-inflated Poisson regression, with an application to defects in manufacturing. Technometrics. 1992;34(1):1–14. doi:10.2307/1269547
34. Zeileis A, Kleiber C, Jackman S. Regression models for count data in R. J Stat Softw. 2008;27(8):1–25. doi:10.18637/jss.v027.i08
35. Yim J, Hwang -S-S, Yoo K-Y, Kim C-Y. Contribution of income-related inequality and healthcare utilisation to survival in cancers of the lung, liver, stomach and colon. J Epidemiol Community Health. 2012;66(1):37–40. doi:10.1136/jech.2009.104554
36. Semnani S, Noorafkan Z, Aryaie M, et al. Determinants of healthcare utilisation and predictors of outcome in colorectal cancer patients from Northern Iran. Eur J Cancer Care (Engl). 2016;25(2):318–323. doi:10.1111/ecc.12313
37. Britt H, Miller GC, Henderson J, et al. A Decade of Australian General Practice Activity 2003–04 to 2012–13. Sedney: Sydney University Press; 2013.
38. Family Medicine Research Center. Care of Older People in Australian General Practice. Sydney: The University of Sydney; 2015.
39. Nathan PC, Daugherty CK, Wroblewski KE, et al. Family physician preferences and knowledge gaps regarding the care of adolescent and young adult survivors of childhood cancer. J Cancer Surviv. 2013;7(3):275–282. doi:10.1007/s11764-013-0271-0
40. Australian Institute of Health and Welfare. The health of Australia’s female. Canberra: AIHW;2017. Available from https://www.aihw.gov.au/reports/men-women/female-health/contents/who-are.
41. Schlichthorst M, Sanci LA, Pirkis J, Spittal MJ, Hocking JS. Why do men go to the doctor? Socio-demographic and lifestyle factors associated with healthcare utilisation among a cohort of Australian men. BMC Public Health. 2016;16(3):1028. doi:10.1186/s12889-016-3706-5
42. Noone JH, Stephens C. Men, masculine identities, and health care utilisation. Sociol Health Illn. 2008;30(5):711–725. doi:10.1111/j.1467-9566.2008.01095.x
43. Australian Institute of Health and Welfare. The health of Australia’s males. Canberra: AIHW; 2017. Available from https://www.aihw.gov.au/reports/men-women/male-health/contents/who-are.
44. Shorrocks A, Davies J, Lluberas R. Global Wealth Report 2018. Switzerland: Credit Suisse Research Institute; 2018.
45. Neumann PJ, Palmer JA, Nadler E, Fang C, Ubel P. Cancer therapy costs influence treatment: a national survey of oncologists. Health Aff. 2010;29(1):196–202. doi:10.1377/hlthaff.2009.0077
46. Weaver KE, Geiger AM, Lu L, Case LD. Rural‐urban disparities in health status among US cancer survivors. Cancer. 2013;119(5):1050–1057. doi:10.1002/cncr.27840
47. Zahnd WE, McLafferty SL. Contextual effects and cancer outcomes in the United States: a systematic review of characteristics in multilevel analyses. Ann Epidemiol. 2017;27(11):739–748. e733. doi:10.1016/j.annepidem.2017.10.002
48. Henderson C, Robinson E, Evans‐Lacko S, et al. Public knowledge, attitudes, social distance and reported contact regarding people with mental illness 2009–2015. Acta Psychiatr Scand. 2016;134:23–33. doi:10.1111/acps.12607
49. Mission W. Living with Mental Illness; Attitudes, experiences and challenges. Sydney: Wesley Mission; 2007:16.
50. Australian Institute of Health and Welfare. Australia’s hospitals at a glance 2016–17. Canberra: AIHW; 2018. Available from https://www.aihw.gov.au/getmedia/d5f4d211-ace3-48b9-9860-c4489ddf2c35/aihw-hse-204.pdf.aspx?inline=true.
51. Crawford‐Williams F, March S, Goodwin BC, et al. Interventions for prostate cancer survivorship: A systematic review of reviews. Psycho‐Oncology. 2018;27(10):2339–2348. doi:10.1002/pon.4888
52. Dismuke CE, Egede LE. Association of serious psychological distress with health services expenditures and utilization in a national sample of US adults. Gen Hosp Psychiatry. 2011;33(4):311–317. doi:10.1016/j.genhosppsych.2011.03.014
Supplementary material
Results from the GLM regression model
The GLM approach was used to examine the key factors influencing healthcare utilization (Table S1).
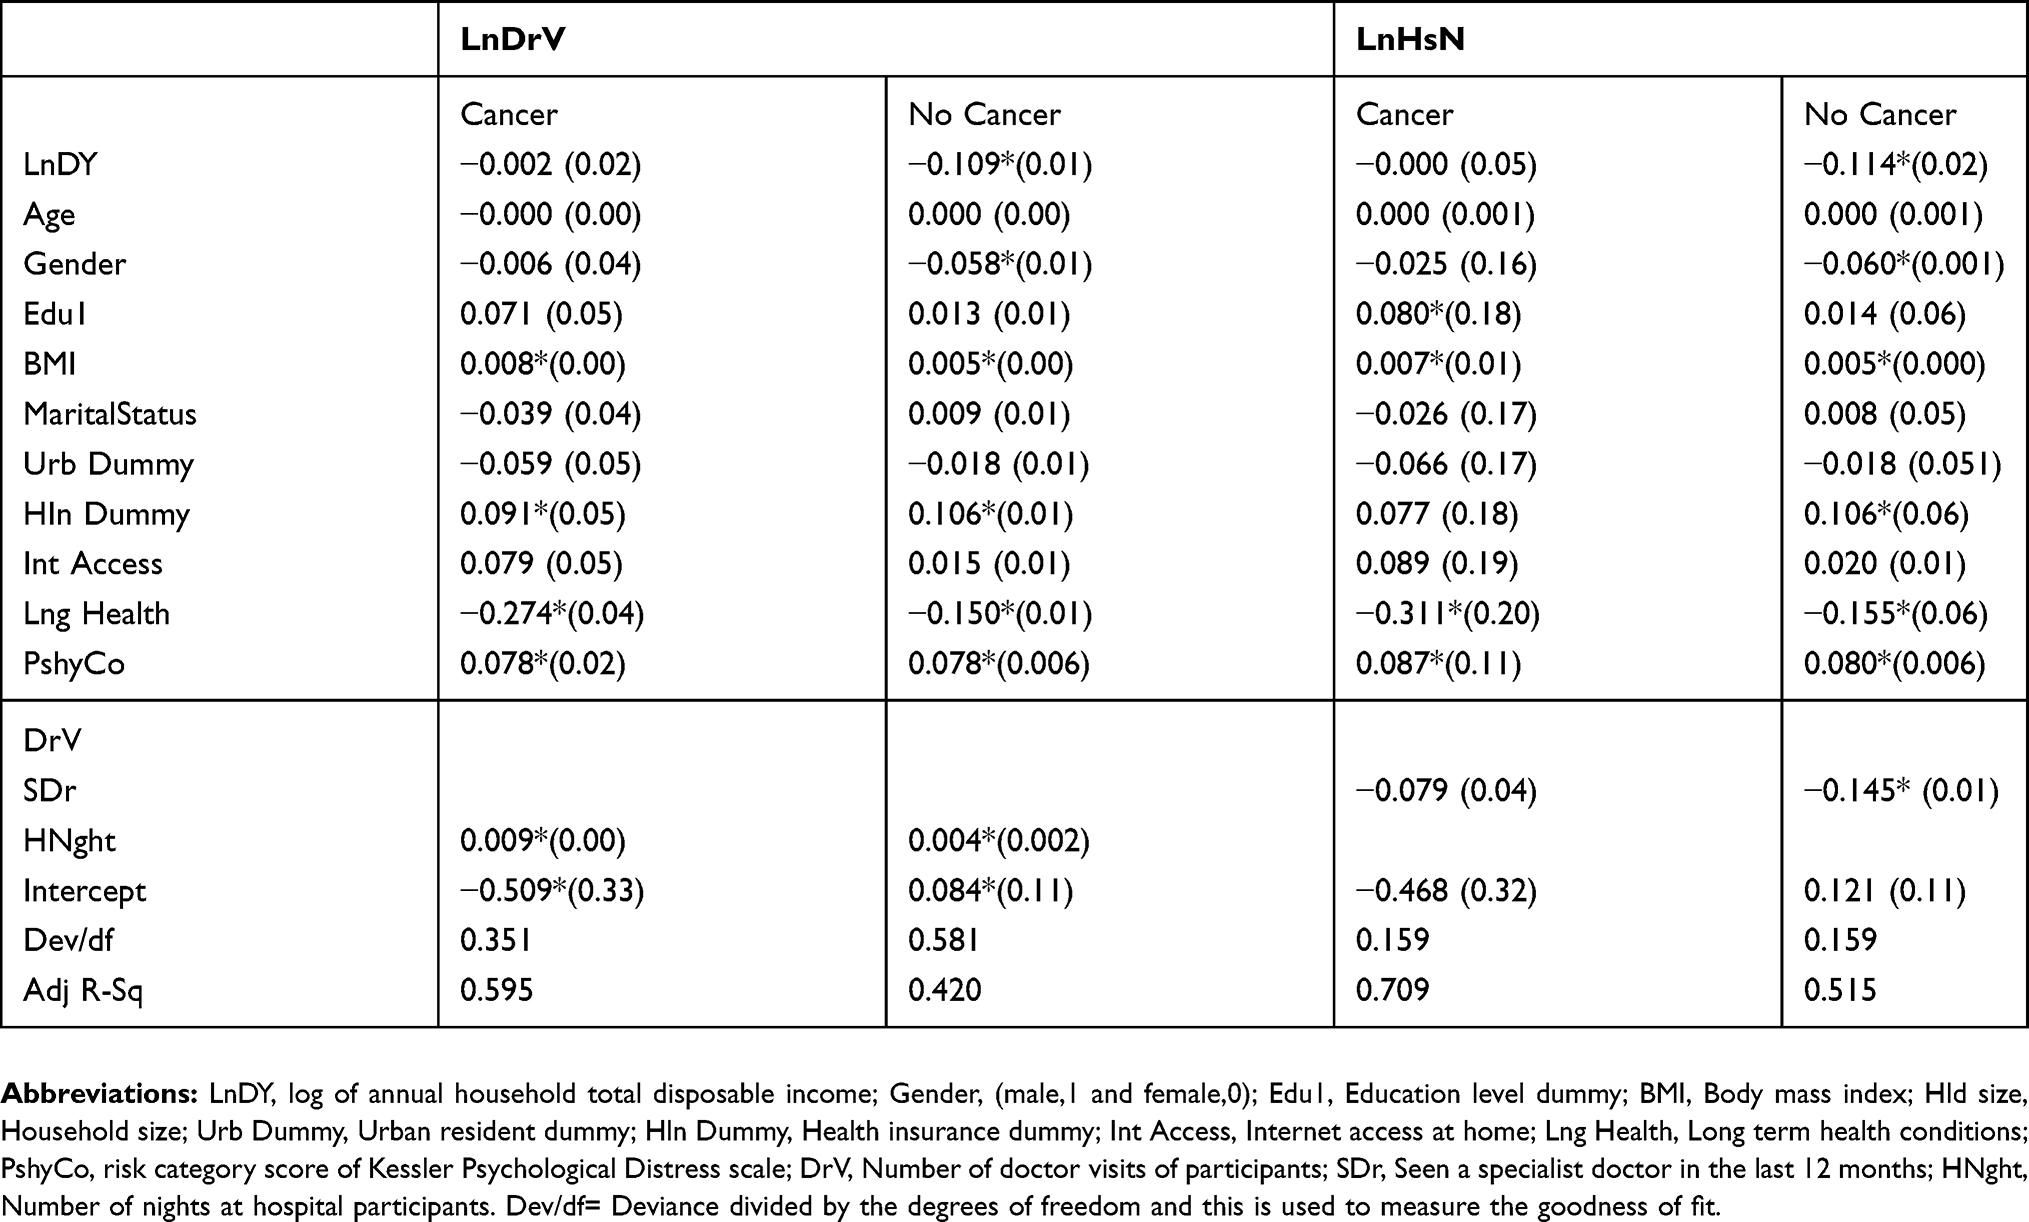 |
Table S1 Factors influencing healthcare utilization of cancer patients (generalised linear model) |
Two outcome variables have been used to measure healthcare utilization: the log of the number of doctor visits (LnDrV) and a log of the number of nights stay in the hospital (LnHsN). For cancer patients, a one unit increase in BMI leads to a growth in number of doctor visits by 0.8% and for non-cancer patients, it increases by 0.5% and the results are significant. Cancer patients with other long-term health conditions have on average 24.7% more doctor visits compared to cancer patients with no long-term health conditions. A cancer patient with higher psychological distress has 7.8% more doctor visits compared to those without the condition. Again, having private health insurance increases the doctor visits by 9.1% for cancer patients and 10.6% for non-cancer patients. The factors that significantly influence the number of nights stay at the hospital are other long-term health conditions, BMI and level of psychological distress. However, for non-cancer patients having private health insurance increases the nights’ stay at the hospital by 10.6%. Lastly, for non-cancer patients higher visits to specialist doctors reduces nights stay in the hospital by 14.5%.
 © 2019 The Author(s). This work is published and licensed by Dove Medical Press Limited. The full terms of this license are available at https://www.dovepress.com/terms.php and incorporate the Creative Commons Attribution - Non Commercial (unported, v3.0) License.
By accessing the work you hereby accept the Terms. Non-commercial uses of the work are permitted without any further permission from Dove Medical Press Limited, provided the work is properly attributed. For permission for commercial use of this work, please see paragraphs 4.2 and 5 of our Terms.
© 2019 The Author(s). This work is published and licensed by Dove Medical Press Limited. The full terms of this license are available at https://www.dovepress.com/terms.php and incorporate the Creative Commons Attribution - Non Commercial (unported, v3.0) License.
By accessing the work you hereby accept the Terms. Non-commercial uses of the work are permitted without any further permission from Dove Medical Press Limited, provided the work is properly attributed. For permission for commercial use of this work, please see paragraphs 4.2 and 5 of our Terms.