")
Back to Journals » International Journal of General Medicine » Volume 15
Predictive Value of the Geriatric Trauma Outcome Score in Older Patients After Trauma: A Retrospective Cohort Study
Authors Zhuang Y , Feng Q, Tang H, Wang Y, Li Z, Bai X
Received 16 February 2022
Accepted for publication 5 April 2022
Published 23 April 2022 Volume 2022:15 Pages 4379—4390
DOI https://doi.org/10.2147/IJGM.S362752
Checked for plagiarism Yes
Review by Single anonymous peer review
Peer reviewer comments 3
Editor who approved publication: Dr Scott Fraser
Yangfan Zhuang,1 Quanrui Feng,2 Huiming Tang,3 Yuchang Wang,1 Zhanfei Li,1 Xiangjun Bai1
1Trauma Center/Department of Emergency and Traumatic Surgery, Tongji Hospital of Tongji Medical College, Huazhong University of Science and Technology, Wuhan, 430030, People’s Republic of China; 2Department of Intensive Care Unit, First Hospital of Wuhan, Wuhan, Hubei, People’s Republic of China; 3Department of Intensive Care Unit, Guangzhou First People’s Hospital, School of Medicine, South China University of Technology, Guangzhou, Guangdong, People’s Republic of China
Correspondence: Xiangjun Bai, Trauma Center/Department of Emergency and Traumatic Surgery, Tongji Hospital of Tongji Medical College, Huazhong University of Science and Technology, Wuhan, 430030, People’s Republic of China, Email [email protected]
Purpose: The Geriatric Trauma Outcome Score (GTOS) has been developed and indicate to be a valid prognostic tool for the prediction of mortality in geriatric trauma patients (GTPs) during hospitalization. However, the predictive value of the GTOS for morbidity is still unclear. We aimed to evaluate the association between GTOS, morbidity and mortality in GTPs.
Patients and Methods: We performed a retrospective cohort study between June 1, 2016, and May 31, 2020, and collected data for patients aged 65 years or older. These patients were treated at the Trauma Center of Tongji Hospital, Wuhan, China. Clinical data were retrieved from the trauma registry. The GTOS was calculated with the following formula: age + ISS * 2.5 + 22 (if any packed red blood cells were transfused within 24 hours after admission). The outcomes were mortality, morbidity, length of hospital stay (LOS), and functional outcome at discharge.
Results: A total of 485 patients were enrolled: 214 (44.1%) were classified into the low-GTOS group, and 271 (55.9%) were classified into the high-GTOS group. The median (IQR) age was 68 (66– 71) years; 361 (74.4%) were male. The most common mechanism of injury was vehicle collision (66.4%), followed by falls < 2 m (19.6%). The median (IQR) ISS was 18 (14– 22). The median (IQR) GCS was 13 (9– 15). A high GTOS was associated with high rates of all-cause mortality (13.3% vs 0.9%, P < 0.001), complications (88.2% vs 31.8%, P < 0.001), unplanned intubation (19.2% vs 1.4%, P < 0.001), and unplanned admissions to the intensive care unit (8.5% vs 0.5%, P < 0.001). In multivariable logistic regression analysis, GTOS was associated with morbidity (OR 1.07, 95% CI, 1.05– 1.09, p < 0.001) and mortality (OR 1.04, 95% CI, 1.02– 1.06, p < 0.001).
Conclusion: The GTOS is an independent predictor of morbidity and mortality in GTPs, and it will help us identify patients at high risk on admission.
Keywords: Geriatric Trauma Outcome Score, geriatric trauma patients, predictive value
Introduction
With the decline in fertility and the prolongation of the average lifespan, the aging of the global population is accelerating, which has led to a significant increase in the number of elderly patients who experience trauma. Compared with young patients, elderly trauma patients have the characteristics of a high comorbidity rate, high disability rate, high mortality rate, and high medical resource utilization rate.1 Given the same trauma severity, elderly trauma patients have a higher long-term risk of mortality than their younger counterparts.2 It’s reported that the overall in-hospital mortality of geriatric trauma patients was 11.8%.3 For elderly trauma patients, traditional clinical indicators such as blood pressure and age are not sufficient for the identification of individuals who are at risk for poor outcomes.4,5
Recently, a new effective assessment system called the Geriatric Trauma Outcome Score (GTOS) was designed to predict mortality in geriatric inpatients after trauma. The GTOS was developed through a retrospective study of trauma registry data for 3841 elderly trauma patients over the course of 13 years. It contains three variables: 1) age; 2), ISS*2.5; and 3) whether a blood transfusion was performed within 24 hours of admission (22 points).6 The Prospective Assessment of Life and Limitations After Trauma in the Elderly [PALLIATE] consortium validated the GTOS score for the prediction of inpatient mortality with a multicenter data set.7,8 The GTOS was used to estimate the probability of dying in 18,282 patients with a high degree of accuracy, as reflected in the area under the curve (AUC) of 0.86, which was comparable to the AUC (0.82) in the original Parkland sample of 3841 patients.7 Another multicenter study showed that the GTOS has a similar accuracy for the prediction of mortality in elderly trauma patients as other systems, such as the TRISS.9 Subsequently, a second iteration of the GTOS formula was generated and validated for use in predicting discharge destination in surviving patients.10
While the GTOS has been shown to be highly accurate in the prediction of long-term mortality, it does not offer any information about morbidity and mortality in geriatric trauma patients (GTPs) during hospitalization. Because all three variables (age, ISS and blood transfusion or not) of GTOS were shown to be associated with morbidity, we hypothesized that GTOS could be used to predict the risk of morbidities in elderly patients. Therefore, the purposes of this study were 1) to evaluate the association between GTOS and morbidity elderly trauma patients during hospitalization; 2) to validate the predictive value of GTOS on mortality.
Materials and Methods
Patient Data
We performed a retrospective survey between June 1, 2016, and May 31, 2020, to obtain data for patients aged 65 years or older who were treated at the Trauma Center of Tongji Hospital affiliated with Tongji Medical College of Huazhong University of Science and Technology, Wuhan, China. Patients who died within the first 48 hours were excluded, as these patients might bias the results as a self-fulfilling prophecy. Ethics approval was obtained from the institutional Human Research Ethics Committee for the collection of data from the medical records, and the need to obtain individual patient consent was waived.
Clinical data were abstracted from trauma registry, which were assessed and cross-checked to obtain age, sex, mechanism of injury (MOI), comorbidities, Injury Severity Score (ISS) and Glasgow Coma Score (GCS) at admission, blood transfusion (BT) unit within the first 24 h of admission, morbidity and mortality, length of hospital stay (LOS), and key admission information about the injury details.
ISS
The abbreviated injury scale (AIS) dictionary of anatomical lesions (version 2005) was used to obtain the ISS. In the calculation of ISS, the three body areas with major injury are selected and the injury with the highest AIS score (0–6) within each of these three areas is selected. The ISS is the sum of squares of the highest AIS score in these body regions, and the sum of them gives a score between 1 and 75 points. If a lesion is assigned an AIS score of 6, it automatically results in ISS 75.11
Ageless Charlson Comorbidity Index (aCCI)
The patients’ increasing age is usually associated with a higher rate of comorbidities and this burden can be assessed by the Charlson Comorbidity Index (CCI), a validated score to estimate multiple comorbidities in patients.12–14 Since GTOS include age as covariant already, ageless-Charlson Comorbidity Index was used to assess the comorbidities of patients (See Appendix).
Stratification
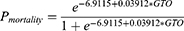
The GTOS was calculated by the following formula [Equation 1]: age+ ISS*2.5+22 (transfusion within 24 h of admission). According to the logistic model of the GTOS (Equation 2) corresponding to the mortality rate (7.8%) in the sample we collected, patients were categorized into low-GTOS and high-GTOS groups (low GTOS: GTOS≤113.5 and high GTOS: GTOS>113.5).

Outcomes
The primary outcome was morbidity. Secondary outcomes included all-cause in-hospital mortality, LOS and functional outcomes. Morbidity was defined as any of Pennsylvania Trauma Outcomes Study (PTOS)-defined complications and included pneumonia, acute kidney dysfunction, cardiovascular complications (myocardial infarctions), coagulopathy, catheter-associated infection (urinary tract infection and/or central venous system infection), venous thromboembolic events (pulmonary embolism and/or deep vein thrombosis) and gastrointestinal bleeding (See Appendix). Unplanned admission to the ICU, unplanned intubation and unplanned operation were additional observational indices. The Extended-Glasgow Outcome Scale (GOS-E) on discharge was used as a marker of function, and it consists of 8 self-reported levels of health status (1—death, 2—vegetative state, 3—lower severe disability, 4—upper severe disability, 5—lower moderate disability, 6—upper moderate disability, 7—lower good recovery, 8—upper good recovery).
Statistics
The Shapiro–Wilk test was used to test the normality of quantitative data. Normally distributed data are presented as the means and standard deviations (SDs), and nonnormally distributed data are presented as the medians and interquartile ranges (IQRs). Continuous data were compared using Student’s t-tests or Wilcoxon rank-sum tests as appropriate. Chi-square tests and Fisher’s exact tests were used for categorical variables. Univariate analysis was performed to assess the association between factors and outcomes. Factors at P≤0.2 were entered into a multivariate analysis. Multivariate analyses were performed using logistic regression for the impact of GTOS, the factors associated with morbidity and mortality. Odds ratios (ORs) and 95% confidence indexes (CIs), were reported as the result in the final model. Pearson’s correlation coefficient and linear regression were used to evaluate the relationship between GTOS and LOS. The GTOS was evaluated to determine the cutoff points that could predict the risk of morbidity and mortality by plotting the receiver operating characteristic (ROC) curve. The Youden index was calculated as the sensitivity + specificity −1 to reflect the predictive validity. A result was considered statistically significant if the P value was <0.05. The statistical analysis was performed using R version 4.0.2 with extension packages.
Results
Descriptive Data
A total of 506 geriatric trauma patients were admitted at the Trauma Center of Tongji hospital between June 1, 2016 and May 31, 2020. After excluding patients who died within the first 48 hours, 485 patients were finally included (Figure 1). All quantitative data in this sample were not distributed normally according to the Shapiro–Wilk test (See Appendix). The median (IQR) age was 68 (66–71) years, and the majority (74.4%) of patients were male. The MOI of 322 (66.4%) patients was vehicle collision, followed by falls <2 m (19.6%). Hypertension, diabetes mellitus, and coronary heart disease were the most common comorbidities present in this sample. The head/neck, thorax and abdomen/pelvis were the most commonly injured parts of the body. The median (IQR) ISS and GCS at admission were 18 (14–22) and 13 (9–15), respectively. A total of 144 (29.7%) patients received BT within 24 h of admission, with a median (IQR) of 4 (4–6) IU (Table 1). Among the 144 patients, majority of them were transfused with 4 IU of red blood cells (n=63, 43.8%), followed by those transfused with 6 IU of red blood cells (n=35, 24.3%). 24 (16.7%) patients received ≥8IU red blood cells, and 17 (11.8%) patients received ≤3 IU.
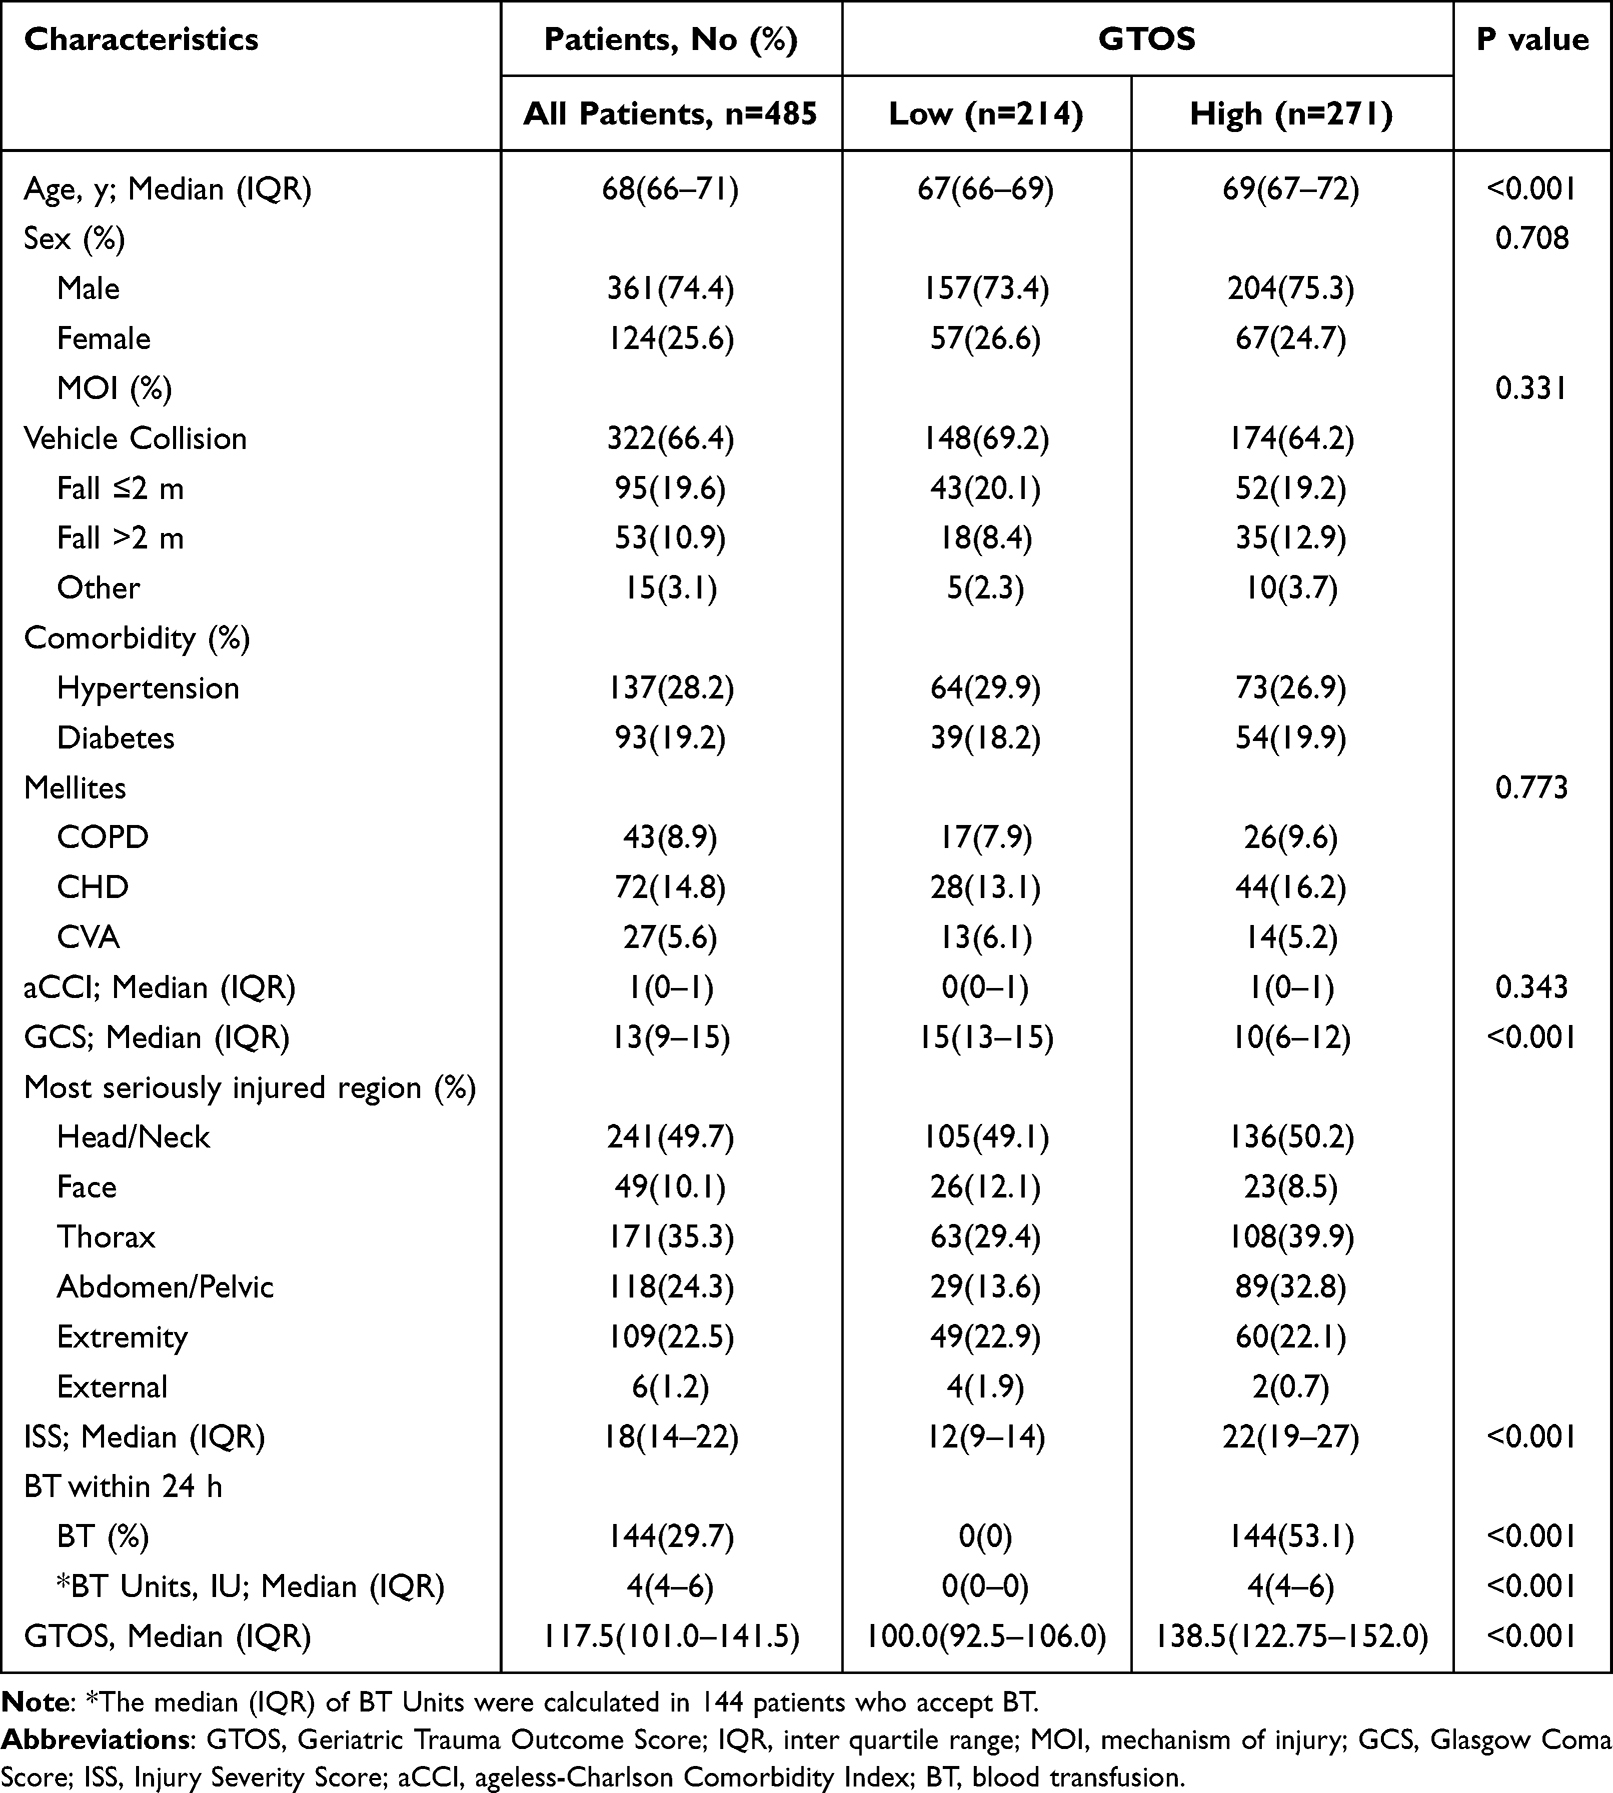 |
Table 1 Demographic and Hospital Data of 485 Patients |
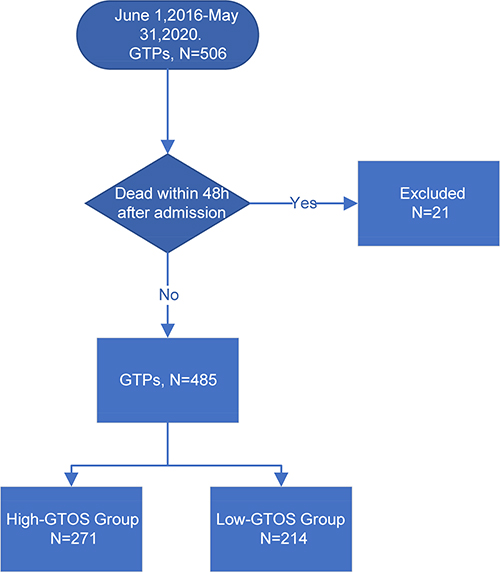 |
Figure 1 Flow diagram of the study population. |
A total of 214 (44.1%) patients were classified into the low-GTOS group, and 271 (55.9%) were classified into the high-GTOS group. There were no significant differences in sex (P=0.708), MOI (P=0.331), comorbidities (P=0.773), or aCCI (P=0.343) between the groups. The most serious injury regions were commonly found in the head/neck (49.1%), chest (29.4%) and extremities (22.9%) in low-GTOS groups. Besides the head (50.2%), chest (39.9%) and extremities (22.1%), the abdomen/pelvic (32.8%) was also a common site injured most seriously in high-GTOS group. Patients in high-GTOS group suffered more severe injuries than patients in low-GTOS group (ISS 22 (19–27) vs 12 (9–14), P<0.001), with a lower GCS (10 (6–12) vs 15 (13–15), P<0.001). In addition, all 144 patients who received BT were classified into the high-GTOS group. The demographic and hospital data of 485 patients are listed in Table 1.
Incidences of Outcomes
The high-GTOS group had a significantly higher morbidity rate than the low-GTOS group (88.2% versus 31.8%, P<0.001). The most common medical complication experienced by all patients was pneumonia (13.6% and 59.8% in the low- and high-GTOS groups, respectively, Table 2). The high-GTOS group had a higher rate of medical complications, including unplanned admission to the ICU and unplanned intubation (Table 2). However, there was no difference in the proportions of patients undergoing unplanned operative interventions between the two groups (p=0.123, Table 2). In addition, patients in the high GTOS group had higher mortality than those in the low GTOS group (13.3% versus 0.9%, P<0.001).
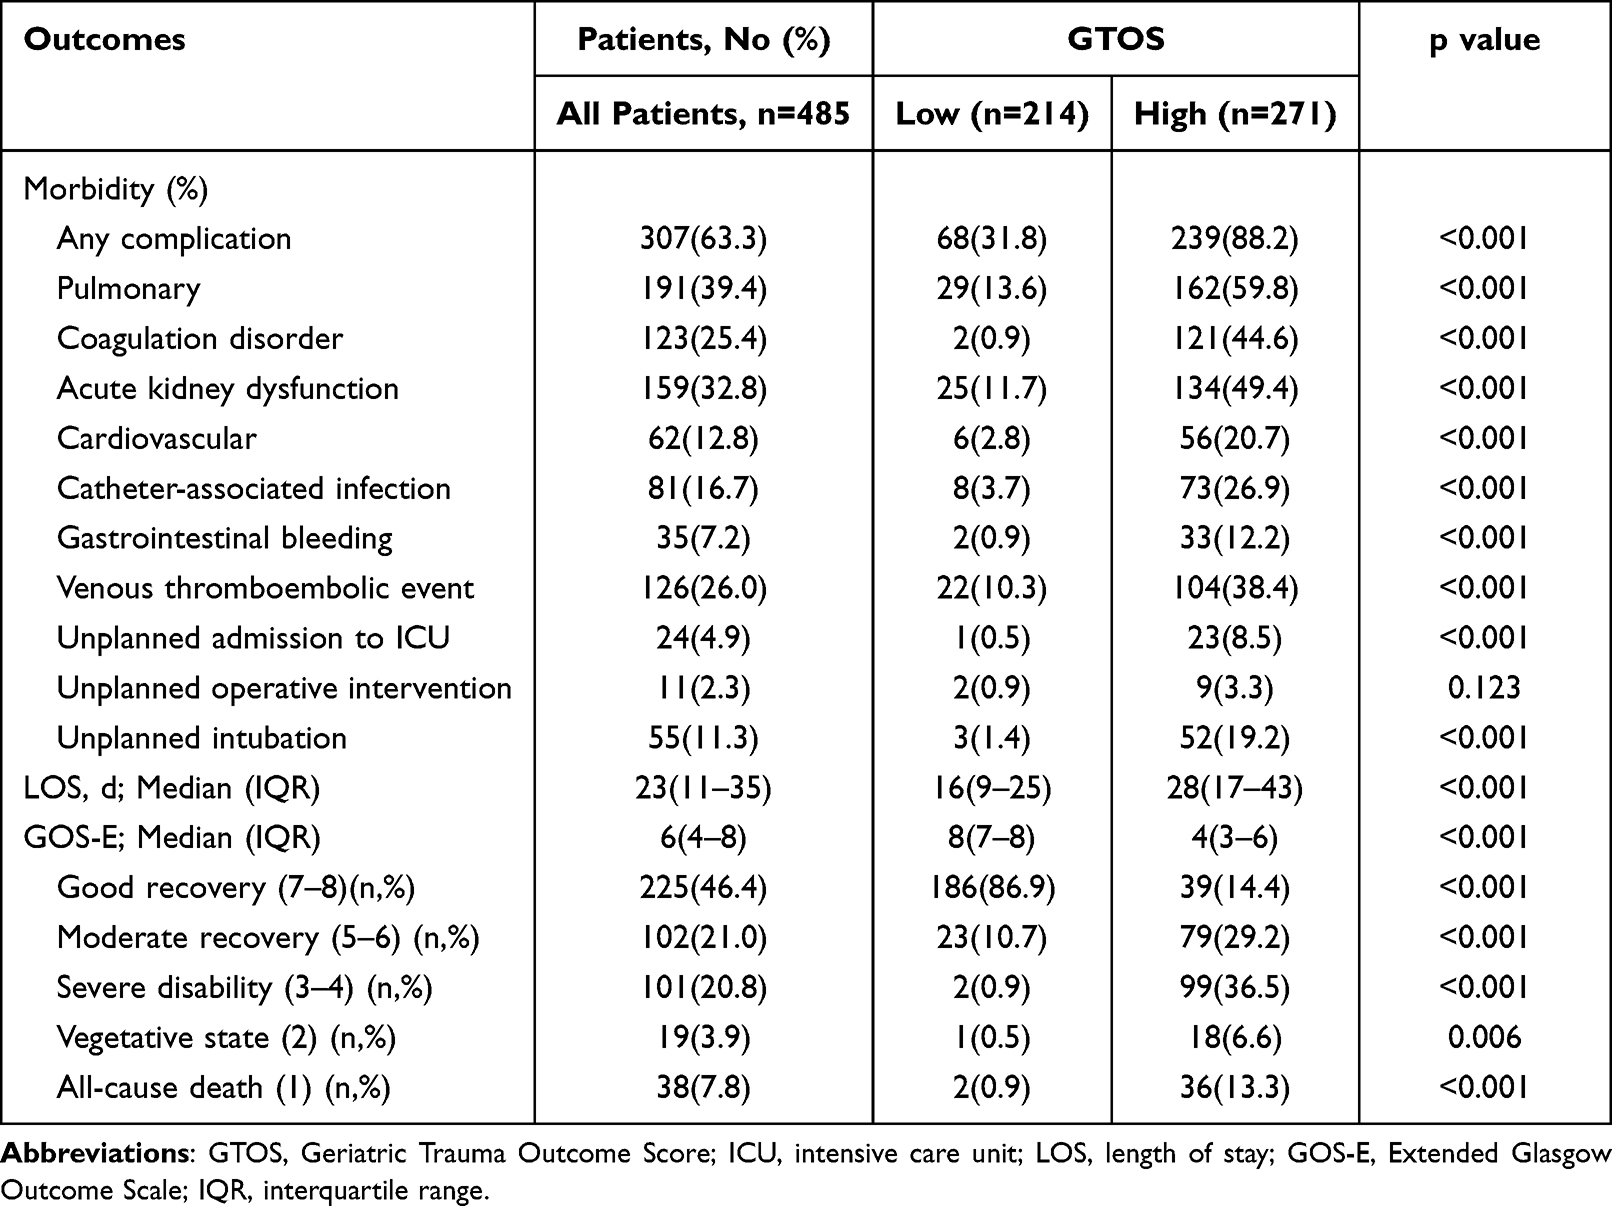 |
Table 2 Incidences of Outcomes |
The median LOS of the high-GTOS group was longer than that of the low-GTOS group (16 (9–25) days and 28 (17–43) days in the low- and high-GTOS groups, respectively, P<0.001; Table 2). LOS was positively correlated with GTOS after a liner regression was performed (r=0.38, P<0.001; Figure 2).
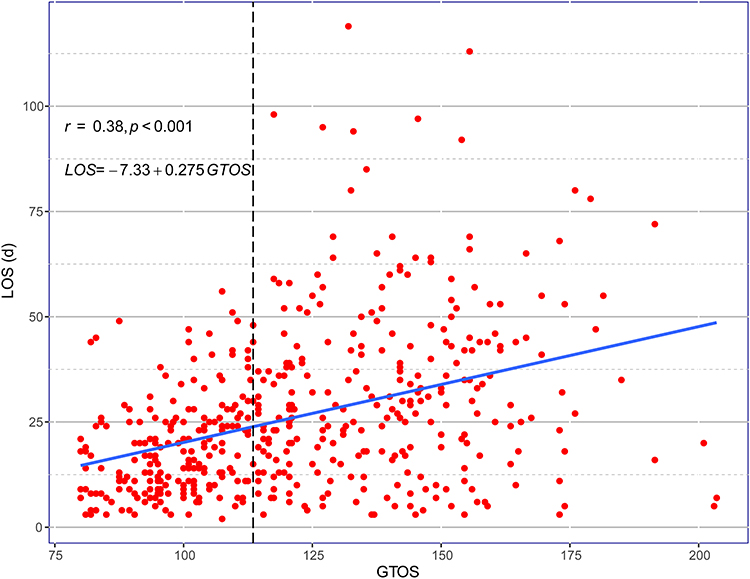 |
Figure 2 Scatterplots and regression lines reflecting the linear correlations between GTOS and LOS (dotted line GTOS= 113.5). |
In terms of the functional outcome, as expected, severe disability (36.5%) was the most common functional status in the high-GTOS group, while good recovery (86.9%) was the most common functional status in the low-GTOS group. The probability of severe disability and vegetative state was only 0.9% and 0.5%, respectively, in the low-GTOS group. After adjusting the P value by the Bonferroni method, the levels of physiological function were statistically different in both groups. Patients with a high GTOS had worse functional outcomes than those with a low GTOS (GOS-E: 4(3–6) and 8(7–8) in the high- and low-GTOS groups, respectively, P<0.001; Table 2).
On multivariable logistic regression after adjusting for sex, MOI, aCCI and GCS, GTOS was a risk predictor of morbidity (OR 1.07, 95% CI, 1.05–1.09, p<0.001) and mortality (OR 1.04, 95% CI, 1.02–1.06, p<0.001). Patients’ risk of pulmonary, coagulation disorder, acute kidney dysfunction, cardiovascular, catheter-associated infection, venous thromboembolic events and gastrointestinal bleeding increased with the increase in GTOS (Table 3).
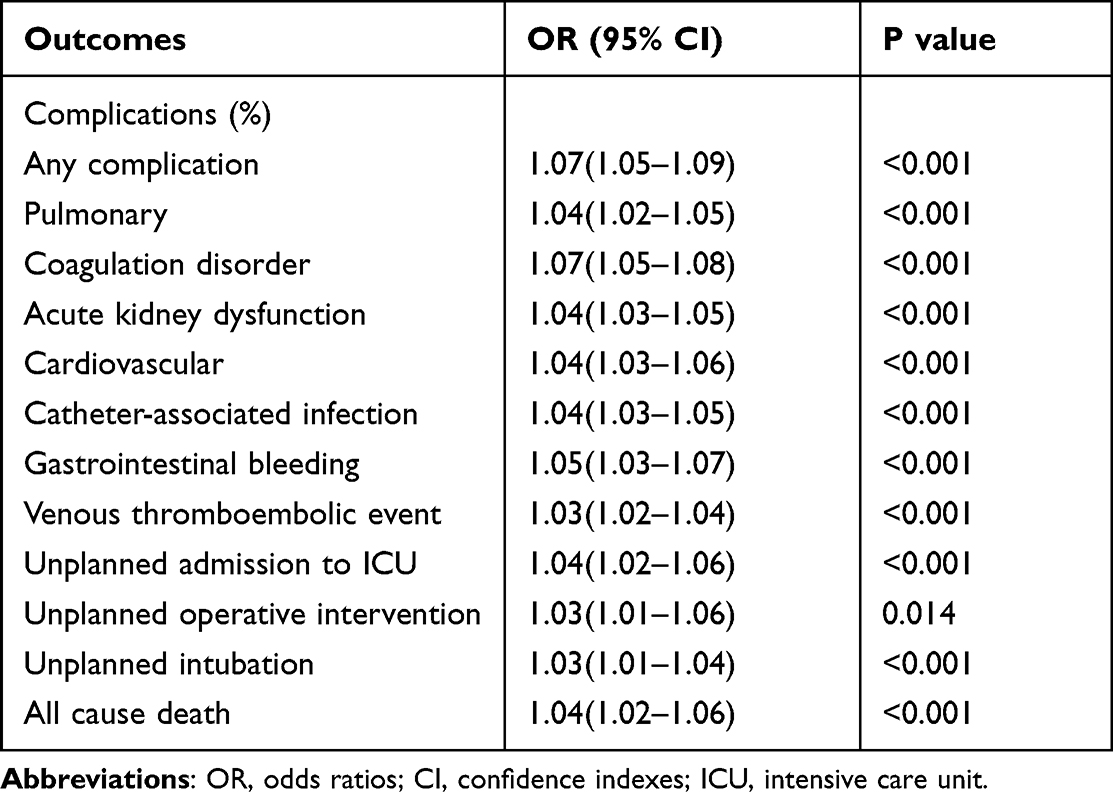 |
Table 3 Multivariable Logistic Regression Predicting the Impact of GTOS |
Factors Associated with Morbidity
After adjusting for significant variables in multivariate analysis, independent predictors of morbidity were age (OR 1.13, 95% CI, 1.06–1.21, p<0.001), ISS (OR 1.08, 95% CI, 1.02–1.15, p=0.013), GCS (OR 0.78, 95% CI, 0.70–0.85, p<0.001) and BT within 24h (OR 3.31, 95% CI, 1.73–6.59, p<0.001). The results of univariate and multivariate analyses of factors for morbidity are listed in Table 4.
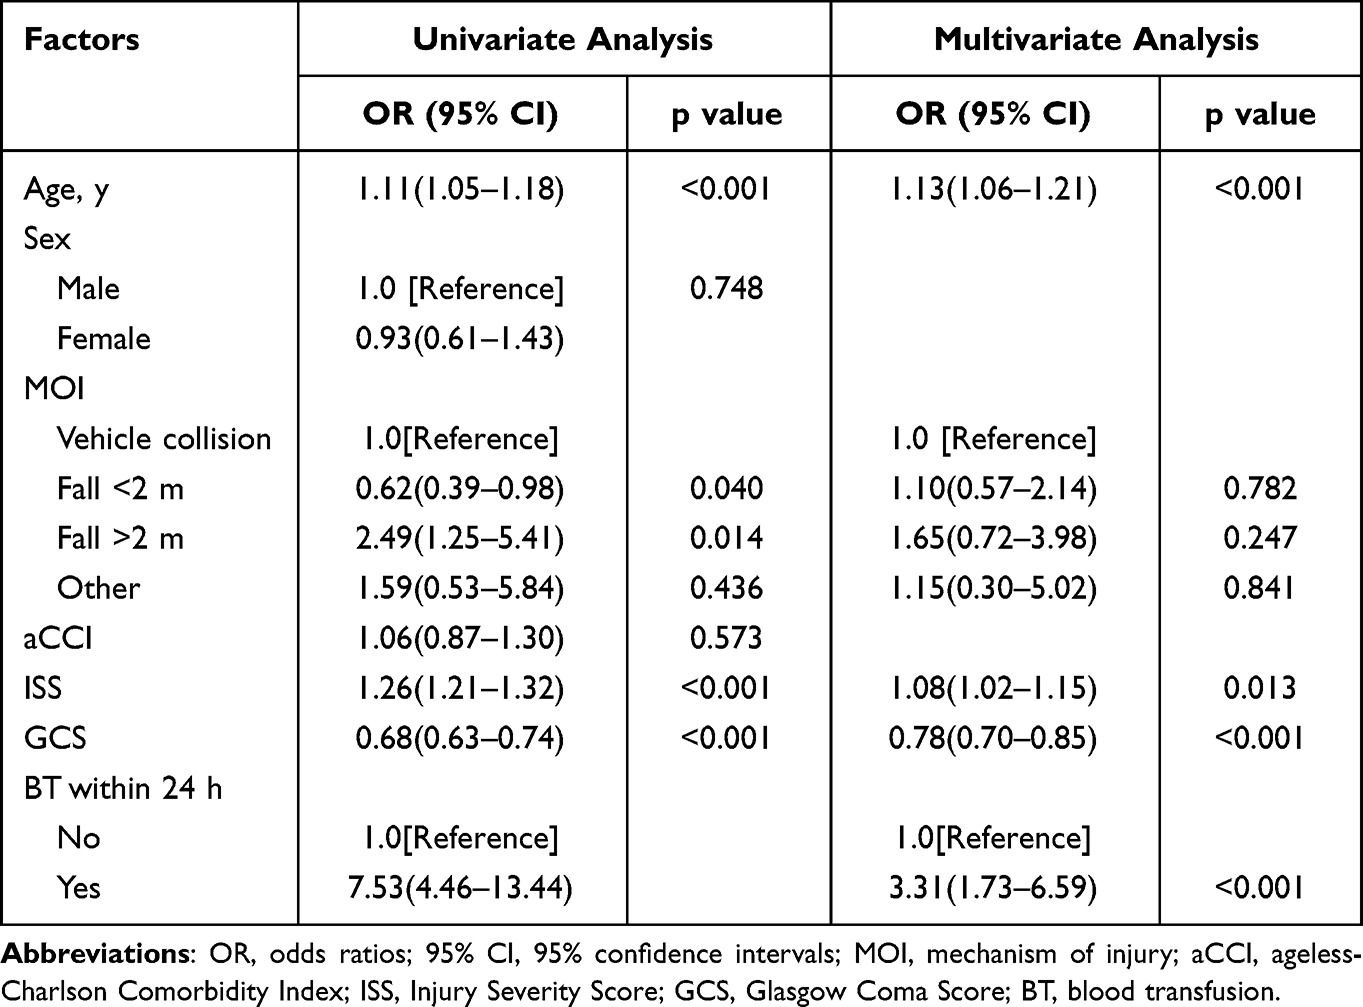 |
Table 4 Univariate and Multivariate Analysis of Factors for Morbidity |
Factors Associated with Mortality
After adjusting for significant variables in multivariate analysis, independent predictors of mortality were age (OR 1.15, 95% CI, 1.06–1.25, p<0.001), GCS (OR 0.80, 95% CI, 0.71–0.89, p<0.001) and BT within 24h (OR 2.72, 95% CI, 1.24–6.25, p=0.015). The results of univariate and multivariate analyses of factors for mortality are listed in Table 5.
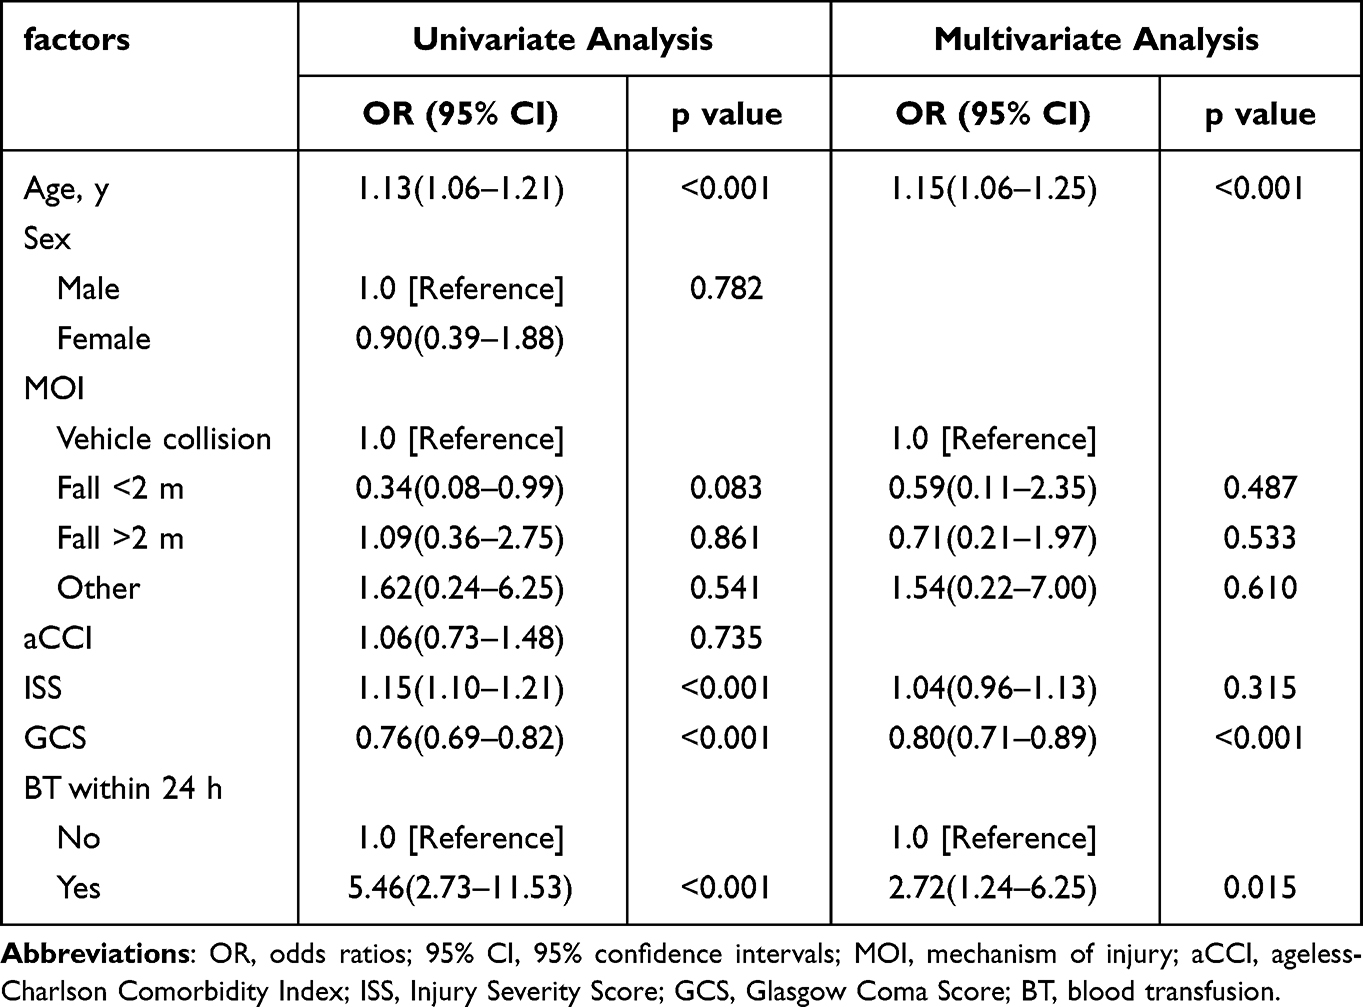 |
Table 5 Univariate and Multivariate Analysis of Factors for Mortality |
ROC Curve and Calibration Curve Analysis
According to the ROC curve, a GTOS of 116 was identified as the most appropriate cutoff point for the prediction of morbidity, with an AUC of 0.87 (95% CI, 0.84–0.90, Figure 3). For mortality, 123 was the best cutoff value of the GTOS for the identification of patients at high risk, with an AUC of 0.84 (95% CI, 0.79–0.89, Figure 3). The sensitivity, specificity, positive predictive value, negative predictive value, positive and negative likelihood ratio and their 95% CI are listed in Table 6.
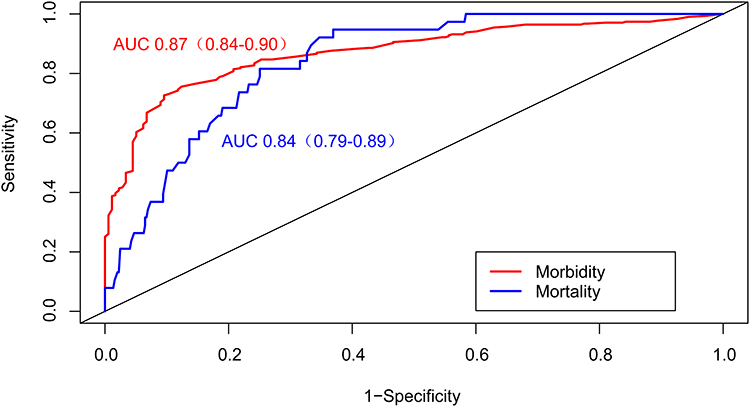 |
Figure 3 ROC of GTOS for predicting morbidity and mortality. |
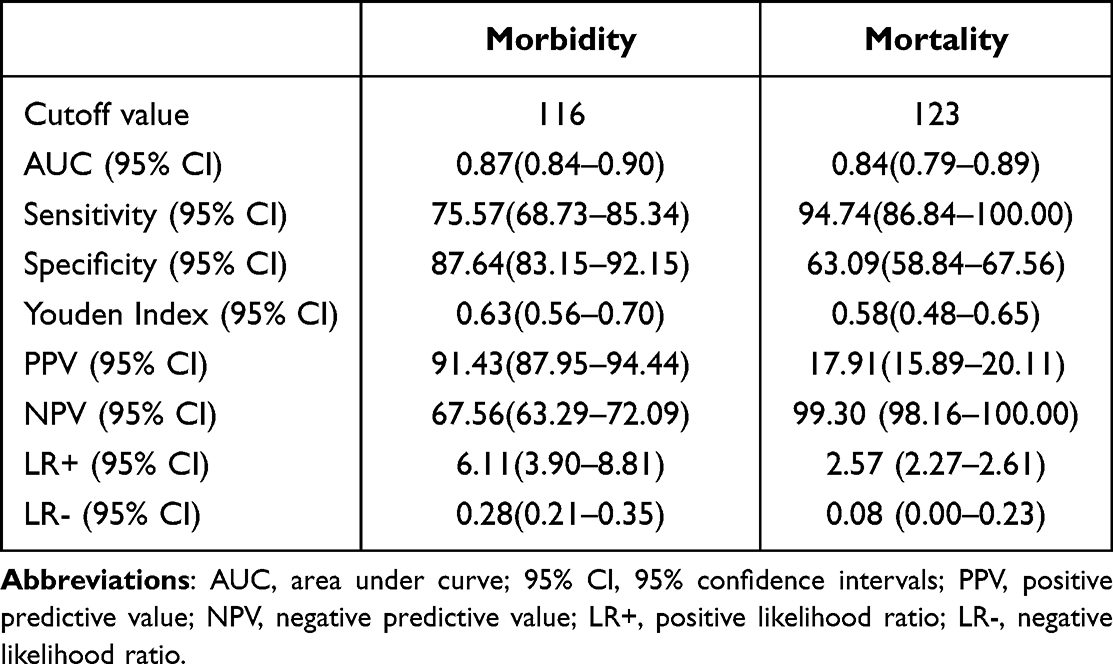 |
Table 6 Accuracy of Using GTOS to Predict Morbidity and Mortality |
The correlation between morbidity or mortality observed and predicted by GTOS is shown in Figures 4 and 5. The result of the Hosmer-Lemeshow test for morbidity was χ2=10.30, p=0.245. The result of the Hosmer-Lemeshow test for mortality was χ2=5.12, p=0.745.
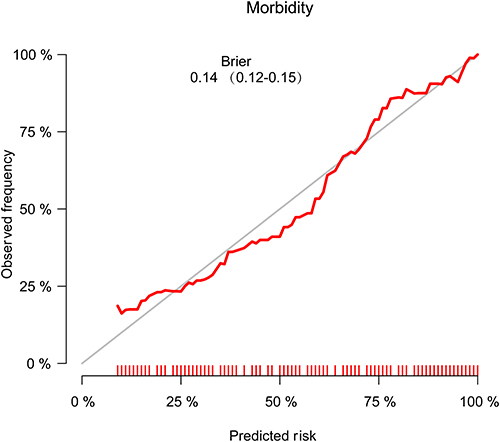 |
Figure 4 Calibration curves comparing the morbidity observed with the prediction of GTOS. |
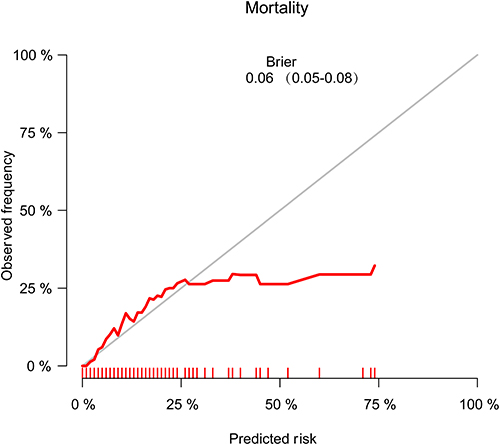 |
Figure 5 Calibration curves comparing the mortality observed with the prediction of GTOS. |
Discussion
This study investigated the predictive validity of a new system called the GTOS for the evaluation of morbidity and mortality in GTPs and found that GTPs with a high GTOS are more likely to have morbidity and mortality than their counterparts with a low GTOS during hospitalization. What’s more, GTOS can be used as a valid tool to predict the risk of morbidity and mortality during hospitalization in GTPs, with a high degree of discrimination and calibration.
There are few studies on the association between GTOS and morbidity in GTPs during hospitalization. Our results demonstrate that the risk of morbidity increases with increasing GTOS after adjusting for age, sex, MOI, aCCI, ISS and GCS. The proportion of patients experiencing major complications, such as pneumonia, coagulation disorder and acute kidney injury, was higher in those with high GTOS. GTOS is associated with the likelihood of a surviving GTP’s discharge destination. As Cook et al reported, the increase in GTOS was accompanied by an increased probability of unfavorable discharge disposition, which implied a loss of independence.8 Similarly, the median GOS-E score in the high-GTOS group was lower than that in the low-GTOS group. The rates of severe disability and vegetative state in the high-GTOS group were higher than those in the low-GTOS group, and the high-GTOS group took longer to recover.
It has been reported that a massive transfusion is associated with various adverse complications and that the units of red blood cells matter when determining the probability of mortality.15,16 Massive amounts of blood transfusion can lead to a variety of serious complications, such as coagulation dysfunction, immunosuppression, respiratory system damage, hypothermia, and infection.17 In the calculation of GTOS, the influence of the blood transfusion unit on body function was ignored while adding a score of 22 regardless of the blood unit transfused. Notably, trauma patients with a high GTOS were transfused with more units of red blood cells than those with a low GTOS. In the formula for the GTOS, 22 points are added if a trauma patient is transfused with red blood cells within 24 h, regardless of the amount transfused. If patients with similar baseline characteristics require transfusion with different quantities of red blood cells, their outcomes would likely be different, although their GTOSs would be the same. As a result, the risk of adverse outcomes may be underestimated by the GTOS, especially for patients who require massive transfusions.15 However, in our study, the predicted risks of morbidity and mortality by GTOS were not significantly different from the observed frequencies (Figures 4 and 5).
The severity of injury is an important factor that must be considered when trauma outcomes are analyzed. However, as a one-dimensional description, ISS necessarily disregards the details, and sometimes very different types of injuries are assigned the same score.18 For example, the severity of traumatic brain injury (TBI) mostly triggers the prognosis of GTPs.19 The GCS is a strong indicator to assess the severity of TBI. In our sample, 49.7% of GTPs presented TBI with a head AIS ≥3. The GCS score was also an independent predictor of morbidity and mortality in our study, which is consistent with the findings of Rupprecht et al, who showed that patients with a GCS score<12 had a twofold increase in mortality compared with patients with a GCS score≥12 (mortality, 39% vs 83%, respectively).20
The TRISS system was developed in the 1980s as a predictive tool for patient prognosis after trauma. With advancements in trauma care and improvements in statistical theory, numerous limitations of the TRISS have been identified. It was found to have high misclassification rates in older patients with severe trauma and head injuries (ISS>20, age>54 years).21 Moreover, the primary limitation of the TRISS is its reliance on physiological measures, which are particularly unstable and vary widely on the basis of the quality of out-of-hospital care and time to hospital presentation, making it unlikely to be a reliable predictor of outcomes across a variety of trauma populations.22 However, given its advantage of durability, the TRISS remains the most well-known prognostic calculator and is recognized as the gold standard for common trauma patients.18 The GTOS and TRISS function similarly and accurately for the prediction of the probability of mortality in injured elderly individuals.9,23 Compared with the TRISS, the GTOS has the advantages of a single formula, fewer variables, and no reliance on data collected in the emergency room or by other observers.23
The GTOS system is highly accurate for the prediction of mortality, and compared with the AUC (0.69) for the TRISS reported by Barea-Mendoza JA,9 the GTOS has better predictive validity for all-cause mortality, with an AUC of 0.84 (95% CI, 0.79–0.89) in our data. Similarly, Ahl et al regarded GTOS as a reliable tool for estimating the probability of dying (AUC 0.88).24 Being confirmed by multicenter external validation in a North American cohort, GTOS predicts the probability of mortality with a high degree of accuracy (AUC 0.86).7 Moreover, it is also a good predictor of morbidity, with an AUC of 0.87, which has not previously been reported.
Our study has several limitations. First, it was a retrospective, observational and single-center study. It was impossible to ensure that all patients received standardized management. The data for this study were exported from trauma registry that rely on manual coding and data entry, so there was no way to ensure that all patients, comorbidities, or outcomes were captured accurately. Second, we could not determine the functional status of the patients before the injury. This may have exaggerated the predictive value of the GTOS for the postinjury functional status. Additionally, although useful for short-term predictions, the predictive value of the GTOS for long-term outcomes in patients who survive to discharge from the hospital remains unknown due to the lack of data.
Conclusion
Consisting of three variables, the GTOS can accurately evaluate not only in-hospital mortality but also the occurrence of morbidity, LOS, and functional prognosis in GTPs. This will help us identify patients at high risk on admission. Directing patients with higher GTOSs to more advanced levels of care will mitigate unanticipated adverse outcomes.
Abbreviations
GTOS, Geriatric Trauma Outcome Score; GTPs, geriatric trauma patients; LOS, length of hospital stay; GOS-E, Extended Glasgow Outcome Scale; ROC, receiver operating characteristic; AUC, area under the curve; SDs, standard deviations; IQRs, interquartile ranges; ORs, odds ratios; CIs, confidence indexes; MOI, mechanism of injury; aCCI, ageless-Charlson Comorbidity Index; ISS, Injury Severity Score; GCS, Glasgow Coma Score; BT, blood transfusion; TBI, traumatic brain injury.
Data Sharing Statement
The data are presented within the paper.
Ethics Approval and Informed Consent
Ethical approval was not required by the Institutional Review Board of Tongji Hospital of Tongji Medical College as all data were routinely collected and held as part of usual clinical practice. The need to obtain individual patient consent was waived because of retrospective and risk free. Our study was carried out in accordance with the Declaration of Helsinki.
Acknowledgments
The authors would like to thank all staff from the trauma center, Tongji Hospital.
Author Contributions
All authors made a significant contribution to the work reported, whether that is in the conception, study design, execution, acquisition of data, analysis and interpretation, or in all these areas; took part in drafting, revising or critically reviewing the article; gave final approval of the version to be published; have agreed on the journal to which the article has been submitted; and agree to be accountable for all aspects of the work.
Funding
This study was supported by grants from the National Natural Science Foundation of China (Grant No. 82002101, 81571891, 81772129).
Disclosure
The authors declare no conflict of interest.
References
1. Perdue PW, Watts DD, Kaufmann CR, Trask AL. Differences in mortality between elderly and younger adult trauma patients: geriatric status increases risk of delayed death. J Trauma-Injury Infection Crit Care. 1998;45(4):805–810. doi:10.1097/00005373-199810000-00034
2. Kuhne CA, Ruchholtz S, Kaiser GM, Nast-Kolb D, Trauma W. Mortality in severely injured elderly trauma patients - when does age become a risk factor? World J Surg. 2005;29(11):1476–1482. doi:10.1007/s00268-005-7796-y
3. Miyoshi Y, Kondo Y, Hirano Y, et al. Characteristics, injuries, and clinical outcomes of geriatric trauma patients in Japan: an analysis of the nationwide trauma registry database. Sci Rep. 2020;10(1). doi:10.1038/s41598-020-76149-4
4. Brown JB, Gestring ML, Forsythe RM, et al. Systolic blood pressure criteria in the national trauma triage protocol for geriatric trauma: 110 is the new 90. J Trauma Acute Care. 2015;78(2):352–359. doi:10.1097/TA.0000000000000523
5. Brown CVR, Rix K, Klein AL, et al. A comprehensive investigation of comorbidities, mechanisms, injury patterns, and outcomes in geriatric blunt trauma patients. Am Surg. 2016;82(11):1055–1062. doi:10.1177/000313481608201119
6. Zhao FZ, Wolf SE, Nakonezny PA, et al. Estimating geriatric mortality after injury using age, injury severity, and performance of a transfusion: the geriatric trauma outcome score. J Palliat Med. 2015;18(8):677–681. doi:10.1089/jpm.2015.0027
7. Cook AC, Joseph B, Inaba K, et al. Multicenter external validation of the geriatric trauma outcome score: a study by the Prognostic Assessment of Life and Limitations After Trauma in the Elderly (PALLIATE) consortium. J Trauma Acute Care Surg. 2016;80(2):204–209. doi:10.1097/TA.0000000000000926
8. Cook AC, Joseph B, Mohler MJ, et al. Validation of a geriatric trauma prognosis calculator: a PALLi.ATE consortium study. J Am Geriatr Soc. 2017;65(10):2302–2307. doi:10.1111/jgs.15009
9. Barea-Mendoza JA, Chico-Fernández M, Sánchez-Casado M, et al. Predicting survival in geriatric trauma patients: a comparison between the TRISS methodology and the geriatric trauma outcome score. Cir Esp. 2018;96(6):357–362. doi:10.1016/j.cireng.2018.02.017
10. Cook A, Joseph B, Mohler J, et al. Multicenter validation of a prognosis calculator predicting discharge disposition after geriatric trauma: a PALLIATE Consortium study. J Am Geriatr Soc. 2016;64:S149–S149.
11. Baker SP, O’Neill B, Haddon W
12. Barz M, Bette S, Janssen I, et al. Age-adjusted Charlson comorbidity index in recurrent glioblastoma: a new prognostic factor? BMC Neurol. 2022;22(1):32. doi:10.1186/s12883-021-02532-x
13. Charlson ME, Carrozzino D, Guidi J, Patierno C. Charlson comorbidity index: a critical review of clinimetric properties. Psychother Psychosom. 2022;91(1):8–35. doi:10.1159/000521288
14. Charlson ME, Pompei P, Ales KL, MacKenzie CR. A new method of classifying prognostic comorbidity in longitudinal studies: development and validation. J Chronic Dis. 1987;40(5):373–383. doi:10.1016/0021-9681(87)90171-8
15. Wu SC, Rau CS, Kuo PJ, Liu HT, Hsu SY, Hsieh CH. Significance of blood transfusion units in determining the probability of mortality among elderly trauma patients based on the geriatric trauma outcome scoring system: a cross-sectional analysis based on trauma registered data. Int J Environ Res Public Health. 2018;15(10):2285. doi:10.3390/ijerph15102285
16. Marik PE, Corwin HL. Efficacy of red blood cell transfusion in the critically ill: a systematic review of the literature. Crit Care Med. 2008;36(9):2667–2674. doi:10.1097/CCM.0b013e3181844677
17. Li D, Zhang W, Wei X. Effect of massive transfusion protocol on coagulation function in elderly patients with multiple injuries. Comput Math Methods Med. 2021;2021:2204542. doi:10.1155/2021/2204542
18. Lefering R. Trauma scoring systems. Curr Opin Crit Care. 2012;18(6):637–640. doi:10.1097/MCC.0b013e3283585356
19. Hukkelhoven CW, Steyerberg EW, Rampen AJ, et al. Patient age and outcome following severe traumatic brain injury: an analysis of 5600 patients. J Neurosurg. 2003;99(4):666–673. doi:10.3171/jns.2003.99.4.0666
20. Rupprecht H, Heppner HJ, Wohlfart K, Turkoglu A. The geriatric polytrauma: risk profile and prognostic factors. Ulus Travma Acil Cerrahi Derg. 2017;23(2):156–162. doi:10.5505/tjtes.2016.77177
21. Demetriades D, Chan LS, Velmahos G, et al. TRISS methodology in trauma: the need for alternatives. Br J Surg. 1998;85(3):379–384. doi:10.1046/j.1365-2168.1998.00610.x
22. Gabbe BJ, Cameron PA, Wolfe R. TRISS: does it get better than this? Acad Emerg Med. 2004;11(2):181–186. doi:10.1111/j.1553-2712.2004.tb01432.x
23. Madni TD, Ekeh AP, Brakenridge SC, et al. A comparison of prognosis calculators for geriatric trauma: a prognostic assessment of life and limitations after trauma in the elderly consortium study. J Trauma Acute Care. 2017;83(1):90–96. doi:10.1097/TA.0000000000001506
24. Ahl R, Phelan HA, Dogan S, Cao Y, Cook AC, Mohseni S. Predicting in-hospital and 1-year mortality in geriatric trauma patients using geriatric trauma outcome score. J Am Coll Surg. 2017;224(3):264–269. doi:10.1016/j.jamcollsurg.2016.12.011
 © 2022 The Author(s). This work is published and licensed by Dove Medical Press Limited. The full terms of this license are available at https://www.dovepress.com/terms.php and incorporate the Creative Commons Attribution - Non Commercial (unported, v3.0) License.
By accessing the work you hereby accept the Terms. Non-commercial uses of the work are permitted without any further permission from Dove Medical Press Limited, provided the work is properly attributed. For permission for commercial use of this work, please see paragraphs 4.2 and 5 of our Terms.
© 2022 The Author(s). This work is published and licensed by Dove Medical Press Limited. The full terms of this license are available at https://www.dovepress.com/terms.php and incorporate the Creative Commons Attribution - Non Commercial (unported, v3.0) License.
By accessing the work you hereby accept the Terms. Non-commercial uses of the work are permitted without any further permission from Dove Medical Press Limited, provided the work is properly attributed. For permission for commercial use of this work, please see paragraphs 4.2 and 5 of our Terms.