")
Back to Journals » OncoTargets and Therapy » Volume 9
Predictive value of mutant p53 expression index obtained from nonenhanced computed tomography measurements for assessing invasiveness of ground-glass opacity nodules
Authors Wang W, Li J, Liu R, Zhang A, Yuan Z
Received 4 December 2015
Accepted for publication 3 February 2016
Published 14 March 2016 Volume 2016:9 Pages 1449—1459
DOI https://doi.org/10.2147/OTT.S101874
Checked for plagiarism Yes
Review by Single anonymous peer review
Peer reviewer comments 3
Editor who approved publication: Professor Min Li
Wei Wang,1 Jian Li,2 Ransheng Liu,1 Aixu Zhang,1 Zhiyong Yuan1
1Department of Radiation Oncology, Tianjin Medical University Cancer Institute and Hospital, National Clinical Research Center of Cancer, Key Laboratory of Cancer Prevention and Therapy, Tianjin, People’s Republic of China; 2Department of Radiology, Tianjin Hospital, Tianjin, People’s Republic of China
Purpose: To predict p53 expression index (p53-EI) based on measurements from computed tomography (CT) for preoperatively assessing pathologies of nodular ground-glass opacities (nGGOs).
Methods: Information of 176 cases with nGGOs on high-resolution CT that were pathologically confirmed adenocarcinoma was collected. Diameters, total volumes (TVs), maximum (MAX), average (AVG), and standard deviation (STD) of CT attenuations within nGGOs were measured. p53-EI was evaluated through immunohistochemistry with Image-Pro Plus 6.0. A multiple linear stepwise regression model was established to calculate p53-EI prediction from CT measurements. Receiver-operating characteristic curve analysis was performed to compare the diagnostic performance of variables in differentiating preinvasive adenocarcinoma (PIA), minimally invasive adenocarcinoma (MIA), and invasive adenocarcinoma (IAC).
Results: Diameters, TVs, MAX, AVG, and STD showed significant differences among PIAs, MIAs, and IACs (all P-values <0.001), with only MAX being incapable to differentiate MIAs from IACs (P=0.106). The mean p53-EIs of PIAs, MIAs, and IACs were 3.4±2.0, 7.2±1.9, and 9.8±2.7, with significant intergroup differences (all P-values <0.001). An equation was established by multiple linear regression as: p53-EI prediction =0.001* TVs +0.012* AVG +0.022* STD +9.345, through which p53-EI predictions were calculated to be 4.4%±1.0%, 6.8%±1.3%, and 8.5%±1.4% for PIAs, MIAs, and IACs (Kruskal–Wallis test P<0.001; Tamhane’s T2 test: PIA vs MIA P<0.001, MIA vs IAC P<0.001), respectively. Although not significant, p53-EI prediction has a little higher area under the curve (AUC) than the actual one both in differentiating MIAs from PIAs (AUC 0.938 vs 0.914, P=0.263) and in distinguishing IACs from MIAs (AUC 0.812 vs 0.786, P=0.718).
Conclusion: p53-EI prediction of nGGOs obtained from CT measurements allows accurately estimating lesions’ pathology and invasiveness preoperatively not only from radiology but also from pathology.
Keywords: ground-glass opacity, adenocarcinoma, computed tomography, CT, high-resolution computed tomography, HRCT, lung
Introduction
Lung cancer is the leading cause of cancer death in the world, of which non-small-cell lung cancer accounts for the majority, with the 5-year survival rate being only 10%–15%.1,2 The introduction of low-dose computed tomography (CT) to lung cancer screening has resulted in an increased detection of lung cancer at the earlier and more curable stages.3 Since a new multidisciplinary classification of lung adenocarcinoma had been proposed by International Association for the Study of Lung Cancer (IASLC), the American Thoracic Society (ATS), and the European Respiratory Society (ERS) in 2011, pathological differentiation of ground-glass opacity (GGO) has been imperative and attractive for thoracic surgeons, as complete resection of preinvasive and minimally invasive adenocarcinoma contributes to 100% 5-year disease-free survival.4,5
GGO is a radiological sign in high-resolution CT (HRCT) consisting of a hazy opacity that does not obscure the underlying bronchial structures or pulmonary vessels.6 As a nonspecific finding, GGO can result from various benign and malignant diseases, including pulmonary edema, alveolar hemorrhage, nonspecific interstitial pneumonia, hypersensitivity pneumonitis, pulmonary alveolar proteinosis, noncaseating granulomatous deposition, sarcoidosis, and adenocarcinoma.7,8 It is reported that nodular ground-glass opacities (nGGOs) account for 19% of all detected pulmonary nodules with only 34% being confirmed malignant.9 This makes it important to diagnose nGGOs before operation, in order to avoid unnecessary surgery. However, it remains a challenge for clinicians to differentiate benign or indolent nGGO from malignant and invasive one, although many CT characteristics of nGGO have been identified indicating its malignancy and prognosis, such as the diameter, volume, mass, attenuation, and heterogeneity.10–14 Understanding pathological–radiological features of nGGOs and their interrelationships has led to changes in diagnostic and therapeutic strategies.15,16 It is necessary to develop a prediction model that can reflect the histopathological features and the radiological characteristics of invasive nGGOs to identify the optimal target population.
The natural development of GGO tumor follows a stepwise progression from atypical adenomatous hyperplasia (AAH) to adenocarcinoma in situ (AIS), to minimally invasive adenocarcinoma (MIA), and finally, to invasive adenocarcinoma (IAC).4 However, some adenocarcinomas do not follow this pathway, manifesting as consolidation and/or solid mass, with different genetic profiles. Therefore, lung adenocarcinoma exhibits heterogeneity in pathogenesis and progression.17 p53 is a tumor suppressor gene that plays a central role in tumor genesis, development, and metastasis; mutation of p53 can be detected by immunohistochemistry, because mutant p53 protein has a prolonged half-life as compared with wild-type p53 protein.18,19 Assessment of mutant p53 protein has been commonly used in clinical diagnosis and prognosis of lung cancer.18,20,21 In this study, we established an objective and accurate prediction model incorporating parameters from CT with immunohistochemical p53 expression for preoperative assessment of pathological status of nGGOs.
Materials and methods
This study was approved by the Institutional Review Board of Tianjin Medical University Cancer Institute and Hospital. Written informed consent for possible future elaboration of data were obtained from all the subjects included in this study at the time of initial examinations.
We reviewed the lung cancer surgical registry system in our hospital between January 2012 and December 2014 to select patients with nGGOs that had been resected completely. The enrollment criteria were as follows: 1) HRCT showed that the lesions were nGGOs, 2) lesions’ diameters were ≥5 mm and <3 cm in any one of the three axes, 3) GGO proportion of ≥50%, and 4) only one GGO was observed in each individual. The exclusion criteria were as follows: 1) cases without pathological diagnosis, 2) small cell lung cancer, squamous carcinoma, or metastatic carcinoma, 3) adenocarcinoma exceeding T1N0M0, 4) cases with chemoradiotherapy or biopsy preoperatively, 5) preoperative CT was not performed in our hospital, 6) limited quantitative evaluation due to CT images with >2.0 mm thickness or reconstructed without a lung algorithm, and 7) insufficient pathological slides. Finally, 176 patients (74 men and 102 women, mean age 52.1±8.2 years) were selected. The intervals between preoperative HRCT examination and surgery were 11.3±4.2 days (range, 1–23 days). Pathological diagnoses included AAH (n=28), AIS (n=43), MIA (n=67), and IAC (n=38). For statistical analysis, AAH and AIS were classified into preinvasive adenocarcinoma (PIA) because of similar biological behavior. Table 1 shows the clinical, radiological, and pathological characteristics of the selected cases.
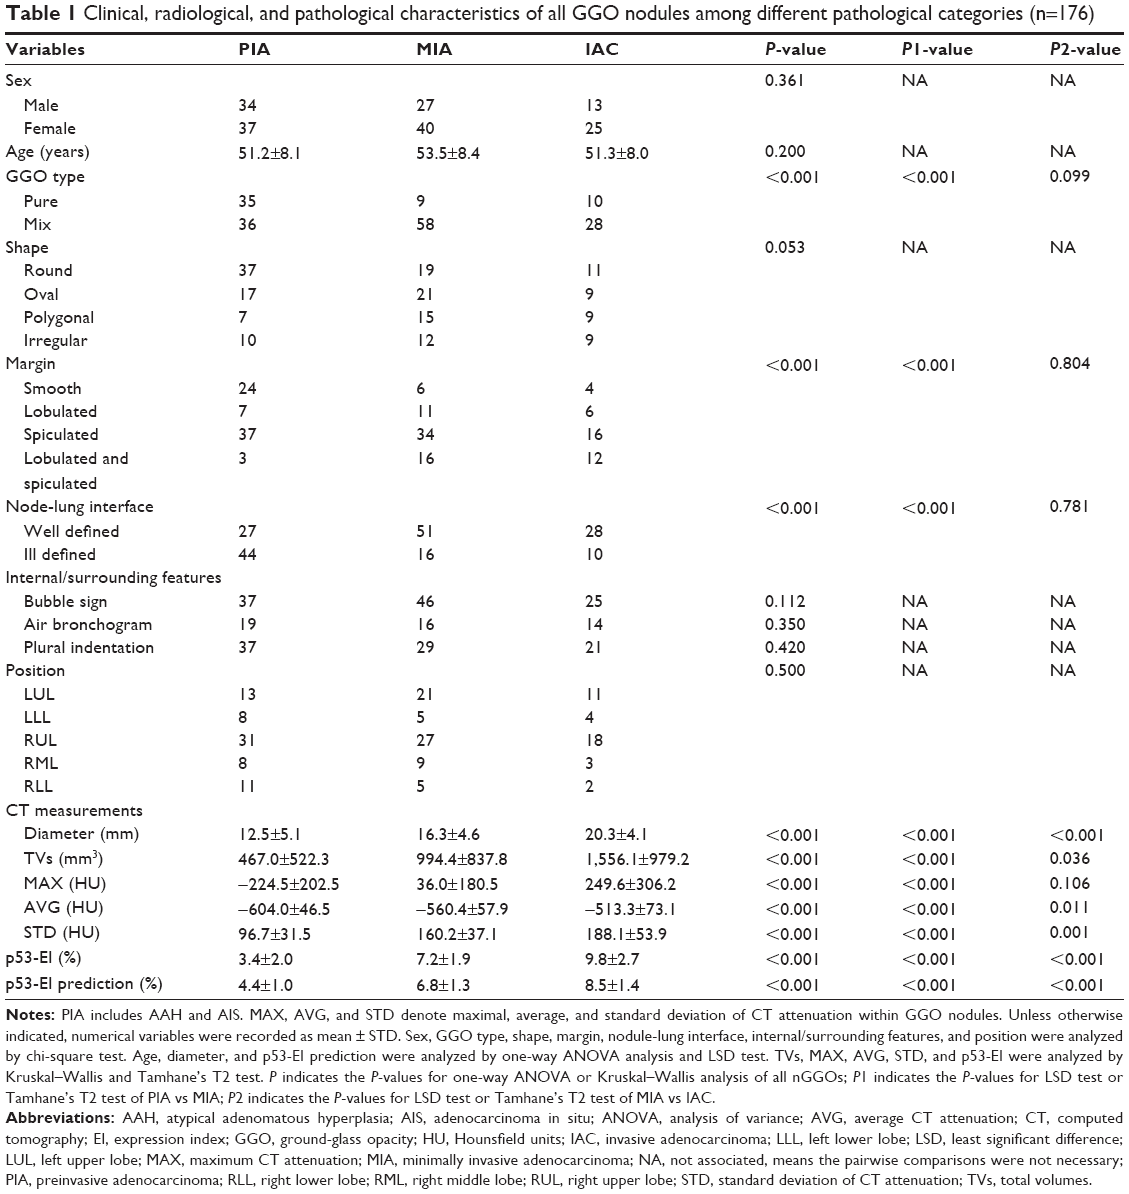 | Table 1 Clinical, radiological, and pathological characteristics of all GGO nodules among different pathological categories (n=176) |
Imaging technique
Chest CTs were obtained from the lung apices through the bases. All CT scans were performed with one of the two scanners, namely, Somatom Sensation 16 (Siemens Healthcare, Forchheim, Germany) and Somatom Definition AS (Siemens Healthcare). The scan parameters were 120 kV, 100 mAs, collimation of 16×1.5 mm, pitch of 1.25, and exposure of 0.5 seconds per rotation for Somatom Sensation 16 scanner and 120 kV, 100 mAs, collimation of 32×0.6 mm, a pitch of 0.7, and a rotation time of 0.5 seconds for Somatom Definition AS scanner. Raw data were reconstructed for HRCT with a thickness of 1.5–2 mm, an interval of 0.75–1 mm, and a sharp kernel (B70f) for reconstruction of lung. Window settings were modified on all images to optimally assess lung parenchyma (window level, −500 to −700 Hounsfield units [HU]; window width, 1,000–1,500 HU) and mediastinum (window level, 30–50 HU; window width, 350–500 HU).
Imaging review
Blinded to clinical data and pathological diagnosis, two experienced radiologists (with 7 years and 11 years of experience, respectively) evaluated the CT images. The observers assessed the location, shape, margin, node-lung interface, and internal/surrounding characteristics and also measured the diameters, total volumes (TVs), maximum (MAX), average (AVG), and standard deviation (STD) of CT attenuations of the total nGGOs. According to the recommendation of the Nomenclature Committee of the Fleischner Society,6 the nGGOs were classified into pure GGO in comparison with mix GGO with solid component and ground-glass attenuation as well. The distributions of nGGOs were only determined in the pulmonary lobes. The shapes of nGGOs were described as round, oval, polygonal, or irregular. The margins were described as smooth, lobulated, spiculated, or lobulated with spiculation. Node–lung interface was recorded as well demarcated or ill demarcated. The internal and surrounding malignant signs include bubble sign, air bronchogram, and pleural indentation. The diameter was the maximal dimension on axial images. TVs, MAX, AVG, and STD were measured by drawing and summing a series of regions of interest on each continuous transverse level covering as large an area as possible from the whole lesion but excluding large vessels, until the entire lesion was covered.
Histopathological processing and p53 expression index evaluation
The paraffin-embedded specimens that were obtained surgically were retrieved and were cut at 5 μm thickness for tissue sections, including the largest cut surface of the tumor. Tissue sections were then stained with hematoxylin and eosin for pathological diagnosis by two experienced lung pathologists. All nGGOs were diagnosed as AAH, AIS, MIA, or IAC, according to the IASLC/ATS/ERS classification (Figures 1–4).
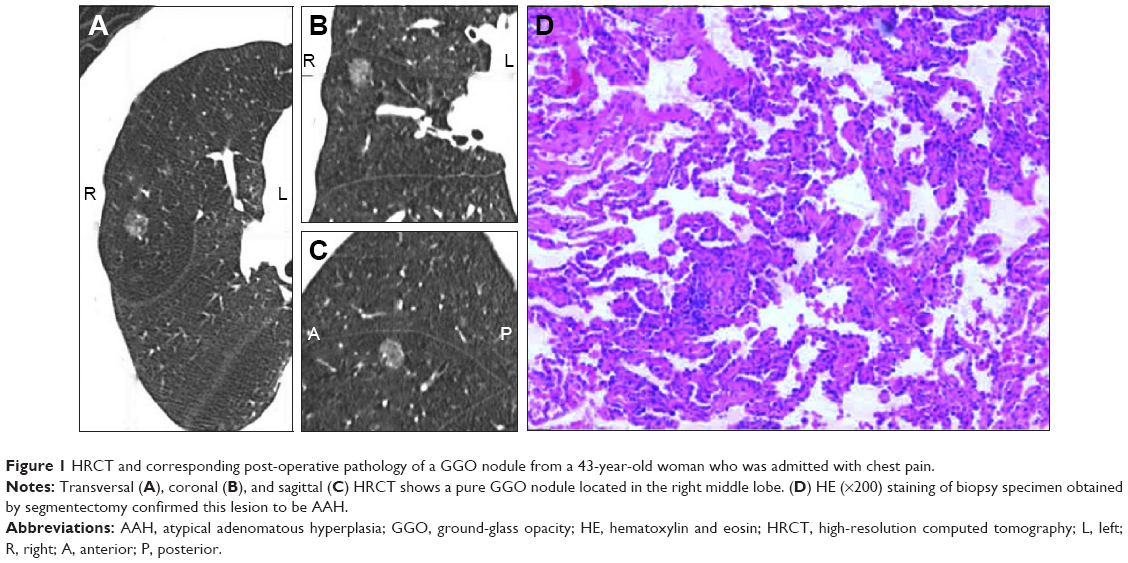 | Figure 1 HRCT and corresponding post-operative pathology of a GGO nodule from a 43-year-old woman who was admitted with chest pain. |
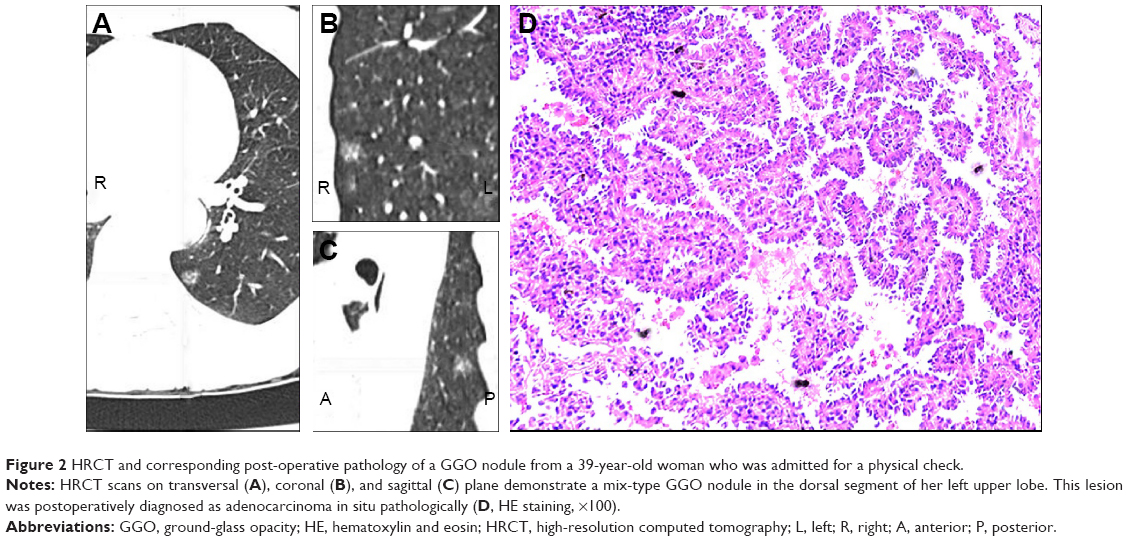 | Figure 2 HRCT and corresponding post-operative pathology of a GGO nodule from a 39-year-old woman who was admitted for a physical check. |
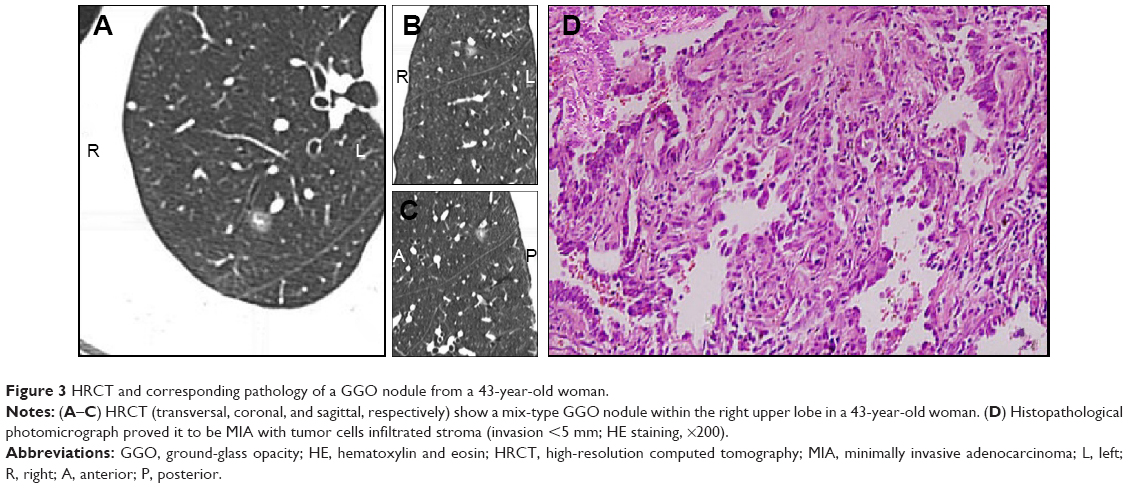 | Figure 3 HRCT and corresponding pathology of a GGO nodule from a 43-year-old woman. |
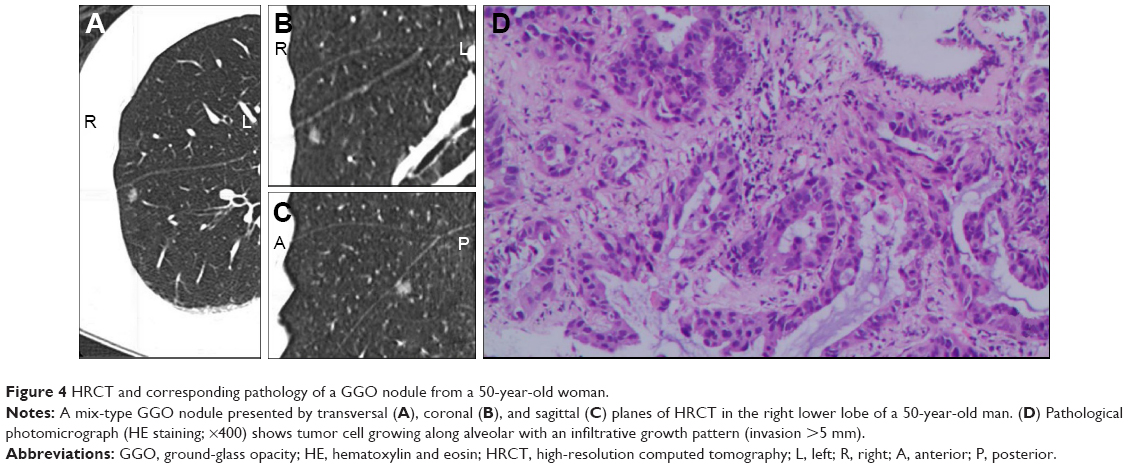 | Figure 4 HRCT and corresponding pathology of a GGO nodule from a 50-year-old woman. |
Immunohistochemical staining was performed on the 5 μm sections with monoclonal antibodies ([EP356(2)AY], Abcam62376, Cambridge, MA, USA; 1:100 dilution) to the p53 protein. Briefly, routine deparaffinage by dimethylbenzene and dehydration by gradient ethyl alcohol were performed to the representative paraffin-embedded tissue sections. Hydrogen peroxide (3%) was used to block endogenous peroxidase for 10 minutes at 37°C, and phosphate-buffered saline was used to douche lasting 5 minutes for three times. Then, citrate buffer (pH =6.0) was used to repair antigen for 3 minutes. After that, sections were incubated with primary antibodies against p53 protein overnight at 4°C. After incubation for 30 minutes with the secondary biotinylated antibodies, sections were put into horseradish peroxidase complex for 30 minutes and into diaminobenzidine for 10 minutes, both at 37°C. Finally, routine hematoxylin redyeing, dehydration, dimethylbenzene transparentizing, and gum mounting were performed in order. The p53-positive cells showed brown nuclear staining. An Olympus BX35 microscope equipped with a Nikon DS-Fil camera (Tokyo, Japan) was used for microscopy and image capturing. Percentage of positive cells that express mutant p53 protein indicated by tan staining particles located in nucleus (Figure 5A) were quantitatively calculated by using Image-Pro Plus 6.0 (Media Cybernetics, Rockville, MD, USA; Figure 5B), which has been widely used in biomedicine.22–24
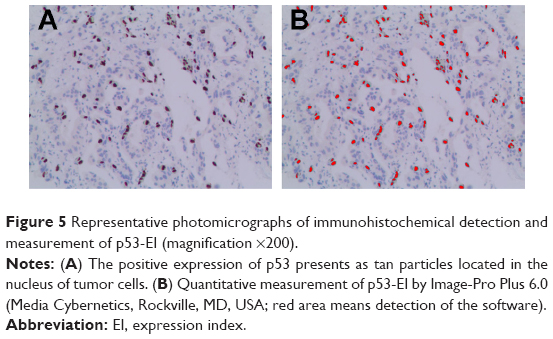 | Figure 5 Representative photomicrographs of immunohistochemical detection and measurement of p53-EI (magnification ×200). |
Statistical analysis
Interobserver agreement between the two observers was analyzed by calculating intraclass correlation coefficients (ICCs) for numerical variables and by Cohen’s kappa test for categorical variables. An ICC >0.75 indicates good agreement.25 The kappa-value of 0–0.20 indicates poor agreement, 0.21–0.40 fair agreement, 0.41–0.60 moderate agreement, 0.61–0.80 good agreement, and 0.81–1.00 excellent agreement.26 For further analysis, the averages of numerical variables measured by two reviewers were used, while consensus was achieved by negotiation for categorical variables if controversial definition exists.
Numerical variables were expressed as mean ± STD, while categorical variables were expressed as frequencies or percentages. Chi-square or Fisher’s exact test was used to analyze the differences of categorical variables among pathological classifications. Levene’s test was performed for evaluating variance homogeneities of variables, with the results shown in Table 2. Consequently, one-way analysis of variance (ANOVA) analysis was chosen for analyzing differences of variables with homogeneous variances, while Kruskal–Wallis test was chosen for variables with heterogeneous variances among groups. If initial ANOVA and Kruskal–Wallis test show significant intergroup differences, correspondingly least significant difference test for post hoc comparisons after ANOVA analysis and Tamhane’s T2 test for pairwise comparisons after Kruskal–Wallis test would be performed. Univariate general linear model analyses were performed to investigate the associations between radiological characteristics and p53 expression index (p53-EI) of nGGOs. Partial correlation coefficients were established between variates and p53-EI, after adjusting for other covariates. Crude and adjusted effects (beta coefficients) were estimated. Multivariate stepwise linear regression was conducted to identify independent variables that predict p53-EI and to establish equation for calculating p53-EI prediction. Finally, the receiver-operating characteristic (ROC) curve analysis was performed for comparing the capacity of numerical variables in predicting invasiveness of nGGOs. Differences of diagnostic performance were analyzed between p53-EI and p53-EI prediction by comparing the areas under the curves (AUCs) according to the method described by Delong et al.27 All statistical analyses were performed using SPSS 20 (IBM Corporation, Armonk, NY, USA), and all hypothesis tests were two sided with a significance level of 0.05.
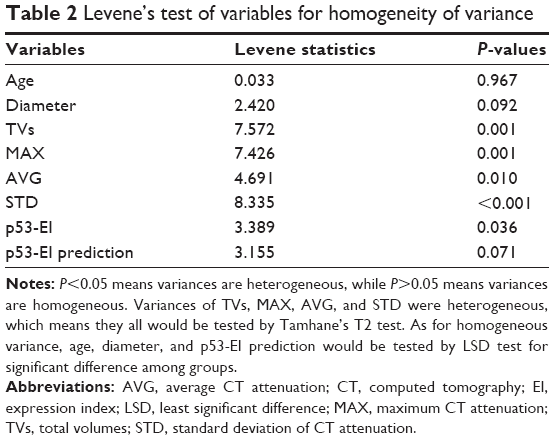 | Table 2 Levene’s test of variables for homogeneity of variance |
Results
Patients’ demographic and clinical characteristics
Of the 176 patients enrolled, 74 (42.0%) were male and 102 (58.0%) were female, with ages ranging from 28 years to 72 years (mean ± STD, 52.1±8.2 years). Twenty-eight (15.9%) nGGOs were diagnosed as AAH (Figure 1), while 43 (24.4%), 67 (38.1%), and 38 (21.6%) nGGOs were diagnosed as AIS (Figure 2), MIA (Figure 3), and IAC (Figure 4), respectively. Specimens were obtained from lobectomy in 67 (38.1%) cases, segmentectomy in 20 (11.4%) cases, and wide wedge resection in 89 (50.6%) cases. All pathological diagnoses were obtained within 1 month. There was no significant difference in sex ratio or age distribution among PIAs, MIAs, and IACs (P=0.361 and 0.200; Table 1).
Radiological–pathological correlation of nGGOs
The interobserver ICCs calculated for CT measurements are good, ranging from 0.829 to 0.912 (Table 3). The lowest ICC came from MAX, while the highest ICC came from STD. For categorical variables, the two observers also showed good-to-excellent agreement, with kappa values ranging from 0.762 for node–lung interface to 1.000 for nodular position (Table 3).
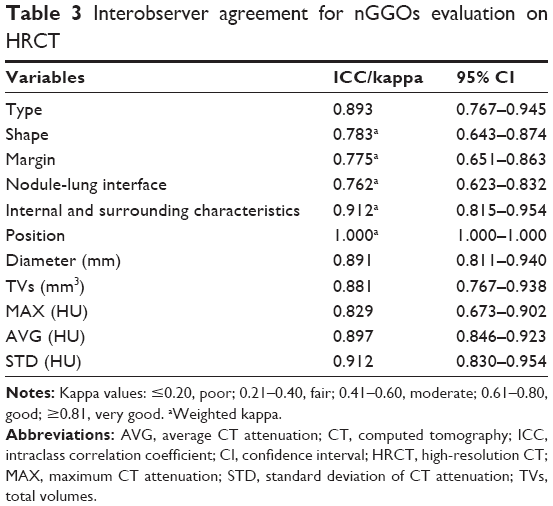 | Table 3 Interobserver agreement for nGGOs evaluation on HRCT |
The morphological characteristics of lesions regarding the subtype, margin, and node–lung interface were significantly different among PIAs, MIAs, and IACs with all P-values being <0.001. However, when compared pairwise, these three morphological features were only capable to differentiate PIAs from MIAs (P<0.001), but could not differentiate PIAs from IACs (P=0.099, 0.804, and 0.781, respectively; Table 1). Lesions’ location and intra/surrounding features including bubble sign, air bronchogram, and plural indentation were not significantly different among PIAs, MIAs, and IACs, with P=0.500, 0.112, 0.350, and 0.420, respectively (Table 1).
CT measurements of nGGOs regarding diameter, TVs, MAX, AVG, and STD showed significant intergroup differences among PIAs, MIAs, and IACs, with all P-values <0.001. MIAs presented significantly larger diameters and TVs, as well as higher MAX, AVG, and STD than PIAs (all P-values <0.001), while IACs demonstrated larger diameters and TVs, as well as higher AVG and STD than MIAs, with P-values <0.001, P=0.036, 0.011, and 0.011, respectively (Table 1). The MAX was not powerful in differentiating MIAs from IACs (P=0.106; Table 1). The mean p53-EIs of PIAs, MIAs, and IACs were 3.4±2.0, 7.2±1.9, and 9.8±2.7, respectively, with significant intergroup differences (P<0.001; Table 1 and Figure 5) analyzed either by Kruskal–Wallis or pairwise Tamhane’s T2 test.
By ROC analysis, AUCs of diameter, TVs, MAX, AVG, STD, and p53-EI are 0.706, 0.732, 0.837, 0.714, 0.898, and 0.914, respectively, to differentiate PIAs from MIAs (Figure 6A), and 0.744, 0.689, 0.718, 0.695, 0.688, and 0.786, respectively, to rule out MIAs from IACs (Figure 6B). The diagnostic performance of p53-EI is better than diameter, TVs, MAX, AVG, and STD either for differentiating MIAs from PIAs (AUC =0.914, P<0.001), or for distinguishing IACs from MIAs (AUC =0.786, P<0.001). When it comes to the maximum Youden’s index (sensitivity + specificity −1) for parameters, we obtained optimal cutoff points of diameter, TVs, MAX, AVG, STD, and p53-EI to be 11.84 mm, 252.51 mm3, −131.8 HU, −583.55 HU, 133.08, and 5.62%, respectively, for the differentiation between PIAs and MIAs (Figure 6A). Corresponding to the discrimination between MIAs and IACs, the thresholds were 16.99 mm, 1,003.81 mm3, 173.09 HU, −508.98 HU, 200.85, and 9.79% for diameter, TVs, MAX, AVG, STD, and p53-EI, respectively (Figure 6B).
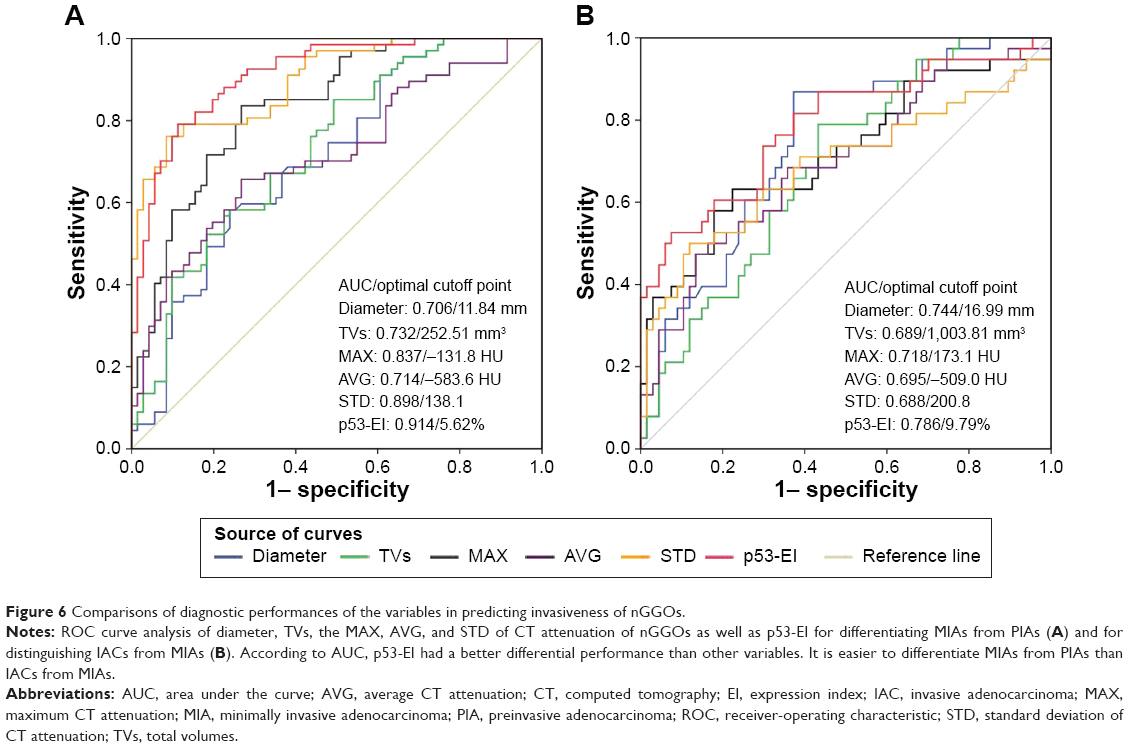 | Figure 6 Comparisons of diagnostic performances of the variables in predicting invasiveness of nGGOs. |
Correlation between CT parameters and p53-EI of nGGOs
As no morphological characteristic of nGGOs was identified capable for differentiating MIAs from PIAs and IACs from MIAs simultaneously (Table 1), they were not analyzed for their correlations with p53-EI. Univariate general linear model analyses showed that TVs, MAX, AVG, and STD were significantly correlated with p53-EI with all P-values <0.01, either before or after adjusted by other covariates, as shown in Table 4. The adjusted β coefficient of diameter is not statistically significant (P=0.148), which means it may have collinearity with other variables such as TVs. We also precluded MAX from final multivariate analysis because of its inefficiency in differentiating IACs from MIAs identified by pairwise Tamhane’s T2 test (P=0.106; Table 1).
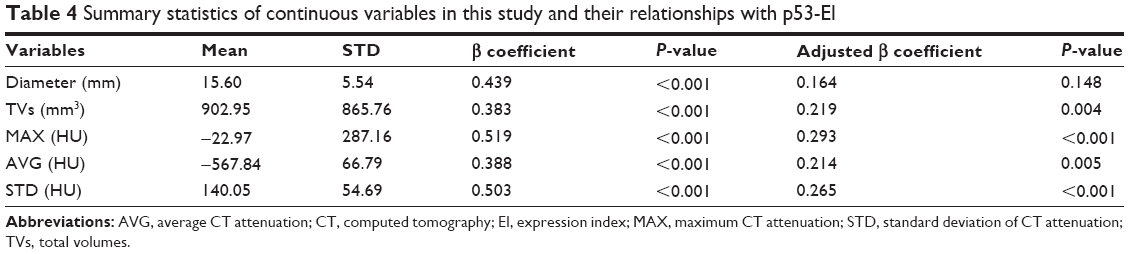 | Table 4 Summary statistics of continuous variables in this study and their relationships with p53-EI |
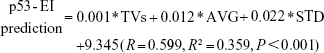
Consequently, TVs, AVG, and STD were selected for stepwise multiple linear regression analysis to quantitatively explore their relationship with p53-EI, as shown in Table 5. All these three variables were independent factors predicting p53-EI, with STD having the largest standardized β coefficient (0.361, P<0.001) implying the largest p53-EI prediction power. As a result, we established an equation for calculating p53-EI prediction as follows:
|
|
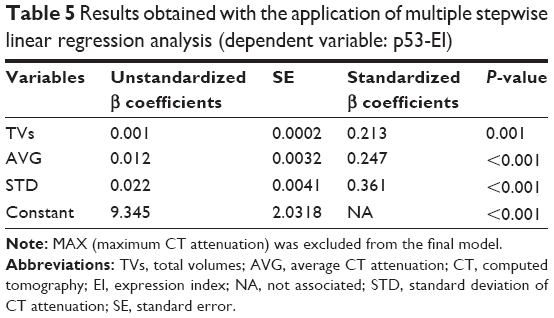 | Table 5 Results obtained with the application of multiple stepwise linear regression analysis (dependent variable: p53-EI) |
The p53-EI predictions were 4.4%±1.0%, 6.8%±1.3%, and 8.5%±1.4% for PIAs, MIAs, and IACs, respectively (Kruskal–Wallis test P<0.001; Tamhane’s T2 test: PIA vs MIA P<0.001, MIA vs IAC P<0.001; Table 1).
Finally, we compared the diagnostic performance of p53-EI prediction with the actual one by comparing their AUCs (Figure 7). Although not statistically significant, the p53-EI prediction has a little higher AUC in differentiating pathologies of nGGOs both between PIAs and MIAs (AUC 0.938 vs 0.914, P=0.263; Figure 7A) and between MIAs and IACs (AUC 0.812 vs 0.786, P=0.718; Figure 7B). The optimal thresholds of p53-EI prediction for differentiating MIAs from PIAs and MIAs from IACs were 5.61% and 8.34%, respectively, with corresponding sensitivities being 88.1% and 63.2%, and specificities being 93.0% and 91.0%, respectively (Figure 7).
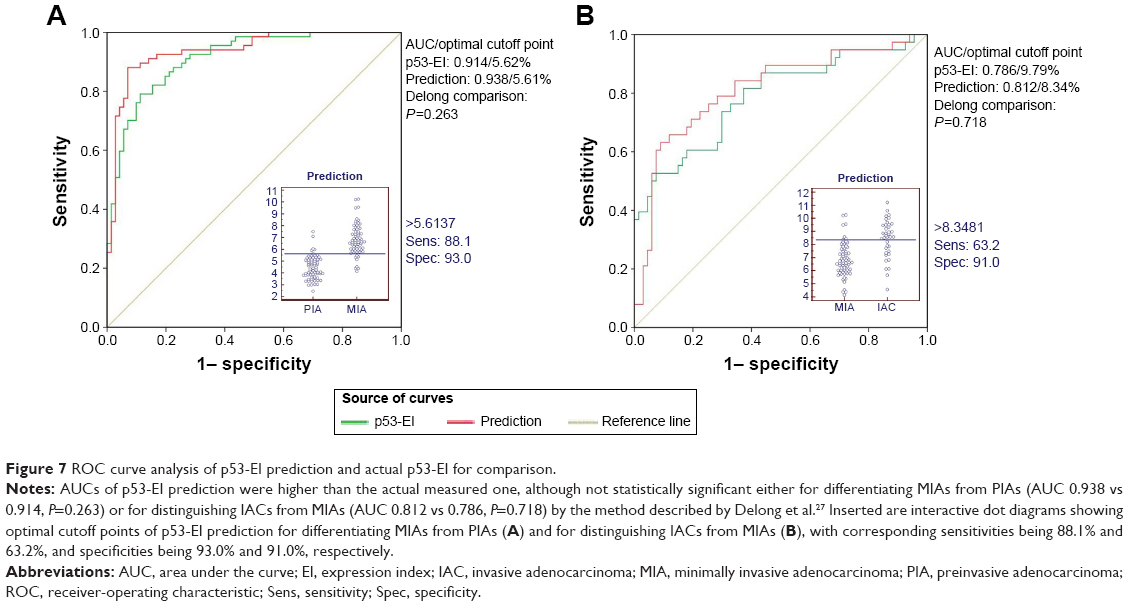 | Figure 7 ROC curve analysis of p53-EI prediction and actual p53-EI for comparison. |
Discussion
In 2011, the IASLC/ATS/ERS proposed a new international multidisciplinary classification system for lung adenocarcinoma.4 The new classification system, which is based on HRCT–pathological correlation studies, can be used by radiologists, pulmonologists, and surgeons for predicting adenocarcinoma histopathology and patient prognosis, as well as for planning appropriate intervention.5 For example, the GGO extent within a lung nodule seen on HRCT correlates with the extent of lepidic tumor growth on histopathology.28–30 As for quantitative and more accurate analysis, the given GGO lesion was not homogeneous and no clear dividing line exists between pure GGO and mix GGO, a continuous progression paralleling to pathological progression from AAH through AIS and MIA to IAC has been recommended by many researchers.5,16,18 This means that pure GGO is in a very beginning stage, while mix GGO may be a middle one depending on the percent of solid component.
In recent years, many efforts have been made in seeking hallmarks of nGGOs that may indicate tumor invasiveness based on quantitative CT.5,12,14,16,31 For example, PIA most likely owns a low MAX, AVG, and STD, while MIA generally owns relatively higher MAX and little higher STD but a nearly AVG, presenting as mild mix GGO in most cases.5,16,31 Thereafter, in IAC, solid component increased and moderate mix GGO comes up, which owns larger diameter, MAX, AVG, and STD.5,16,31 Similarly, in this study, diameter, TVs, AVG, and STD were significantly and consecutively increasing along with the progression from PIAs and MIAs to IACs. Diameter and TVs characterize GGO from the perspective of whole basic framework of proliferation in comparison with AVG, which describe its substantiality and internality. STD manifests heterogeneity within the whole nodule. By ROC analysis, the optimal cutoffs of diameter and AVG for distinguishing PIAs from MIAs and MIAs from IACs were 11.84 mm and −584 HU and 16.99 mm and −509 HU, respectively. Lee et al5 explored the thresholds of diameter and AVG for discriminating invasive adenocarcinoma with 15 mm and −472 HU, respectively. By ROC analysis as well, Takahashi et al31 got the cutoff of diameter for differentiating noninvasive lesions from invasive with 10 mm. More similar is the result in the study by Peng et al16 that the threshold of diameter and AVG for differentiating PIA from MIA and MIA from IAC were 10.55 mm and −615 HU and 21.8 mm and −464 HU, respectively.
However, all of these quantitative CT measurements are preoperative variables that cannot directly reflect lesions’ pathology per se. In this study, we investigated an immunohistochemical index, namely, p53-EI for assessing invasiveness of nGGOs. Analyzed by ROC curve analysis, this index showed good diagnostic performance either in differentiating MIAs from PIAs (AUC =0.914, P<0.001), or in distinguishing IACs from MIAs (AUC =0.786, P<0.001). Inactivation of a tumor suppressor gene, p53, by missense mutations is a representative molecular alteration in various tumors and acts as an underlying mechanism of tumorigenesis or metastasis.32,33 It has been suggested that nuclear p53 protein accumulation occurs in the transition from early to advanced stages of development of replacement-type adenocarcinomas, and thus, it is a good indicator of tumor malignancy.34 Aoki et al20 found that as the solid component increases within an nGGO, the immunohistochemistry of the p53 protein becomes positive. p53 alteration relates to the increase in solid component of nGGOs, which reflects invasive growth and poor prognosis as reported by previous studies.10,14,28
Nevertheless, pathological diagnosis cannot be obtained before surgery or biopsy. Only if there is a quantitative pathological index that can be measured or predicted preoperatively, we can accurately judge pathological features of nGGOs. Interestingly, all CT measurements in the current studies have a significant positive correlation with p53-EI. The increase in p53-EI goes along with the invasive progression of cancer cells, which made the parenchyma involved larger and more substantial and thereby causing larger size and higher CT attenuation on HRCT. The invasion of MIA and IAC with high proliferation of cancerous cells will always be out of consistent step and scattered in involved lung tissue, which results in higher STD on HRCT. Therefore, it is reasonable to associate p53-EI, that from histopathology, with parameters regarding size and CT attenuation from radiology. Aiming to predict p53-EI preoperatively, we established a multivariate linear regression equation to assess p53 expression of nGGOs approximately, which even showed a little higher diagnostic performance either for differentiating MIAs from PIAs or for distinguishing IACs from MIAs, compared with the actual one, although not statistically significant. Actually in the study by Peng et al,16 similar relationship has already been identified between pathological Ki-67 labeling index and radiological parameters of nGGOs on CT, and the prediction of Ki-67 labeling index obtained from CT measurements similarly as done in this study also showed close diagnostic performance as the actual one. Therefore, we considered that the correlations and regression model between CT parameters and p53-EI are biological and pathophysiological more than just statistical and mathematical.
The pathological diagnoses of nGGOs are significant for the selection of surgical procedures. Preoperative prediction of p53-EI contributes to the differential diagnosis of nGGOs not only from radiology but also from pathology. Most importantly, p53-EIs in nGGOs of different pathological categories are significantly different. If we could predict p53-EI before surgery, radiological diagnosis of GGO will be more accurate than only through radiological features. Malignant nGGOs commonly undergo a progression along with AAH, AIS, MIA, and IAC. As there is no invasion of lung parenchyma and lymph nodes, limited resections such as wedge resection and segmentectomy are appropriate for PIA, including AAH and AIS, whereas in MIA and IAC, invasion of local lymph nodes has been detected in some cases, therefore standard lobectomy is necessary for MIA and IAC.35–37 A 100% and a ~100% 5-year disease-free survival have been reported for AIS and MIA, respectively, when completely resected.14,38 Therefore, the finding in this study is of great importance clinically.
Conclusion
In this study, we established a regression equation to calculate the prediction of p53-EI of nGGOs based on CT measurements. This strategy allows us to more accurately estimate the GGO pathological category and invasiveness preoperatively not only from radiology but also from pathology.
Acknowledgment
This study was supported by the National Natural Science Foundation of China (grant number: 81472797).
Disclosure
The authors report no conflicts of interest in this work.
References
Jemal A, Center MM, DeSantis C, Ward EM. Global patterns of cancer incidence and mortality rates and trends. Cancer Epidemiol Biomarkers Prev. 2010;19(8):1893–1907. | ||
Jemal A, Siegel R, Xu J, Ward E. Cancer statistics, 2010. CA Cancer J Clin. 2010;60(5):277–300. | ||
Aberle DR, Adams AM, Berg CD, et al. Reduced lung-cancer mortality with low-dose computed tomographic screening. N Engl J Med. 2011;365(5):395–409. | ||
Travis WD, Brambilla E, Noguchi M, et al. International Association for the Study of Lung Cancer/American Thoracic Society/European Respiratory Society: international multidisciplinary classification of lung adenocarcinoma: executive summary. Proc Am Thorac Soc. 2011;8(5):381–385. | ||
Lee HY, Choi Y, Lee KS, et al. Pure ground-glass opacity neoplastic lung nodules: histopathology, imaging, and management. AJR Am J Roentgenol. 2014;202(3):W224–W233. | ||
Hansell DM, Bankier AA, MacMahon H, McLoud TC, Muller NL, Remy J. Fleischner Society: glossary of terms for thoracic imaging. Radiology. 2008;246(3):697–722. | ||
El-Sherief AH, Gilman MD, Healey TT, et al. Clear vision through the haze: a practical approach to ground-glass opacity. Curr Probl Diagn Radiol. 2014;43(3):140–158. | ||
Park CM, Goo JM, Lee HJ, Lee CH, Chun EJ, Im JG. Nodular ground-glass opacity at thin-section CT: histologic correlation and evaluation of change at follow-up. Radiographics. 2007;27(2):391–408. | ||
Henschke CI, Yankelevitz DF, Mirtcheva R, McGuinness G, McCauley D, Miettinen OS. CT screening for lung cancer: frequency and significance of part-solid and nonsolid nodules. AJR Am J Roentgenol. 2002;178(5):1053–1057. | ||
de Hoop B, Gietema H, van de Vorst S, Murphy K, van Klaveren RJ, Prokop M. Pulmonary ground-glass nodules: increase in mass as an early indicator of growth. Radiology. 2010;255(1):199–206. | ||
Jin X, Zhao S, Gao J, et al. CT characteristics and pathological implications of early stage (T1N0M0) lung adenocarcinoma with pure ground-glass opacity. Eur Radiol. 2015;25(9):2532–2540. | ||
Bak SH, Lee HY, Kim JH, et al. Quantitative CT analysis of pure ground-glass opacity nodule (GGN) predicts further CT change. Chest. 2016;149(1):180–191. | ||
Tamura M, Shimizu Y, Yamamoto T, Yoshikawa J, Hashizume Y. Predictive value of one-dimensional mean computed tomography value of ground-glass opacity on high-resolution images for the possibility of future change. J Thorac Oncol. 2014;9(4):469–472. | ||
Son JY, Lee HY, Lee KS, et al. Quantitative CT analysis of pulmonary ground-glass opacity nodules for the distinction of invasive adenocarcinoma from pre-invasive or minimally invasive adenocarcinoma. PLoS One. 2014;9(8):e104066. | ||
Nakata M, Sawada S, Saeki H, et al. Prospective study of thoracoscopic limited resection for ground-glass opacity selected by computed tomography. Ann Thorac Surg. 2003;75(5):1601–1605. | ||
Peng M, Peng F, Zhang C, et al. Preoperative prediction of Ki-67 labeling index by three-dimensional CT image parameters for differential diagnosis of ground-glass opacity (GGO). PLoS One. 2015;10(6):e129206. | ||
Takeuchi T, Tomida S, Yatabe Y, et al. Expression profile-defined classification of lung adenocarcinoma shows close relationship with underlying major genetic changes and clinicopathologic behaviors. J Clin Oncol. 2006;24(11):1679–1688. | ||
Ciancio N, Galasso MG, Campisi R, Bivona L, Migliore M, Di Maria GU. Prognostic value of p53 and Ki67 expression in fiberoptic bronchial biopsies of patients with non small cell lung cancer. Multidiscip Respir Med. 2012;7(1):29. | ||
Iggo R, Gatter K, Bartek J, Lane D, Harris AL. Increased expression of mutant forms of p53 oncogene in primary lung cancer. Lancet. 1990;335(8691):675–679. | ||
Aoki T, Hanamiya M, Uramoto H, Hisaoka M, Yamashita Y, Korogi Y. Adenocarcinomas with predominant ground-glass opacity: correlation of morphology and molecular biomarkers. Radiology. 2012;264(2):590–596. | ||
Yamaguchi F, Kugawa S, Tateno H, Kokubu F, Fukuchi K. Analysis of EGFR, KRAS and P53 mutations in lung cancer using cells in the curette lavage fluid obtained by bronchoscopy. Lung Cancer. 2012;78(3):201–206. | ||
Rawlinson A, Elcock C, Cheung A, et al. An in-vitro and in-vivo methodology study of alveolar bone measurement using extra-oral radiographic alignment apparatus, Image Pro-Plus software and a subtraction programme. J Dent. 2005;33(9):781–788. | ||
Wang CJ, Zhou ZG, Holmqvist A, et al. Survivin expression quantified by Image Pro-Plus compared with visual assessment. Appl Immunohistochem Mol Morphol. 2009;17(6):530–535. | ||
Francisco JS, Moraes HP, Dias EP. Evaluation of the Image-Pro Plus 4.5 software for automatic counting of labeled nuclei by PCNA immunohistochemistry. Braz Oral Res. 2004;18(2):100–104. | ||
Busing KA, Kilian AK, Schaible T, Debus A, Weiss C, Neff KW. Reliability and validity of MR image lung volume measurement in fetuses with congenital diaphragmatic hernia and in vitro lung models. Radiology. 2008;246(2):553–561. | ||
Sergiacomi G, Cicciò C, Boi L, et al. Ground-glass opacity: high-resolution computed tomography and 64-multi-slice computed tomography findings comparison. Eur J Radiol. 2010;74(3):479–483. | ||
DeLong ER, DeLong DM, Clarke-Pearson DL. Comparing the areas under two or more correlated receiver operating characteristic curves: a nonparametric approach. Biometrics. 1988;44(3):837–845. | ||
Lee HY, Lee KS. Ground-glass opacity nodules: histopathology, imaging evaluation, and clinical implications. J Thorac Imaging. 2011;26(2):106–118. | ||
Goo JM, Park CM, Lee HJ. Ground-glass nodules on chest CT as imaging biomarkers in the management of lung adenocarcinoma. AJR Am J Roentgenol. 2011;196(3):533–543. | ||
Travis WD, Brambilla E, Riely GJ. New pathologic classification of lung cancer: relevance for clinical practice and clinical trials. J Clin Oncol. 2013;31(8):992–1001. | ||
Takahashi M, Shigematsu Y, Ohta M, Tokumasu H, Matsukura T, Hirai T. Tumor invasiveness as defined by the newly proposed IASLC/ATS/ERS classification has prognostic significance for pathologic stage IA lung adenocarcinoma and can be predicted by radiologic parameters. J Thorac Cardiovasc Surg. 2014;147(1):54–59. | ||
Toyooka S, Tsuda T, Gazdar AF. The TP53 gene, tobacco exposure, and lung cancer. Hum Mutat. 2003;21(3):229–239. | ||
Roy-Chowdhuri S, Chow CW, Kane MK, et al. Optimizing the DNA yield for molecular analysis from cytologic preparations. Cancer Cytopathol. Epub 2015. | ||
Kawasaki M, Noguchi M, Morikawa A, et al. Nuclear p53 accumulation by small-sized adenocarcinomas of the lung. Pathol Int. 1996;46(7):486–490. | ||
Nakao M, Yoshida J, Goto K, et al. Long-term outcomes of 50 cases of limited-resection trial for pulmonary ground-glass opacity nodules. J Thorac Oncol. 2012;7(10):1563–1566. | ||
Tsutani Y, Miyata Y, Nakayama H, et al. Appropriate sublobar resection choice for ground glass opacity-dominant clinical stage IA lung adenocarcinoma: wedge resection or segmentectomy. Chest. 2014;145(1):66–71. | ||
Kodama K, Higashiyama M, Takami K, et al. Treatment strategy for patients with small peripheral lung lesion(s): intermediate-term results of prospective study. Eur J Cardiothorac Surg. 2008;34(5):1068–1074. | ||
Borczuk AC, Qian F, Kazeros A, et al. Invasive size is an independent predictor of survival in pulmonary adenocarcinoma. Am J Surg Pathol. 2009;33(3):462–469. |
 © 2016 The Author(s). This work is published and licensed by Dove Medical Press Limited. The full terms of this license are available at https://www.dovepress.com/terms.php and incorporate the Creative Commons Attribution - Non Commercial (unported, v3.0) License.
By accessing the work you hereby accept the Terms. Non-commercial uses of the work are permitted without any further permission from Dove Medical Press Limited, provided the work is properly attributed. For permission for commercial use of this work, please see paragraphs 4.2 and 5 of our Terms.
© 2016 The Author(s). This work is published and licensed by Dove Medical Press Limited. The full terms of this license are available at https://www.dovepress.com/terms.php and incorporate the Creative Commons Attribution - Non Commercial (unported, v3.0) License.
By accessing the work you hereby accept the Terms. Non-commercial uses of the work are permitted without any further permission from Dove Medical Press Limited, provided the work is properly attributed. For permission for commercial use of this work, please see paragraphs 4.2 and 5 of our Terms.