")
Back to Journals » Cancer Management and Research » Volume 10
Predictive significance of preoperative CT findings for suboptimal cytoreduction in advanced ovarian cancer: a meta-analysis
Authors Hu TWY, Nie D, Gou JH, Li ZY
Received 2 March 2018
Accepted for publication 14 May 2018
Published 16 July 2018 Volume 2018:10 Pages 2019—2030
DOI https://doi.org/10.2147/CMAR.S166658
Checked for plagiarism Yes
Review by Single anonymous peer review
Peer reviewer comments 3
Editor who approved publication: Dr Kenan Onel
Ting Wen Yi Hu,1 Dan Nie,1,2 Jin Hai Gou,1,3 Zheng Yu Li1,3
1Department of Gynecology and Obstetrics, West China Second University Hospital, Sichuan University, Chengdu, People’s Republic of China; 2Key Laboratory of Obstetrics and Gynecologic and Pediatric Diseases and Birth Defects of Ministry of Education, West China Second Hospital, Sichuan University, Chengdu, People’s Republic of China; 3The State Key Laboratory of Biotherapy, West China Hospital, Sichuan University, Chengdu, People’s Republic of China
Background: Computed tomography (CT) has been extensively used in predicting suboptimal cytoreduction (SCR) in advanced ovarian cancer (OC). However, disagreements remain in literatures on the predictive value of CT findings for SCR. This meta-analysis was designed to determine the ability of eight preoperative CT findings to predict SCR in advanced OC.
Materials and methods: A comprehensive literature search was conducted for eligible studies to identify the association between the eight preoperative CT findings and SCR in advanced OC. The predictive performances of preoperative CT findings were expressed in terms of sensitivity, specificity, positive likelihood ratio (PLR), negative likelihood ratio (NLR) and diagnostic odds ratio (DOR) with pooled proportion.
Results: A total of 10 studies and 1,614 patients were included in this meta-analysis. Large volume ascites had the highest sensitivity (64%, CI 56–71%), with a PLR of 1.3 (CI 1.1–1.5) and an NLR of 0.73 (0.59–0.90), while lymph node involvement had the highest specificity (89%, CI 79–94%). The highest DOR of 3 (CI 2–4) was achieved in peritoneal involvement and large bowel mesentery involvement. The other CT findings had poorer predictive performance.
Conclusion: Preoperative CT findings have a poor discriminative capacity to predict SCR in advanced OC. Preoperative CT predictors should be used with caution amid clinical decision-making.
Keywords: computed tomography, suboptimal cytoreduction, ovarian cancer, meta-analysis, predict
Introduction
Ovarian cancer (OC) remains the leading cause of death from gynecologic malignancies in the USA, with 14,240 deaths reported in 2016.1 The vast majority of patients present with stage III and IV disease (as defined by the International Federation of Gynecology and Obstetrics [FIGO]), whose 5-year survival rate is approximately 35%.2 One of the most important predictors of survival in the advanced stage of OC is the amount of residual tumor after primary cytoreductive surgery.3–5
Numerous studies have demonstrated survival advantage of “optimal” over “suboptimal” primary surgical cytoreduction in advanced OC,6,7 since suboptimal cytoreduction (SCR) features little survival benefit but significant surgical morbidity. Optimal cytoreduction is defined as the largest diameter of residual disease is less than 1 cm after primary cytoreduction in OC patients.8
It is universally acknowledged that surgery should not be performed when suboptimal resection is expected. For this group of patients, neoadjuvant chemotherapy followed by interval debulking surgery may be a more favorable alternative. Consequently, pretreatment stratification is important to the best survival for each individual patient. A number of studies have reported that several specific CT findings predicted the outcome of SCR in advanced OC patients, with sensitivity ranging from 52% to 79%.9–13 However, such indicators believed to provide hints of SCR outcome are mostly based on the combination of CT findings and clinical parameters from relatively small population.11,14–17 In addition, the exact predictive role of CT images in primary cytoreductive surgery outcome in OC remains questionable.9,18
The goal of this study was to externally validate the predictive performance of the following eight most used CT findings12,13,19,20 for SCR in OC: peritoneal involvement, large volume ascites, diaphragm or lung involvement, pleural effusion, liver involvement, lymph node involvement, large bowel mesentery involvement and small bowel mesentery involvement. Only those having the best predictive accuracy should be assessed in future studies so that a more uniform standard could be established to explore the true value of preoperative CT findings for advanced-stage OC patients undergoing primary cytoreductive surgery.
Materials and methods
Search strategy and selection criteria
A comprehensive literature search was conducted online from PubMed, Cochrane Library, EMBASE and Web of Science databases using the following keywords and their random combinations: “CT”, “suboptimal cytoreduction”, “computed tomography”, “suboptimal debulking surgery”, “optimal debulking surgery”, “optimal cytoreduction”, “OC”, “ovarian carcinoma”, “ovarian neoplasms”, “predict” and “outcome”. The articles relating preoperative computed tomography (CT) scans to surgical outcomes in OC were extracted up to February 28, 2017. References were also retrieved to find other eligible studies, and no advanced limitations were additionally set. When necessary, authors were contacted for further information.
Two reviewers independently screened the titles and abstracts of the relevant studies for eligibility, and any disagreement was resolved by discussion. Studies were included in our analysis if all the following criteria were fulfilled: 1) consecutively recruited patients with a histological diagnosis of FIGO stage III/IV OC of any type underwent primary cytoreductive surgery; 2) predictive performance of preoperative CT images was specific to suboptimal cytoreductive surgery; 3) patients were categorized into suboptimal (defined as residual disease >1 cm) and optimal groups based on surgical outcome; 4) at least one of the following CT findings was identified: peritoneal involvement (defined as peritoneal thickening ≥2 cm or ≥4 mm involving at least two out of the following five areas: lateral colic gutters, conal fascia, anterior abdominal wall, diaphragm and pelvic peritoneal reflections, as described by Dowdy et al13); large volume ascites on two-thirds or more of CT scan slices; diaphragm or lung involvement; pleural effusion; liver involvement on surface or parenchyma; infrarenal para-aortic or inguinal lymph node involvement; large bowel mesentery involvement; and small bowel mesentery involvement; 5) 2×2 tables can be derived or reconstructed from the provided data based on the frequency distribution of suboptimal and optimal cytoreduction according to the presence or absence of each CT findings; and 6) when several studies involved the same population, only the most recent or the most comprehensive one was included. Studies were excluded if they involved a sample size of less than 10 patients, or patients having received chemotherapy between preoperative CT scan and primary cytoreductive surgery, or definition of surgical outcome other than the cutoff of 1 cm.
Data extraction and quality assessment
The two authors used a standard form to extract related data independently from all the eligible studies: 1) documented information included the first author, year of publication, country of origin, type of study, number of patients, mean age of patients, time between CT and surgery, proportion of stage IV cases, percentage of SCR and inclusion criteria and 2) CT imaging data included CT model, number of readers, retrospective or prospective CT reading, criteria of positive CT signs and other specific description about the CT findings. Consensus was reached for all the problems where the authors had disagreement.
The applicability and potential sources of bias of individual study were assessed using the second edition of the Quality Assessment of Diagnostic Accuracy Studies (QUADAS 2) tool.21 This tool comprises 4 domains that discuss the following: 1) patient selection, 2) index test, 3) reference standard and 4) flow of patients through the study and timing of the index tests and reference standard (flow and timing). All the studies included were evaluated for risk of bias and applicability by 10 signaling questions and three correlative questions, respectively, along with additional signaling questions raised by us to assist judgments of risk of bias. The questions were answered as “yes”, “no” or “unclear” as it was recommended.
Statistical analysis
To each CT finding, sensitivity and specificity were extracted or calculated using 2×2 contingency tables. A bivariate random-effects model was developed, and a summary receiver operating characteristic (SROC) curve was generated for each CT finding. Corresponding positive likelihood ratio (PLR), negative likelihood ratio (NLR), diagnostic odds ratios (DOR) and their corresponding 95% CIs were calculated. PLR was calculated as sensitivity/(1 – specificity), NLR as (1 – sensitivity)/specificity and DOR as PLR/NLR. A clinically useful test was defined as having an PLR >5.0 and an NLR <0.2.22 Heterogeneity analysis was carried out graphically using forest plots of sensitivity and specificity for each CT sign, and was statistically quantified for each CT finding with chi-squared test and expressed in I2 index, which measures the percentage of the total variance across studies due to heterogeneity, rather than chance.23 Potential publication bias was determined using Deeks’ funnel plot.24,25 To assess the influence of between-study variability, a random-effects meta-regression analysis of the highest heterogeneity variable was performed.26 Outcomes were considered significant if p-value <0.05. All statistical tests were performed using STATA statistical software (version 14.0; StataCorp., College Station, TX, USA).
Results
Eligible studies
The initial online search in PubMed, Cochrane Library, EMBASE and Web of Science databases yielded 354 articles. After title and abstract screening, 96 articles with duplicate titles were excluded, and so were another 213 as they were reviews or irrelevant to preoperative CT findings, advanced OC patients or primary cytoreductive surgical outcomes. Subsequently, we checked the full text of the remaining 45 articles for more details, of which 35 were excluded because of the following: 1) it was impossible to establish 2×2 contingency tables for any of the CT signs (28/45), 2) the outcome of cytoreductive surgery was not categorized using the cutoff value of 1 cm (5/45) or 3) stage I/II cases were included or preoperative neoadjuvant chemotherapy was administered (2/45). In the study conducted by Borley et al10 with two cohorts, one of them was excluded where patients received not only primary debulking but also interval debulking as well as secondary debulking. Eventually, a total of 10 articles and 1,614 patients meeting the inclusion criteria were included in this meta-analysis. The flowchart of literature search is shown in Figure 1.
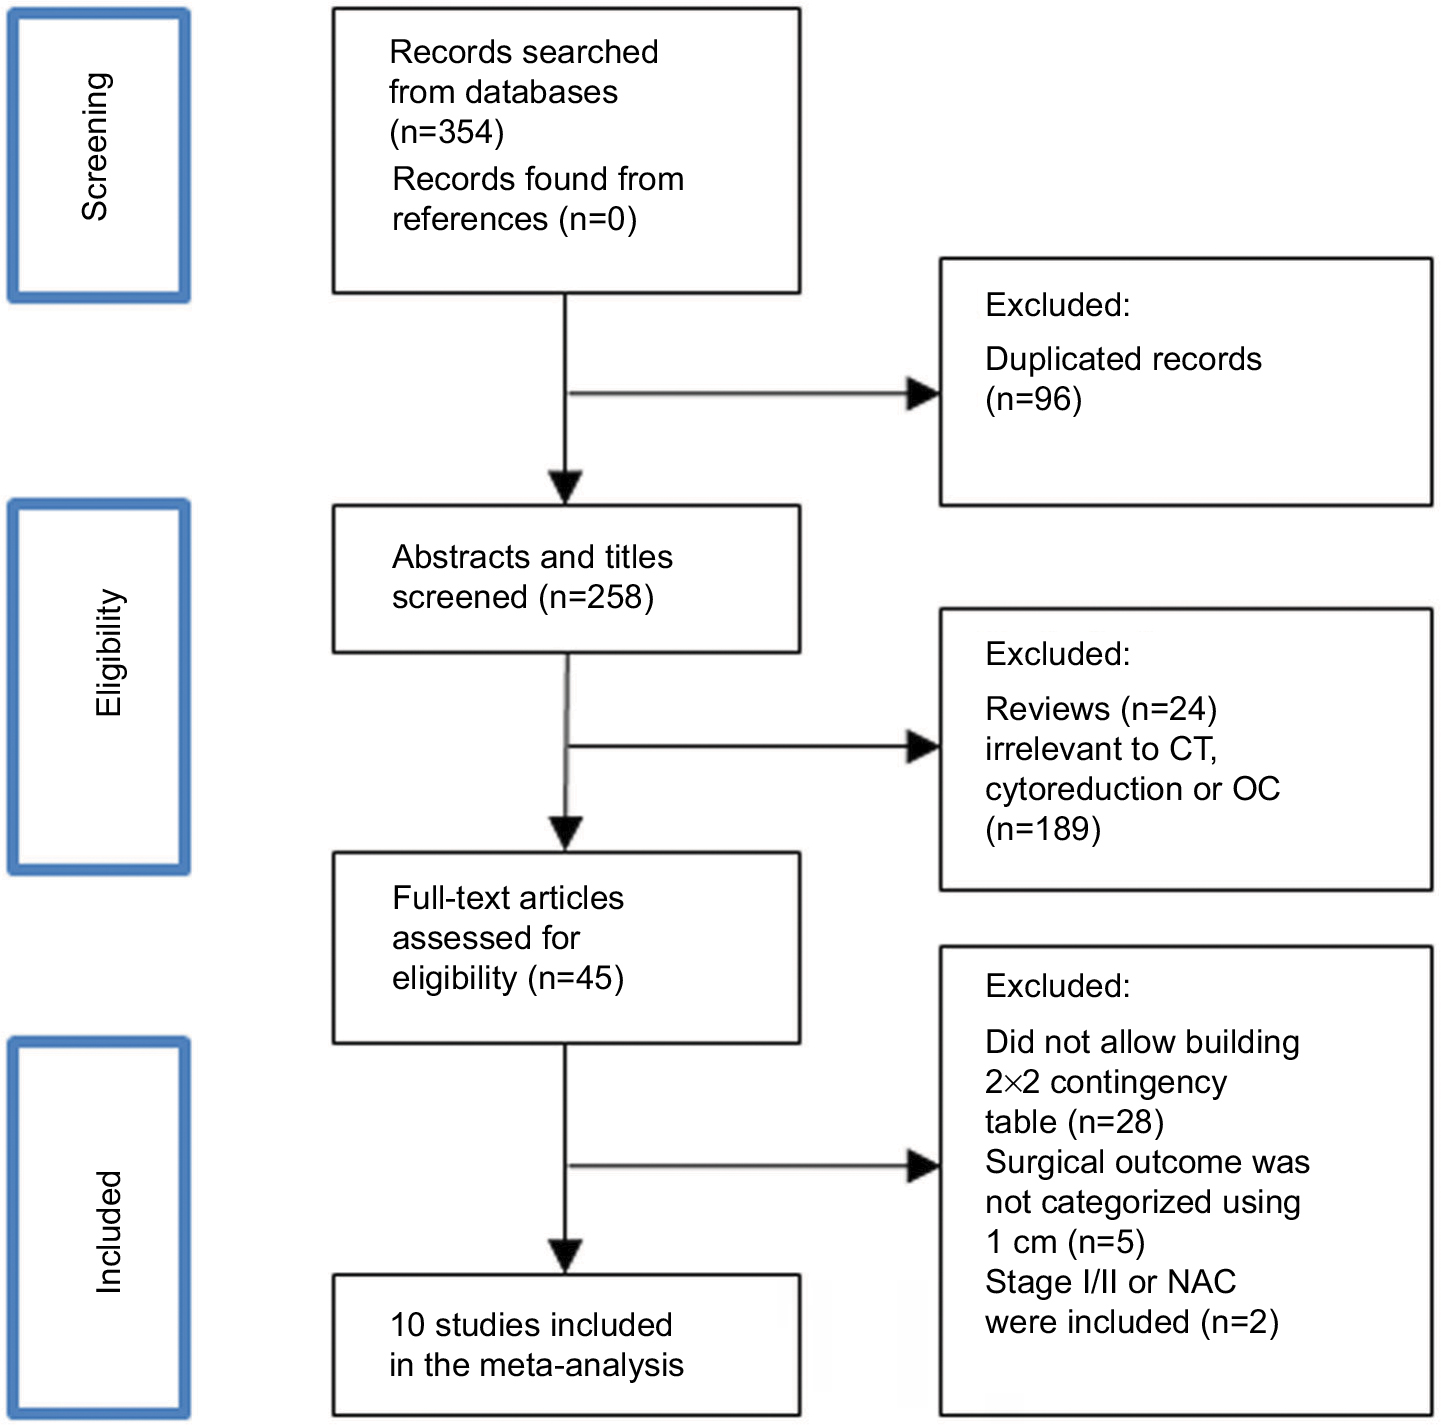 | Figure 1 Flowchart of study selection. Abbreviations: CT, computed tomography; OC, ovarian cancer; NAC, neoadjuvant chemotherapy. |
The eligible studies were conducted in 5 countries (the USA, the Netherlands, Korea, the UK and Denmark) and articles were published from 2005 to 2016. Three of the 10 studies were prospective studies,15,16,27 while the other seven were retrospective. The number of patients included in each study ranged from 5427 to 350,16 and the mean age ranged from 55 to 64.4 years old. The proportion of stage IV disease varied from 7% to 32.9%, which was derived from eight studies, and the SCR rate varied from 7.8% to 60%. Multidetector CT was used in six studies, PET/CT in one27 and unclear in the other three studies.17,28,29 CT interpretation data were collected prospectively16 in only one study, while retrospectively in the other nine studies. The characteristics of the 10 eligible studies are summarized in Table 1.
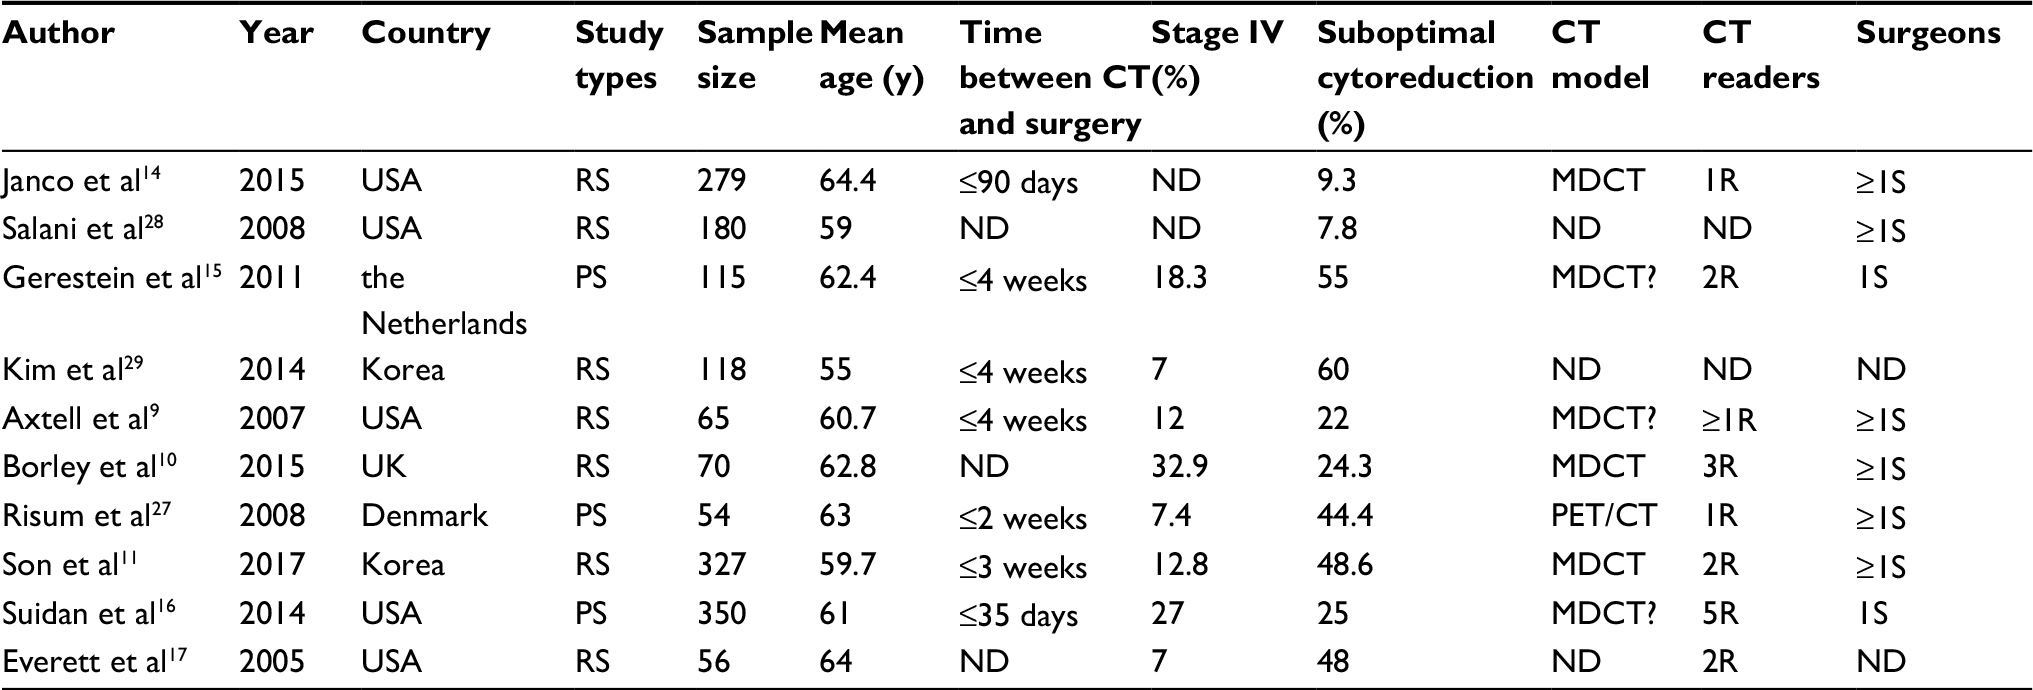 | Table 1 Characteristics of the 10 eligible studies included in the meta-analysis Abbreviations: CT, computed tomography; PS, prospective study; RS, retrospective study; MDCT, multidetector computer tomography; ND, no data; R, radiologist; S, surgeon. |
Methodological quality of the included studies
Results of the QUADAS-2 study quality assessment are summarized in Table S1. One study fulfilled all of the methodological criteria.11 Substantial risk of bias in patient selection was presented in four studies,9,10,15,28 mainly because the selection was based on the criteria that were too specific or exclusion criteria were not mentioned. Two studies had a risk of bias with the index test,14,27 as the CT images were viewed and interpreted by only one radiologist, which may result in under-diagnosis or over-diagnosis. The introduced bias of reference standard occurred in two studies,15,16 as the surgical outcome was judged by only one surgeon, and it may lead to a relatively subjective judgment of SCR. The index investigation was regarded poorly applicable in one study14 where preoperative CT images were obtained within 90 days prior to surgery, which renders lower predictive accuracy than those within 4 weeks. The quality of each study was assessed independently by the two reviewers, and any disputation was settled by discussion.
Performance of CT for predicting SCR
The predictive performance of all the preoperative CT signs is presented in Table 2, namely, sensitivity, specificity, PLR, NLR and DOR. The eight CT findings specified in our project were inconsistently investigated in the eligible studies: peritoneal involvement, pleural effusion, liver involvement, large bowel mesentery involvement and small bowel mesentery involvement were evaluated in six reports; large volume ascites in seven; lymph node involvement in eight; and diaphragm or lung involvement in nine. The CT sign of large volume ascites had the highest sensitivity of 64% (95% CI 56%–71%), with a PLR of 1.3 (95% CI 1.1–1.5), an NLR of 0.73 (95% CI 0.59–0.90) and a DOR of 2 (95% CI 1–2). The highest specificity of 89% (95% CI 79%–94%) was achieved for lymph node involvement, with a PLR of 2 (95% CI 1.3–3.1) and an NLR of 0.87 (95% CI 0.80–0.95). The peritoneal involvement and large bowel mesentery involvement had the highest DOR of 3 (95% CI 2–4), sensitivity of 63% (95% CI 49%–75%) and 45% (95% CI 25%–66%), specificity of 60% (95% CI 43%–75%) and 77% (95% CI 62%–87%), respectively. The DOR values of other CT findings (diaphragm or lung disease, liver involvement, pleural effusion and small bowel mesentery involvement) were 2 (95% CI 1–4, 1–3, 2–3, 1–4, respectively), with PLR and NLR ranging from 1.7 to 2.0, and 0.82 to 0.90, respectively. In all the eight preoperative CT signs, DOR was below 10, PLR was below 5 and NLR was over 0.2. These results suggest that the predictive performance of preoperative CT findings in discriminating suboptimal vs. optimal cytoreduction group would not be clinically useful. SROC curves of sensitivity and specificity for each CT finding are presented in Figure 2.
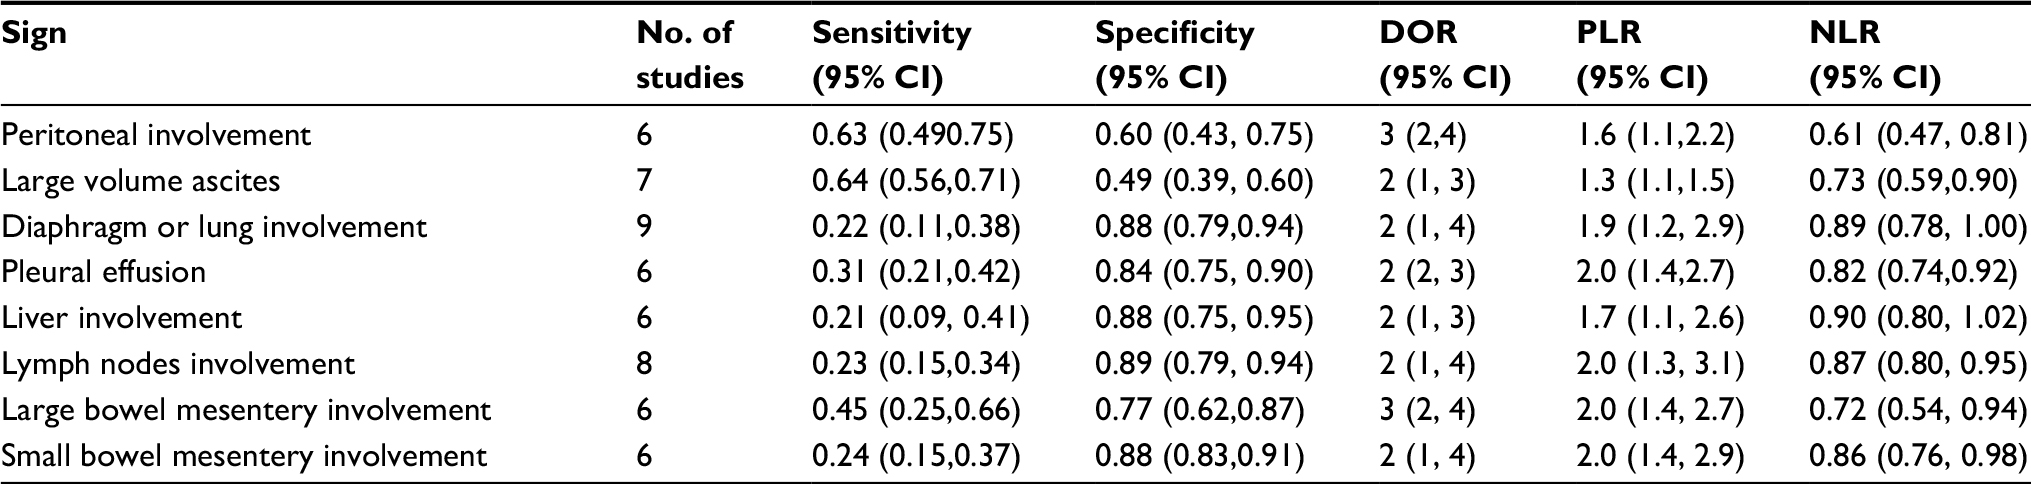 | Table 2 Summary of performance value of each CT finding in predicting SCR in advanced OC Abbreviations: CT, computed tomography; SCR, suboptimal cytoreduction; OC, ovarian cancer; DOR, diagnostic odds ratio; PLR, positive likelihood ratio; NLR, negative likelihood ratio. |
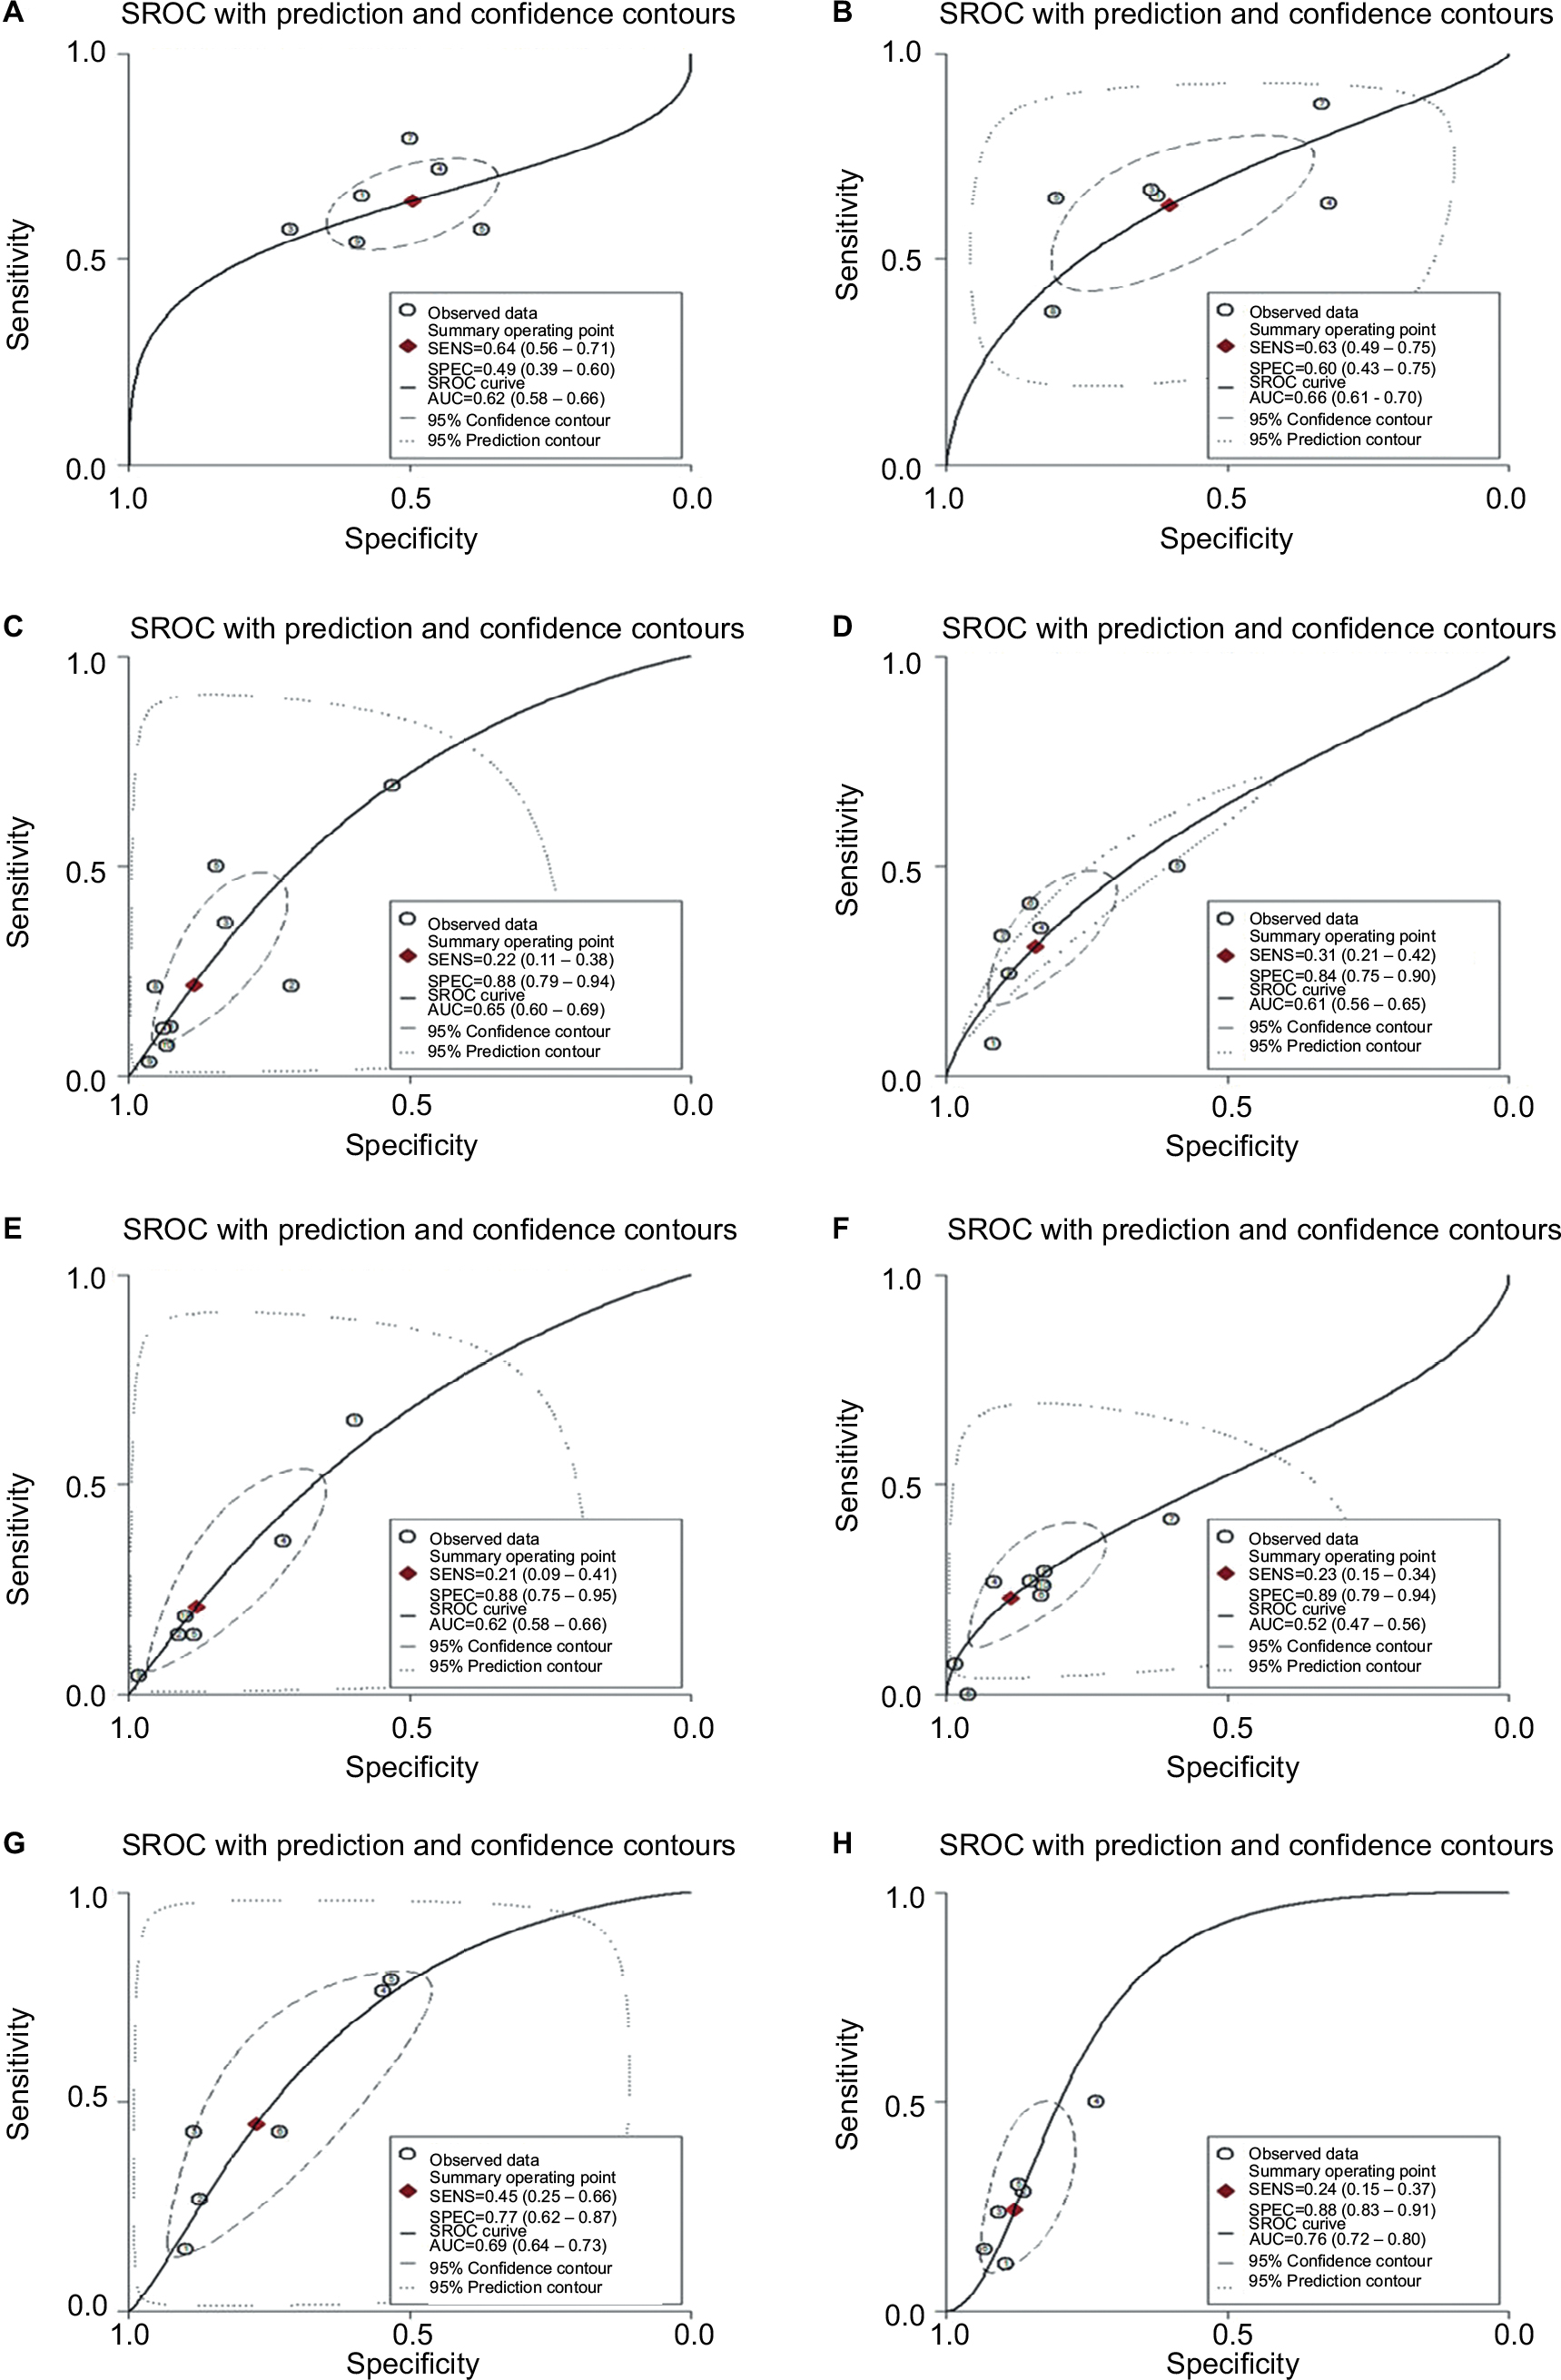 | Figure 2 SROC curves of sensitivity and specificity for each CT finding. Notes: (A) Large volume ascites. (B) Peritoneal involvement. (C) Diaphragm or lung involvement. (D) Pleural effusion. (E) Liver involvement. (F) Lymph node involvement. (G) Large bowel mesentery involvement. (H) Small bowel mesentery involvement. Abbreviations: SROC, summary receiver operating characteristics; CT, computed tomography; SPEC, specificity; SENS, sensitivity. |
Heterogeneity and publication bias
Heterogeneity for sensitivity was low for the parameters of large volume ascites (I2=32.33%, p=0.15), lymph node involvement (I2=17.82%, p=0.28) and pleural effusion (I2=33.63%, p=0.14) analysis, but significant for the other five CT signs (diaphragm or lung disease, peritoneal involvement, liver disease, large bowel mesentery involvement and small bowel mesentery involvement ), with I2 ranging from 72.76% to 91.64%. The forest plots of sensitivity and specificity for each CT finding are expressed in Figure 3. To determine how between-study heterogeneity influenced the presented analysis, a meta-regression analysis of the CT finding with the highest heterogeneity, i.e., diaphragm or lung disease, was conducted with several parameters, such as the year of publication (≥2010 vs. <2010), sample size (≥200 cases vs. <200 cases), proportion of stage IV disease (≥20% vs. <20%), SCR rate (≥50% vs. <50%) and ethnicity (Asian vs. non-Asian). It turned out that none of them was the determinant of between-study heterogeneity. The outcome of meta-regression analysis is shown in Table 3. No significant publication bias was noted across the studies, with p-values ranging from 0.21 to 0.94 for Deeks’ funnel plot asymmetry test for each CT finding, as presented in Figure 4.
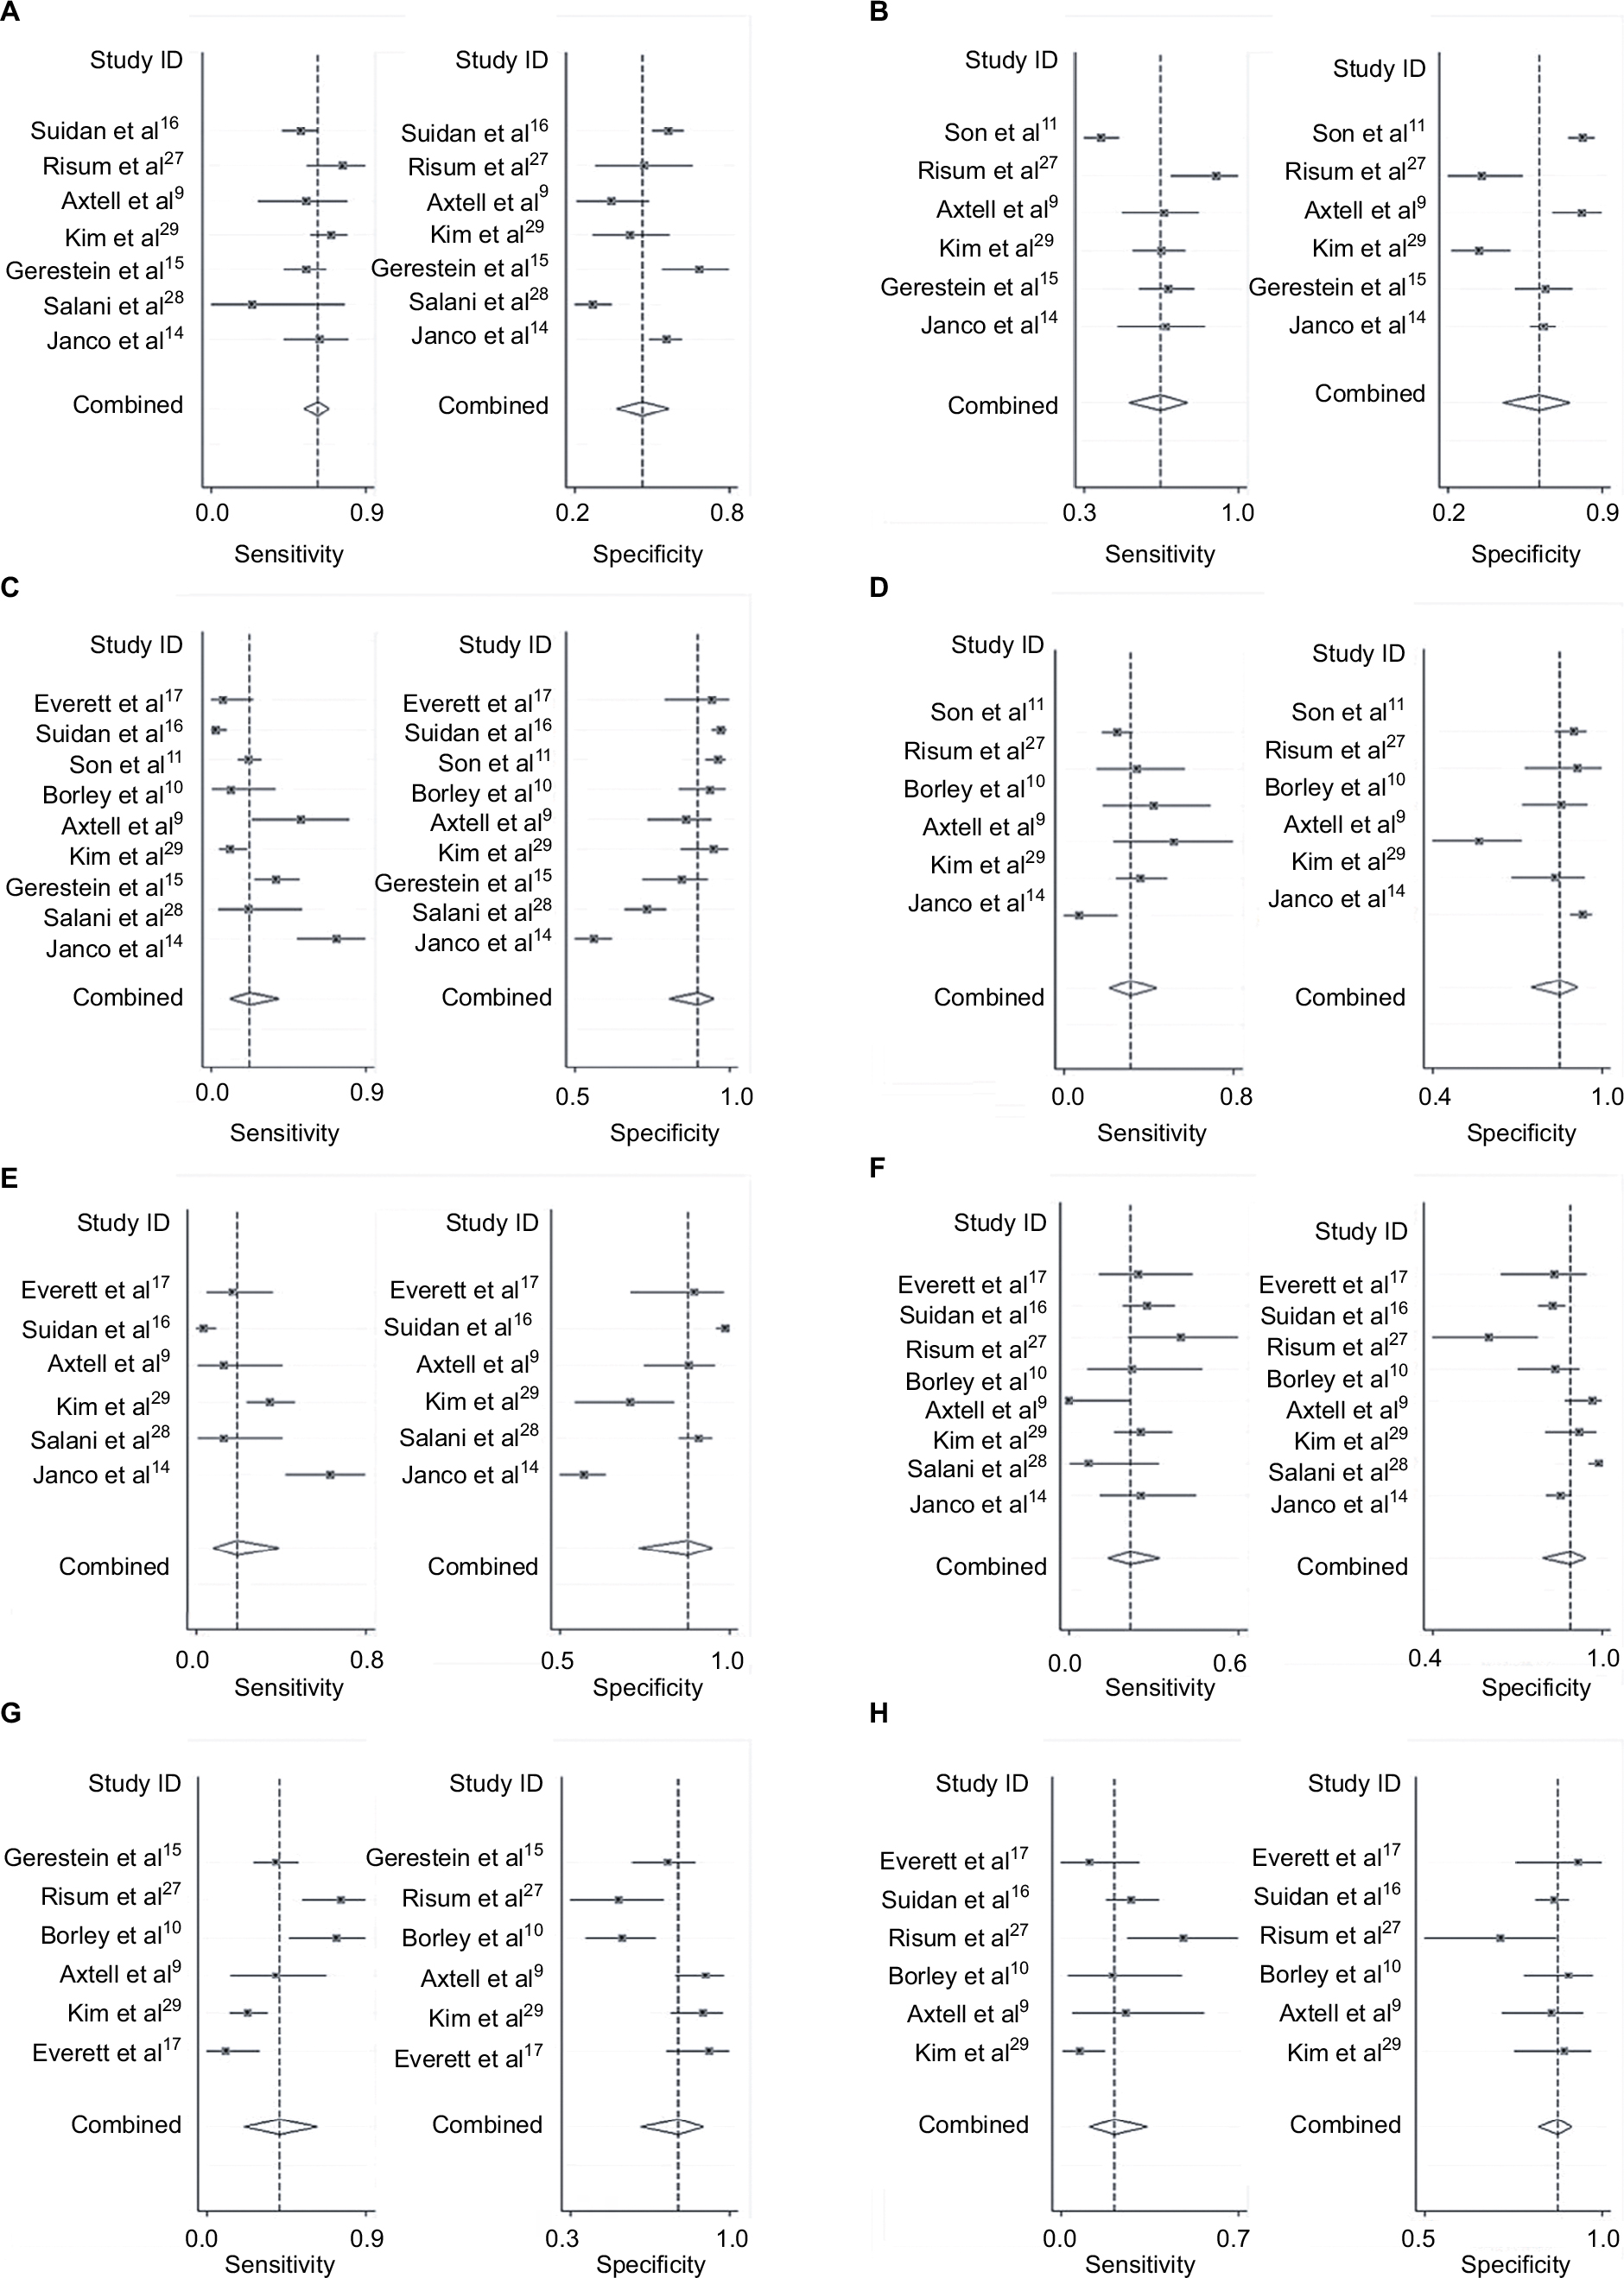 | Figure 3 Forest plots of sensitivity and specificity according to each CT finding. Notes: (A) Large volume ascites. (B) Peritoneal involvement. (C) Diaphragm or lung involvement. (D) Pleural effusion. (E) Liver involvement. (F) Lymph nodes involvement. (G) Large bowel mesentery involvement. (H) Small bowel mesentery involvement. Abbreviation: CT, computed tomography. |
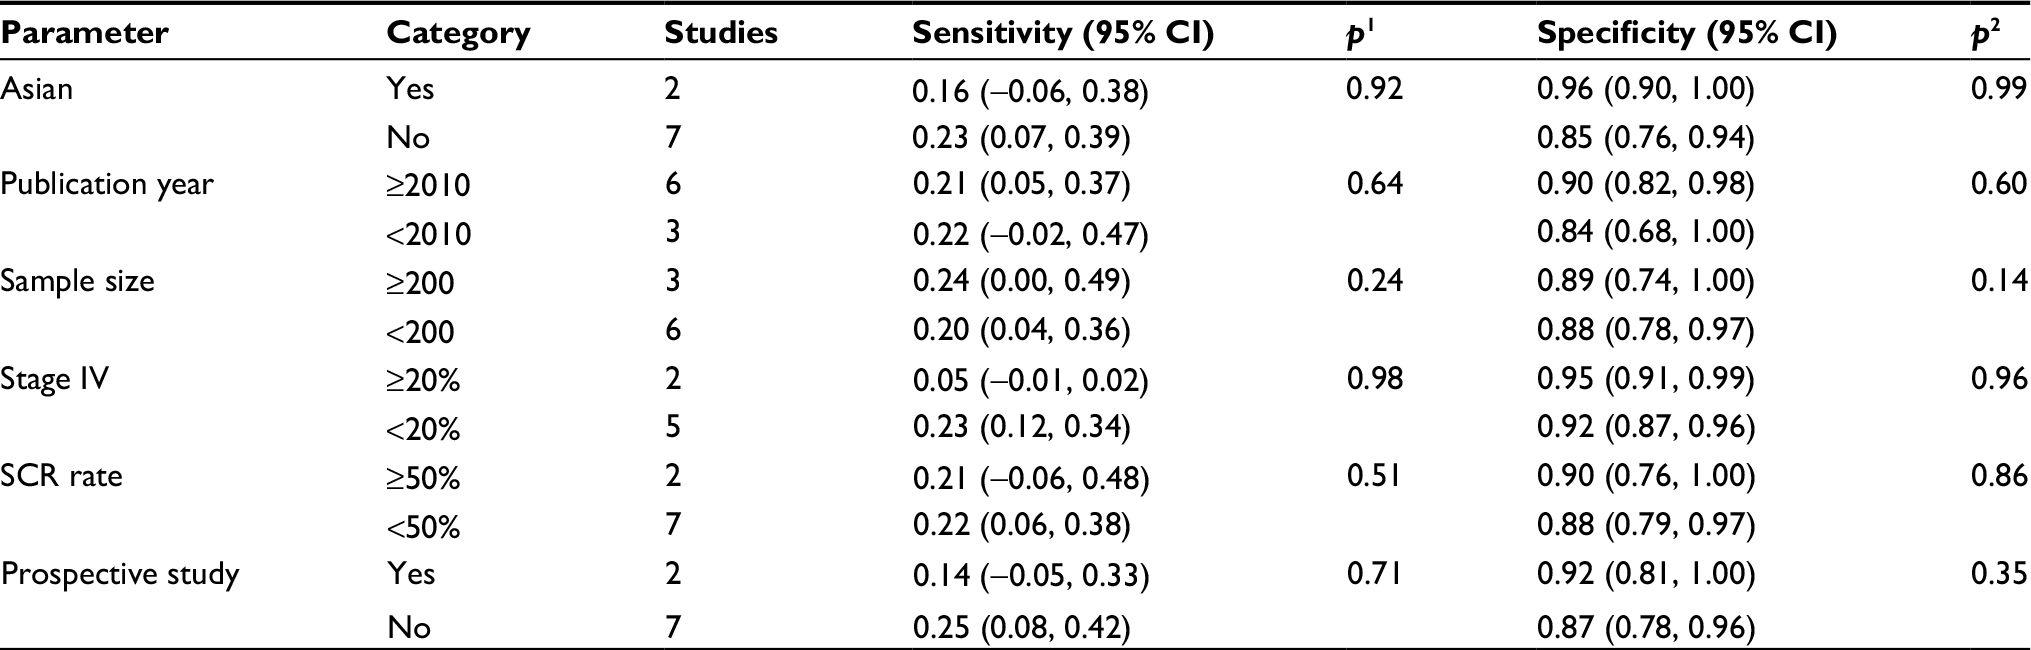 | Table 3 Meta-regression analysis of diaphragm or lung involvement with various parameters Abbreviations: SCR, suboptimal cytoreduction; p1, the p-value of sensitivity; p2, the p-value of specificity. |
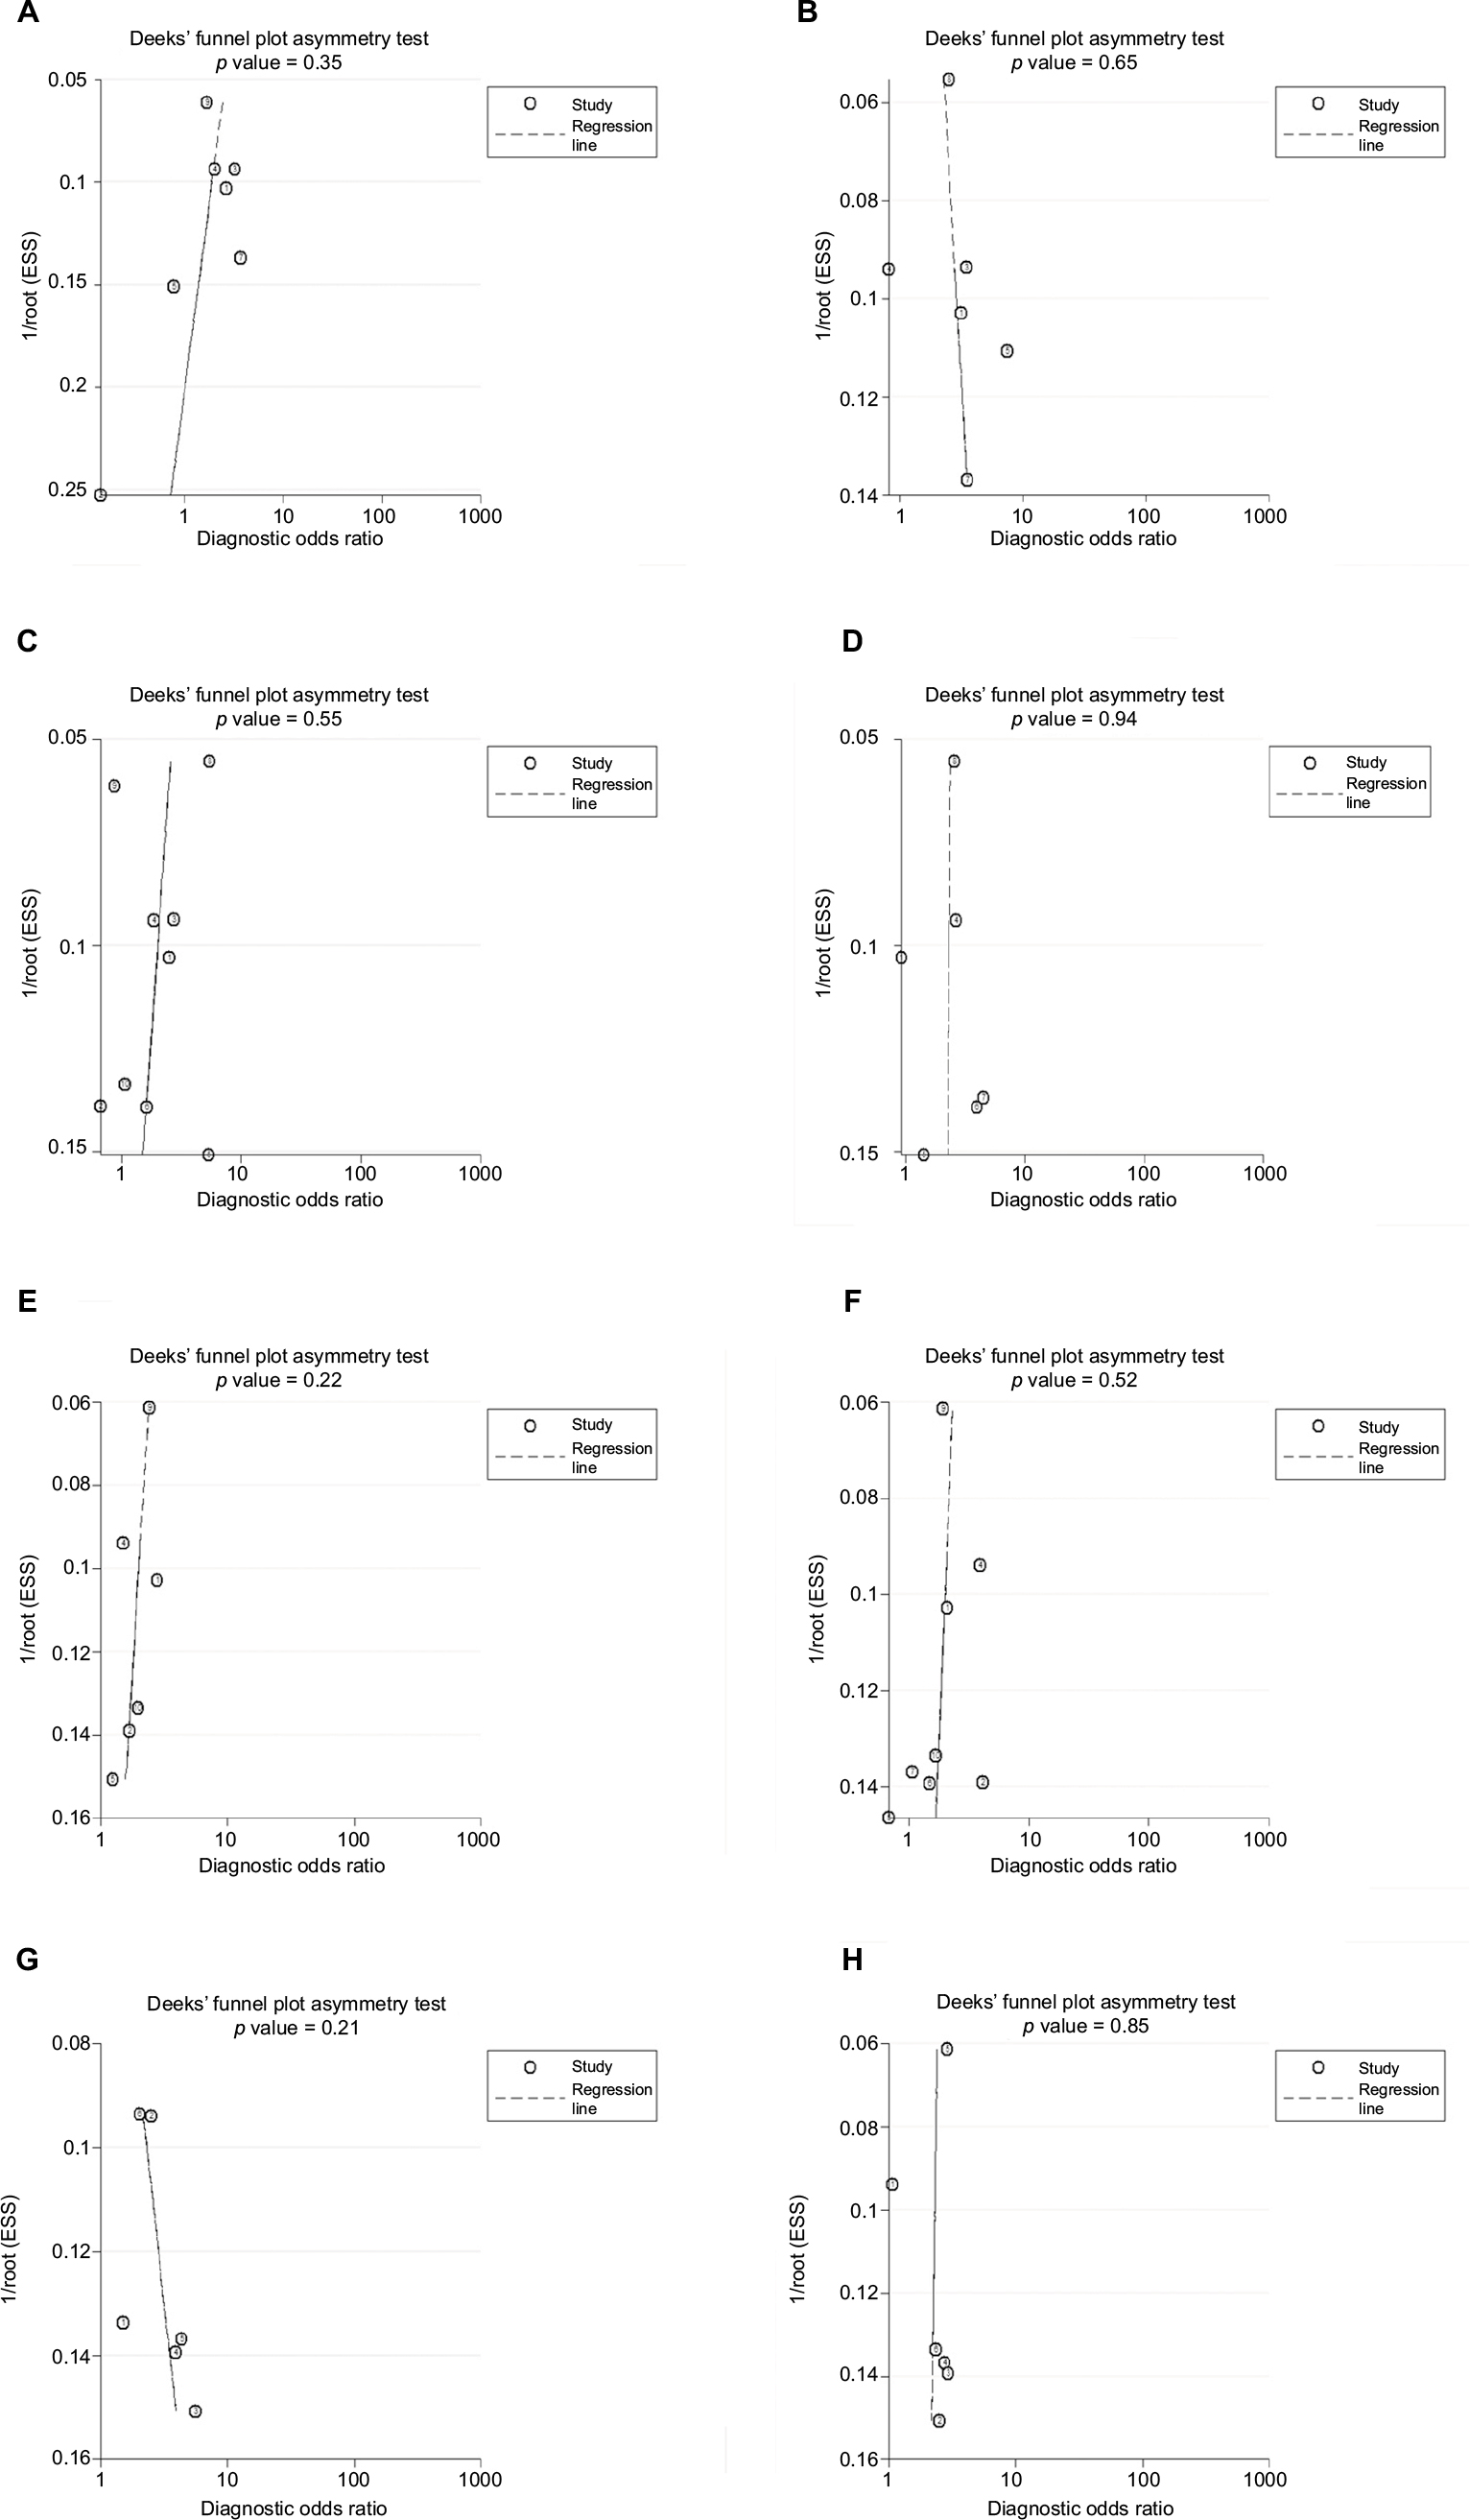 | Figure 4 Deeks’ funnel plots of publication bias for each CT finding. Notes: (A) Large volume ascites. (B) Peritoneal involvement. (C) Diaphragm or lung involvement. (D) Pleural effusion. (E) Liver involvement. (F) Lymph node involvement. (G) Large bowel mesentery involvement. (H) Small bowel mesentery involvement. Abbreviation: CT, computed tomography. |
Discussion
This meta-analysis provides an overview of eight most used preoperative CT parameters and their performance in predicting residual disease after primary cytoreductive surgery for advanced OC. In summary, our meta-analysis demonstrated that the eight preoperative CT findings had limited ability to predict the outcome of suboptimal cytoreductive surgery. The predictive performances of all the CT features were considerably lower when they were pooled and analyzed in our study, as PLR of all the CT signs ranged from 1.3 to 2.0, NLR from 0.61 to 0.90 and DOR from 2 to 3. Considering the low PLR and high NLR, these preoperative CT findings may not be reliable enough for clinical decision-making and should be interpreted with caution.
The reason why the predictive performance of preoperative CT images was limited may be explicated as follows: on the one hand, there was a great deal of interobserver variability between different CT readers in the assessment of the radiographic features, which underscores that radiographic parameters are prone to biased interpretation in this experience-dependent process, especially when there was only one radiologist to read and interpret the CT scans.14,27 This may result in dozens of potential predictors claimed in preoperative CT findings with poor forecasting performance.
On the other hand, surgical outcome is highly dependent on the surgeon’s philosophy, commitment and the ability to utilize advanced surgical techniques to achieve maximal cytoreduction.30 Some surgeons, for example, adopt a more aggressive approach such as resection of bowel, bladder, liver, spleen or diaphragm to achieve complete tumor resection. Moreover, the judgment of suboptimal vs. optimal cytoreduction is subjective if there is no postoperative CT evidence, especially when judged by only one surgeon. A study36 pointed out that residual disease larger than 1 cm was present on early postoperative CT in almost half of the patients deemed to have optimally debulked disease at primary cytoreduction. In addition, the characteristics of patients could impact the rates of unresectable disease. It is well known that a more conservative surgical operation is recommended for patients unable to withstand extensive surgical procedures due to poor physical condition or extensive extra-abdominal disease. In consequence, there is a wide spread in the percentage of optimal (<1 cm residual tumor) and suboptimal (>1 cm residual tumor) surgeries between hospitals worldwide and this may lead to the limited performance of preoperative CT findings in predicting SCR.
Over the past several years, there has been an increasing interest in exploring capable avenues to help determine who is the ideal candidate for surgery. A meta-analysis by Kang et al31 showed that a preoperative serum CA-125 level >500 U/mL was strongly associated with SCR (odds ratio 3.69, 95% CI 2.02–6.73). More recently, the Anderson algorithm32 was raised to improve the rate of complete cytoreduction in advanced OC patients. It emphasized the importance of a preoperative laparoscopy-based score33 in predicting surgical outcome in advanced OC patients. The parameters of this scoring system include ovarian masses (unilateral or bilateral), omental cake, peritoneal carcinosis, diaphragmatic carcinosis, mesenteric retraction, bowel infiltration, stomach infiltration and liver metastases. The calculated DOR of peritoneal carcinosis, diaphragmatic carcinosis and liver metastases of the laparoscopy-based score was 8, 12 and 8, respectively, all beyond the corresponding results from CT parameters in our meta-analysis. It is likely that the predictive performance of laparoscopy for SCR in advanced OC is better than that of CT scans. However, considering the undetectability of retroperitoneal space, anesthetic risk, laparoscopic incision and the expense of laparoscopic surgery, comprehensive assessment should be applied before choosing preoperative CT scan or laparoscopy during clinical treatment.
To our knowledge, this is the first meta-analysis that explored the association between specific preoperative CT findings and the outcome of primary cytoreductive surgery in advanced OC. The predictive performance of the eight most used CT findings was estimated using sensitivity, specificity, PLR, NLR and DOR. Furthermore, we analyzed the quality of each report with QUADAS-2,21 which ensured that systematic quality check was conducted for all the studies included.
However, this meta-analysis has limitations. First, limitation arises from the retrospective nature of the studies included and the resulting lack of data. Patients who were not operated on were not included in the studies, leaving the unselected patients unaccounted for the investigation for parameters’ performance and proper combination.34 Second, the current meta-analysis included a relatively small number of studies covering only eight, not all, CT findings. Consequently, further investigations are required to assess the relationship between comprehensive CT findings and surgical outcome. Third, the heterogeneity between studies was observed, but the meta-regression did not indicate any causative variable for the heterogeneity. Subsequently, to further explore the sources of heterogeneity and the stability of the pooled results, sensitivity analysis was performed by excluding one study at a time, where no significant influence on the stability of the results was identified. Thus, this heterogeneity may come from the retrospective nature and relatively small size of the individual studies. Fourth, there were some risk of bias in this meta-analysis, as 2/10 studies had only one CT reader and 2/10 studies failed to provide information on CT reader. As an experience-dependent process, the image interpretations and the detection of CT signs certainly differed between studies. Moreover, 2/10 studies did not comment on the operating surgeon, and there was only one surgeon in 2/10 studies, which may result in a more subjective judgment of surgical outcome. Additionally, 1/10 study used the CT signs within 90 days before operation and 3/10 studies did not report the time between CT and surgery. For predicting the surgical outcome, the closer the operative time, the more reliable the preoperative CT results. Fifth, not all the studies covered the eight CT findings, and thus, the diagnostic accuracy of each CT finding may be impacted by a different sample size or study quality. However, at least 6/10 studies were included to analysis each CT finding, and so we consider that the results of this analysis were reliable. Further research attempting to construct a prediction model using these data would be interesting, and international collaboration is needed to develop and validate a prediction model35 that can be applied universally.
In conclusion, the present study indicates that preoperative CT images have a poor discriminative capacity to predict the outcome of SCR in advanced OC. Caution should be exercised by clinicians who take the implication from preoperative CT predictors into account when choosing between primary surgical exploration and neoadjuvant chemotherapy in medically fit patients. We suggest that CT scan be regarded as a supplementary evidence that should be considered along with other parameters in clinical decision making for advanced OC. The results of this meta-analysis may be applied in preoperative surgical counseling and treatment planning.
Acknowledgments
We would like to thank Lisa Tsang for English language editing, all clinical researchers of the included studies and patients related to these studies. This meta-analysis was supported by grants from the Sichuan Youth Foundation of Science of Technology (grant number: 2015JQ0026).
Disclosure
The authors report no conflicts of interest in this work.
References
Siegel RL, Miller KD, Jemal A. Cancer statistics, 2016. CA Cancer J Clin. 2016;66(1):7–30. | ||
Siegel R, Naishadham D, Jemal A. Cancer statistics, 2013. CA Cancer J Clin. 2013;63(1):11–30. | ||
Vergote I, Tropé CG, Amant F, et al. Neoadjuvant chemotherapy or primary surgery in stage IIIC or IV ovarian cancer. N Engl J Med. 2010;363(10):943–953. | ||
du Bois A, Reuss A, Pujade-Lauraine E, Harter P, Ray-Coquard I, Pfisterer J. Role of surgical outcome as prognostic factor in advanced epithelial ovarian cancer: a combined exploratory analysis of 3 prospectively randomized phase 3 multicenter trials: by the Arbeitsgemeinschaft Gynaekologische Onkologie Studiengruppe Ovarialkarzinom (AGO-OVAR) and the Groupe d’Investigateurs Nationaux Pour les Etudes des Cancers de l’Ovaire (GINECO). Cancer. 2009;115(6):1234–1244. | ||
Chi DS, Eisenhauer EL, Lang J, et al. What is the optimal goal of primary cytoreductive surgery for bulky stage IIIC epithelial ovarian carcinoma (EOC)? Gynecol Oncol. 2006;103(2):559–564. | ||
Ozols RF, Bundy BN, Greer BE, et al. Phase III trial of carboplatin and paclitaxel compared with cisplatin and paclitaxel in patients with optimally resected stage III ovarian cancer: a Gynecologic Oncology Group study. J Clin Oncol. 2003;21(17):3194–3200. | ||
Chi DS, Franklin CC, Levine DA, et al. Improved optimal cytoreduction rates for stages IIIC and IV epithelial ovarian, fallopian tube, and primary peritoneal cancer: a change in surgical approach. Gynecol Oncol. 2004;94(3):650–654. | ||
Hoskins WJ, McGuire WP, Brady MF, et al. The effect of diameter of largest residual disease on survival after primary cytoreductive surgery in patients with suboptimal residual epithelial ovarian carcinoma. Am J Obstet Gynecol. 1994;170(4):974–979; discussion 979–980. | ||
Axtell AE, Lee MH, Bristow RE, et al. Multi-institutional reciprocal validation study of computed tomography predictors of suboptimal primary cytoreduction in patients with advanced ovarian cancer. J Clin Oncol. 2007;25(4):384–389. | ||
Borley J, Wilhelm-Benartzi C, Yazbek J, et al. Radiological predictors of cytoreductive outcomes in patients with advanced ovarian cancer. BJOG. 2015;122(6):843–849. | ||
Son HM, Kim SH, Kwon BR, Kim MJ, Kim CS, Cho SH. Preoperative prediction of suboptimal resection in advanced ovarian cancer based on clinical and CT parameters. Acta Radiol. 2017;58(4):498–504. | ||
Qayyum A, Coakley FV, Westphalen AC, Hricak H, Okuno WT, Powell B. Role of CT and MR imaging in predicting optimal cytoreduction of newly diagnosed primary epithelial ovarian cancer. Gynecol Oncol. 2005;96(2):301–306. | ||
Dowdy SC, Mullany SA, Brandt KR, Huppert BJ, Cliby WA. The utility of computed tomography scans in predicting suboptimal cytoreductive surgery in women with advanced ovarian carcinoma. Cancer. 2004;101(2):346–352. | ||
Janco JM, Glaser G, Kim B, et al. Development of a prediction model for residual disease in newly diagnosed advanced ovarian cancer. Gynecol Oncol. 2015;138(1):70–77. | ||
Gerestein CG, Eijkemans MJ, Bakker J, et al. Nomogram for suboptimal cytoreduction at primary surgery for advanced stage ovarian cancer. Anticancer Res. 2011;31(11):4043–4049. | ||
Suidan RS, Ramirez PT, Sarasohn DM, et al. A multicenter prospective trial evaluating the ability of preoperative computed tomography scan and serum CA-125 to predict suboptimal cytoreduction at primary debulking surgery for advanced ovarian, fallopian tube, and peritoneal cancer. Gynecol Oncol. 2014;134(3):455–461. | ||
Everett EN, Heuser CC, Pastore LM, et al. Predictors of suboptimal surgical cytoreduction in women treated with initial cytoreductive surgery for advanced stage epithelial ovarian cancer. Am J Obstet Gynecol. 2005;193(2):568–574; discussion 574–576. | ||
MacKintosh ML, Rahim R, Rajashanker B, et al. CT scan does not predict optimal debulking in stage III–IV epithelial ovarian cancer: a multicentre validation study. J Obstet Gynaecol. 2014;34(5):424–428. | ||
Bristow RE, Duska LR, Lambrou NC, et al. A model for predicting surgical outcome in patients with advanced ovarian carcinoma using computed tomography. Cancer. 2000;89(7):1532–1540. | ||
Nelson BE, Rosenfield AT, Schwartz PE. Preoperative abdominopelvic computed tomographic prediction of optimal cytoreduction in epithelial ovarian carcinoma. J Clin Oncol. 1993;11(1):166–172. | ||
Whiting PF, Rutjes AW, Westwood ME, et al. QUADAS-2: a revised tool for the quality assessment of diagnostic accuracy studies. Ann Intern Med. 2011;155(8):529–536. | ||
Deeks JJ, Altman DG. Diagnostic tests 4: likelihood ratios. BMJ. 2004;329(7458):168–169. | ||
Dinnes J, Deeks J, Kirby J, Roderick P. A methodological review of how heterogeneity has been examined in systematic reviews of diagnostic test accuracy. Health Technol Assess. 2005;9(12):1–113. | ||
Stuck AE, Rubenstein LZ, Wieland D. Bias in meta-analysis detected by a simple, graphical test. Asymmetry detected in funnel plot was probably due to true heterogeneity. BMJ. 1998;316(7129):469, 470–471. | ||
Deeks JJ, Macaskill P, Irwig L. The performance of tests of publication bias and other sample size effects in systematic reviews of diagnostic test accuracy was assessed. J Clin Epidemiol. 2005;58(9):882–893. | ||
Thompson SG, Sharp SJ. Explaining heterogeneity in meta-analysis: a comparison of methods. Stat Med. 1999;18(20):2693–2708. | ||
Risum S, Høgdall C, Loft A, et al. Prediction of suboptimal primary cytoreduction in primary ovarian cancer with combined positron emission tomography/computed tomography – a prospective study. Gynecol Oncol. 2008;108(2):265–270. | ||
Salani R, Axtell A, Gerardi M, Holschneider C, Bristow RE. Limited utility of conventional criteria for predicting unresectable disease in patients with advanced stage epithelial ovarian cancer. Gynecol Oncol. 2008;108(2):271–275. | ||
Kim HJ, Choi CH, Lee YY, et al. Surgical outcome prediction in patients with advanced ovarian cancer using computed tomography scans and intraoperative findings. Taiwan J Obstet Gynecol. 2014;53(3):343–347. | ||
Aletti GD, Gostout BS, Podratz KC, Cliby WA. Ovarian cancer surgical resectability: relative impact of disease, patient status, and surgeon. Gynecol Oncol. 2006;100(1):33–37. | ||
Kang S, Kim TJ, Nam BH, et al. Preoperative serum CA-125 levels and risk of suboptimal cytoreduction in ovarian cancer: a meta-analysis. J Surg Oncol. 2010;101(1):13–17. | ||
Nick AM, Coleman RL, Ramirez PT, Sood AK. A framework for a personalized surgical approach to ovarian cancer. Nat Rev Clin Oncol. 2015;12(4):239–245. | ||
Fagotti A, Ferrandina G, Fanfani F, et al. A laparoscopy-based score to predict surgical outcome in patients with advanced ovarian carcinoma: a pilot study. Ann Surg Oncol. 2006;13(8):1156–1161. | ||
Simon R, Altman DG. Statistical aspects of prognostic factor studies in oncology. Brit J Cancer. 1994;69(6):979–985. | ||
Mann CJH. Clinical prediction models: a practical approach to development, validation and updating. J Royal Stat Soc. 2009;172:661–662. | ||
Lakhman Y, Akin O, Sohn MJ, et al. Early postoperative CT as a prognostic biomarker in patients with advanced ovarian, tubal, and primary peritoneal cancer deemed optimally debulked at primary cytoreductive surgery. AJR Am J Roentgenol. 2012;198(6):1453–1459. |
Supplementary material
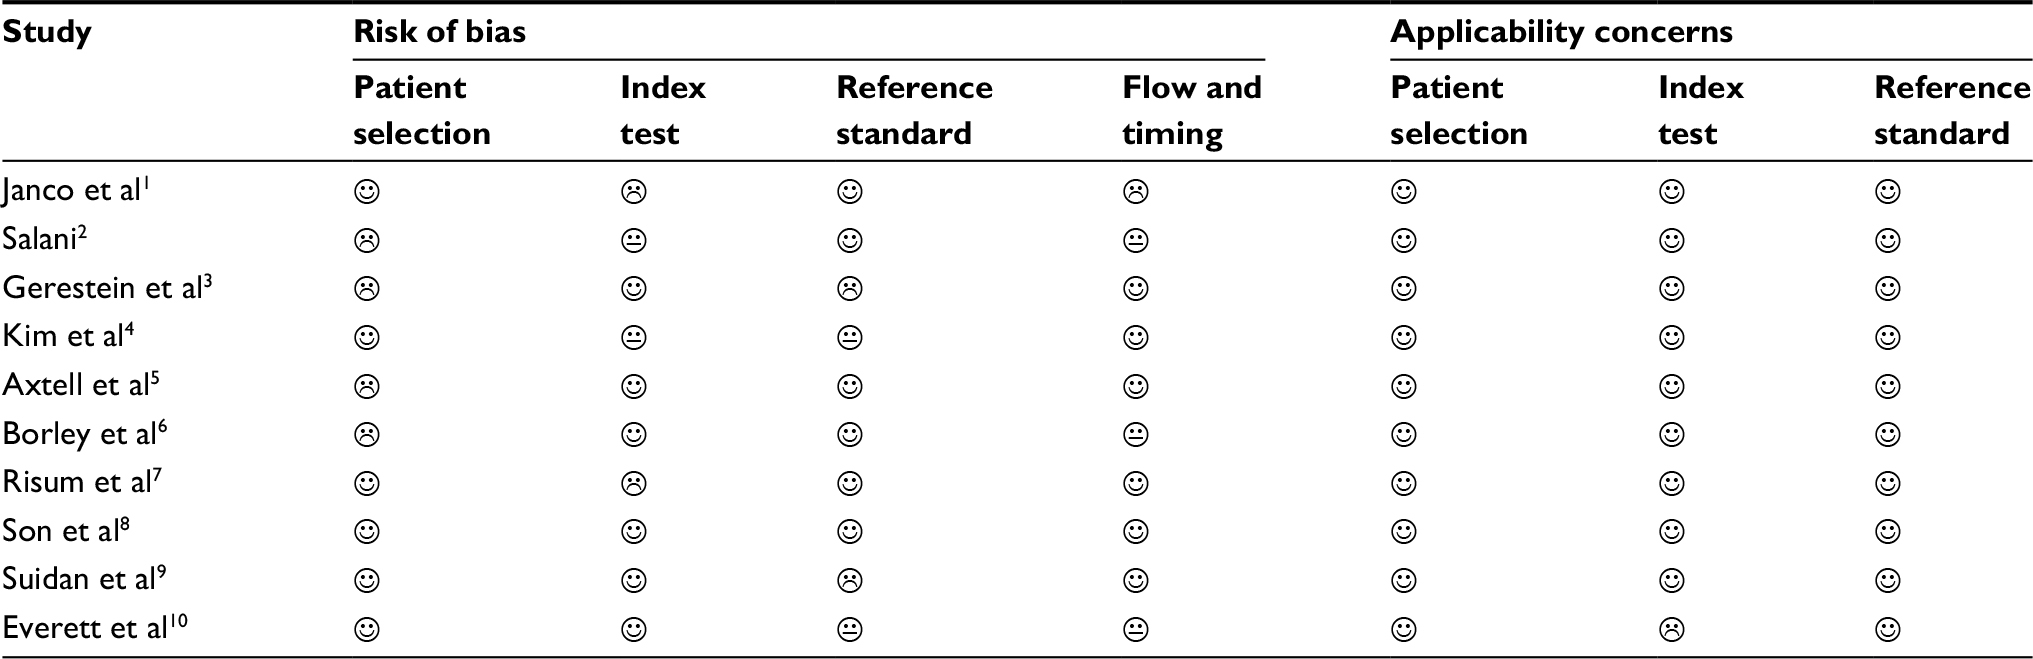 | Table S1 Quality assessment of included studies: QUADAS-2 evaluation Notes: ☺=low risk; ☹=high risk; Abbreviation: QUADAS-2, second edition of the Quality Assessment of Diagnostic Accuracy Studies. |
 =unclear risk.
References
Janco JM, Glaser G, Kim B, et al. Development of a prediction model for residual disease in newly diagnosed advanced ovarian cancer. Gynecol Oncol. 2015;138(1):70–77. | ||
Salani R, Axtell A, Gerardi M, Holschneider C, Bristow RE. Limited utility of conventional criteria for predicting unresectable disease in patients with advanced stage epithelial ovarian cancer. Gynecol Oncol. 2008;108(2):271–275. | ||
Gerestein CG, Eijkemans MJ, Bakker J, et al. Nomogram for suboptimal cytoreduction at primary surgery for advanced stage ovarian cancer. Anticancer Res. 2011;31(11):4043–4049. | ||
Kim HJ, Choi CH, Lee YY, et al. Surgical outcome prediction in patients with advanced ovarian cancer using computed tomography scans and intraoperative findings. Taiwan J Obstet Gynecol. 2014;53(3):343–347. | ||
Axtell AE, Lee MH, Bristow RE, et al. Multi-institutional reciprocal validation study of computed tomography predictors of suboptimal primary cytoreduction in patients with advanced ovarian cancer. J Clin Oncol. 2007;25(4):384–389. | ||
Borley J, Wilhelm-Benartzi C, Yazbek J, et al. Radiological predictors of cytoreductive outcomes in patients with advanced ovarian cancer. BJOG. 2015;122(6):843–849. | ||
Risum S, Høgdall C, Loft A, et al. Prediction of suboptimal primary cytoreduction in primary ovarian cancer with combined positron emission tomography/computed tomography – a prospective study. Gynecol Oncol. 2008;108(2):265–270. | ||
Son HM, Kim SH, Kwon BR, Kim MJ, Kim CS, Cho SH. Preoperative prediction of suboptimal resection in advanced ovarian cancer based on clinical and CT parameters. Acta Radiol. 2017;58(4):498–504. | ||
Suidan RS, Ramirez PT, Sarasohn DM, et al. A multicenter prospective trial evaluating the ability of preoperative computed tomography scan and serum CA-125 to predict suboptimal cytoreduction at primary debulking surgery for advanced ovarian, fallopian tube, and peritoneal cancer. Gynecol Oncol. 2014;134(3):455–461. | ||
Everett EN, Heuser CC, Pastore LM, et al. Predictors of suboptimal surgical cytoreduction in women treated with initial cytoreductive surgery for advanced stage epithelial ovarian cancer. Am J Obstet Gynecol. 2005;193(2):568–574; discussion 574–576. |
 © 2018 The Author(s). This work is published and licensed by Dove Medical Press Limited. The full terms of this license are available at https://www.dovepress.com/terms.php and incorporate the Creative Commons Attribution - Non Commercial (unported, v3.0) License.
By accessing the work you hereby accept the Terms. Non-commercial uses of the work are permitted without any further permission from Dove Medical Press Limited, provided the work is properly attributed. For permission for commercial use of this work, please see paragraphs 4.2 and 5 of our Terms.
© 2018 The Author(s). This work is published and licensed by Dove Medical Press Limited. The full terms of this license are available at https://www.dovepress.com/terms.php and incorporate the Creative Commons Attribution - Non Commercial (unported, v3.0) License.
By accessing the work you hereby accept the Terms. Non-commercial uses of the work are permitted without any further permission from Dove Medical Press Limited, provided the work is properly attributed. For permission for commercial use of this work, please see paragraphs 4.2 and 5 of our Terms.