")
Back to Journals » Journal of Inflammation Research » Volume 14
Predictive Models for HCC Prognosis, Recurrence Risk, and Immune Infiltration Based on Two Exosomal Genes: MYL6B and THOC2
Authors Zhu J, Tang B, Gao Y, Xu S, Tu J, Wang Y, Yang W, Fang S, Weng Q , Zhao Z, Xu M, Yang Y, Chen M, Lu C, Ji J
Received 15 April 2021
Accepted for publication 6 August 2021
Published 24 August 2021 Volume 2021:14 Pages 4089—4109
DOI https://doi.org/10.2147/JIR.S315957
Checked for plagiarism Yes
Review by Single anonymous peer review
Peer reviewer comments 3
Editor who approved publication: Professor Ning Quan
Jinyu Zhu,1,2,* Bufu Tang,1,3,* Yang Gao,1,4 Suqin Xu,5 Jianfei Tu,1,4 Yajie Wang,4 Weibin Yang,1,4 Shiji Fang,4 Qiaoyou Weng,4 Zhongwei Zhao,1,4 Min Xu,1,4 Yang Yang,1,4 Minjiang Chen,1,4 Chenying Lu,1,4 Jiansong Ji1,4
1Key Laboratory of Imaging Diagnosis and Minimally Invasive Intervention Research, Lishui Hospital, School of Medicine, Zhejiang University, Lishui, 323000, People’s Republic of China; 2Department of Radiology, Second Affiliated Hospital, School of Medicine, Zhejiang University, Hangzhou, 310016, People’s Republic of China; 3Department of Radiology, Sir Run Run Shaw Hospital, Zhejiang University School of Medicine, Hangzhou, 310016, People’s Republic of China; 4Department of Radiology, The Fifth Affiliated Hospital of Wenzhou Medical University, Lishui, 323000, People’s Republic of China; 5Clinical Laboratory, Fuyuan Hospital of Yiwu, Jinhua, 321000, People’s Republic of China
*These authors contributed equally to this work
Correspondence: Jiansong Ji; Chenying Lu Email [email protected]; [email protected]
Introduction: Hepatocellular carcinoma (HCC) is a heterogeneous molecular disease with complex molecular pathogenesis that influences the efficacy of therapies. Exosomes play a crucial role in tumorigenesis and poor disease outcomes in HCC.
Objective: The aim of this study was to identify the optimal gene set derived from exosomes in HCC with substantial predictive value to construct models for determining prognosis, recurrence risk and diagnosis and to identify candidates suitable for immunotherapy and chemotherapy, thereby providing new ideas for the individualized treatment of patients and for improving prognosis.
Methods: Weighted correlation network analysis (WGCNA) and univariate and multivariate Cox PH regression analyses were applied to identify exosome-related signatures in the TCGA and exoRbase databases associated with clinical relevance, immunogenic features and tumor progression in HCC. Cell experiments were performed to further confirm the oncogenic effect of MYL6B and THOC2.
Results: The models for prognosis and recurrence risk prediction were built based on two exosomal genes (MYL6B and THOC2) and were confirmed to be independent predictive factors with superior predictive performance. Patients with high prognostic risk had poorer prognosis than patients with low prognostic risk in all HCC datasets, namely, the TCGA cohort (HR=2.5, P< 0.001), the ICGC cohort (HR=3.15, P< 0.001) and the GSE14520 cohort (HR=1.85, P=0.004). A higher recurrence probability was found in HCC patients with high recurrence risk than in HCC patients with low recurrence risk in the TCGA cohort (HR=2.44, P< 0.001) and the GSE14520 cohort (HR=1.54, P=0.025). High prognostic risk patients had higher expression of immune checkpoint genes, such as PD1, B7H3, B7H5, CTLA4 and TIM3 (P< 0.05). Diagnostic models based on the same two genes were able to accurately distinguish HCC patients from normal individuals and HCC from dysplastic nodules.
Conclusion: Our findings lay the foundation for identifying molecular markers to increase the early detection rate of HCC, improve disease outcomes, and determine more effective individualized treatment options for patients.
Keywords: exosome, hepatocellular carcinoma, HCC, immune checkpoint, prognosis
Introduction
Liver cancer is the sixth most commonly diagnosed cancer worldwide and the fourth leading cause of cancer death with high morbidity and mortality rates;1 there were 905,677 new cases of liver cancer and 830,180 related deaths in 2020, according to the WHO statistics (https://gco.iarc.fr/today/fact-sheets-cancers). Hepatocellular carcinoma (HCC) accounts for most cases of liver cancer. HCC is a highly malignant tumor, its onset is insidious, and it progresses rapidly. Patients are often in advanced stages (BCLC stage B and stage C) at the time of diagnosis and cannot undergo surgery or transplantation, thereby leading to the average survival time of HCC is only 6 months.2,3 The efficacy of radiofrequency ablation (RFA) and transcatheter arterial chemoembolization (TACE), which are proposed treatments for advanced HCC, is also unsatisfactory.4 HCC is characterized by molecular heterogeneity, and its molecular pathogenesis is very complex.5 Although many new treatments for HCC have been proposed in recent years, less progress has been made in significantly improving the outcome of HCC.6,7 Therefore, there is an urgent need for a better understanding of the pathogenesis and molecular mechanism of HCC and the identification of novel key HCC markers to help determine more effective treatment strategies for patients.
Exosomes are a type of vesicle (30–100 nm) derived from endosomes and are shed by cells during cellular housekeeping and communication.8 Exosomes are important mediators of cell interactions, and they transmit information between cells through their membrane-enclosed structure and cytoplasmic content.9 Several studies have shown that the release rate and content of exosomes derived from cancer cells are significantly different from those originating from normal cells, and multiple types of cancer cell lines produce more exosomes than normal cells.10 During the progression of HCC, the secretion of cancer cell-derived exosomes has been shown to promote tumorigenesis, enhance angiogenesis and epithelial to mesenchymal transition, induce drug resistance and interfere with antitumor immune mechanisms, thereby promoting tumor progression and metastasis.11–13 Exosomes play an important role in the carcinogenic process of HCC, leading to poor patient outcomes; however, studies to date have mainly focused on exploring the role of a single factor of exosomes in the progression of HCC.14,15 No combination analyses have been conducted of exosome-derived molecules to assess the association between these molecules and the development and prognosis of HCC.
HCC is an immunogenic tumor that develops in a continuous immunomodulatory environment caused by chronic viral inflammation, such as hepatitis B (HBV) and hepatitis C (HCV) infections,16 and once HCC is recognized by the immune system, tumor cells are vulnerable to attacks by immune cells.17,18 Immunotherapy has received widespread attention in the antitumor field as a novel treatment option for HCC. However, tumor cells can enhance immunosuppression through immune checkpoint expression changes and immune cell aggregation, which can lead to immune escape and promote HCC progression.19–21 The immune activity of exosomes can affect the immunoregulatory mechanism of tumor cells, including the regulation of antigen presentation, immune activation, immune suppression, immune surveillance and immune escape.22,23 Further exploration of the marker molecules of exosomes and their relationship with the immune microenvironment of HCC may provide important insights for immune recognition and therapeutic intervention.
The emergence of high-throughput sequencing technology has increased the convenience of analyzing and identifying marker molecules that have an important impact on the immune microenvironment of HCC and disease prognosis.24 In this study, we aimed to identify the optimal gene set derived from exosomes in HCC with substantial predictive value through comprehensive analyses to construct prognostic, recurrence risk and diagnostic models and identify candidates suitable for immune checkpoint inhibitor immunotherapy and chemotherapy, thereby guiding individualized patient treatment options. Our results will help improve the early detection rate of HCC, develop individualized therapeutic plans and improve disease outcomes.
Materials and Methods
Identification of Differentially Expressed Genes (DEGs) between HCC and Adjacent Nontumor Tissues
The messenger RNA (mRNA) sequences of HCC patients with available clinical information were obtained from the TCGA (http://www.tcga.org/), ICGC (https://dcc.icgc.org/) and GEO databases (https://www.ncbi.nlm.nih.gov/geo/). The patients’ baseline character in the three cohorts were listed in Table S1. Exosome-derived mRNA sequences were downloaded from the exoRbase database (http://www.exorbase.org/), which is a repository containing information such as circular RNA (circRNA), long noncoding RNA (lncRNA) and mRNA sequences derived from RNA-seq data analysis of human blood exosomes, and the data sources include both normal individuals and patients with different diseases. Using the limma R package, DEGs with a threshold of absolute log2-fold change (FC) > 1 and an adjusted P value < 0.05 were chosen.
Weighted Correlation Network Analysis (WGCNA)
WGCNA25 was used to identify the HCC exosome-specific module in the exoRbase database (http://www.exorbase.org/). First, the R package “WGCNA” was applied to build an expression matrix of exosome-derived mRNAs in the exoRbase database. The best “soft threshold capability” was determined graphically as β=9 to ensure a scale-free distribution network, and the expression matrix and β value were adopted to construct a coexpression matrix. The DynamicTreeCut algorithm was employed to classify genes with similar expression levels into the same gene modules to generate coexpression modules. The eigengene function in the “WGCNA” R package was used to calculate the correlation between the module eigengenes (ME) of the module and HCC, and heat maps were used to visualize the correlation between each module and HCC. The “ME greenyellow” module with the highest correlation with HCC was identified as the HCC exosome-specific module, and the Pearson coefficient was calculated to evaluate the correlation between the genes in the module and HCC.
Construction and Validation of a Predictive Prognostic Model Based on the Identified Key Exosome-Derived Genes
Univariate Cox regression analysis was performed to identify exosome-derived genes related to the prognosis of patients with HCC. Genes with P<0.05 were considered statistically significant. The identified genes and other genes that the univariate Cox regression analysis considered not to be statistically significant but that have been clinically identified to have statistical significance in the prognosis of HCC patients were incorporated in subsequent multivariate Cox regression analysis. Through forward selection and backward elimination selection, the optimal gene set was obtained to construct a prognostic model. The prognostic index (PI) of the prognostic model was calculated as follows: (PI) =Σni=1(βi * ei). where βi represents the correlation coefficient between the gene (i) and HCC prognosis, and ei represents the expression level of gene. The expression level of genes can be obtained in HTSeq-FPKM in the TCGA database. HCC patients with known survival status were divided into high- and low-risk groups based on the optimal cutoff value determined by X-tile software. Kaplan-Meier (K-M) curve and time-dependent receiver operating characteristic (ROC) curve analyses were performed to evaluate the predictive performance of the prognostic model.
Establishment and Evaluation of a Predictive Nomogram
Univariate and multivariate Cox regression analyses were performed to assess whether the prognostic model can independently predict the prognosis of HCC patients compared to traditional clinical variables (including age, AFP, weight, vascular tumor cell, sex, pathological grade and TNM stage). The hazard ratio (HR) and 95% confidence interval (CI) for each variable were calculated. Variables with P<0.05 were considered statistically significant independent prognostic factors. Rms R software was used to integrate these independent prognostic factors to establish a predictive nomogram and corresponding calibration maps. Calibration and identification were used for the validation of calibration maps. The closer the calibration curve was to the reference line (at 45°), which represents the best prediction value, the better the prediction performance of the nomogram. The consistency index (C Index), calculated using a bootstrap method with 1000 resamples, was also adopted to validate the consistency between the predicted results of the nomogram and the actual results. In addition, ROC curve analysis was performed to evaluate the predictive value of the nomogram compared to a single independent prognostic factor, and decision curve analysis (DCA) was adapted to measure the difference in clinical benefit that could be achieved using the nomogram for prognosis prediction compared to using a single prognostic factor.26
Internal and External Validation of the Expression Profiles of Exosome-Derived Genes
Using Wilcoxon signed-rank tests in Prism 7.0 (GraphPad, San Diego, CA, USA), we compared the expression profile of a single gene in HCC tissues and normal tissues in the TCGA HCC cohort and confirmed gene expression differences in HCC tissues and nodule samples in the GSE6764 HCC cohort. P<0.05 was considered statistically significant. The K-M curve was used to evaluate the influence of the expression of a single gene on the prognosis, and ROC curve analysis was performed to validate the predicted influence of the gene. For external validation, we further confirmed the effect of single gene expression on prognosis and recurrence risk in the Kaplan-Meier Plotter database.27 The effect of single gene expression on immune cell infiltration in tumors was also evaluated.
Estimating the Fractions of Different Types of Immune Cells
CIBERSORT analysis was adopted to quantitatively analyze the absolute abundance of 22 immune cell types in heterogeneous tissue to evaluate the infiltration of immune cells.28 The R package “CIBERSORT” was used to convert the mRNA data from nontumor cells into the tumor microenvironment infiltration level.
Cell Culture and Transfection
SK-HEP1 and HCCLM3 cell lines were purchased from the American Type Culture Collection (ATCC) (Manassas, VA, USA). The cells were cultured in Dulbecco’s modified Eagle’s medium (DMEM) supplemented with 10% fetal bovine serum (FBS) and 100 U/mL penicillin-streptomycin in an incubator with an atmosphere of 5% CO2 and 95% relative humidity at 37°C.
The transfection process is briefly described as follows: MYL6B siRNAs and THOC2 siRNAs were synthesized by GeneChem (Shanghai, China), and Lipofectamine 2000 (Invitrogen, California, USA) was used to achieve cell transfection with these siRNAs. SK-HEP1 and HCCLM3 cell lines were resuspended in DMEM supplemented with 10% FBS and cultured in a 6-well plate at a density of approximately 40% for 12 hours. One hundred pmol of siRNA and 5 µL of Lipofectamine 2000 were dissolved in 250 µL of Opti-mem serum-free medium, mixed and allowed to stand for 20 minutes. The cells were washed with PBS 3 times, and 1.5 mL Opti-men and the mixture containing the corresponding siRNA and Lipofectamine 2000 were added to the cells. After 6 hours, the mixture was removed and the cells were then cultured in medium supplemented with serum. The sequences of the knockdown and control siRNAs are listed in the supporting information.
Western Blot Assay
RIPA lysis buffer (Invitrogen, Carlsbad, USA) supplemented with 1% protease and phosphatase inhibitor (Thermo, Shanghai, China) was used to obtain protein from SK-HEP1 and HCCLM3 cells. The separation of protein samples with different molecular weights was achieved by 10% sodium dodecyl sulfate-polyacrylamide gel electrophoresis (SDS-PAGE). The separated protein was electrotransferred to a polyvinylidene fluoride (PVDF) membrane (Invitrogen), which was then blocked with 5% skimmed milk at room temperature for 90 minutes, incubated with the primary antibody at 4 °C overnight, and subsequently incubated with the HRP-conjugated secondary antibody for 2 hours at room temperature. The iBright FL1500 intelligent imaging system (Invitrogen) was employed to detect the signal and image the blot. The antibody information is listed in the supporting information.
Cell Proliferation Assay
Cell counting kit-8 (CCK-8) assays (Dojindo, Tabaru, Mashikimachi, Japan) and 5-ethynyl-2ʹ-deoxyuridine (EdU) assays (Ruibo, Guangzhou, China) were employed to measure cell proliferation. The CCK-8 assay was performed as follows: SK-HEP1 and HCCLM3 cells were seeded in 96-well plates with 3000 cells and 100 μL DMEM per well. After the cells were incubated for 0, 24, 48 and 72 hours, the medium was changed to fresh medium supplemented with 10% CCK-8 reagent and the cells were incubated for another 2 hours at 37°C. The absorbance of the cells at 450 nm was detected using a microplate reader (Bio-Rad, Berkeley, CA, USA). Each group included three replicate wells. For the EdU assay, we seeded SK-HEP1 and HCCLM3 cells in a 96-well plate at 3000 cells per well. After 24 hours of incubation, 100 μL 50 μM EdU reagent was added to each well, and the incubation was continued for another 2 hours. Then, the cells were fixed with 4% polyoxymethylene for 30 minutes at room temperature and incubated with Apollo staining solution and Hoechst 33342 for 30 minutes. A fluorescence microscope was used to detect cell proliferation.
Cell Migration Assay
A Corning Costar Transwell chamber was used to conduct the cell migration assay. Serum-free DMEM (Gibco, NY, USA) was added to the upper chamber, and DMEM supplemented with 10% fetal bovine serum was added to the lower chamber. The transfected cells were trypsinized, centrifuged and resuspended in the medium in the upper chambers at a density of 1×10⁵ cells per well. After incubation at 37°C for 48 hours, non-migrated cells from the upper side of the upper chamber were removed by a cotton swab, and cells that migrated into the lower side of the upper chamber were stained with 0.1% crystal violet and counted under an optical microscope. Each experiment was repeated three times.
Statistical Analysis
GraphPad Prism 7 software (version 8.0) and R language (version 3.6.3) were applied to statistically analyze the experimental data and generate figures. The quantitative data are presented as the mean ± standard error of the mean (SEM). The comparison of the mean of two independent samples was performed by Student’s t-test or Wilcoxon test. P values less than 0.05 were considered statistically significant.
Results
Identification of Exosome-Derived Genes Strongly Associated with HCC Prognosis
First, we drew a flowchart to vividly depict our experimental process (Figure S1). Through WGCNA, we divided the exosome-derived mRNAs in the exoRbase database into trait modules to collect genes with similar traits (Figure S2), thereby determining HCC exosome-specific modules that contained 168 hub genes (Figure 1A and B). Then, we identified 5775 DEGs in the TCGA database and 150 DEGs in the exoRbase database. Finally, a total of 19 HCC-related exosome-derived hub genes were incorporated in the subsequent analysis through integrated analysis (Figure 1C). The correlation between genes is shown in Figure 1D. GO analysis performed on these genes indicated that the genes were mainly enriched in “cytosolic ribosome”, “polysomal ribosome” and “ribosomal subunit” (Figure 1E). Through the univariate Cox regression analysis, we found that seven genes were closely related to the OS rate of HCC patients (P<0.05), and the subsequent multivariate Cox regression analysis revealed an optimal gene set consisting of two genes (MYL6B and THOC2) for predicting HCC prognosis (Table S2).
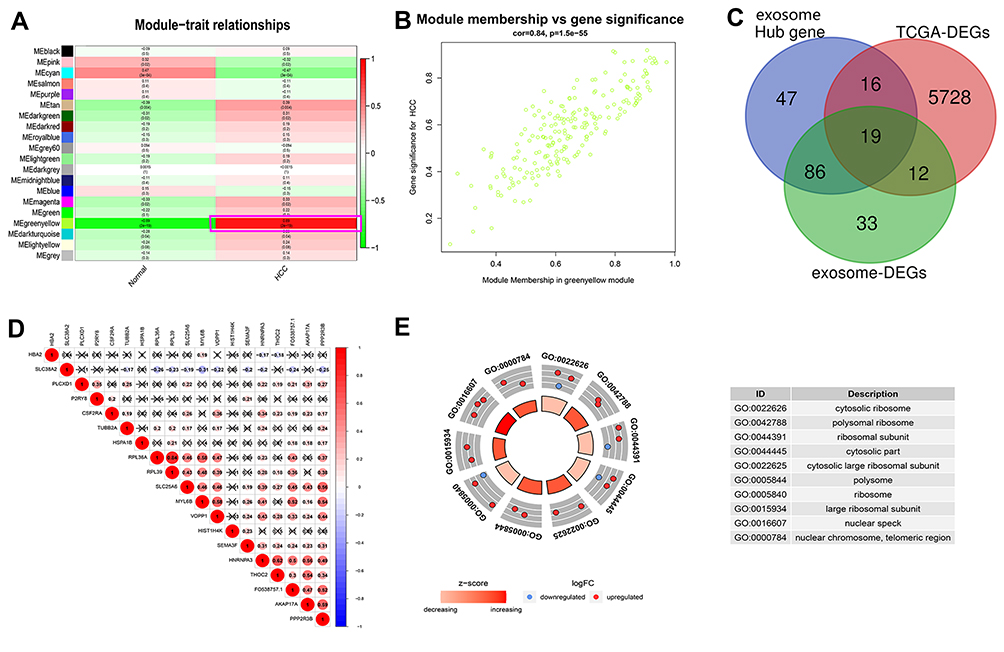 |
Figure 1 Identification of key exosome-derived genes in HCC. (A) Modules with different traits determined via WGCNA. (B) Identification of genes in the exosome-specific module in HCC. (C) Determination of key exosome-derived genes in HCC. (D) Correlation between exosome-derived genes. (E) GO analysis of the exosome-derived genes. WGCNA, weighted gene co-Expression network analysis. Abbreviations: GO, Gene ontology; WGCNA, weighted gene co-Expression network analysis. |
Establishment of a Prognostic Model and Validation of Its Predictive Performance
Based on the two exosome-derived genes, we constructed a prognostic model. The prognostic index was calculated as PI = (0.0273 * expression level of MYL6B) + (0.1931 * expression level of THOC2). The optimal cutoff value determined by X-tile software was used as the threshold to divide patients into a high-risk group and a low-risk group. The optimal cutoff was determined to be 1.331 in the HCC cohort in the TCGA database, 3.104 in the ICGC database and 1.863 in the GSE14520 dataset. The HCC cohort in the TCGA database was adopted as the training cohort, and the HCC cohorts in the ICGC database and the GSE14520 dataset were used as validation cohorts to evaluate the predictive performance of the prognostic model. Patients in the high-risk group had a worse prognosis than patients in the low-risk group in both the training cohort (P<0.001) (Figure 2A) and the validation cohorts (P<0.01) (Figure 2D and G). Figure 2B, E and H show the expression levels of the two exosome-derived genes in the patients and their corresponding risk scores. The area under the curve (AUC) at 0.5, 1, 3, and 5 years was 0.66, 0.68, 0.64, and 0.59, respectively, in the training cohort, indicating good predictive performance of the prognostic model (Figure 2C). The AUCs of the two validation cohorts at 0.5, 1, 3 and 4 years reached 0.72, 0.72, 0.68 and 0.63 (Figure 2F) and 0.66, 0.61, 0.62 and 0.59 (Figure 2I), respectively, confirming the good predictive value of the prognostic model.
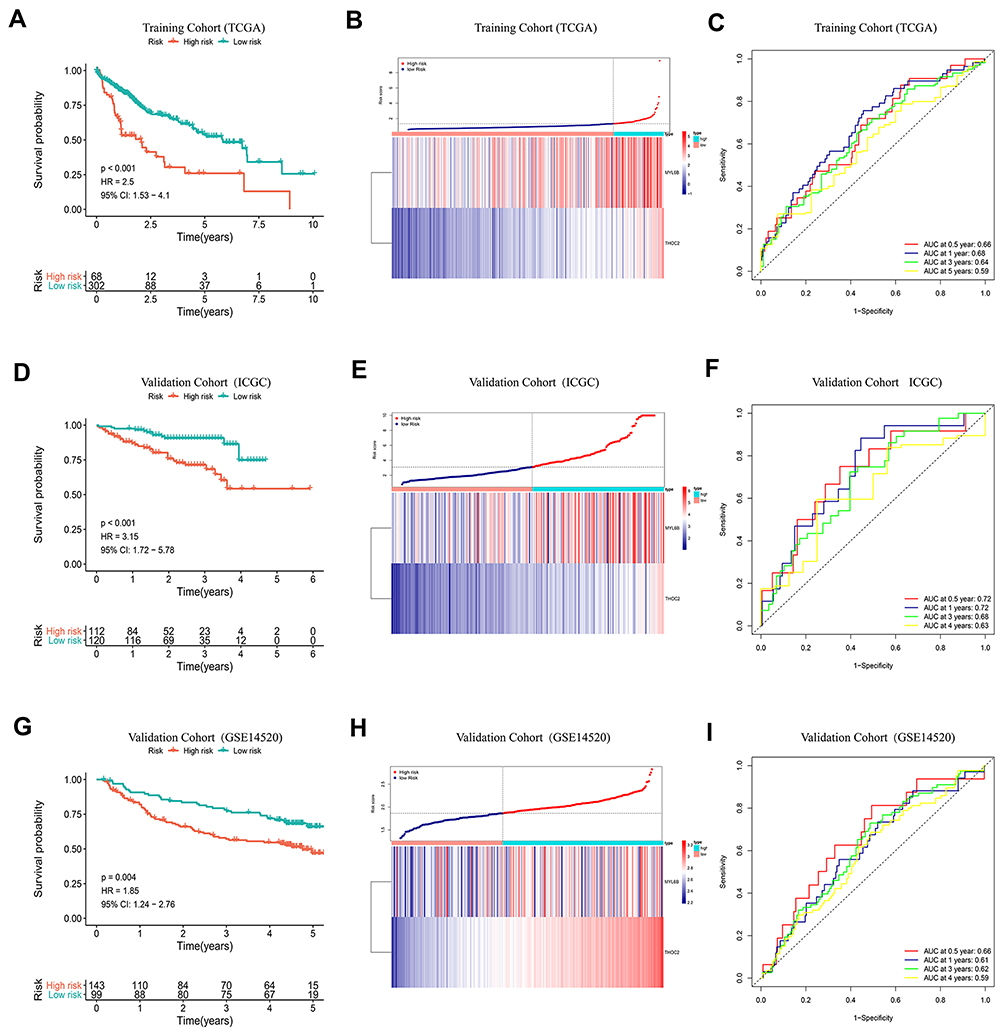 |
Figure 2 K-M curve analysis, risk score distribution and time-dependent ROC curve analysis of the prognostic model in the HCC cohorts from TCGA (A–C), ICGC (D–F) and GSE14520 (G–I). (A, D and G) Shorter survival times were presented in the high-risk group than in the low-risk group (P<0.01). (B, E and H) Distribution of prognostic risk scores based on the expression levels of the exosome-derived genes. (C, F and I) Time-dependent ROC curves of the prognostic model. Abbreviation: ROC curve, Receiver operating characteristic curve. |
Subsequently, the correlation between the risk scores obtained with the prognostic model and clinical variables was explored. Figure S3A shows the distribution of prognostic risk scores of patients stratified by traditional clinical variables and the expression profiles of the two exosome-derived genes. Patients with pathological grade G3-G4 HCC had a higher prognostic risk index than patients with G1-G2 HCC (Figure S3B) (P<0.05). The prognosis of patients with vascular tumor invasion was also significantly worse than the prognosis of those without vascular tumor invasion (P<0.05) (Figure S3C), consistent with clinically accepted diagnostic criteria. However, there was no significant difference in the prognostic risk among HCC patients with different TNM stages (Figure S3D).
Chemotherapy Response of Patients with Different Prognostic Risk Scores
Chemotherapy is one of the common treatment options for HCC patients. It is a suitable treatment option for HCC patients who cannot undergo surgery to reduce tumor volume and prolong survival time. It is also commonly used in postoperative adjuvant chemotherapy to suppress tumor recurrence and progression.29 The resistance of tumor cells to chemotherapeutics is a key factor that affects the efficacy of anticancer drugs. We adopted the prognostic model to evaluate the response of HCC patients to 266 traditional chemotherapeutic drugs and molecular targeted drugs using data available from the Genomics of Drug Sensitivity in Cancer (GDSC) website (https://www.cancerrxgene.org/). The half-maximum inhibitory concentration (IC50) was used as the criterion for tumor sensitivity to drugs. Figure 3A–L shows the difference between the sensitivity of high-risk patients and low-risk patients to drugs such as methotrexate, erlotinib and vinorelbine. High-risk patients were more resistant to chemotherapy than low-risk patients (P<0.05), suggesting that low-risk patients may respond better to chemotherapy. Through gene set enrichment analysis (GSEA), we explored the signaling pathways that the exosome-derived prognostic model mainly interferes with. Figure 3M presents the top 5 positively regulated pathways, and Figure 3N shows the top 5 negatively regulated pathways. We found that the prognostic model was involved in the regulation of several signaling pathways, including “DNA replication”,30 “homologous recombination”,31 and “mismatch repair”,32 which were determined to be associated with cancer cell chemoresistance in previous studies. The expression difference in these signaling pathways may partly explain the difference in chemoresistance among patients with different prognostic risk.
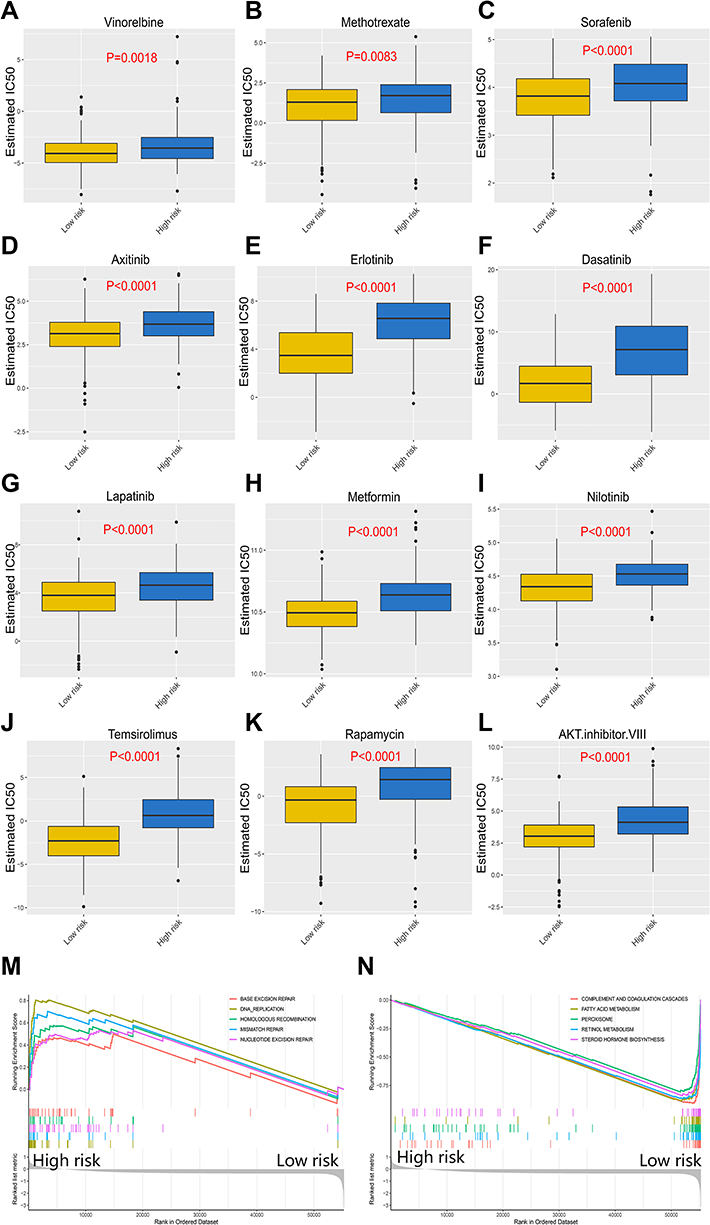 |
Figure 3 Response of high-risk patients and low-risk patients to chemotherapy. (A–L) Sensitivity of high-risk patients and low-risk patients to traditional chemotherapy drugs and molecular targeted drugs. (M) Top5 signaling pathways positively regulated by the exosome-derived prognostic signature. (N) Top5 signaling pathways negatively regulated by the exosome-derived prognostic signature. |
Characteristics of the Immune Microenvironment Between High- and Low-Risk HCC Patient Groups
The blockade of immune checkpoints or pathways is an important form of immunotherapy and a current focus of antitumor therapy research.33 The relative proportion of immune cell infiltration and corresponding prognostic risk scores of 22 immune cell types from the TCGA HCC cohort are shown in Figure 4A. Compared with that in the low-risk group, a higher proportion of memory B cells, M0 macrophages and follicular helper T cells (Figure 4B–D) and a lower proportion of NK resting cells (Figure 4E) were found in the high-risk group (P<0.05). Figure 4F shows the correlation between the prognostic model and the immune checkpoint expression levels. In the high-risk group, the expression levels of the immune checkpoints PD1, B7H3, B7H5, CTLA4 and TIM3 were significantly higher than those in the low-risk group (P<0.05) (Figure 4G–K). Immune checkpoints, including PD1 and CTLA4, play a vital role in regulating the activation of T cells and exerting immune function and have been found to be overexpressed in multiple cancers, such as HCC, leading to the inhibition of T cells and the promotion of tumor progression.33,34 Targeted suppression of these abnormally expressed checkpoints effectively improves the immune response mediated by T cells, prompting the immune system to recognize, mobilize against, and eliminate cancer cells. The above findings indicated that patients with higher risk have high immune checkpoint expression levels, and the immune response is significantly improved by immunotherapy, indicating that better clinical benefit can be achieved with immunotherapy for these patients.
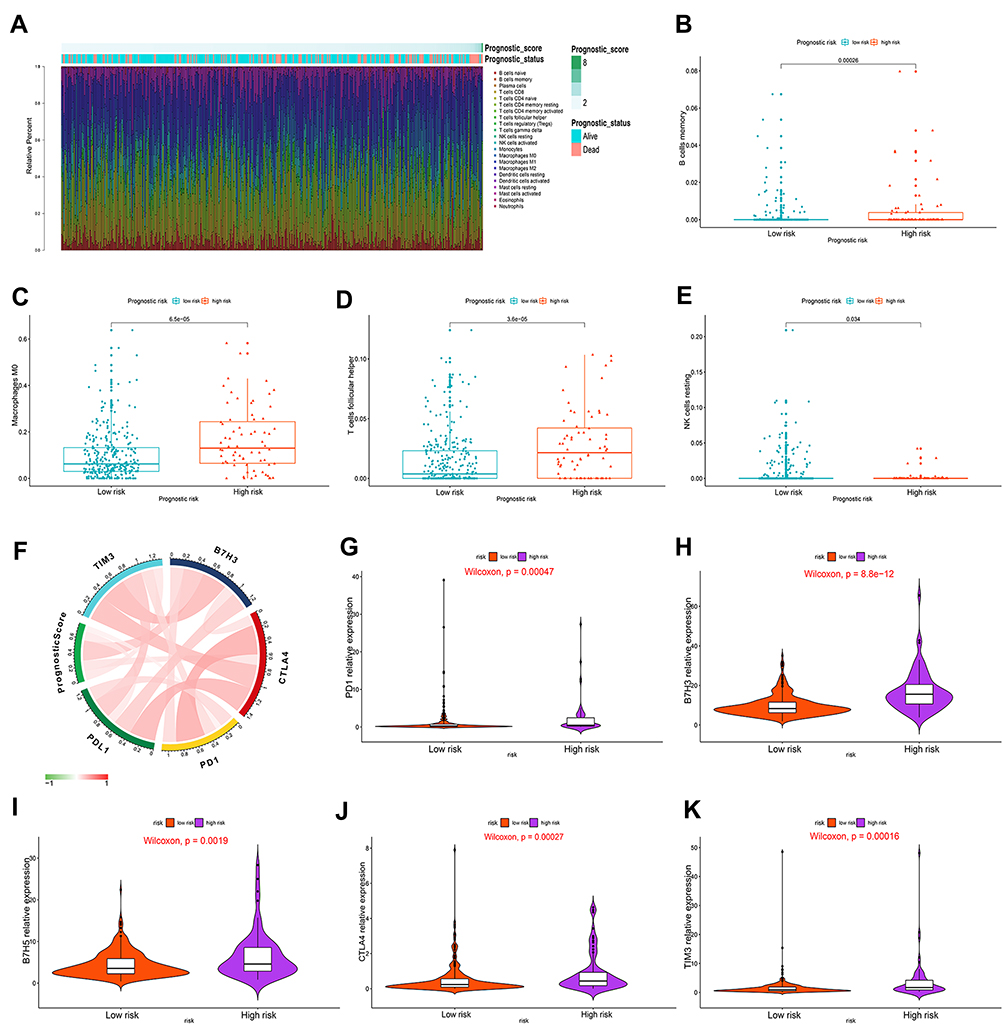 |
Figure 4 Correlation of immune cell infiltration and immune checkpoint expression with the prognostic risk in HCC patients. (A) The infiltration of immune cells in HCC patients and the corresponding prognostic risk score and survival status. (B–E) Differences in the infiltration of memory B cells (B), M0 macrophages (C), follicular helper T cells (D) and resting NK cells (E) in the high- and low-risk HCC patient groups. (P<0.05) (Wilcoxon test). (F) Interaction between prognostic risk and immune checkpoints including PDL1, PD1, CTLA4, B7H3 and TIM3. (G–K) The expression levels of PD1 (G), B7H3 (H), B7H5 (I), CTLA4 (J) and TIM3 (K) in the high-risk group were higher than those in the low-risk group. (P<0.05) (Wilcoxon test). |
Establishment and Evaluation of a Corresponding Nomogram in the TCGA HCC Cohort
Patient in the TCGA HCC cohort with available clinical information were included in univariate and multivariate Cox regression analyses to assess the independent predictive performance of the prognostic model compared to that of clinical variables. The results of Cox regression analysis determined that age (HR = 1.687, P<0.05), TNM stage (HR = 1.947, P<0.05) and the prognostic model (HR = 1.792, P<0.05) could independently predict the prognosis of HCC patients (Figure 5A). A predictive nomogram integrating these independent prognostic factors was then constructed to quantitatively predict the prognostic risk of HCC patients (Figure 5B). The calibration curves for 1, 3 and 5 years are shown in Figure 5C–E. The C index of the nomogram reached 0.63, indicating a better prediction consistency with the actual results compared to the use of the single independent prognostic factor age (0.57), TNM stage (0.53) or the prognostic model (0.59). The AUC of the ROC curves at 1, 2, 3, and 5 years further confirmed that the predictive value of the nomogram was superior to any single independent prognostic factor (Figure 5F–H). The results of the DCA suggested that, compared with the use of a single independent prognostic factor, the best clinical benefit was obtained by using the nomogram to predict the prognosis of HCC patients (Figure 5I–K). The above results determined that the nomogram is suitable for clinically predicting the prognosis of HCC patients.
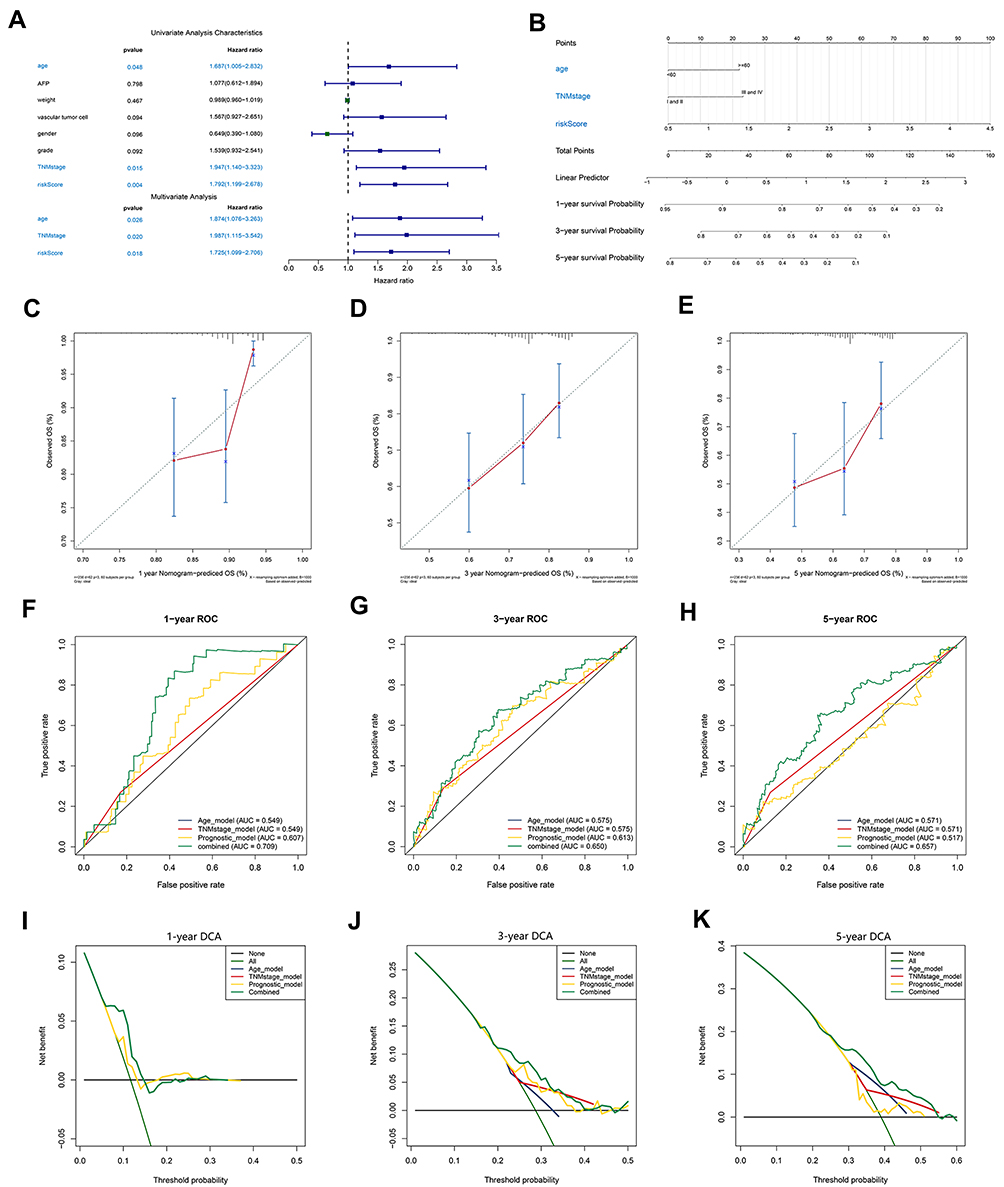 |
Figure 5 Construction and validation of a nomogram. (A) The independence of the prognostic model and clinical variables for prognosis prediction. (B) A nomogram was constructed to predict 1, 3, and 5 years of OS in HCC patients. (C–E) Calibration curves of the nomogram. (F–H) ROC curves validating the prediction specificity of the nomogram. (I–K) DCA indicated that the nomogram achieved the optimal clinical benefit. OS, overall survival. ROC curve, receiver operating characteristic curve. Abbreviations: DCA, Decision curve analysis; OS, overall survival; ROC curve, receiver operating characteristic curve. |
Construction and Validation of a Recurrence Risk Model Based on the Two Exosome-Derived Genes
A recurrence risk model integrating the same two exosome-derived genes was constructed. The relapse index was defined as RI = (0.0236 * MYL6B expression level) + (0.0899 * THOC2 expression level). Patients from the TCGA HCC cohort with recurrence information available were divided into a high-risk group and a low-risk group using the optimal cutoff value, which was determined to be 1.272 using X-tile software. The recurrence probability of patients in the high-risk group was significantly higher than that of patients in the low-risk group (HR = 2.44, P<0.001) (Figure 6A). Figure 6B shows the expression levels of the two exosome-derived genes in the patients and their predicted recurrence risk. ROC curves indicated great specificity and sensitivity of the recurrence risk model (Figure 6C). Patients from the GSE14520 HCC cohort with recurrence information available were used as a validation cohort for the predictive performance of the recurrence risk model. The optimal cutoff value was 1.403. A significantly higher probability of recurrence was found in the high-risk group than in the low-risk group (HR = 1.54, P<0.05) (Figure 6D). The expression profiles of the two exosome-derived genes in HCC patients and the prediction of recurrence risk are shown in Figure 6E. The AUCs of ROC at 0.5, 1, 3, and 5 years were 0.68, 0.64, 0.58 and 0.57, respectively (Figure 6F).
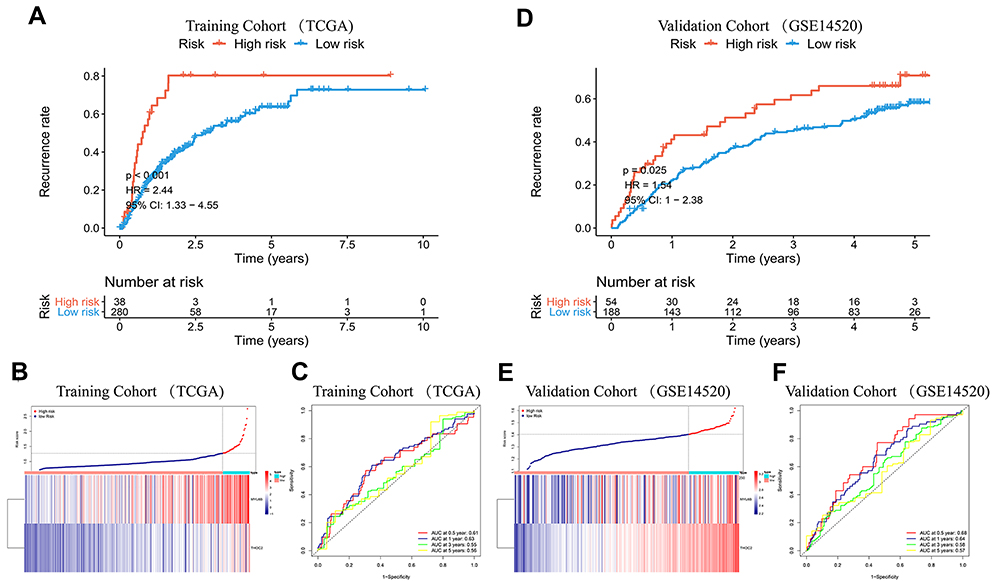 |
Figure 6 K-M curve analysis, risk score distribution and time-dependent ROC curve analysis of the recurrence model in the HCC cohorts from TCGA (A–C) and GSE14520 (D–F). (A and D) The high-risk group was more likely to experience recurrence than the low-risk group (P<0.05). (B and E) Expression of MYL6B and THOC2 and the corresponding prognostic risk scores of patients. (C and F) ROC curves validating the predictive value of the recurrence model. Abbreviation: ROC curve, Receiver operating characteristic curve. |
The characteristics of clinical variables and expression of the two exosome-derived genes in the TCGA HCC patients and the corresponding risk scores predicted by the recurrence risk model are shown in Figure S4A. Patients with pathological grade G3-G4 HCC were more likely to experience recurrence than patients with G1-G2 HCC (P<0.05) (Figure S4B). The probability of recurrence of HCC in patients with vascular tumor invasion was also significantly higher than that in HCC patients without vascular tumor invasion. (P<0.05) (Figure S4C), while Figure S4D shows that there were no significant differences in recurrence probability between patients with TNM stage III–IV and those with TNM stage I–II.
A Nomogram Integrating Independent Recurrence Factors Was Constructed and Validated
An independence analysis through Cox regression determined that age (HR = 2.253, P<0.05), TNM stage (HR = 2.433, P<0.05) and the recurrence model (HR =4.907, P<0.05) were independent predictive factors of recurrence in HCC patients (Figure 7A). Based on these independent predictors, a corresponding nomogram was generated (Figure 7B). The calibration curves at 1 year, 3 years, and 5 years indicated that the predicted results of the nomogram were consistent with the actual results (Figure 7C–E). The C index of the nomogram (0.70)> age (0.61)> recurrence model (0.60)> TNM stage (0.56) indicated that the clinical value of the nomogram to predict the recurrence probability of HCC was superior to that of a single independent predictive factor. The results of the ROC curves were also consistent with the above conclusions (Figure 7F–H). The DCA confirmed that the clinical benefit of the nomogram for recurrence prediction was better than that of any single independent predictor (Figure 7I–K).
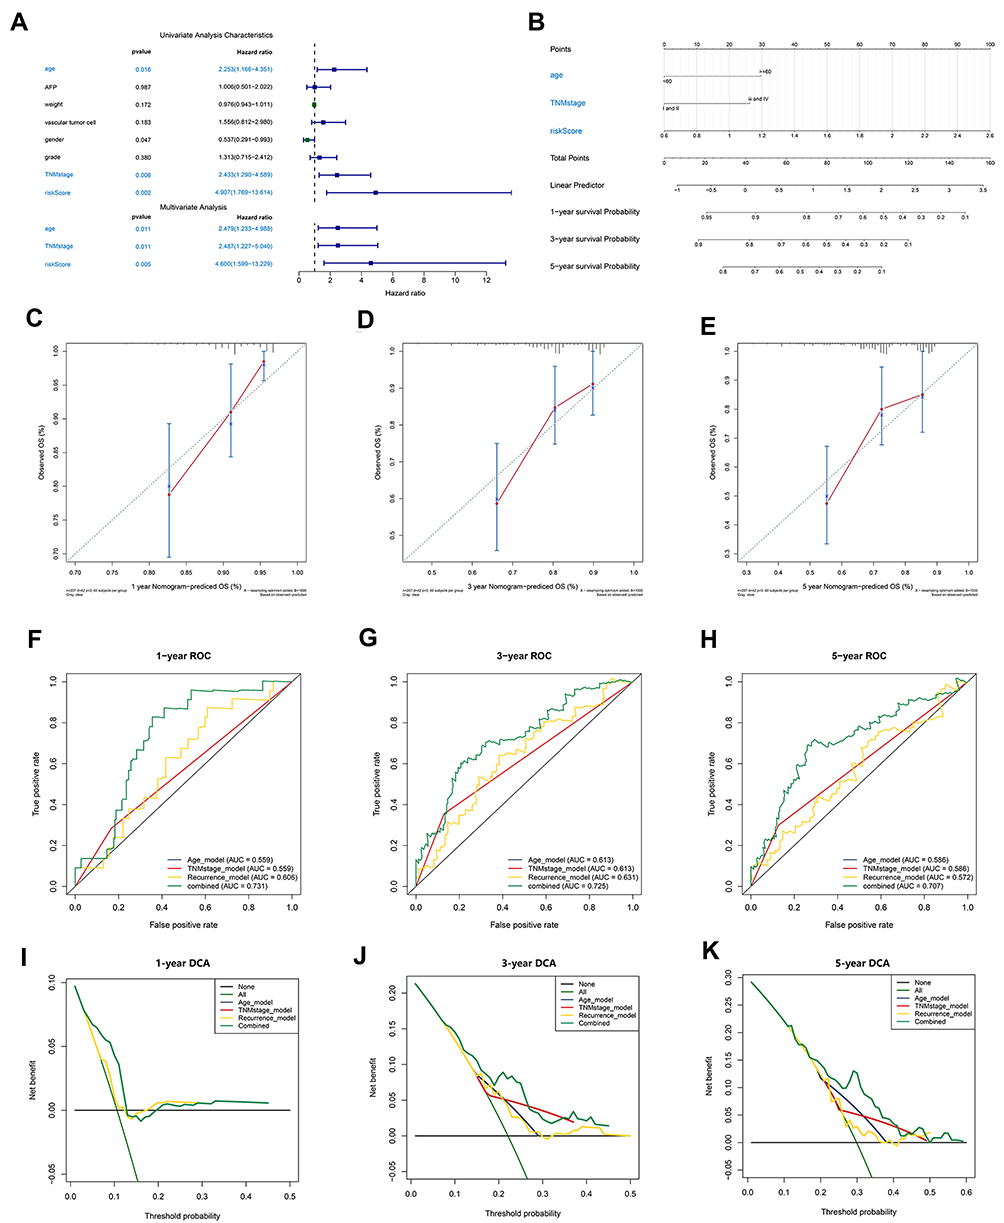 |
Figure 7 Establishment and evaluation of a nomogram. (A) Independent analysis of the recurrence model compared to clinical characteristics. (B) A nomogram was constructed to quantitatively assess the probability of recurrence. (C–E) Calibration curves of the nomogram. (F–H) ROC curves determined that the prediction performance of the nomogram was better than that of a single independent predictor. (I–K) DCA determined that the prediction of the nomogram could achieve the maximum clinical benefit. Abbreviation: DCA, Decision curve analysis. |
Diagnostic Models Were Built and Demonstrated to Have Superior Predictive Power
A diagnostic model based on the two exosome-derived genes was constructed to accurately distinguish between patients with early-stage HCC and normal individuals. The diagnostic equation determined by the stepwise logistic regression method was defined as follows: logit (P = HCC) = −23.0370 + (2.2566 × expression level of MYL6B) + (3.8247 × expression level of THOC2). Applying the diagnostic model to the paired HCC samples from the TCGA cohort (consisting of 50 normal samples and 50 HCC samples) resulted in a sensitivity of 76.00% and a specificity of 82.00% (Figure 8A). Figure 8B shows the consistency between the disease outcome predicted by the diagnostic model based on the expression levels of MYL6B and THOC2 and the actual outcome. The AUC of the diagnostic model was 0.8792, confirming the superior performance of the diagnostic model for identifying HCC (Figure 8C). The ICGC HCC cohort (consisting of 202 normal samples and 243 HCC samples) was adopted to validate the diagnostic performance. The sensitivity of the diagnostic results was 76.95%, the specificity was 85.64% (Figure 8D), and the AUC was 0.9077 (Figure 8F), indicating that the diagnostic model can accurately distinguish HCC patients from normal individuals. The consistency between the predicted results based on the expression of MYL6B and THOC2 and the actual results is shown in Figure 8E.
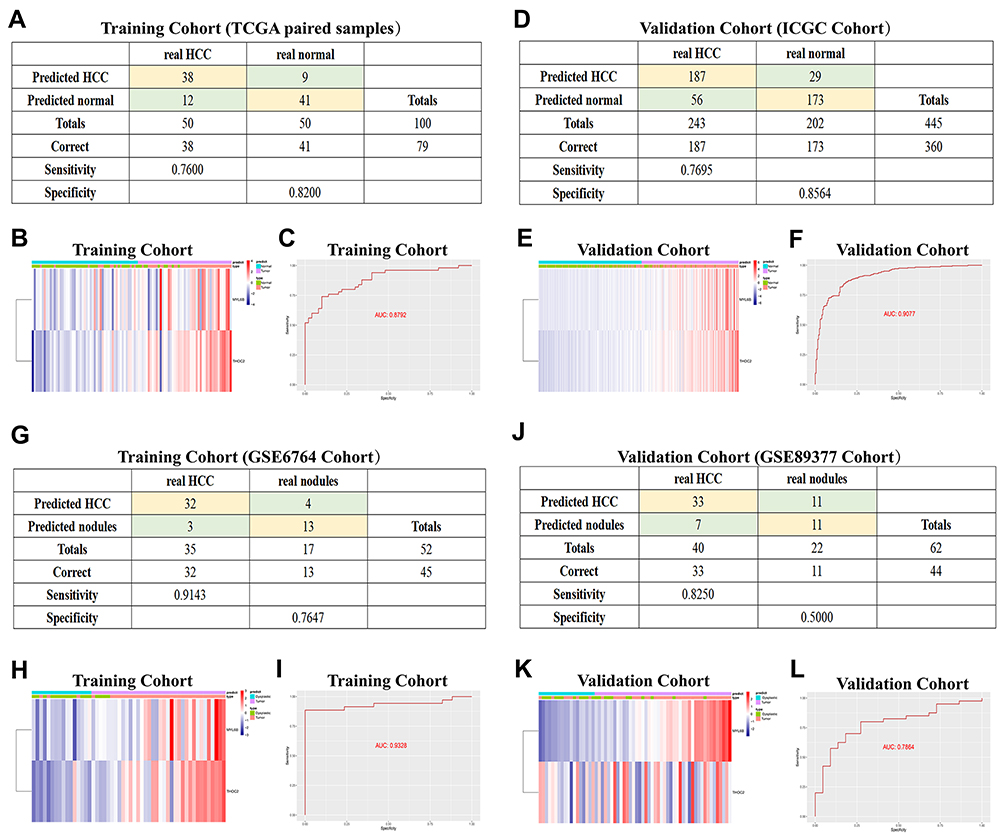 |
Figure 8 Diagnostic models constructed to distinguish HCC patients from normal individuals (A–F) and HCC from dysplastic nodules (G–L). (A and D) Confusion matrix of binary results indicated that the diagnostic model accurately distinguished HCC patients and normal individuals. (B and E) The expression profiles of MYL6B and THOC2 in HCC patients and the consistency between the predicted disease status and actual disease status (C and F) ROC curves determined the superior predictive performance of the diagnostic model. (G and J) The diagnostic model distinguished HCC and dysplastic nodules with high specificity and sensitivity. (H and K) Expression characteristics of MYL6B and THOC2 in HCC patients, distribution of the predicted disease status and actual disease status. (I and L) ROC curves validated the predictive value of the diagnostic model. Abbreviation: ROC curve, Receiver operating characteristic curve. |
The early diagnosis of HCC is mainly based on imaging and pathological examination, but small nodules <2 cm often lead to missed diagnoses because of difficulties in accurate characterization.35 We also constructed a diagnostic model based on MYL6B and THOC2 to distinguish HCC and dysplastic nodules. The diagnostic formula was determined as follows: logit (P-HCC) = −45.5786 + (2.6004 × MYL6B expression level) + (4.0578 × THOC2 expression level). We adopted patient information from the GSE6764 dataset as the training set and the GSE89377 dataset as the validation set to evaluate the predictive value of the diagnostic model. The diagnostic model in the training set reached 91.43% sensitivity and 76.47% specificity (Figure 8G), and the AUC was 0.9328 (Figure 8I). The sensitivity and specificity in the validation set were 82.50% and 50.00% (Figure 8J), respectively, and the AUC was 0.7864 (Figure 8L), indicating that the diagnostic model had good predictive performance. The gene expression profile of HCC patients and the consistency between the predicted disease state and the actual disease state are shown in Figure 8H and K.
The Expression Characteristics of Exosome-Derived Genes Were Validated to Accurately Predict the OS Outcomes of Patients with HCC
To evaluate whether MYL6B and THOC2 were suitable for constructing prognostic, recurrence risk and diagnostic models, we examined the expression profiles of these two genes. MYL6B and THOC2 were obviously more highly expressed in the TCGA HCC cohort samples than in the paired normal samples (Figure 9A and B). The expression levels of MYL6B and THOC2 in HCC patients from the GSE6764 dataset were significantly higher than those in dysplastic nodule samples (Figure 9C and D). The K-M curves indicated that patients with high gene expression had a worse prognosis than patients with low gene expression (Figure 9E and F), and ROC curve analysis confirmed the specificity of MYL6B and THOC2 for predicting patient prognosis (Figure 9G and H). We further explored the association between gene expression, patient prognosis and recurrence risk using the Kaplan-Meier Plotter database. The results confirmed that high gene expression was closely related to shorter overall survival times and progression-free survival times (Figure 9I - L). Figure 9M and N shows the correlation between the expression profiles of MYL6B and THOC2 and immune cell infiltration. In addition, the correlation of the expression of MYL6B and THOC2 and immune checkpoint genes was also explored (Figure S5A and S5F), and compared to patients with low expression of MYL6B and THOC, patients with high expression of MYL6B and THOC tended to have higher expression patterns of immune checkpoint genes, including PD-1, B7H3, CTLA4 and TIM3 (Figure S5B–E and S5G–J), indicating that patients with high expression of MYL6B and THOC are more likely to have an increased immune response and inhibition of tumor progression in response to targeted immune checkpoint immunotherapy. The above results determined the effective predictive value of the two exosome-derived genes MYL6B and THOC2.
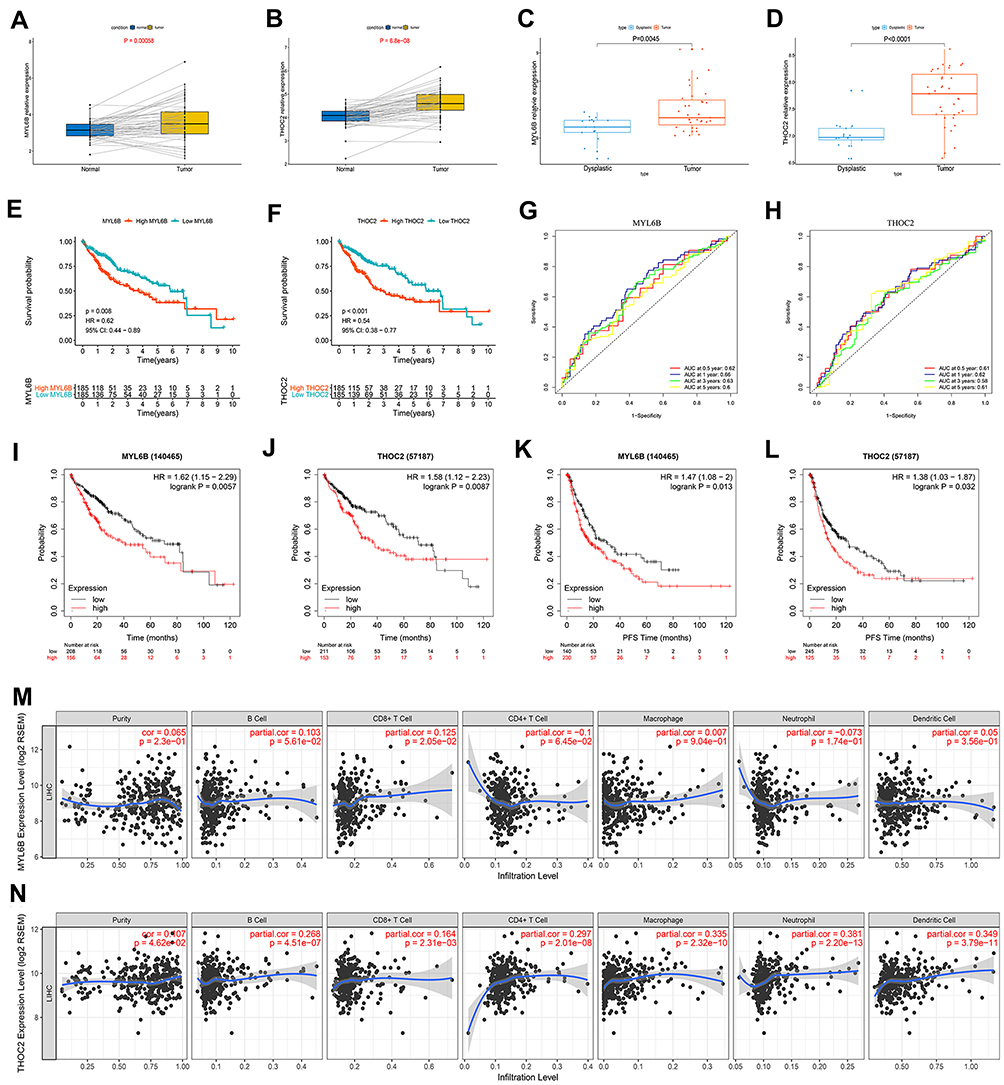 |
Figure 9 The expression characteristics of MYL6B and THOC2 and their correlation with patient prognosis, recurrence, and immune infiltration. (A, B) MYL6B (A) and THOC2 (B) expression was higher in the HCC tissues than in the paired normal tissues in TCGA. (P<0.05) (Wilcoxon test). (C, D) Higher expression of MYL6B (C) and THOC2 (D) was found in HCC tissues than in dysplastic nodules in GSE6764. (P<0.05) (Wilcoxon test). (E, F) Survival analysis of MYL6B (E) and THOC2 (F). (G, H) ROC curves validating the prognostic value of MYL6B (G) and THOC2 (H). (I–L) Shorter survival times (I and J) and progression-free survival times (K and L) were found in patients with high expression of MYL6B and THOC2 than in patients with low expression of MYL6B and THOC2 in the Kaplan-Meier Plotter database. (M, N) Correlation between the expression of MYL6B (M) and THOC2 (N) and immune infiltration. |
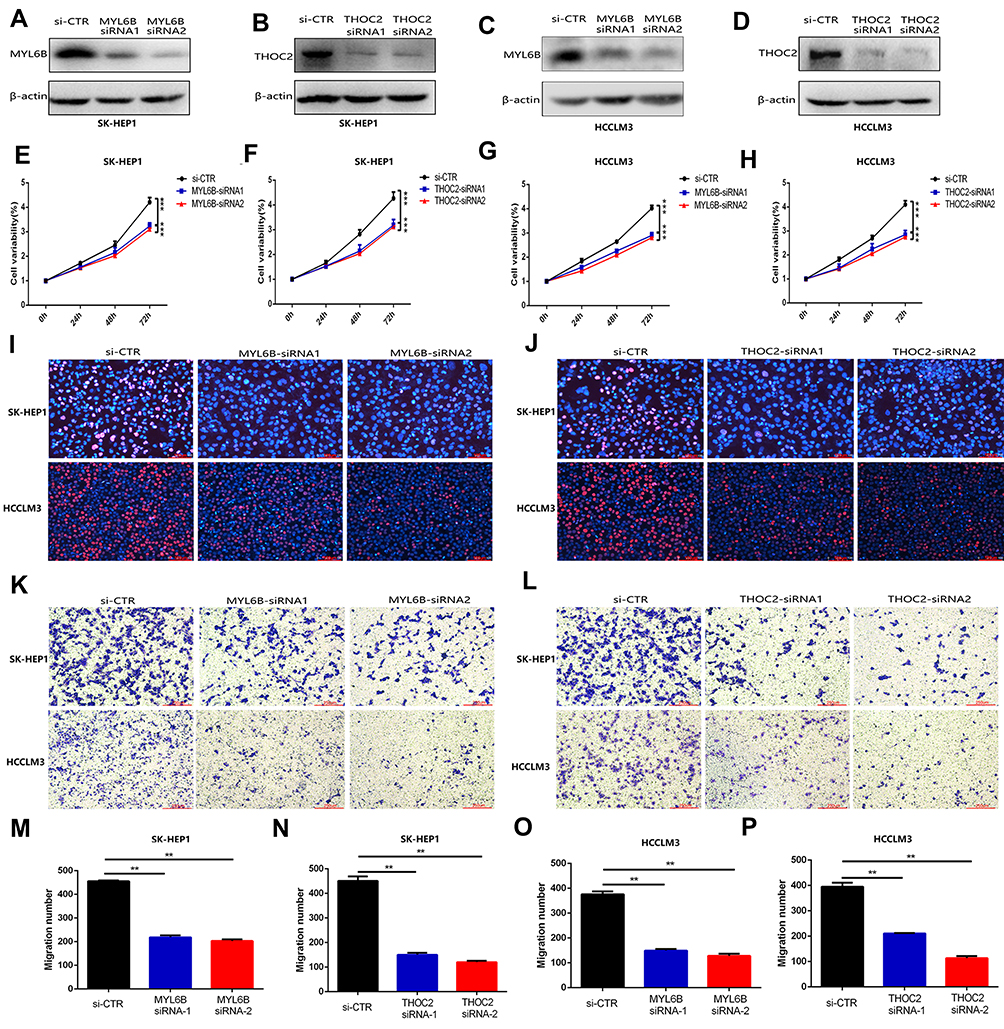 |
Figure 10 MYL6B and THOC2 suppress the proliferation and migration of HCC cells. (A–D) Western blot analysis confirmed that the expression of MYL6B and THOC2 was inhibited in the HCC cell lines with transfection of MYL6B and THOC2 siRNA. (E–H) CCK8 assay showed that MYL6B and THOC2 inhibition significantly inhibited the proliferation of HCC cell lines. ***p < 0.001(Student’s t-test). (I and J) The inhibitory effect of MYL6B and THOC2 inhibition on the proliferation of HCC cell lines was also validated in EdU assay. (K and L) The migration of SK-HEP1 cells and LM3 cells was significantly inhibited under the inhibition of MYL6B and THOC2. (M–P) Quantitative statistical results of the function of MYL6B and THOC2 inhibition on the migration of HCC cell lines. **p < 0.01(Student’s t-test). Abbreviation: si-CTR, Control treatment. |
Determination of the Oncogenic Effect of MYL6B and THOC2 in HCC Cells
To further validate the functions of MYL6B and THOC2 in HCC cell proliferation and migration, we knocked down the expression of MYL6B and THOC2 in HCC cell lines (including SK-HEP1 and HCCLM3 cells). The results of Western blotting confirmed that the application of MYL6B siRNA and THOC2 siRNA significantly inhibited the expression of MYL6B and THOC2 in HCC cells (Figure 10A–D). The CCK assay (Figure 10E–H) and EdU assay (Figure 10I and J) both revealed that MYL6B inhibition and THOC2 inhibition had a significant inhibitory effect on the proliferation of SK-HEP1 cells and HCCLM3 cells. In addition, the Transwell assay showed that MYL6B inhibition (Figure 10K) and THOC2 inhibition (Figure 10L) obviously suppressed the migration of SK-HEP1 cells and HCCLM3 cells. Figure 10M–P shows the quantitative statistical analysis of the Transwell assay data. The above findings confirm that the inhibition of MYL6B and THOC2 suppressed the proliferation and migration of HCC cells, suggesting that the expression of MYL6B and THOC2 is closely related to the progression of HCC and that MYL6B and THOC2 are valuable for predicting the prognosis of HCC.
Discussion
As one of the most common malignant tumors, HCC represents a significant health and economic burden.36 HCC involves a series of complex genetic and epigenetic alterations.37 Although a variety of staging systems have been proposed and used in clinical decision-making to predict patient prognosis, these systems are mainly based on clinicopathological characteristics without considering the key role of complex molecular pathogenic mechanisms in the carcinogenesis and progression of HCC,38,39 and patient outcomes have not been significantly improved.40 Exosomes are the main type of extracellular vesicle (EV) that can mediate the transfer of protein, DNA and various forms of RNA between cells and participate in cell-to-cell communication.41 The regulatory dysfunction of exosomes along with multiple complex molecular mechanisms promotes the development of HCC.42 The increased level of exosomes released by tumor cells enhances the communication between HCC cells and non-HCC cells. Identifying key markers derived from exosomes and performing a combination analysis may help accurately assess the progression of HCC and predict the prognosis of HCC patients and disease recurrence risk. In this study, we used high-throughput sequencing technology to explore the potential mechanisms of exosome-related DEGs. Then, based on two exosomal genes (MYL6B and THOC2), we constructed an exosomal gene signature with high predictive performance. Then, we found that the overall survival and disease-free survival times were obviously shorter in HCC patients in the high-risk group than in patients in the low-risk group. The risk score of the exosomal gene signature served as an independent prognostic predictive factor. In addition, combined with other clinical features of HCC, a nomogram was built with superior predictive value in HCC patients. These results suggested that the exosomal gene signature may represent new possibilities for developing individualized treatments for HCC patients.
MYL6B is an essential light chain for non-muscle myosin II (NMII) and is involved in cell adhesion, migration, material transport and endocytosis control.43,44 MYL6B binds to the p53 protein to accelerate p53 degradation and promote the development of HCC.45 THOC2 is involved in mediating mRNA export from the nucleus to the cytoplasm, chromosomal arrangement, mitotic process, and genome stability.46 The expression of THOC2 has been found to promote the proliferation and invasion of melanoma.47 Our subsequent cell experiments also determined that MYL6B and THOC2 inhibition significantly suppressed the proliferation and migration of HCC cells, revealing that the expression of these two genes is positively associated with the progression of HCC. Based on MYL6B and THOC2 expression, the diagnostic model constructed was also determined to be able to distinguish HCC patients from normal individuals and HCC from dysplastic nodules with high specificity and high sensitivity. Our findings lay a foundation for adopting MYL6B and THOC2 as biomarkers for the early diagnostic evaluation of HCC and indicate that the exosomal gene signature may serve as an effective method for diagnosing HCC, especially in the early stages.
Exosomes are also involved in the regulation of the tumor immune response.48 Tumor cell exosomes can promote the production of prostaglandin E2, IL-6 and TGF-β by myeloid-derived suppressor cells (MDSCs), thus forming a powerful immune suppression environment in tumor lesions.49 Exosomes are also considered to be important mediators of antitumor immune responses and immune surveillance evasion by tumor cells. Some studies have shown that HCC-derived exosomes can reduce the cytotoxicity of T cells and NK cells and promote the aggregation of immunosuppressive M2 macrophages and N2 neutrophils.50,51 Characterizing the expression of exosome markers may help predict patient response to immunotherapy and identify more effective treatments. In this study, the prognostic model and the recurrence risk model were adopted to evaluate the immune infiltration score of HCC patients with different risk scores. Higher infiltration levels of B memory cells and M0 macrophages and lower infiltration levels of NK cells were found in high prognostic risk patients, and high recurrence risk patients also presented higher infiltration fractions of B memory cells, M0 macrophages and T follicular helper cells and lower infiltration fractions of monocytes, which may influence their response to immunotherapy. Moreover, we found that patients with high prognostic risk expressed higher levels of immune checkpoint genes, such as PD1, B7H3, and CTLA4, in tumor tissues than patients with low prognostic risk. The PD1–PD1 ligand 1 (PDL1) receptor–ligand pair is a crucial immune checkpoint that regulates the tumor microenvironment. This checkpoint controls immune homeostasis by suppressing T cell activation in peripheral cells at the later phase of the cell cycle and is often overexpressed by cancer cells to avoid immune attack.52 CTLA4 mainly acts in the early phase of the immune response, participates in the initiation and activation of T cells in lymph nodes, and enhances the immunosuppressive activity of regulatory T cells (Treg cells).53 Studies have shown that anti-CTLA-4 antibodies increase the frequency of tumor-associated antigen-specific cytotoxic T cells in HCC patients and simultaneously exert significant antitumor effects.54 B7H3 is mostly expressed on immune cells (such as antigen-presenting cells or macrophages) and tumor cells and has an inhibitory effect on T cells. Its abnormal overexpression helps tumor cells achieve immune escape.34 Our results revealed that high-risk patients tend to have higher expression of immune checkpoints and may be suitable candidates for immunotherapy to improve the immune response and may obtain greater clinical benefit such therapy than low-risk patients.
Considering that chemotherapy is one of the main treatments for patients with advanced HCC and that drug resistance is one of the important factors affecting chemotherapy efficacy,55 we also evaluated the sensitivity of patients to common chemotherapy drugs and molecular targeted drugs through the prognostic model. High-risk patients showed increased resistance to chemotherapy drugs and molecular targeted drugs such as methotrexate, erlotinib and vinorelbine compared to low-risk patients, suggesting that chemotherapy efficacy may be more pronounced in low-risk patients than in high-risk patients, and low-risk patients are more suitable for chemotherapy than high-risk patients. In exploring the reasons for differences in the chemotherapy sensitivity of patients, the results of subsequent GSEA showed that the patient’s high prognostic risk is closely related to the signaling pathways involved in the regulation of chemoresistance, such as “DNA replication”,30 “homologous recombination”,56 and “mismatch repair”,57 which may partly explain the difference in chemoresistance among patients with different prognostic risk.
Inevitably, our research does have some limitations. The difference of cutoff values determined by X-tile between the training set and validation set in the prognosis model may be a limitation that relatively limited the clinical practicability of the prognostic model. In subsequent studies we planned to collect enough clinical samples to further validate the predictive value of this predictive model. The mRNA sequences and corresponding clinical information in this study were mainly obtained from the TCGA and ICGC databases, and the clinical feasibility of the prognostic model in predicting the chemotherapy response and immunotherapy response needs to be prospectively tested in subsequent clinical trials. We will also further explore the role of MYL6B and THOC2 in the progression of HCC in the future.
Conclusion
Prognostic and recurrence models based on two exosome-derived genes (MYL6B and THOC2) were determined to have predictive performance with high specificity and high sensitivity, to generate risk scores that are closely related to traditional clinical variables, and to help identify candidates who are suitable for immunotherapy and chemotherapy. Patients with different risk scores had significant differences in immune infiltration levels, and patients with higher risk scores were more likely to respond to immune checkpoint inhibitor therapy. In addition, low-risk patients may obtain greater clinical benefit from chemotherapy. The diagnostic model constructed with the same two genes could accurately distinguish HCC patients from normal individuals and HCC from hyperplastic nodules. The integration and comprehensive analysis of exosome-derived genes and genomic data of HCC patients provides the possibility to improve the early detection rate of HCC patients and improve their outcomes and provides novel insights into the development of individualized treatment strategies.
Abbreviations
HCC, Hepatocellular carcinoma; WGCNA, Weighted Gene Co-Expression Network Analysis; HBV, Hepatitis B; HCV, Hepatitis C; DEG, Differentially expressed gene; K-M curve, Kaplan-Meier curve; ROC curve, Receiver operating characteristic curve; HR, Hazard ratio; CI, Confidence interval; DCA, Decision curve analysis; GDSC, Genomics of Drug Sensitivity in Cancer; IC50, The half-maximum inhibitory concentration; GSEA, Gene Set Enrichment Analysis; MDSCs, Myeloid-derived suppressor cells.
Data Sharing Statement
The data and materials used to support the findings of this study are available from the corresponding author upon request.
Ethics Approval
This article does not contain any studies with human or animal subjects.
Consent for Publication
Each author approved the manuscript before submission for publication.
Acknowledgments
The authors of the present work are truly grateful to the TCGA, ICGC and GEO databases for the availability of the data. And the manuscript was submitted as a preprint in the below link: https://www.researchsquare.com/article/rs-33520/v1.
Author Contributions
Jiansong Ji and Chenying Lu conceived and designed the experiments. Jinyu Zhu and Bufu Tang performed the experiments. Suqin Xu, Yang Gao, Jianfei Tu, Yajie Wang, Weibin Yang and Shiji Fang analyzed the data. Qiaoyou Weng, Zhongwei Zhao, Min Xu, Yang Yang and Minjiang Chen contributed analysis tools. Jinyu Zhu and Bufu Tang wrote the paper. Jiansong Ji and Chenying Lu edited the paper. All authors made substantial contributions to conception and design, acquisition of data, or analysis and interpretation of data; took part in drafting the article or revising it critically for important intellectual content; agreed to submit to the current journal; gave final approval of the version to be published; and agree to be accountable for all aspects of the work.
Funding
This study was supported by National Natural Science Foundation of China (Nos. 81803778), and The Key Research and development Project of Zhejiang Province (No. 2018C03024), and The Public Welfare Research Program of Zhejiang Province (Nos. LQ20H160056 and LGD19h160002), The Natural Science Foundation of Zhejiang Province (No. LYQ20H280003). The Science and Technology Project of Jinhua City (No. 2019-4-143).
Disclosure
The authors declare that the research was conducted in the absence of any commercial or financial relationships that could be construed as a potential conflict of interest.
References
1. Bray F, Ferlay J, Soerjomataram I, Siegel RL, Torre LA, Jemal A. Global cancer statistics 2018: GLOBOCAN estimates of incidence and mortality worldwide for 36 cancers in 185 countries. CA Cancer J Clin. 2018;68(6):394–424.
2. European Association for the Study of the Liver. EASL-EORTC clinical practice guidelines: management of hepatocellular carcinoma. J Hepatol. 2012;56(4):908–943.
3. Bruix J, Reig M, Sherman M. Evidence-based diagnosis, staging, and treatment of patients with Hepatocellular carcinoma. Gastroenterology. 2016;150(4):835–853.
4. Wang H, Lu Z, Zhao X. Tumorigenesis, diagnosis, and therapeutic potential of exosomes in liver cancer. J Hematol Oncol. 2019;12(1):133.
5. Chen F. Molecular signature of hepatocellular carcinoma, hope or hype in prognosis and therapy. Semin Cancer Biol. 2011;21(1):1–3.
6. Dawkins J, Webster RM. The hepatocellular carcinoma market, Nature reviews. Drug Discovery. 2019;18(1):13–14.
7. Breuhahn K, Gores G, Schirmacher P. Strategies for hepatocellular carcinoma therapy and diagnostics: lessons learned from high throughput and profiling approaches. Hepatology. 2011;53(6):2112–2121.
8. Milane L, Singh A, Mattheolabakis G, Suresh M, Amiji MM. Exosome mediated communication within the tumor microenvironment. J Control Release. 2015;219:278–294.
9. Morishita M, Takahashi Y, Nishikawa M, Takakura Y. Pharmacokinetics of exosomes-an important factor for elucidating the biological roles of exosomes and for the development of exosome-based therapeutics. J Pharm Sci. 2017;106(9):2265–2269.
10. De Toro J, Herschlik L, Waldner C, Mongini C. Emerging roles of exosomes in normal and pathological conditions: new insights for diagnosis and therapeutic applications. Front Immunol. 2015;6:203.
11. Tkach M, Théry C. Communication by extracellular vesicles: where we are and where we need to go. Cell. 2016;164(6):1226–1232.
12. Becker A, Thakur BK, Weiss JM, Kim HS, Peinado H, Lyden D. Extracellular vesicles in cancer: cell-to-cell mediators of metastasis. Cancer Cell. 2016;30(6):836–848.
13. Wu Q, Zhou L, Lv D, Zhu X, Tang H. Exosome-mediated communication in the tumor microenvironment contributes to hepatocellular carcinoma development and progression. J Hematol Oncol. 2019;12(1):53.
14. Wang F, Li L, Piontek K, Sakaguchi M, Selaru FM. Exosome miR-335 as a novel therapeutic strategy in hepatocellular carcinoma. Hepatology (Baltimore, Md). 2018;67(3):940–954.
15. Li R, Wang Y, Zhang X, et al. Exosome-mediated secretion of LOXL4 promotes hepatocellular carcinoma cell invasion and metastasis. Mol Cancer. 2019;18(1):18.
16. Yang YM, Kim SY, Seki E. Inflammation and liver cancer: molecular mechanisms and therapeutic targets. Semin Liver Dis. 2019;39(1):26–42.
17. Tang B, Zhu J, Li J, et al. The ferroptosis and iron-metabolism signature robustly predicts clinical diagnosis, prognosis and immune microenvironment for hepatocellular carcinoma. Cell Commun Signaling. 2020;18(1):174.
18. Ringelhan M, Pfister D, O’Connor T, Pikarsky E, Heikenwalder M. The immunology of hepatocellular carcinoma. Nat Immunol. 2018;19(3):222–232.
19. Zhang HH, Mei MH, Fei R, et al. Regulatory T cells in chronic hepatitis B patients affect the immunopathogenesis of hepatocellular carcinoma by suppressing the anti-tumour immune responses. J Viral Hepat. 2010;17(Suppl 1):34–43.
20. Peng G, Li S, Wu W, Tan X, Chen Y, Chen Z. PD-1 upregulation is associated with HBV-specific T cell dysfunction in chronic hepatitis B patients. Mol Immunol. 2008;45(4):963–970.
21. Nakamoto N, Cho H, Shaked A, et al. Synergistic reversal of intrahepatic HCV-specific CD8 T cell exhaustion by combined PD-1/CTLA-4 blockade. PLoS Pathog. 2009;5(2):e1000313.
22. Ye L, Zhang Q, Cheng Y, et al. Tumor-derived exosomal HMGB1 fosters hepatocellular carcinoma immune evasion by promoting TIM-1(+) regulatory B cell expansion. J Immunother Cancer. 2018;6(1):145.
23. Han Q, Zhao H, Jiang Y, Yin C, Zhang J. HCC-derived exosomes: critical player and target for cancer immune escape. Cells. 2019;8:6.
24. Schulze K, Nault JC, Villanueva A. Genetic profiling of hepatocellular carcinoma using next-generation sequencing. J Hepatol. 2016;65(5):1031–1042.
25. Langfelder P, Horvath S. WGCNA: an R package for weighted correlation network analysis. BMC Bioinform. 2008;9:559.
26. Van Calster B, Wynants L, Verbeek JFM, et al. Reporting and interpreting decision curve analysis: a guide for investigators. Eur Urol. 2018;74(6):796–804.
27. Menyhárt O, Nagy Á, Győrffy B. Determining consistent prognostic biomarkers of overall survival and vascular invasion in hepatocellular carcinoma. R Soc Open Sci. 2018;5(12):181006.
28. Gentles AJ, Newman AM, Liu CL, et al. The prognostic landscape of genes and infiltrating immune cells across human cancers. Nat Med. 2015;21(8):938–945.
29. Zheng Z, Liang W, Wang D, et al. Adjuvant chemotherapy for patients with primary hepatocellular carcinoma: a meta-analysis. Int J Cancer. 2015;136(6):E751–9.
30. Wang Y, Chen H, Zhang J, et al. MCM family in gastrointestinal cancer and other malignancies: from functional characterization to clinical implication. Biochimica Et Biophysica Acta. 2020;1874(2):188415.
31. Zhou Q, Huang J, Zhang C, et al. The bromodomain containing protein BRD-9 orchestrates RAD51-RAD54 complex formation and regulates homologous recombination-mediated repair. Nat Commun. 2020;11(1):2639.
32. Higuchi F, Nagashima H, Ning J, Koerner MVA, Wakimoto H, Cahill DP. Restoration of temozolomide sensitivity by PARP inhibitors in mismatch repair deficient glioblastoma is independent of base excision repair. Clin Cancer Res. 2020;26(7):1690–1699.
33. Xu F, Jin T, Zhu Y, Dai C. Immune checkpoint therapy in liver cancer. J Exp Clin Cancer Res. 2018;37(1):110.
34. Dong P, Xiong Y, Yue J, Hanley SJB, Watari H. B7H3 as a promoter of metastasis and promising therapeutic target. Front Oncol. 2018;8:264.
35. Parisi G. Should a radiological diagnosis of hepatocellular carcinoma be routinely confirmed by a biopsy?. Eur J Intern Med. 2012;23(1):34–36.
36. Bruix J, Boix L, Sala M, Llovet JM. Focus on hepatocellular carcinoma. Cancer Cell. 2004;5(3):215–219.
37. Li X, Xu W, Kang W, et al. Genomic analysis of liver cancer unveils novel driver genes and distinct prognostic features. Theranostics. 2018;8(6):1740–1751.
38. Liu PH, Hsu CY, Hsia CY, et al. Prognosis of hepatocellular carcinoma: assessment of eleven staging systems. J Hepatol. 2016;64(3):601–608.
39. Yan X, Qiu Y. Impact of current staging systems on treatment strategy for HBV-related hepatocellular carcinoma. Cancer Lett. 2016;379(2):220–224.
40. Kanwal F, Singal AG. Surveillance for Hepatocellular carcinoma: current best practice and future direction. Gastroenterology. 2019;157(1):54–64.
41. Sasaki R, Kanda T, Yokosuka O, Kato N, Matsuoka S, Moriyama M. Exosomes and Hepatocellular carcinoma: from bench to bedside. Int J Mol Sci. 2019;20:6.
42. Liu H, Li B. The functional role of exosome in hepatocellular carcinoma. J Cancer Res Clin Oncol. 2018;144(11):2085–2095.
43. Maliga Z, Junqueira M, Toyoda Y, et al. A genomic toolkit to investigate kinesin and myosin motor function in cells. Nat Cell Biol. 2013;15(3):325–334.
44. Hartman MA, Finan D, Sivaramakrishnan S, Spudich JA. Principles of unconventional myosin function and targeting. Annu Rev Cell Dev Biol. 2011;27:133–155.
45. Xie X, Wang X, Liao W, et al. MYL6B, a myosin light chain, promotes MDM2-mediated p53 degradation and drives HCC development. J Exp Clin Cancer Res. 2018;37(1):28.
46. Kumar R, Gardner A, Homan CC, et al. Severe neurocognitive and growth disorders due to variation in THOC2, an essential component of nuclear mRNA export machinery. Hum Mutat. 2018;39(8):1126–1138.
47. Zhou X, Liu X, Zhang G, et al. Knockdown THOC2 suppresses the proliferation and invasion of melanoma. Bioengineered. 2019;10(1):635–645.
48. Seo N, Akiyoshi K, Shiku H. Exosome-mediated regulation of tumor immunology. Cancer Sci. 2018;109(10):2998–3004.
49. Chalmin F, Ladoire S, Mignot G, et al. Membrane-associated Hsp72 from tumor-derived exosomes mediates STAT3-dependent immunosuppressive function of mouse and human myeloid-derived suppressor cells. J Clin Invest. 2010;120(2):457–471.
50. Ruivo CF, Adem B, Silva M, Melo SA. The biology of cancer exosomes: insights and new perspectives. Cancer Res. 2017;77(23):6480–6488.
51. Whiteside TL. Exosomes and tumor-mediated immune suppression. J Clin Invest. 2016;126(4):1216–1223.
52. Pardoll DM. The blockade of immune checkpoints in cancer immunotherapy. Nat Rev Cancer. 2012;12(4):252–264.
53. Topalian SL, Taube JM, Anders RA, Pardoll DM. Mechanism-driven biomarkers to guide immune checkpoint blockade in cancer therapy. Nat Rev Cancer. 2016;16(5):275–287.
54. Mizukoshi E, Nakamoto Y, Arai K, et al. Comparative analysis of various tumor-associated antigen-specific t-cell responses in patients with hepatocellular carcinoma. Hepatology (Baltimore, Md). 2011;53(4):1206–1216.
55. Ikeda M, Morizane C, Ueno M, Okusaka T, Ishii H, Furuse J. Chemotherapy for hepatocellular carcinoma: current status and future perspectives. Jpn J Clin Oncol. 2018;48(2):103–114.
56. Berti M, Teloni F, Mijic S, et al. Sequential role of RAD51 paralog complexes in replication fork remodeling and restart. Nat Commun. 2020;11(1):3531.
57. Natsume A, Hirano M, Ranjit M, Aoki K, Wakabayashi T. Aberrant transcriptional regulation of super-enhancers by RET finger protein-histone deacetylase 1 complex in glioblastoma: chemoresistance to temozolomide. Neurol Med Chir (Tokyo). 2019;59(8):293–298.
 © 2021 The Author(s). This work is published and licensed by Dove Medical Press Limited. The full terms of this license are available at https://www.dovepress.com/terms.php and incorporate the Creative Commons Attribution - Non Commercial (unported, v3.0) License.
By accessing the work you hereby accept the Terms. Non-commercial uses of the work are permitted without any further permission from Dove Medical Press Limited, provided the work is properly attributed. For permission for commercial use of this work, please see paragraphs 4.2 and 5 of our Terms.
© 2021 The Author(s). This work is published and licensed by Dove Medical Press Limited. The full terms of this license are available at https://www.dovepress.com/terms.php and incorporate the Creative Commons Attribution - Non Commercial (unported, v3.0) License.
By accessing the work you hereby accept the Terms. Non-commercial uses of the work are permitted without any further permission from Dove Medical Press Limited, provided the work is properly attributed. For permission for commercial use of this work, please see paragraphs 4.2 and 5 of our Terms.